Helen, GA Map & Demographics
Helen Map
Helen Overview
$44,324
PER CAPITA INCOME
$96,944
AVG FAMILY INCOME
$74,375
AVG HOUSEHOLD INCOME
4.2%
WAGE / INCOME GAP [ % ]
95.8¢/ $1
WAGE / INCOME GAP [ $ ]
0.46
INEQUALITY / GINI INDEX
505
TOTAL POPULATION
308
MALE POPULATION
197
FEMALE POPULATION
156.35
MALES / 100 FEMALES
63.96
FEMALES / 100 MALES
60.2
MEDIAN AGE
2.7
AVG FAMILY SIZE
2.1
AVG HOUSEHOLD SIZE
234
LABOR FORCE [ PEOPLE ]
49.3%
PERCENT IN LABOR FORCE
2.1%
UNEMPLOYMENT RATE
Helen Zip Codes
Helen Area Codes
Income in Helen
Income Overview in Helen
Per Capita Income in Helen is $44,324, while median incomes of families and households are $96,944 and $74,375 respectively.
| Characteristic | Number | Measure |
| Per Capita Income | 505 | $44,324 |
| Median Family Income | 146 | $96,944 |
| Mean Family Income | 146 | $119,943 |
| Median Household Income | 241 | $74,375 |
| Mean Household Income | 241 | $90,807 |
| Income Deficit | 146 | $0 |
| Wage / Income Gap (%) | 505 | 4.20% |
| Wage / Income Gap ($) | 505 | 95.80¢ per $1 |
| Gini / Inequality Index | 505 | 0.46 |
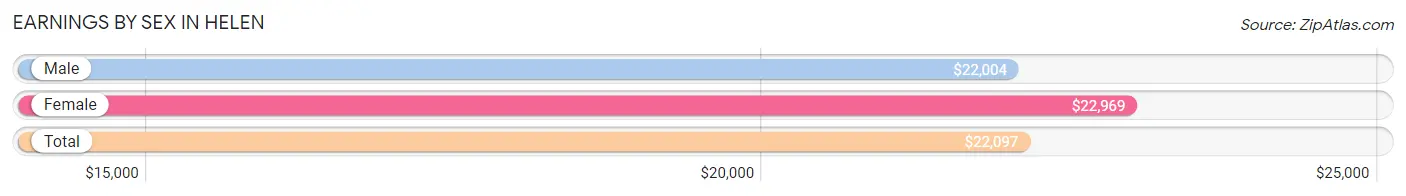
Earnings by Sex in Helen
Average Earnings in Helen are $22,097, $22,004 for men and $22,969 for women, a difference of 4.2%.
| Sex | Number | Average Earnings |
| Male | 197 (75.2%) | $22,004 |
| Female | 65 (24.8%) | $22,969 |
| Total | 262 (100.0%) | $22,097 |
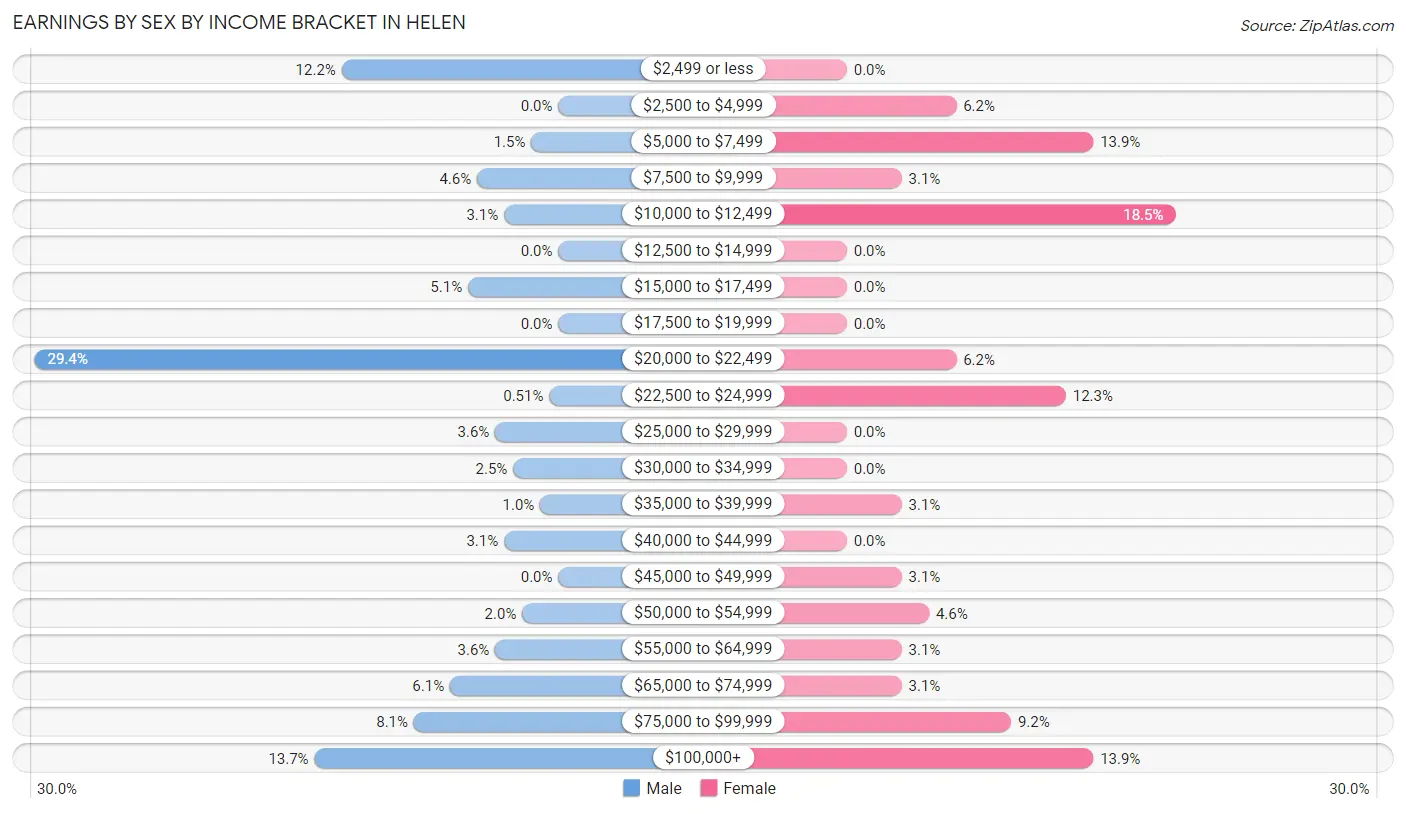
Earnings by Sex by Income Bracket in Helen
The most common earnings brackets in Helen are $20,000 to $22,499 for men (58 | 29.4%) and $10,000 to $12,499 for women (12 | 18.5%).
| Income | Male | Female |
| $2,499 or less | 24 (12.2%) | 0 (0.0%) |
| $2,500 to $4,999 | 0 (0.0%) | 4 (6.1%) |
| $5,000 to $7,499 | 3 (1.5%) | 9 (13.9%) |
| $7,500 to $9,999 | 9 (4.6%) | 2 (3.1%) |
| $10,000 to $12,499 | 6 (3.0%) | 12 (18.5%) |
| $12,500 to $14,999 | 0 (0.0%) | 0 (0.0%) |
| $15,000 to $17,499 | 10 (5.1%) | 0 (0.0%) |
| $17,500 to $19,999 | 0 (0.0%) | 0 (0.0%) |
| $20,000 to $22,499 | 58 (29.4%) | 4 (6.1%) |
| $22,500 to $24,999 | 1 (0.5%) | 8 (12.3%) |
| $25,000 to $29,999 | 7 (3.5%) | 0 (0.0%) |
| $30,000 to $34,999 | 5 (2.5%) | 0 (0.0%) |
| $35,000 to $39,999 | 2 (1.0%) | 2 (3.1%) |
| $40,000 to $44,999 | 6 (3.0%) | 0 (0.0%) |
| $45,000 to $49,999 | 0 (0.0%) | 2 (3.1%) |
| $50,000 to $54,999 | 4 (2.0%) | 3 (4.6%) |
| $55,000 to $64,999 | 7 (3.5%) | 2 (3.1%) |
| $65,000 to $74,999 | 12 (6.1%) | 2 (3.1%) |
| $75,000 to $99,999 | 16 (8.1%) | 6 (9.2%) |
| $100,000+ | 27 (13.7%) | 9 (13.9%) |
| Total | 197 (100.0%) | 65 (100.0%) |
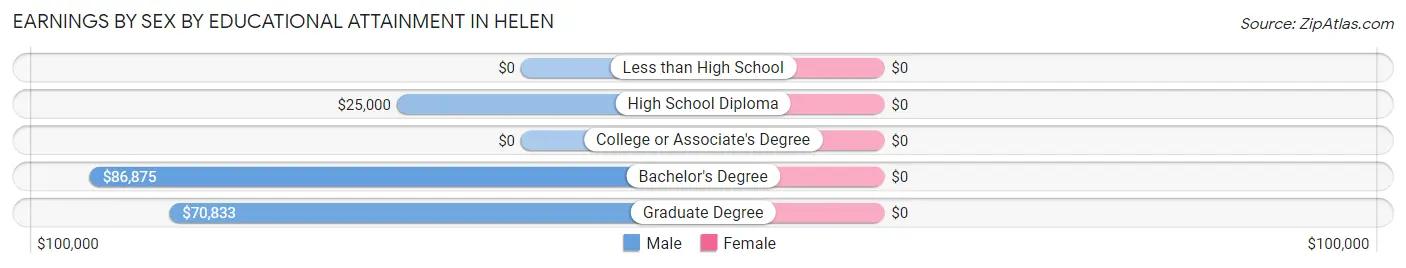
Earnings by Sex by Educational Attainment in Helen
| Educational Attainment | Male Income | Female Income |
| Less than High School | - | - |
| High School Diploma | $25,000 | $0 |
| College or Associate's Degree | - | - |
| Bachelor's Degree | $86,875 | $0 |
| Graduate Degree | $70,833 | $0 |
| Total | $35,000 | $0 |
Family Income in Helen
Family Income Brackets in Helen
According to the Helen family income data, there are 42 families falling into the $100,000 to $149,999 income range, which is the most common income bracket and makes up 28.8% of all families.
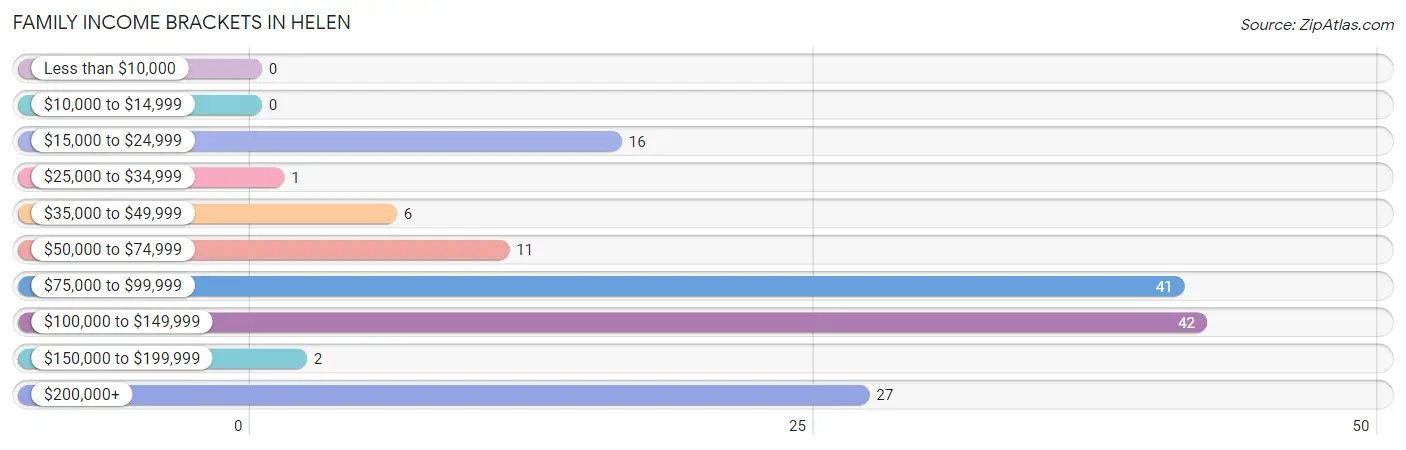
| Income Bracket | # Families | % Families |
| Less than $10,000 | 0 | 0.0% |
| $10,000 to $14,999 | 0 | 0.0% |
| $15,000 to $24,999 | 16 | 11.0% |
| $25,000 to $34,999 | 1 | 0.7% |
| $35,000 to $49,999 | 6 | 4.1% |
| $50,000 to $74,999 | 11 | 7.5% |
| $75,000 to $99,999 | 41 | 28.1% |
| $100,000 to $149,999 | 42 | 28.8% |
| $150,000 to $199,999 | 2 | 1.4% |
| $200,000+ | 27 | 18.5% |
Family Income by Famaliy Size in Helen
3-person families (28 | 19.2%) account for the highest median family income in Helen with $96,389 per family, while 2-person families (98 | 67.1%) have the highest median income of $43,750 per family member.
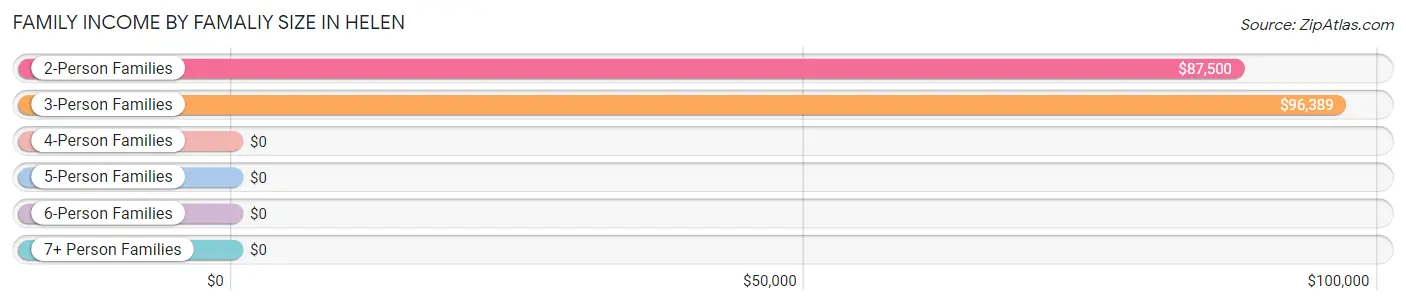
| Income Bracket | # Families | Median Income |
| 2-Person Families | 98 (67.1%) | $87,500 |
| 3-Person Families | 28 (19.2%) | $96,389 |
| 4-Person Families | 17 (11.6%) | $0 |
| 5-Person Families | 3 (2.1%) | $0 |
| 6-Person Families | 0 (0.0%) | $0 |
| 7+ Person Families | 0 (0.0%) | $0 |
| Total | 146 (100.0%) | $96,944 |
Family Income by Number of Earners in Helen
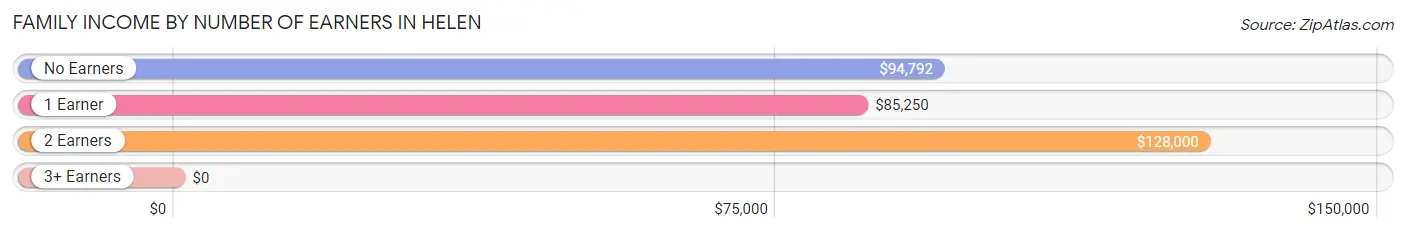
| Number of Earners | # Families | Median Income |
| No Earners | 39 (26.7%) | $94,792 |
| 1 Earner | 32 (21.9%) | $85,250 |
| 2 Earners | 70 (47.9%) | $128,000 |
| 3+ Earners | 5 (3.4%) | $0 |
| Total | 146 (100.0%) | $96,944 |
Household Income in Helen
Household Income Brackets in Helen
With 45 households falling in the category, the $75,000 to $99,999 income range is the most frequent in Helen, accounting for 18.7% of all households. In contrast, only 2 households (0.8%) fall into the $150,000 to $199,999 income bracket, making it the least populous group.
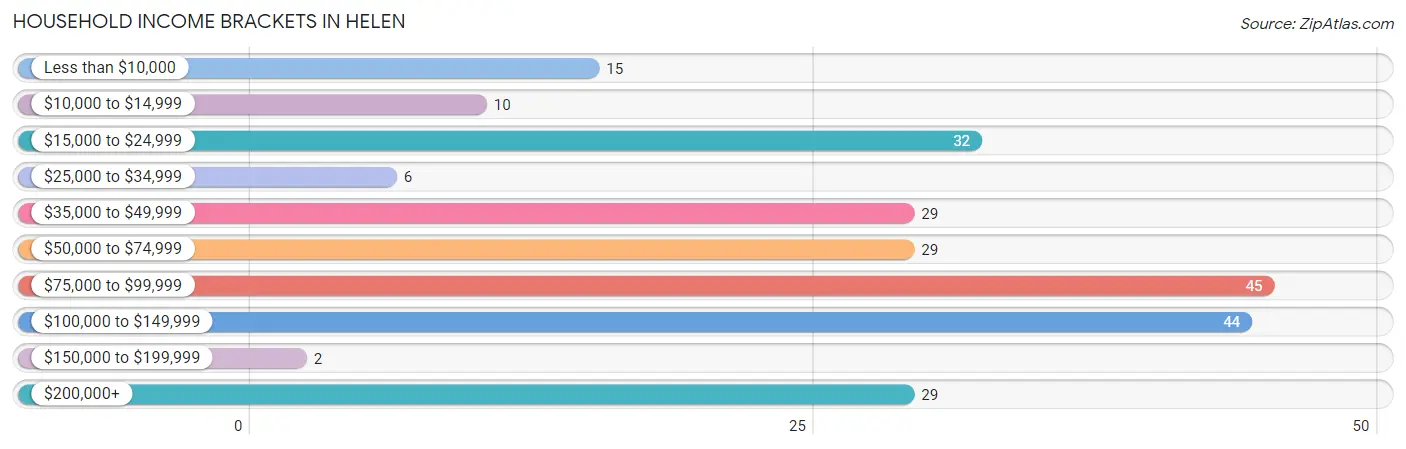
| Income Bracket | # Households | % Households |
| Less than $10,000 | 15 | 6.2% |
| $10,000 to $14,999 | 10 | 4.1% |
| $15,000 to $24,999 | 32 | 13.3% |
| $25,000 to $34,999 | 6 | 2.5% |
| $35,000 to $49,999 | 29 | 12.0% |
| $50,000 to $74,999 | 29 | 12.0% |
| $75,000 to $99,999 | 45 | 18.7% |
| $100,000 to $149,999 | 44 | 18.3% |
| $150,000 to $199,999 | 2 | 0.8% |
| $200,000+ | 29 | 12.0% |
Household Income by Householder Age in Helen
The median household income in Helen is $74,375, with the highest median household income of $81,250 found in the 45 to 64 years age bracket for the primary householder. A total of 80 households (33.2%) fall into this category. Meanwhile, the 15 to 24 years age bracket for the primary householder has the lowest median household income of $0, with 15 households (6.2%) in this group.
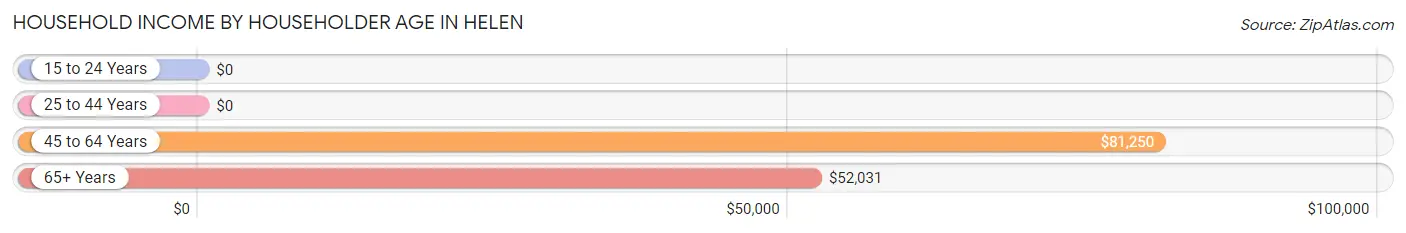
| Income Bracket | # Households | Median Income |
| 15 to 24 Years | 15 (6.2%) | $0 |
| 25 to 44 Years | 17 (7.0%) | $0 |
| 45 to 64 Years | 80 (33.2%) | $81,250 |
| 65+ Years | 129 (53.5%) | $52,031 |
| Total | 241 (100.0%) | $74,375 |
Poverty in Helen
Income Below Poverty by Sex and Age in Helen
With 11.7% poverty level for males and 13.7% for females among the residents of Helen, 6 to 11 year old males and 25 to 34 year old females are the most vulnerable to poverty, with 10 males (100.0%) and 9 females (50.0%) in their respective age groups living below the poverty level.
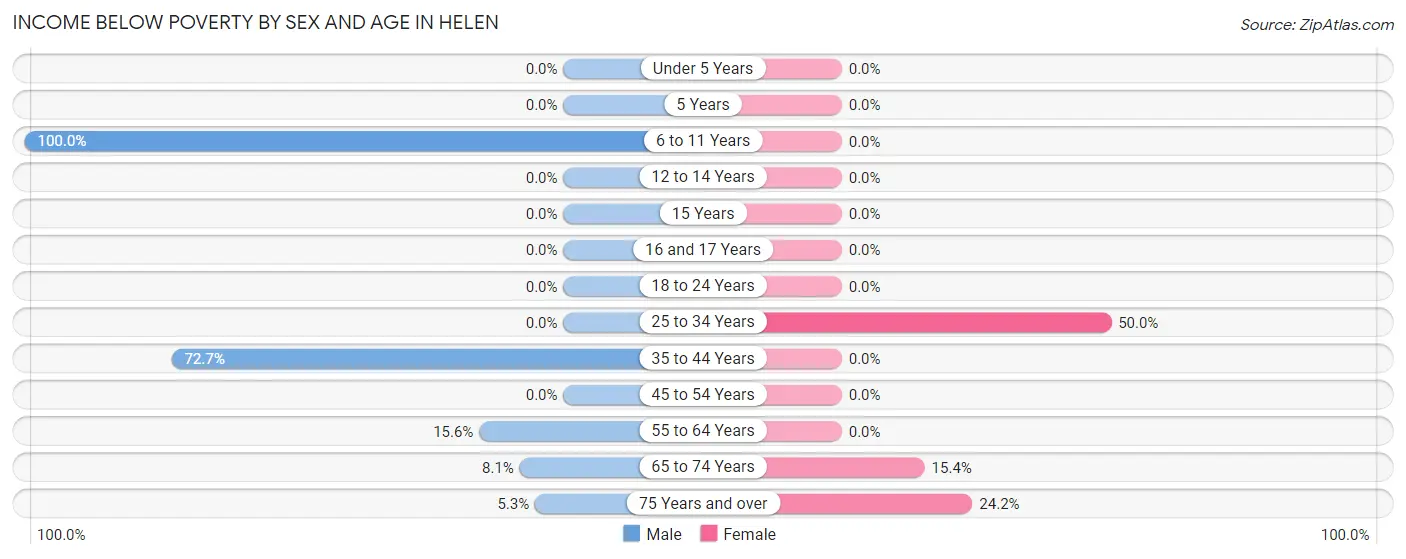
| Age Bracket | Male | Female |
| Under 5 Years | 0 (0.0%) | 0 (0.0%) |
| 5 Years | 0 (0.0%) | 0 (0.0%) |
| 6 to 11 Years | 10 (100.0%) | 0 (0.0%) |
| 12 to 14 Years | 0 (0.0%) | 0 (0.0%) |
| 15 Years | 0 (0.0%) | 0 (0.0%) |
| 16 and 17 Years | 0 (0.0%) | 0 (0.0%) |
| 18 to 24 Years | 0 (0.0%) | 0 (0.0%) |
| 25 to 34 Years | 0 (0.0%) | 9 (50.0%) |
| 35 to 44 Years | 8 (72.7%) | 0 (0.0%) |
| 45 to 54 Years | 0 (0.0%) | 0 (0.0%) |
| 55 to 64 Years | 10 (15.6%) | 0 (0.0%) |
| 65 to 74 Years | 6 (8.1%) | 10 (15.4%) |
| 75 Years and over | 2 (5.3%) | 8 (24.2%) |
| Total | 36 (11.7%) | 27 (13.7%) |
Income Above Poverty by Sex and Age in Helen
According to the poverty statistics in Helen, males aged 18 to 24 years and females aged under 5 years are the age groups that are most secure financially, with 100.0% of males and 100.0% of females in these age groups living above the poverty line.

| Age Bracket | Male | Female |
| Under 5 Years | 0 (0.0%) | 20 (100.0%) |
| 5 Years | 0 (0.0%) | 0 (0.0%) |
| 6 to 11 Years | 0 (0.0%) | 0 (0.0%) |
| 12 to 14 Years | 0 (0.0%) | 0 (0.0%) |
| 15 Years | 0 (0.0%) | 0 (0.0%) |
| 16 and 17 Years | 0 (0.0%) | 2 (100.0%) |
| 18 to 24 Years | 79 (100.0%) | 7 (100.0%) |
| 25 to 34 Years | 12 (100.0%) | 9 (50.0%) |
| 35 to 44 Years | 3 (27.3%) | 4 (100.0%) |
| 45 to 54 Years | 20 (100.0%) | 11 (100.0%) |
| 55 to 64 Years | 54 (84.4%) | 37 (100.0%) |
| 65 to 74 Years | 68 (91.9%) | 55 (84.6%) |
| 75 Years and over | 36 (94.7%) | 25 (75.8%) |
| Total | 272 (88.3%) | 170 (86.3%) |
Income Below Poverty Among Married-Couple Families in Helen
The poverty statistics for married-couple families in Helen show that 7.4% or 10 of the total 135 families live below the poverty line. Families with 1 or 2 children have the highest poverty rate of 33.3%, comprising of 8 families. On the other hand, families with no children have the lowest poverty rate of 1.8%, which includes 2 families.
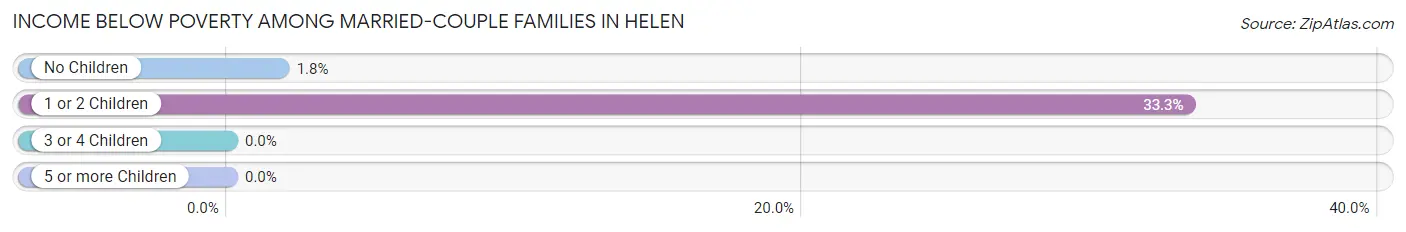
| Children | Above Poverty | Below Poverty |
| No Children | 109 (98.2%) | 2 (1.8%) |
| 1 or 2 Children | 16 (66.7%) | 8 (33.3%) |
| 3 or 4 Children | 0 (0.0%) | 0 (0.0%) |
| 5 or more Children | 0 (0.0%) | 0 (0.0%) |
| Total | 125 (92.6%) | 10 (7.4%) |
Income Below Poverty Among Single-Parent Households in Helen
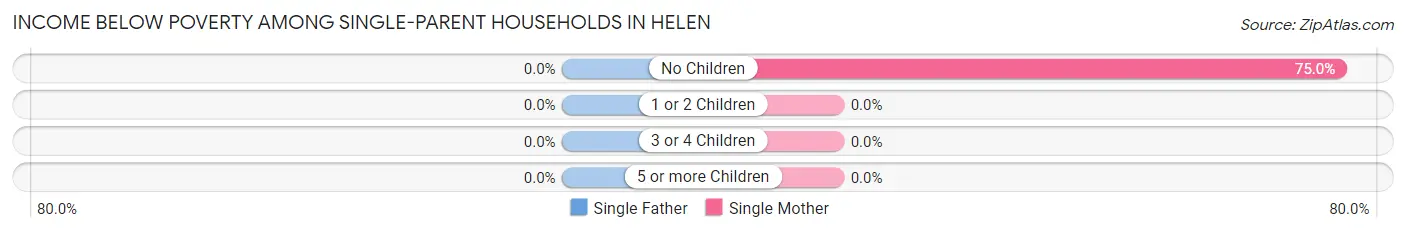
| Children | Single Father | Single Mother |
| No Children | 0 (0.0%) | 6 (75.0%) |
| 1 or 2 Children | 0 (0.0%) | 0 (0.0%) |
| 3 or 4 Children | 0 (0.0%) | 0 (0.0%) |
| 5 or more Children | 0 (0.0%) | 0 (0.0%) |
| Total | 0 (0.0%) | 6 (60.0%) |
Income Below Poverty Among Married-Couple vs Single-Parent Households in Helen
The poverty data for Helen shows that 10 of the married-couple family households (7.4%) and 6 of the single-parent households (54.5%) are living below the poverty level. Within the married-couple family households, those with 1 or 2 children have the highest poverty rate, with 8 households (33.3%) falling below the poverty line. Among the single-parent households, those with no children have the highest poverty rate, with 6 household (75.0%) living below poverty.
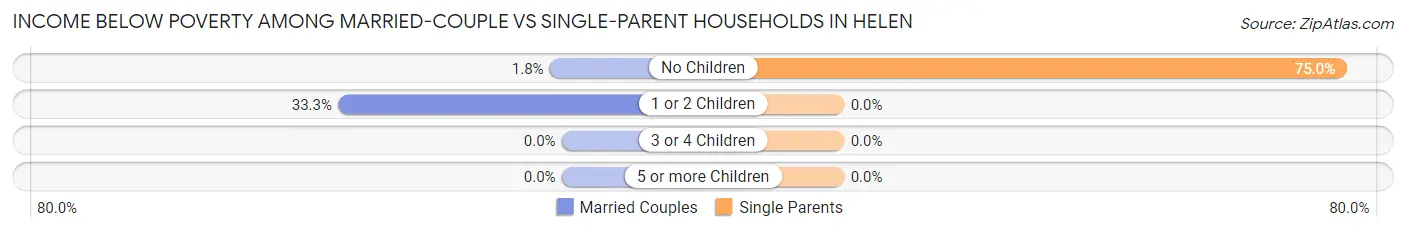
| Children | Married-Couple Families | Single-Parent Households |
| No Children | 2 (1.8%) | 6 (75.0%) |
| 1 or 2 Children | 8 (33.3%) | 0 (0.0%) |
| 3 or 4 Children | 0 (0.0%) | 0 (0.0%) |
| 5 or more Children | 0 (0.0%) | 0 (0.0%) |
| Total | 10 (7.4%) | 6 (54.5%) |
Race in Helen
The most populous races in Helen are White / Caucasian (453 | 89.7%), Asian (40 | 7.9%), and Two or more Races (12 | 2.4%).
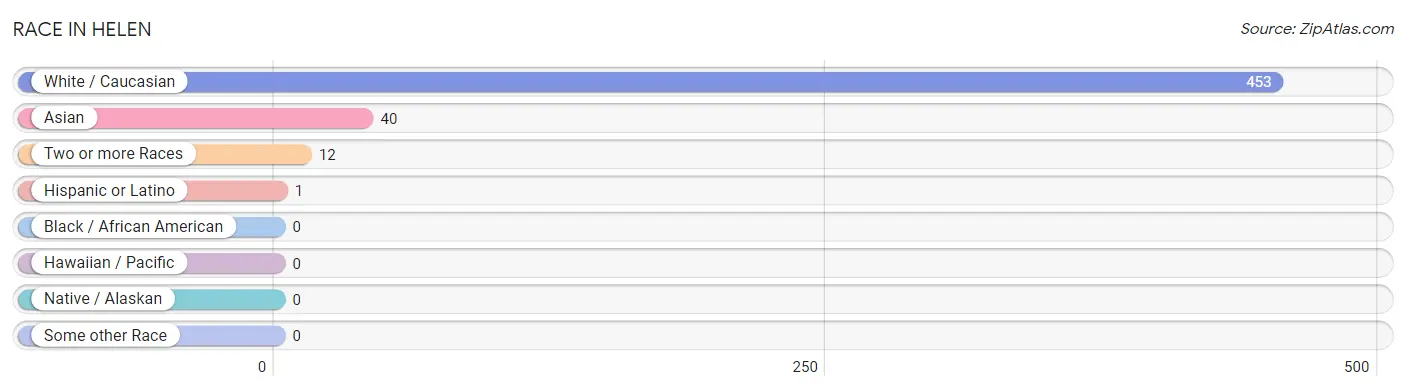
| Race | # Population | % Population |
| Asian | 40 | 7.9% |
| Black / African American | 0 | 0.0% |
| Hawaiian / Pacific | 0 | 0.0% |
| Hispanic or Latino | 1 | 0.2% |
| Native / Alaskan | 0 | 0.0% |
| White / Caucasian | 453 | 89.7% |
| Two or more Races | 12 | 2.4% |
| Some other Race | 0 | 0.0% |
| Total | 505 | 100.0% |
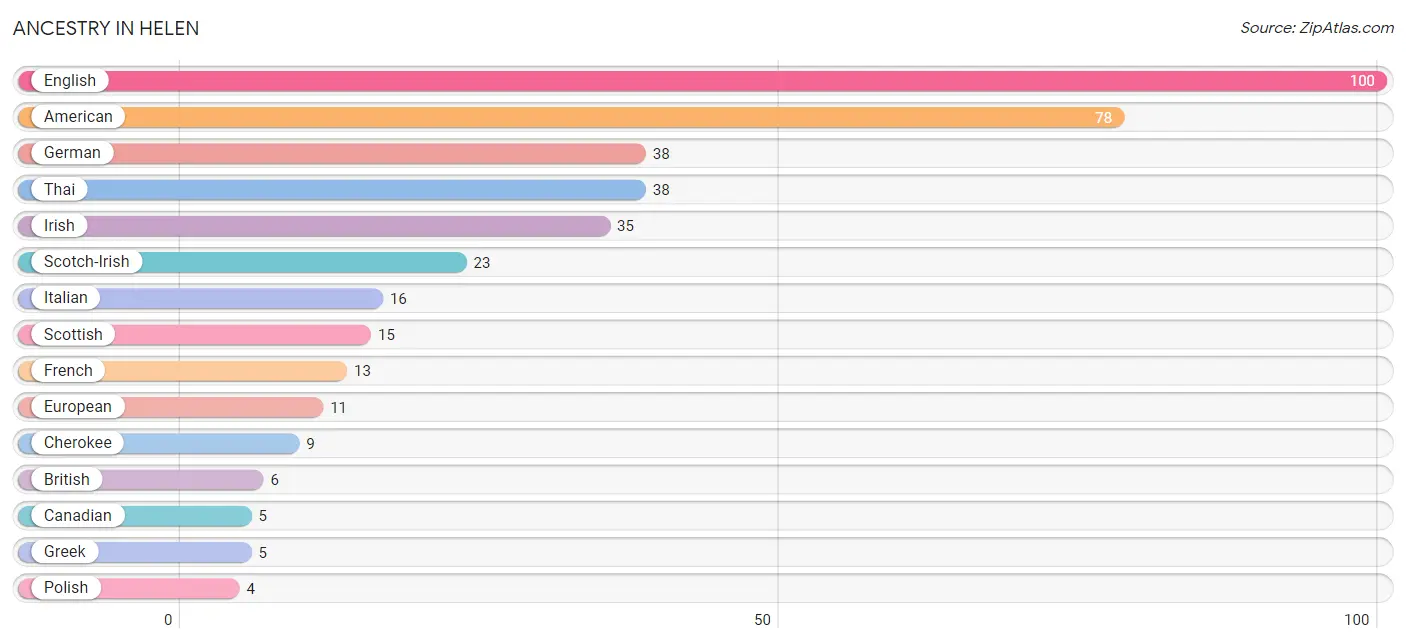
Ancestry in Helen
The most populous ancestries reported in Helen are English (100 | 19.8%), American (78 | 15.4%), German (38 | 7.5%), Thai (38 | 7.5%), and Irish (35 | 6.9%), together accounting for 57.2% of all Helen residents.
| Ancestry | # Population | % Population |
| American | 78 | 15.4% |
| Arab | 1 | 0.2% |
| British | 6 | 1.2% |
| Canadian | 5 | 1.0% |
| Cherokee | 9 | 1.8% |
| Chickasaw | 2 | 0.4% |
| Choctaw | 2 | 0.4% |
| Danish | 2 | 0.4% |
| Dutch | 2 | 0.4% |
| English | 100 | 19.8% |
| European | 11 | 2.2% |
| French | 13 | 2.6% |
| German | 38 | 7.5% |
| Greek | 5 | 1.0% |
| Irish | 35 | 6.9% |
| Italian | 16 | 3.2% |
| Korean | 2 | 0.4% |
| Lebanese | 1 | 0.2% |
| Northern European | 1 | 0.2% |
| Polish | 4 | 0.8% |
| Scotch-Irish | 23 | 4.5% |
| Scottish | 15 | 3.0% |
| Spanish | 1 | 0.2% |
| Swedish | 2 | 0.4% |
| Thai | 38 | 7.5% | View All 25 Rows |
Immigrants in Helen
The most numerous immigrant groups reported in Helen came from Asia (27 | 5.3%), South Central Asia (25 | 5.0%), Pakistan (17 | 3.4%), India (8 | 1.6%), and Philippines (2 | 0.4%), together accounting for 15.7% of all Helen residents.
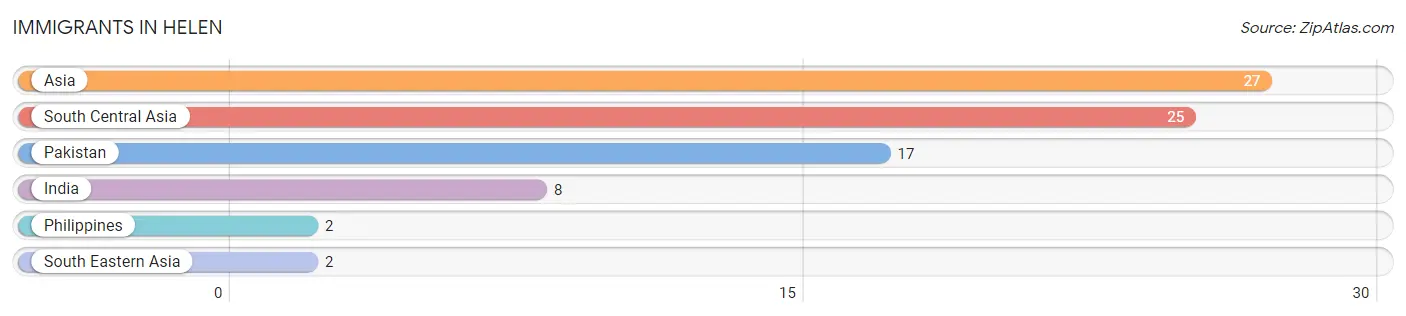
| Immigration Origin | # Population | % Population |
| Asia | 27 | 5.3% |
| India | 8 | 1.6% |
| Pakistan | 17 | 3.4% |
| Philippines | 2 | 0.4% |
| South Central Asia | 25 | 5.0% |
| South Eastern Asia | 2 | 0.4% | View All 6 Rows |
Sex and Age in Helen
Sex and Age in Helen
The most populous age groups in Helen are 20 to 24 Years (79 | 25.7%) for men and 65 to 69 Years (46 | 23.4%) for women.
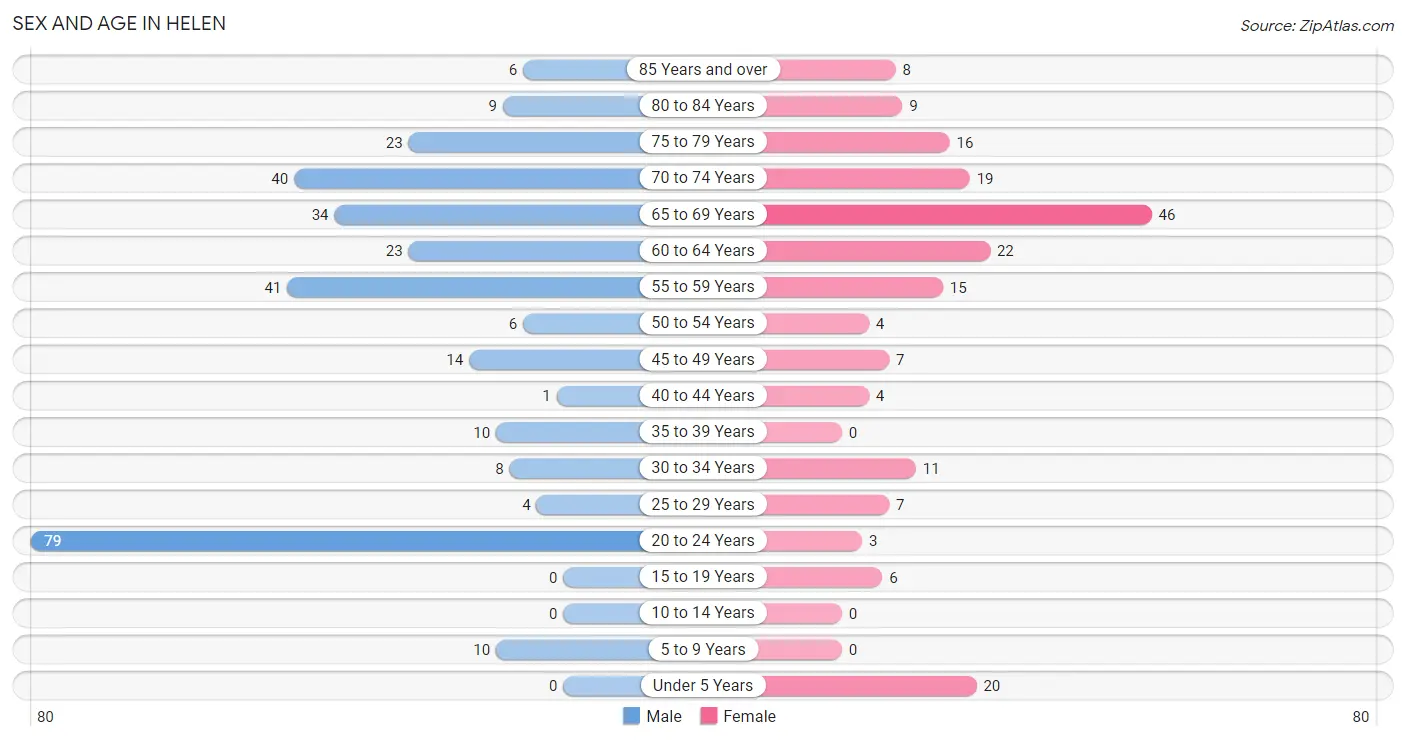
| Age Bracket | Male | Female |
| Under 5 Years | 0 (0.0%) | 20 (10.2%) |
| 5 to 9 Years | 10 (3.3%) | 0 (0.0%) |
| 10 to 14 Years | 0 (0.0%) | 0 (0.0%) |
| 15 to 19 Years | 0 (0.0%) | 6 (3.0%) |
| 20 to 24 Years | 79 (25.7%) | 3 (1.5%) |
| 25 to 29 Years | 4 (1.3%) | 7 (3.5%) |
| 30 to 34 Years | 8 (2.6%) | 11 (5.6%) |
| 35 to 39 Years | 10 (3.3%) | 0 (0.0%) |
| 40 to 44 Years | 1 (0.3%) | 4 (2.0%) |
| 45 to 49 Years | 14 (4.5%) | 7 (3.5%) |
| 50 to 54 Years | 6 (1.9%) | 4 (2.0%) |
| 55 to 59 Years | 41 (13.3%) | 15 (7.6%) |
| 60 to 64 Years | 23 (7.5%) | 22 (11.2%) |
| 65 to 69 Years | 34 (11.0%) | 46 (23.4%) |
| 70 to 74 Years | 40 (13.0%) | 19 (9.6%) |
| 75 to 79 Years | 23 (7.5%) | 16 (8.1%) |
| 80 to 84 Years | 9 (2.9%) | 9 (4.6%) |
| 85 Years and over | 6 (1.9%) | 8 (4.1%) |
| Total | 308 (100.0%) | 197 (100.0%) |
Families and Households in Helen
Median Family Size in Helen
The median family size in Helen is 2.70 persons per family, with married-couple families (135 | 92.5%) accounting for the largest median family size of 2.74 persons per family. On the other hand, single male/father families (1 | 0.7%) represent the smallest median family size with 2.00 persons per family.
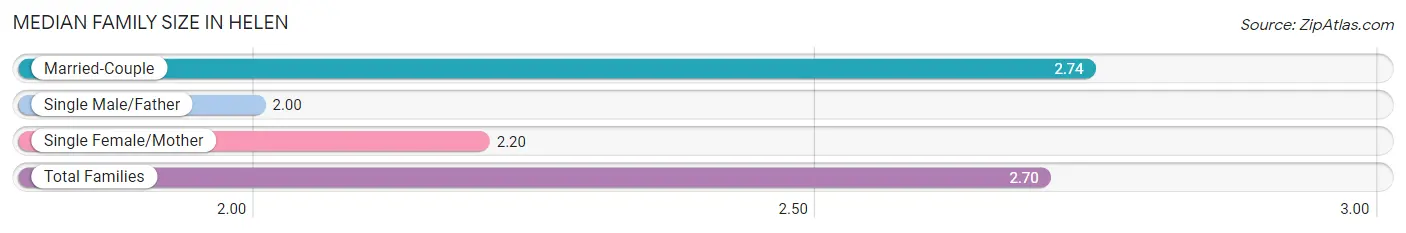
| Family Type | # Families | Family Size |
| Married-Couple | 135 (92.5%) | 2.74 |
| Single Male/Father | 1 (0.7%) | 2.00 |
| Single Female/Mother | 10 (6.9%) | 2.20 |
| Total Families | 146 (100.0%) | 2.70 |
Median Household Size in Helen
The median household size in Helen is 2.10 persons per household, with married-couple households (135 | 56.0%) accounting for the largest median household size of 2.74 persons per household. non-family households (95 | 39.4%) represent the smallest median household size with 1.16 persons per household.
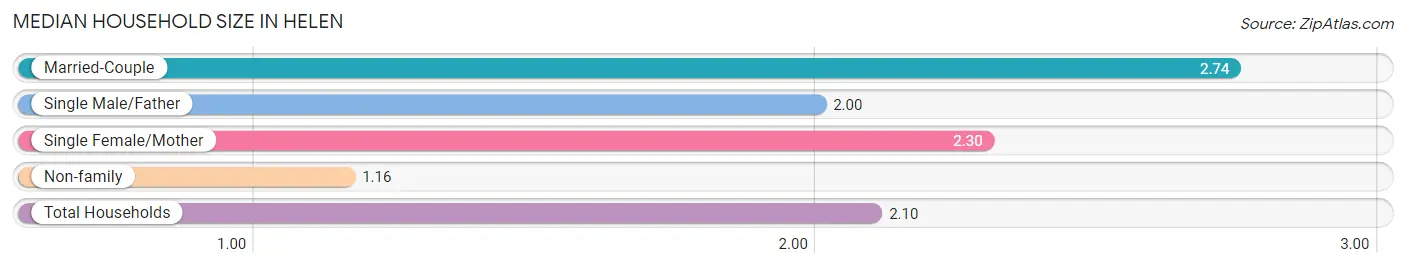
| Household Type | # Households | Household Size |
| Married-Couple | 135 (56.0%) | 2.74 |
| Single Male/Father | 1 (0.4%) | 2.00 |
| Single Female/Mother | 10 (4.2%) | 2.30 |
| Non-family | 95 (39.4%) | 1.16 |
| Total Households | 241 (100.0%) | 2.10 |
Household Size by Marriage Status in Helen
Out of a total of 241 households in Helen, 146 (60.6%) are family households, while 95 (39.4%) are nonfamily households. The most numerous type of family households are 2-person households, comprising 96, and the most common type of nonfamily households are 1-person households, comprising 85.
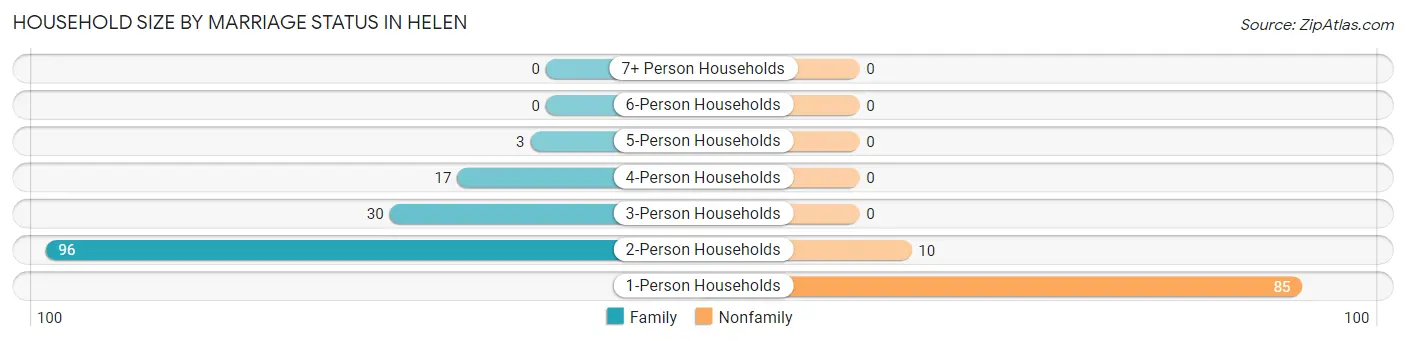
| Household Size | Family Households | Nonfamily Households |
| 1-Person Households | - | 85 (35.3%) |
| 2-Person Households | 96 (39.8%) | 10 (4.2%) |
| 3-Person Households | 30 (12.4%) | 0 (0.0%) |
| 4-Person Households | 17 (7.0%) | 0 (0.0%) |
| 5-Person Households | 3 (1.2%) | 0 (0.0%) |
| 6-Person Households | 0 (0.0%) | 0 (0.0%) |
| 7+ Person Households | 0 (0.0%) | 0 (0.0%) |
| Total | 146 (60.6%) | 95 (39.4%) |
Female Fertility in Helen
Fertility by Age in Helen
Average fertility rate in Helen is 53.0 births per 1,000 women. Women in the age bracket of 35 to 50 years have the highest fertility rate with 182.0 births per 1,000 women. Women in the age bracket of 35 to 50 years acount for 100.0% of all women with births.
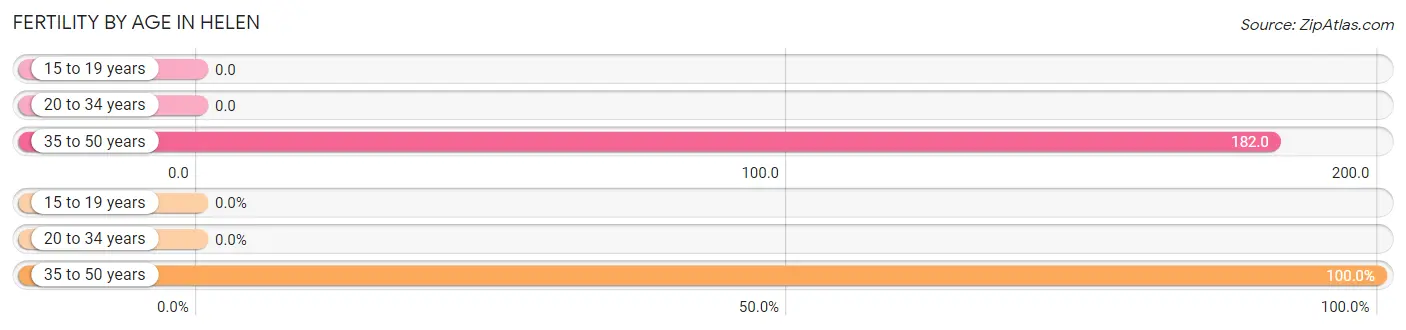
| Age Bracket | Women with Births | Births / 1,000 Women |
| 15 to 19 years | 0 (0.0%) | 0.0 |
| 20 to 34 years | 0 (0.0%) | 0.0 |
| 35 to 50 years | 2 (100.0%) | 182.0 |
| Total | 2 (100.0%) | 53.0 |
Fertility by Age by Marriage Status in Helen
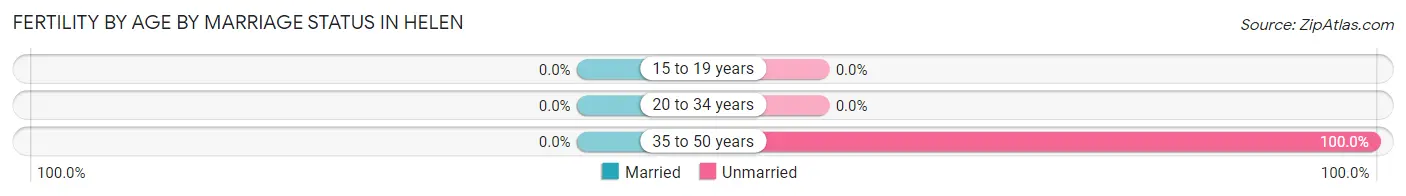
| Age Bracket | Married | Unmarried |
| 15 to 19 years | 0 (0.0%) | 0 (0.0%) |
| 20 to 34 years | 0 (0.0%) | 0 (0.0%) |
| 35 to 50 years | 0 (0.0%) | 2 (100.0%) |
| Total | 0 (0.0%) | 2 (100.0%) |
Fertility by Education in Helen
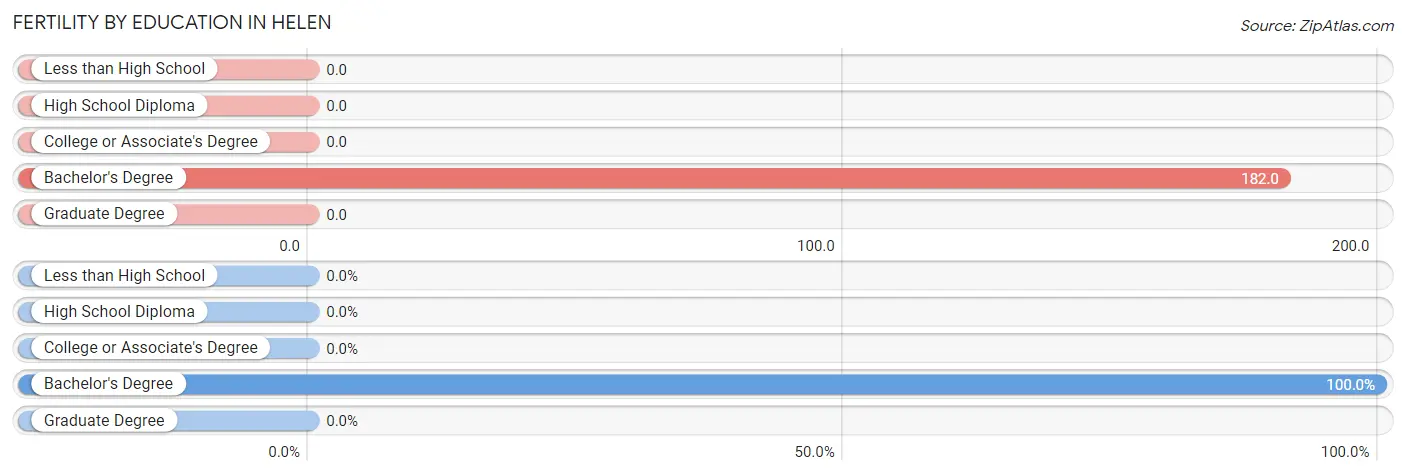
| Educational Attainment | Women with Births | Births / 1,000 Women |
| Less than High School | 0 (0.0%) | 0.0 |
| High School Diploma | 0 (0.0%) | 0.0 |
| College or Associate's Degree | 0 (0.0%) | 0.0 |
| Bachelor's Degree | 2 (100.0%) | 182.0 |
| Graduate Degree | 0 (0.0%) | 0.0 |
| Total | 2 (100.0%) | 53.0 |
Fertility by Education by Marriage Status in Helen
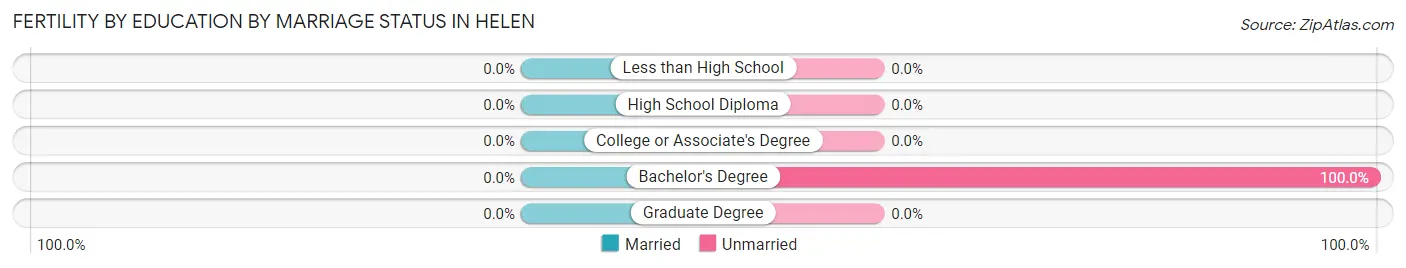
| Educational Attainment | Married | Unmarried |
| Less than High School | 0 (0.0%) | 0 (0.0%) |
| High School Diploma | 0 (0.0%) | 0 (0.0%) |
| College or Associate's Degree | 0 (0.0%) | 0 (0.0%) |
| Bachelor's Degree | 0 (0.0%) | 2 (100.0%) |
| Graduate Degree | 0 (0.0%) | 0 (0.0%) |
| Total | 0 (0.0%) | 2 (100.0%) |
Employment Characteristics in Helen
Employment by Class of Employer in Helen
Among the 229 employed individuals in Helen, private company employees (178 | 77.7%), self-employed (incorporated) (19 | 8.3%), and not-for-profit organizations (13 | 5.7%) make up the most common classes of employment.
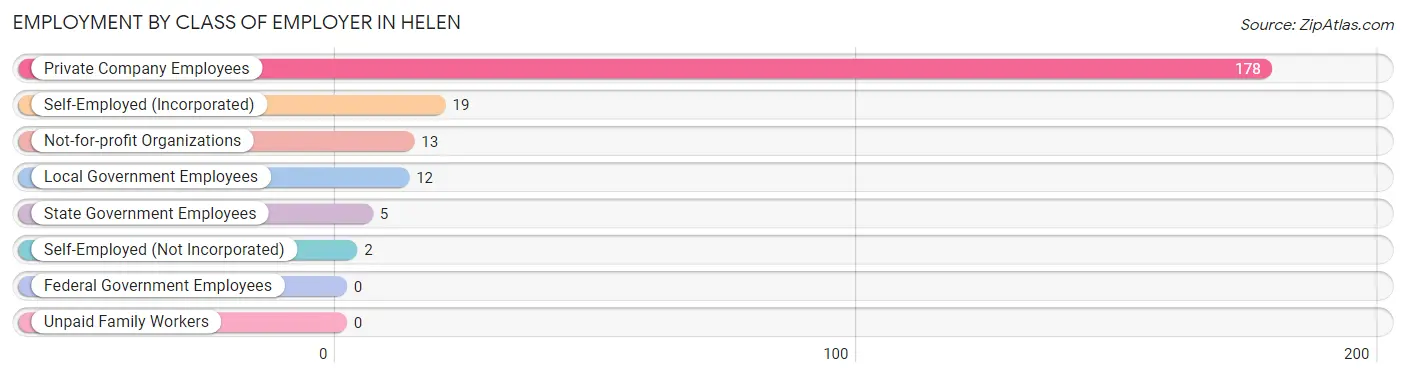
| Employer Class | # Employees | % Employees |
| Private Company Employees | 178 | 77.7% |
| Self-Employed (Incorporated) | 19 | 8.3% |
| Self-Employed (Not Incorporated) | 2 | 0.9% |
| Not-for-profit Organizations | 13 | 5.7% |
| Local Government Employees | 12 | 5.2% |
| State Government Employees | 5 | 2.2% |
| Federal Government Employees | 0 | 0.0% |
| Unpaid Family Workers | 0 | 0.0% |
| Total | 229 | 100.0% |
Employment Status by Age in Helen
According to the labor force statistics for Helen, out of the total population over 16 years of age (475), 49.3% or 234 individuals are in the labor force, with 2.1% or 5 of them unemployed. The age group with the highest labor force participation rate is 20 to 24 years, with 100.0% or 82 individuals in the labor force. Within the labor force, the 60 to 64 years age range has the highest percentage of unemployed individuals, with 16.7% or 4 of them being unemployed.
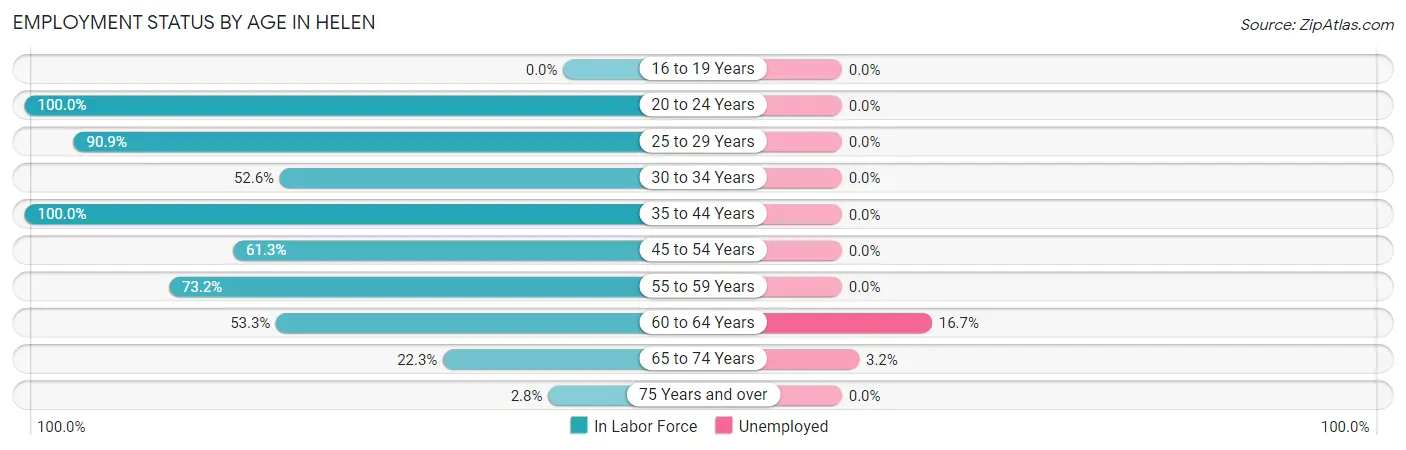
| Age Bracket | In Labor Force | Unemployed |
| 16 to 19 Years | 0 (0.0%) | 0 (0.0%) |
| 20 to 24 Years | 82 (100.0%) | 0 (0.0%) |
| 25 to 29 Years | 10 (90.9%) | 0 (0.0%) |
| 30 to 34 Years | 10 (52.6%) | 0 (0.0%) |
| 35 to 44 Years | 15 (100.0%) | 0 (0.0%) |
| 45 to 54 Years | 19 (61.3%) | 0 (0.0%) |
| 55 to 59 Years | 41 (73.2%) | 0 (0.0%) |
| 60 to 64 Years | 24 (53.3%) | 4 (16.7%) |
| 65 to 74 Years | 31 (22.3%) | 1 (3.2%) |
| 75 Years and over | 2 (2.8%) | 0 (0.0%) |
| Total | 234 (49.3%) | 5 (2.1%) |
Employment Status by Educational Attainment in Helen
According to labor force statistics for Helen, 67.2% of individuals (119) out of the total population between 25 and 64 years of age (177) are in the labor force, with 3.4% or 4 of them being unemployed. The group with the highest labor force participation rate are those with the educational attainment of bachelor's degree or higher, with 91.7% or 55 individuals in the labor force. Within the labor force, individuals with college / associate degree education have the highest percentage of unemployment, with 12.1% or 4 of them being unemployed.
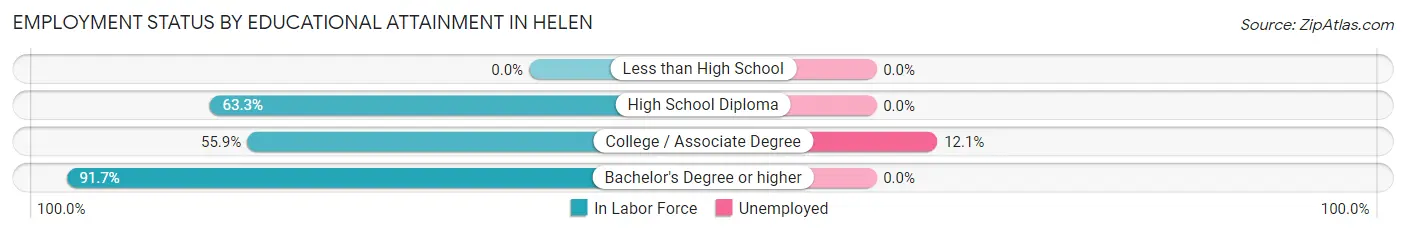
| Educational Attainment | In Labor Force | Unemployed |
| Less than High School | 0 (0.0%) | 0 (0.0%) |
| High School Diploma | 31 (63.3%) | 0 (0.0%) |
| College / Associate Degree | 33 (55.9%) | 7 (12.1%) |
| Bachelor's Degree or higher | 55 (91.7%) | 0 (0.0%) |
| Total | 119 (67.2%) | 6 (3.4%) |
Employment Occupations by Sex in Helen
Management, Business, Science and Arts Occupations
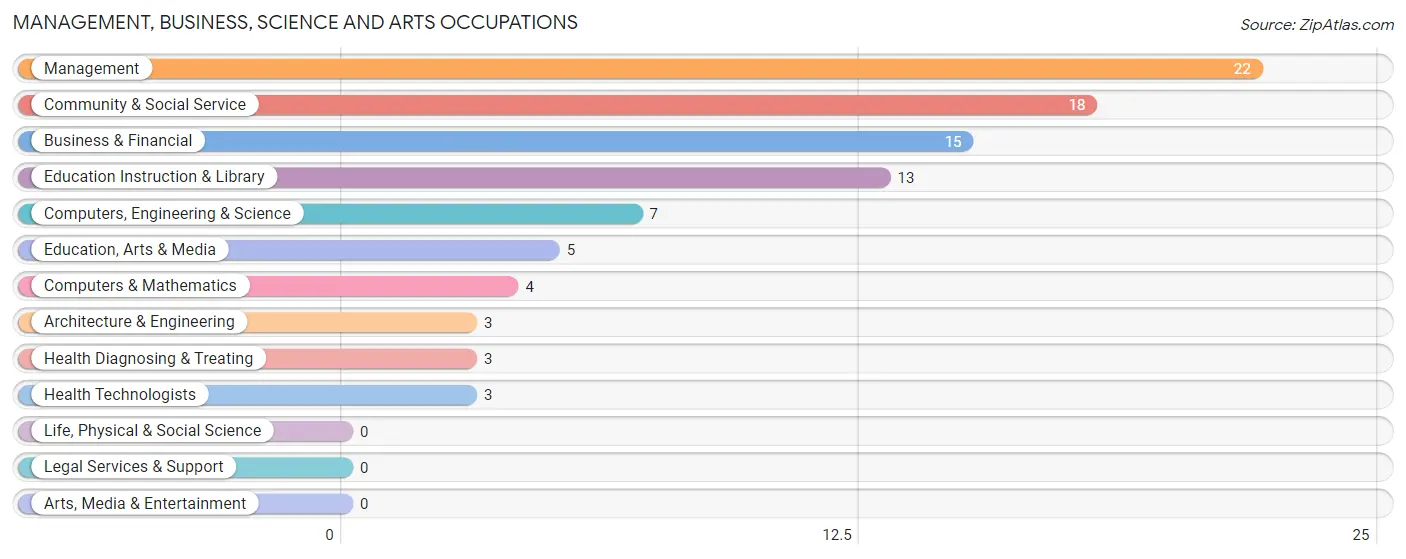
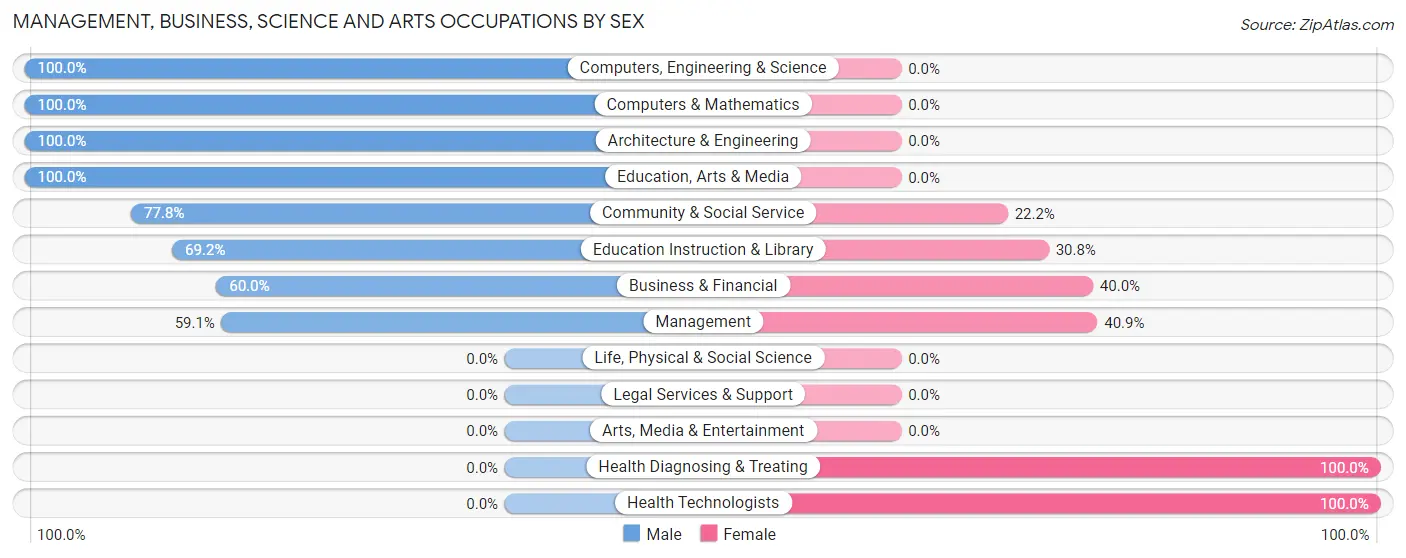
The most common Management, Business, Science and Arts occupations in Helen are Management (22 | 9.6%), Community & Social Service (18 | 7.9%), Business & Financial (15 | 6.6%), Education Instruction & Library (13 | 5.7%), and Computers, Engineering & Science (7 | 3.1%).
Management, Business, Science and Arts Occupations by Sex
Within the Management, Business, Science and Arts occupations in Helen, the most male-oriented occupations are Computers, Engineering & Science (100.0%), Computers & Mathematics (100.0%), and Architecture & Engineering (100.0%), while the most female-oriented occupations are Health Diagnosing & Treating (100.0%), Health Technologists (100.0%), and Management (40.9%).
| Occupation | Male | Female |
| Management | 13 (59.1%) | 9 (40.9%) |
| Business & Financial | 9 (60.0%) | 6 (40.0%) |
| Computers, Engineering & Science | 7 (100.0%) | 0 (0.0%) |
| Computers & Mathematics | 4 (100.0%) | 0 (0.0%) |
| Architecture & Engineering | 3 (100.0%) | 0 (0.0%) |
| Life, Physical & Social Science | 0 (0.0%) | 0 (0.0%) |
| Community & Social Service | 14 (77.8%) | 4 (22.2%) |
| Education, Arts & Media | 5 (100.0%) | 0 (0.0%) |
| Legal Services & Support | 0 (0.0%) | 0 (0.0%) |
| Education Instruction & Library | 9 (69.2%) | 4 (30.8%) |
| Arts, Media & Entertainment | 0 (0.0%) | 0 (0.0%) |
| Health Diagnosing & Treating | 0 (0.0%) | 3 (100.0%) |
| Health Technologists | 0 (0.0%) | 3 (100.0%) |
| Total (Category) | 43 (66.1%) | 22 (33.9%) |
| Total (Overall) | 177 (77.3%) | 52 (22.7%) |
Services Occupations
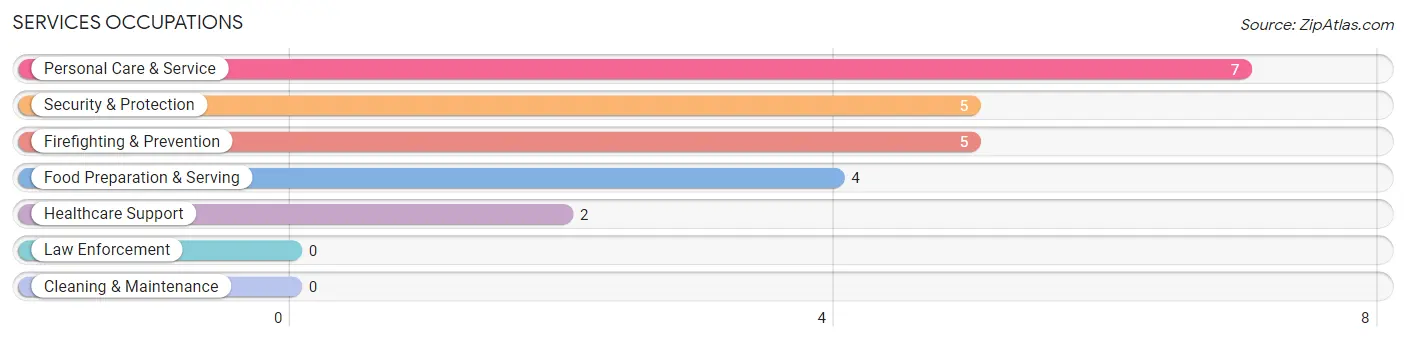
The most common Services occupations in Helen are Personal Care & Service (7 | 3.1%), Security & Protection (5 | 2.2%), Firefighting & Prevention (5 | 2.2%), Food Preparation & Serving (4 | 1.8%), and Healthcare Support (2 | 0.9%).
Services Occupations by Sex
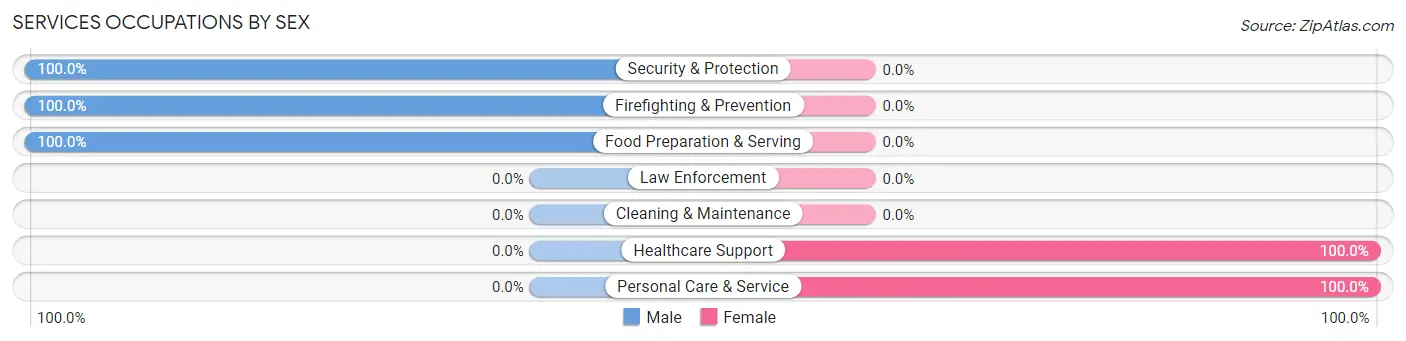
Within the Services occupations in Helen, the most male-oriented occupations are Security & Protection (100.0%), Firefighting & Prevention (100.0%), and Food Preparation & Serving (100.0%), while the most female-oriented occupations are Healthcare Support (100.0%), and Personal Care & Service (100.0%).
| Occupation | Male | Female |
| Healthcare Support | 0 (0.0%) | 2 (100.0%) |
| Security & Protection | 5 (100.0%) | 0 (0.0%) |
| Firefighting & Prevention | 5 (100.0%) | 0 (0.0%) |
| Law Enforcement | 0 (0.0%) | 0 (0.0%) |
| Food Preparation & Serving | 4 (100.0%) | 0 (0.0%) |
| Cleaning & Maintenance | 0 (0.0%) | 0 (0.0%) |
| Personal Care & Service | 0 (0.0%) | 7 (100.0%) |
| Total (Category) | 9 (50.0%) | 9 (50.0%) |
| Total (Overall) | 177 (77.3%) | 52 (22.7%) |
Sales and Office Occupations
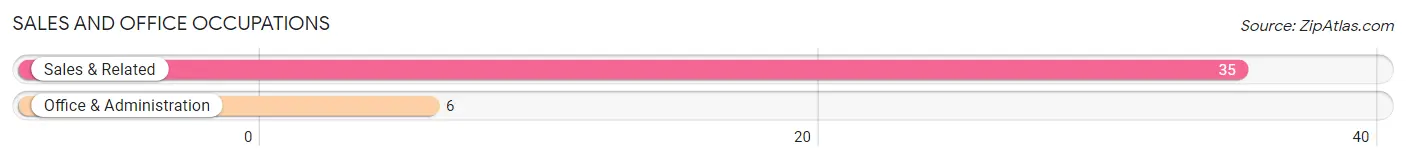
The most common Sales and Office occupations in Helen are Sales & Related (35 | 15.3%), and Office & Administration (6 | 2.6%).
Sales and Office Occupations by Sex
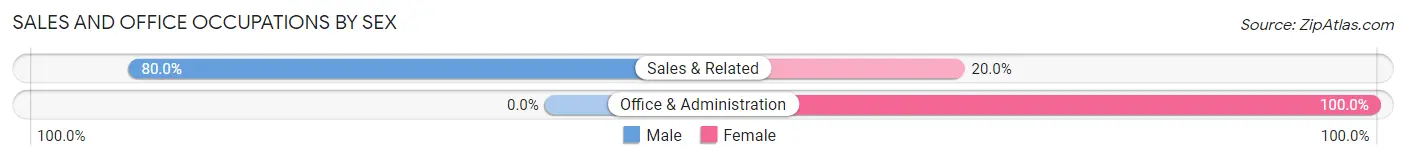
| Occupation | Male | Female |
| Sales & Related | 28 (80.0%) | 7 (20.0%) |
| Office & Administration | 0 (0.0%) | 6 (100.0%) |
| Total (Category) | 28 (68.3%) | 13 (31.7%) |
| Total (Overall) | 177 (77.3%) | 52 (22.7%) |
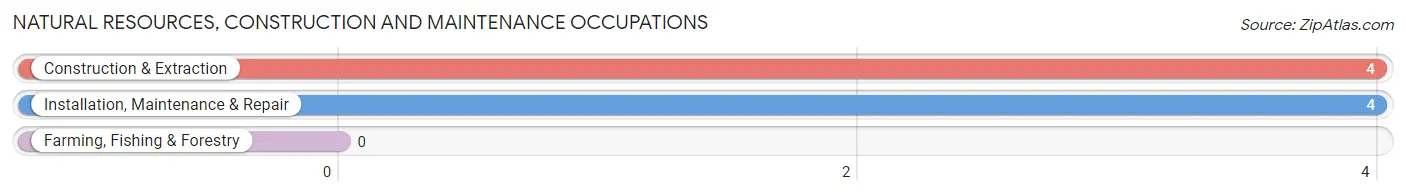
Natural Resources, Construction and Maintenance Occupations
The most common Natural Resources, Construction and Maintenance occupations in Helen are Construction & Extraction (4 | 1.8%), and Installation, Maintenance & Repair (4 | 1.8%).
Natural Resources, Construction and Maintenance Occupations by Sex
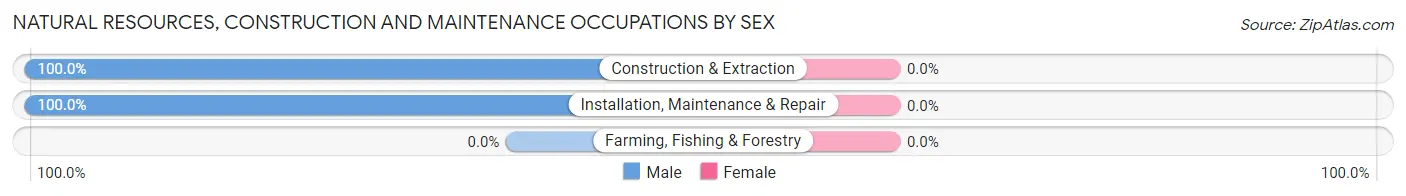
| Occupation | Male | Female |
| Farming, Fishing & Forestry | 0 (0.0%) | 0 (0.0%) |
| Construction & Extraction | 4 (100.0%) | 0 (0.0%) |
| Installation, Maintenance & Repair | 4 (100.0%) | 0 (0.0%) |
| Total (Category) | 8 (100.0%) | 0 (0.0%) |
| Total (Overall) | 177 (77.3%) | 52 (22.7%) |
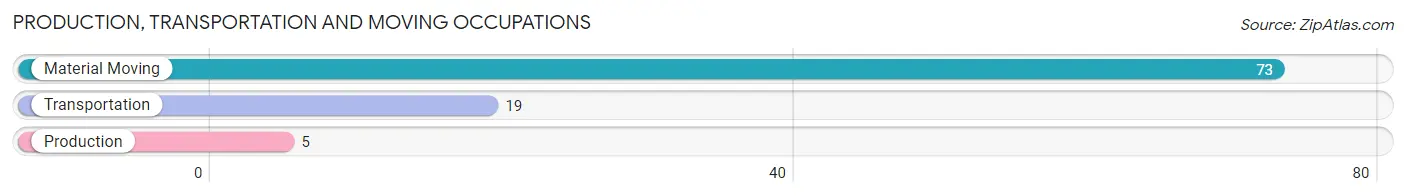
Production, Transportation and Moving Occupations
The most common Production, Transportation and Moving occupations in Helen are Material Moving (73 | 31.9%), Transportation (19 | 8.3%), and Production (5 | 2.2%).
Production, Transportation and Moving Occupations by Sex
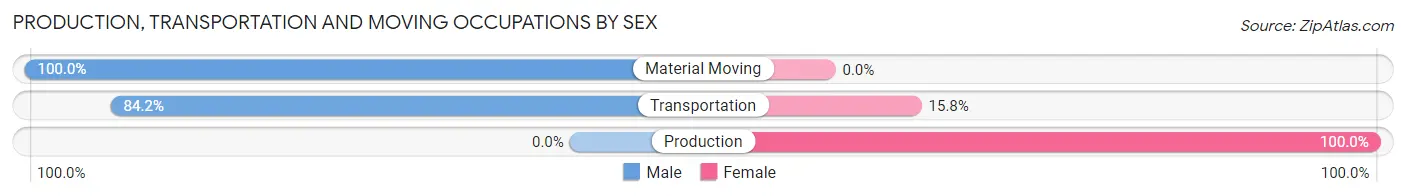
| Occupation | Male | Female |
| Production | 0 (0.0%) | 5 (100.0%) |
| Transportation | 16 (84.2%) | 3 (15.8%) |
| Material Moving | 73 (100.0%) | 0 (0.0%) |
| Total (Category) | 89 (91.7%) | 8 (8.3%) |
| Total (Overall) | 177 (77.3%) | 52 (22.7%) |
Employment Industries by Sex in Helen
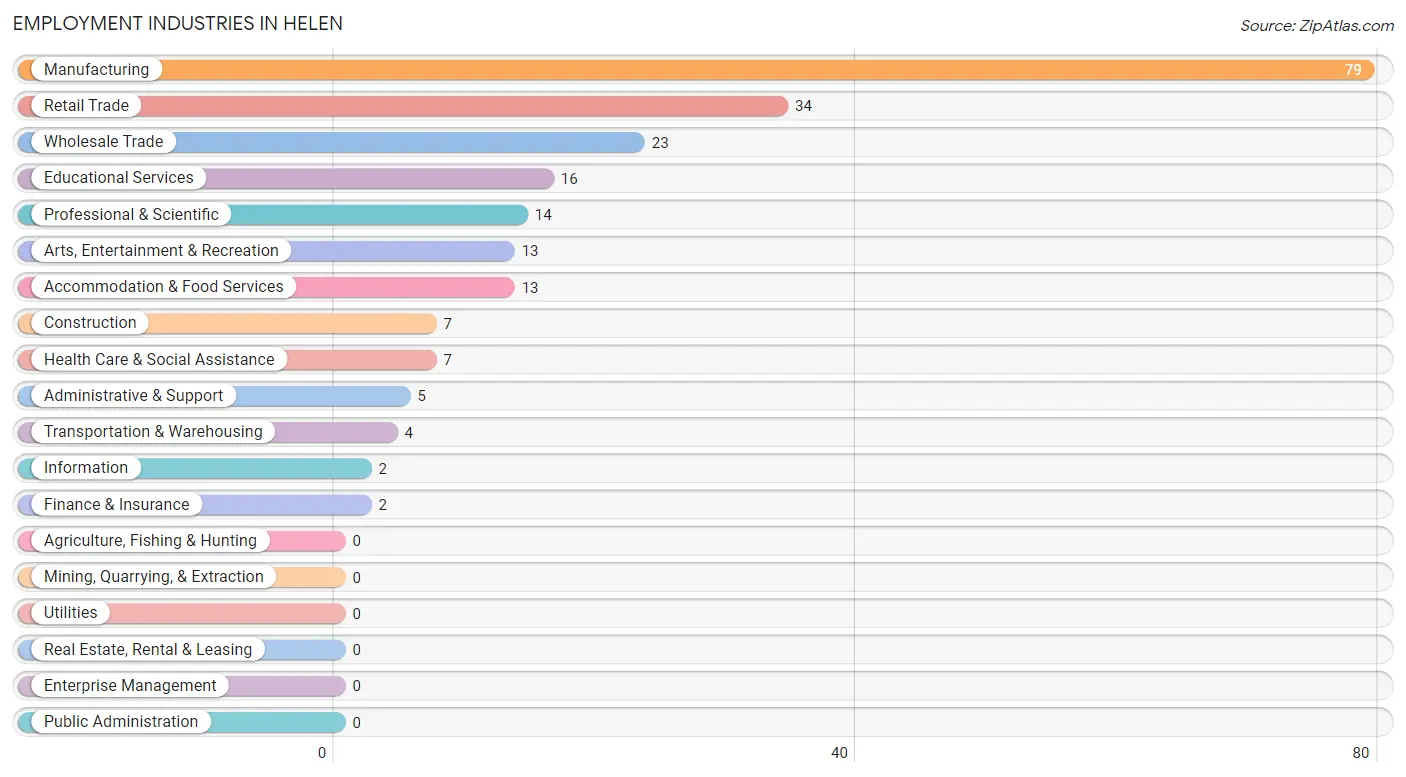
Employment Industries in Helen
The major employment industries in Helen include Manufacturing (79 | 34.5%), Retail Trade (34 | 14.8%), Wholesale Trade (23 | 10.0%), Educational Services (16 | 7.0%), and Professional & Scientific (14 | 6.1%).
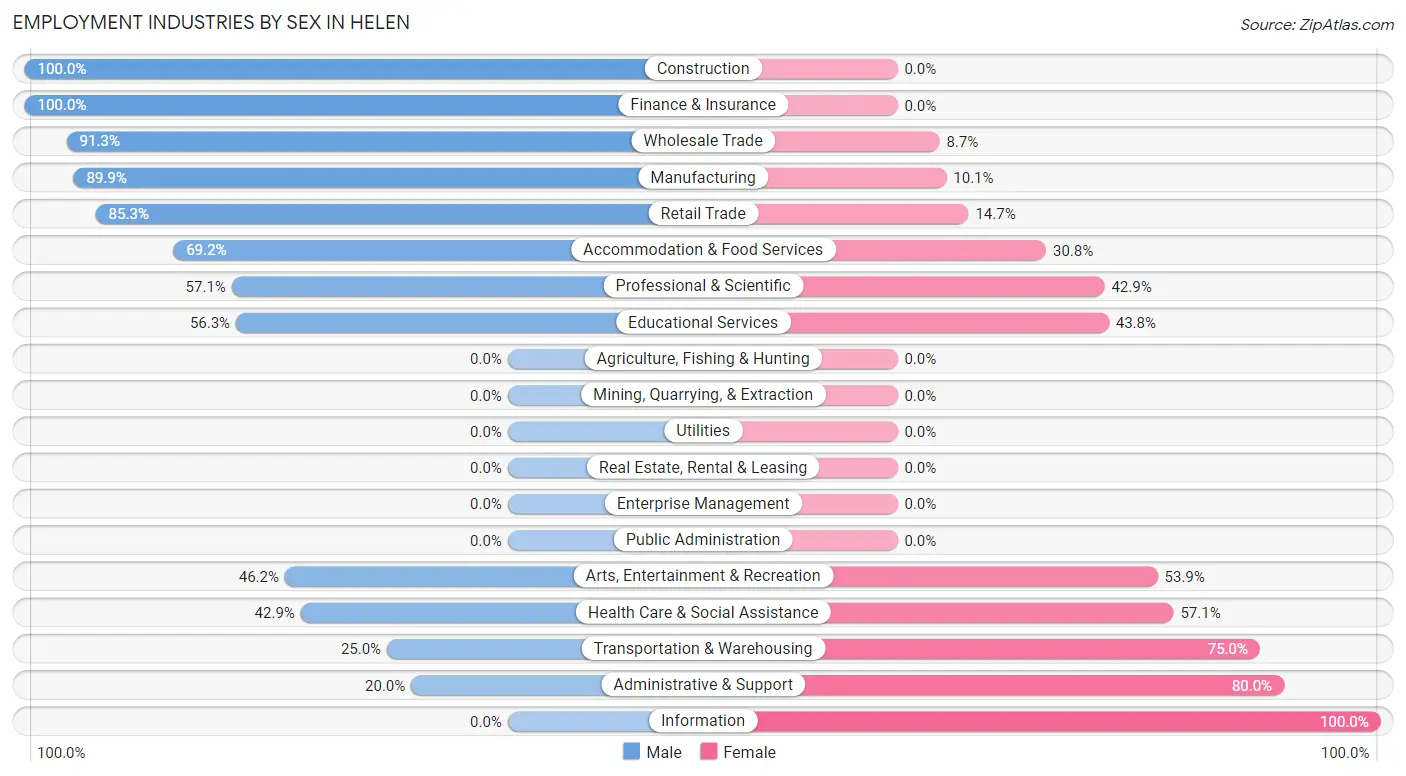
Employment Industries by Sex in Helen
The Helen industries that see more men than women are Construction (100.0%), Finance & Insurance (100.0%), and Wholesale Trade (91.3%), whereas the industries that tend to have a higher number of women are Information (100.0%), Administrative & Support (80.0%), and Transportation & Warehousing (75.0%).
| Industry | Male | Female |
| Agriculture, Fishing & Hunting | 0 (0.0%) | 0 (0.0%) |
| Mining, Quarrying, & Extraction | 0 (0.0%) | 0 (0.0%) |
| Construction | 7 (100.0%) | 0 (0.0%) |
| Manufacturing | 71 (89.9%) | 8 (10.1%) |
| Wholesale Trade | 21 (91.3%) | 2 (8.7%) |
| Retail Trade | 29 (85.3%) | 5 (14.7%) |
| Transportation & Warehousing | 1 (25.0%) | 3 (75.0%) |
| Utilities | 0 (0.0%) | 0 (0.0%) |
| Information | 0 (0.0%) | 2 (100.0%) |
| Finance & Insurance | 2 (100.0%) | 0 (0.0%) |
| Real Estate, Rental & Leasing | 0 (0.0%) | 0 (0.0%) |
| Professional & Scientific | 8 (57.1%) | 6 (42.9%) |
| Enterprise Management | 0 (0.0%) | 0 (0.0%) |
| Administrative & Support | 1 (20.0%) | 4 (80.0%) |
| Educational Services | 9 (56.2%) | 7 (43.8%) |
| Health Care & Social Assistance | 3 (42.9%) | 4 (57.1%) |
| Arts, Entertainment & Recreation | 6 (46.2%) | 7 (53.8%) |
| Accommodation & Food Services | 9 (69.2%) | 4 (30.8%) |
| Public Administration | 0 (0.0%) | 0 (0.0%) |
| Total | 177 (77.3%) | 52 (22.7%) |
Education in Helen
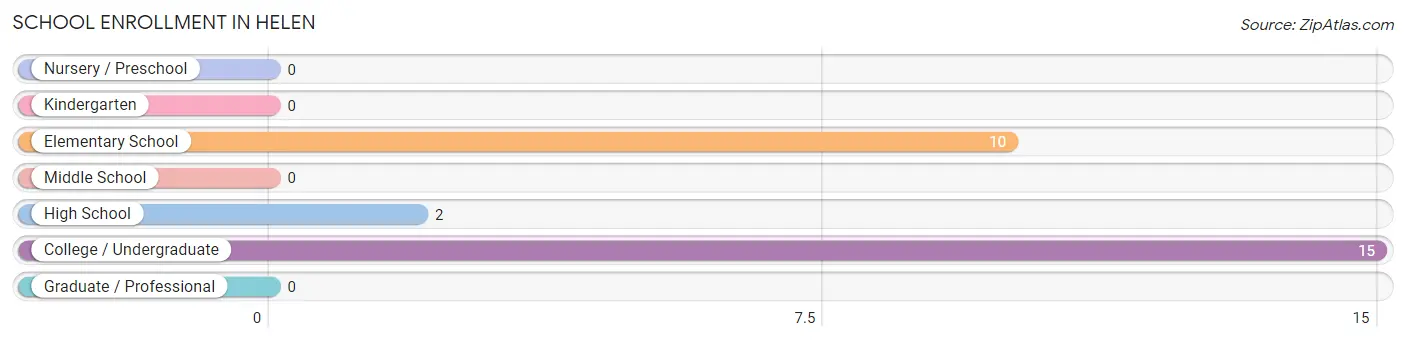
School Enrollment in Helen
The most common levels of schooling among the 27 students in Helen are college / undergraduate (15 | 55.6%), elementary school (10 | 37.0%), and high school (2 | 7.4%).
| School Level | # Students | % Students |
| Nursery / Preschool | 0 | 0.0% |
| Kindergarten | 0 | 0.0% |
| Elementary School | 10 | 37.0% |
| Middle School | 0 | 0.0% |
| High School | 2 | 7.4% |
| College / Undergraduate | 15 | 55.6% |
| Graduate / Professional | 0 | 0.0% |
| Total | 27 | 100.0% |
School Enrollment by Age by Funding Source in Helen
Out of a total of 27 students who are enrolled in schools in Helen, 5 (18.5%) attend a private institution, while the remaining 22 (81.5%) are enrolled in public schools. The age group of 18 to 19 year olds has the highest likelihood of being enrolled in private schools, with 4 (100.0% in the age bracket) enrolled. Conversely, the age group of 5 to 9 year old has the lowest likelihood of being enrolled in a private school, with 10 (100.0% in the age bracket) attending a public institution.
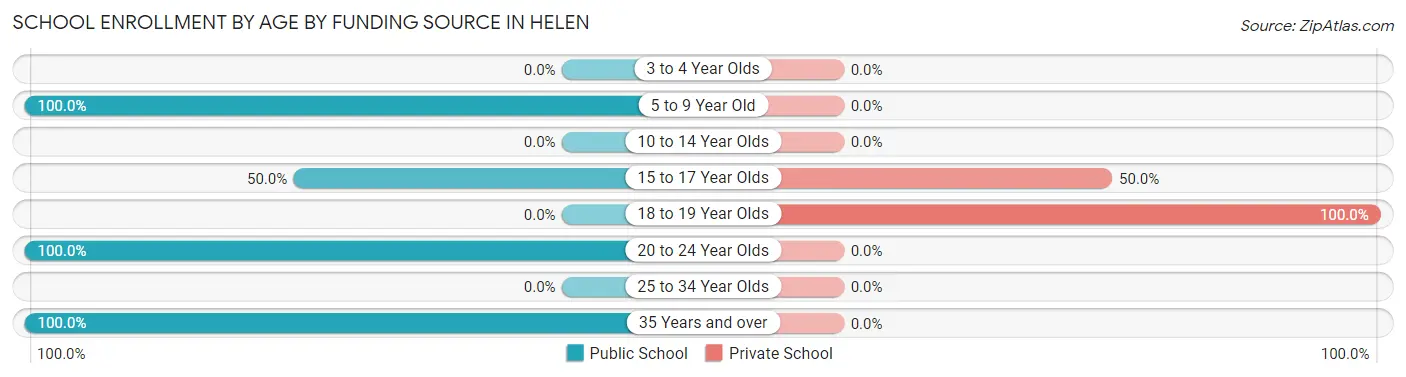
| Age Bracket | Public School | Private School |
| 3 to 4 Year Olds | 0 (0.0%) | 0 (0.0%) |
| 5 to 9 Year Old | 10 (100.0%) | 0 (0.0%) |
| 10 to 14 Year Olds | 0 (0.0%) | 0 (0.0%) |
| 15 to 17 Year Olds | 1 (50.0%) | 1 (50.0%) |
| 18 to 19 Year Olds | 0 (0.0%) | 4 (100.0%) |
| 20 to 24 Year Olds | 9 (100.0%) | 0 (0.0%) |
| 25 to 34 Year Olds | 0 (0.0%) | 0 (0.0%) |
| 35 Years and over | 2 (100.0%) | 0 (0.0%) |
| Total | 22 (81.5%) | 5 (18.5%) |
Educational Attainment by Field of Study in Helen
Business (36 | 20.1%), education (27 | 15.1%), social sciences (21 | 11.7%), computers & mathematics (18 | 10.1%), and engineering (18 | 10.1%) are the most common fields of study among 179 individuals in Helen who have obtained a bachelor's degree or higher.
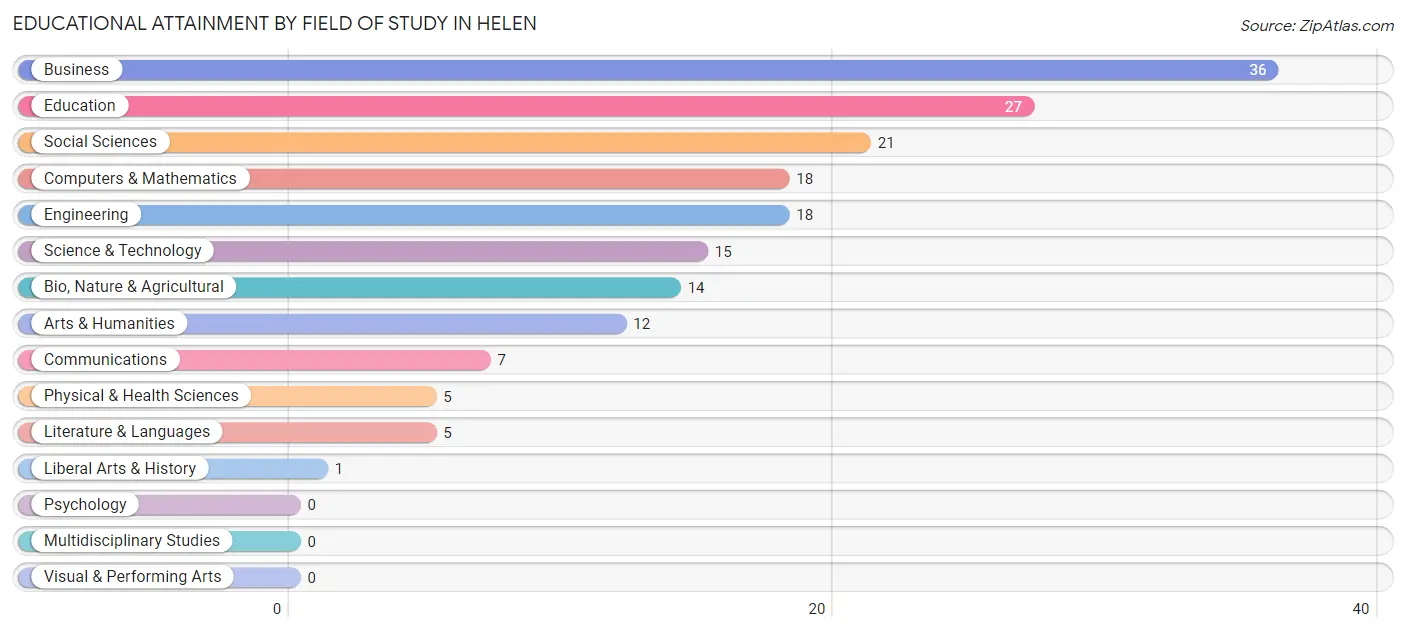
| Field of Study | # Graduates | % Graduates |
| Computers & Mathematics | 18 | 10.1% |
| Bio, Nature & Agricultural | 14 | 7.8% |
| Physical & Health Sciences | 5 | 2.8% |
| Psychology | 0 | 0.0% |
| Social Sciences | 21 | 11.7% |
| Engineering | 18 | 10.1% |
| Multidisciplinary Studies | 0 | 0.0% |
| Science & Technology | 15 | 8.4% |
| Business | 36 | 20.1% |
| Education | 27 | 15.1% |
| Literature & Languages | 5 | 2.8% |
| Liberal Arts & History | 1 | 0.6% |
| Visual & Performing Arts | 0 | 0.0% |
| Communications | 7 | 3.9% |
| Arts & Humanities | 12 | 6.7% |
| Total | 179 | 100.0% |
Transportation & Commute in Helen
Vehicle Availability by Sex in Helen
The most prevalent vehicle ownership categories in Helen are males with 3 vehicles (89, accounting for 50.3%) and females with 3 vehicles (13, making up 171.2%).
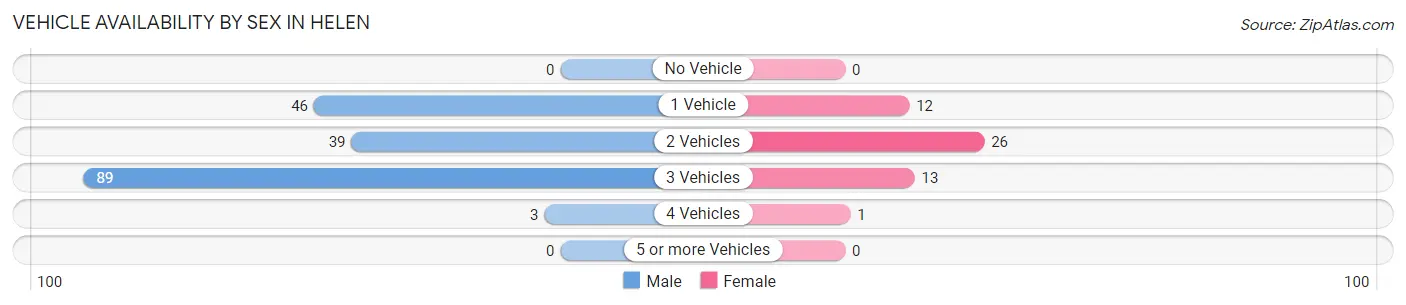
| Vehicles Available | Male | Female |
| No Vehicle | 0 (0.0%) | 0 (0.0%) |
| 1 Vehicle | 46 (26.0%) | 12 (23.1%) |
| 2 Vehicles | 39 (22.0%) | 26 (50.0%) |
| 3 Vehicles | 89 (50.3%) | 13 (25.0%) |
| 4 Vehicles | 3 (1.7%) | 1 (1.9%) |
| 5 or more Vehicles | 0 (0.0%) | 0 (0.0%) |
| Total | 177 (100.0%) | 52 (100.0%) |
Commute Time in Helen
The most frequently occuring commute durations in Helen are 20 to 24 minutes (80 commuters, 37.0%), 5 to 9 minutes (41 commuters, 19.0%), and 15 to 19 minutes (27 commuters, 12.5%).
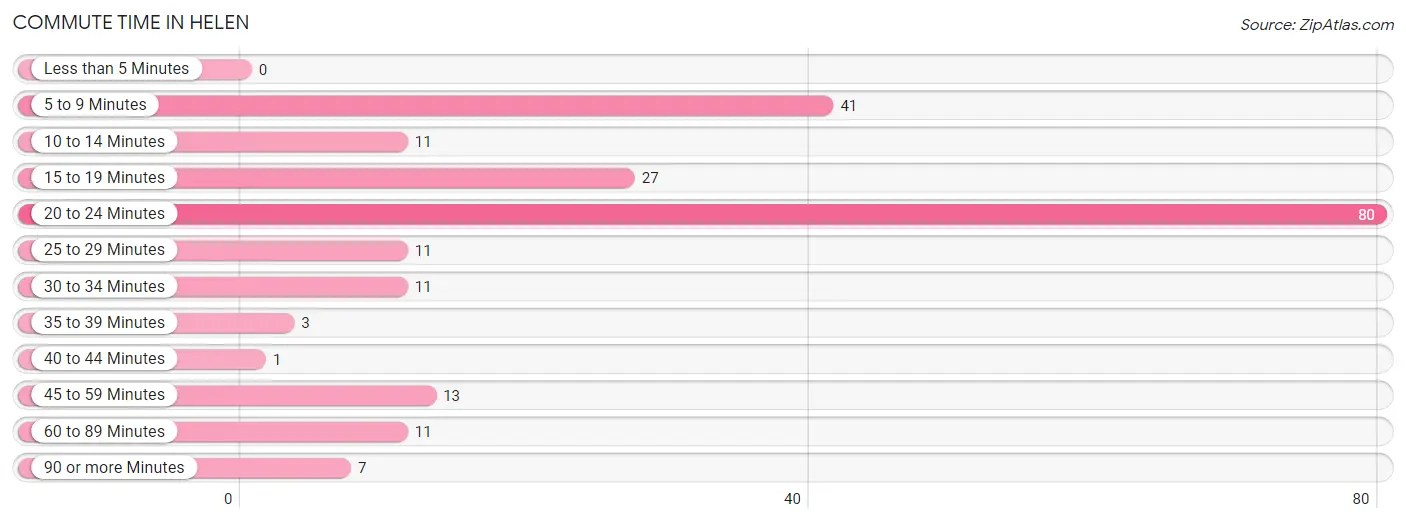
| Commute Time | # Commuters | % Commuters |
| Less than 5 Minutes | 0 | 0.0% |
| 5 to 9 Minutes | 41 | 19.0% |
| 10 to 14 Minutes | 11 | 5.1% |
| 15 to 19 Minutes | 27 | 12.5% |
| 20 to 24 Minutes | 80 | 37.0% |
| 25 to 29 Minutes | 11 | 5.1% |
| 30 to 34 Minutes | 11 | 5.1% |
| 35 to 39 Minutes | 3 | 1.4% |
| 40 to 44 Minutes | 1 | 0.5% |
| 45 to 59 Minutes | 13 | 6.0% |
| 60 to 89 Minutes | 11 | 5.1% |
| 90 or more Minutes | 7 | 3.2% |
Commute Time by Sex in Helen
The most common commute times in Helen are 20 to 24 minutes (71 commuters, 41.0%) for males and 20 to 24 minutes (9 commuters, 20.9%) for females.
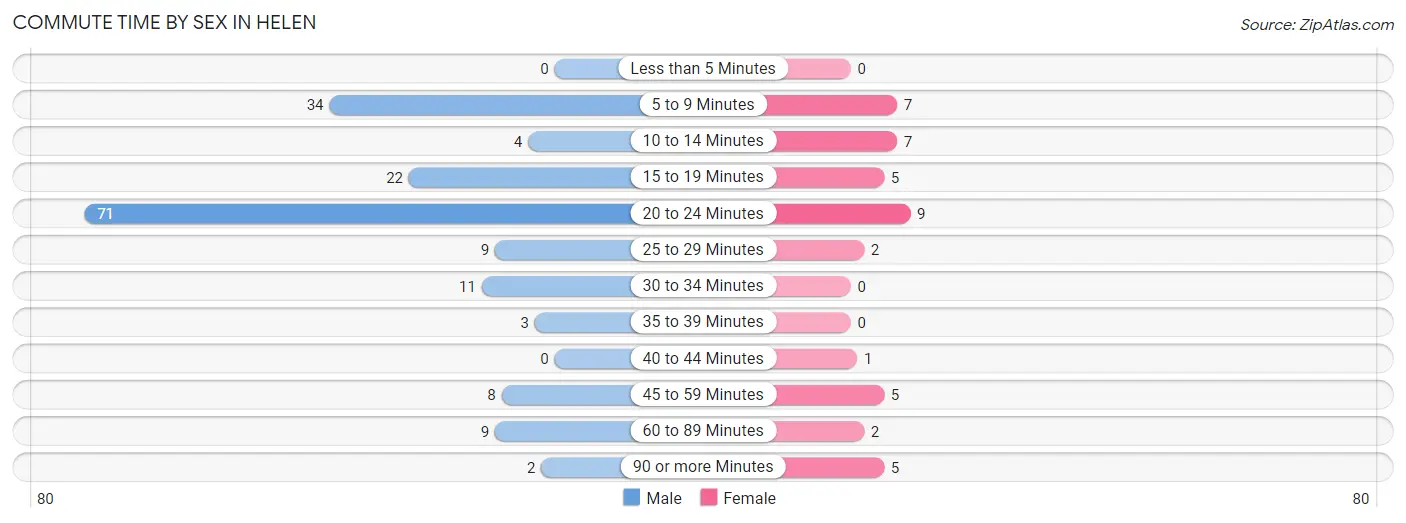
| Commute Time | Male | Female |
| Less than 5 Minutes | 0 (0.0%) | 0 (0.0%) |
| 5 to 9 Minutes | 34 (19.7%) | 7 (16.3%) |
| 10 to 14 Minutes | 4 (2.3%) | 7 (16.3%) |
| 15 to 19 Minutes | 22 (12.7%) | 5 (11.6%) |
| 20 to 24 Minutes | 71 (41.0%) | 9 (20.9%) |
| 25 to 29 Minutes | 9 (5.2%) | 2 (4.6%) |
| 30 to 34 Minutes | 11 (6.4%) | 0 (0.0%) |
| 35 to 39 Minutes | 3 (1.7%) | 0 (0.0%) |
| 40 to 44 Minutes | 0 (0.0%) | 1 (2.3%) |
| 45 to 59 Minutes | 8 (4.6%) | 5 (11.6%) |
| 60 to 89 Minutes | 9 (5.2%) | 2 (4.6%) |
| 90 or more Minutes | 2 (1.2%) | 5 (11.6%) |
Time of Departure to Work by Sex in Helen
The most frequent times of departure to work in Helen are 6:00 AM to 6:29 AM (77, 44.5%) for males and 7:00 AM to 7:29 AM (12, 27.9%) for females.
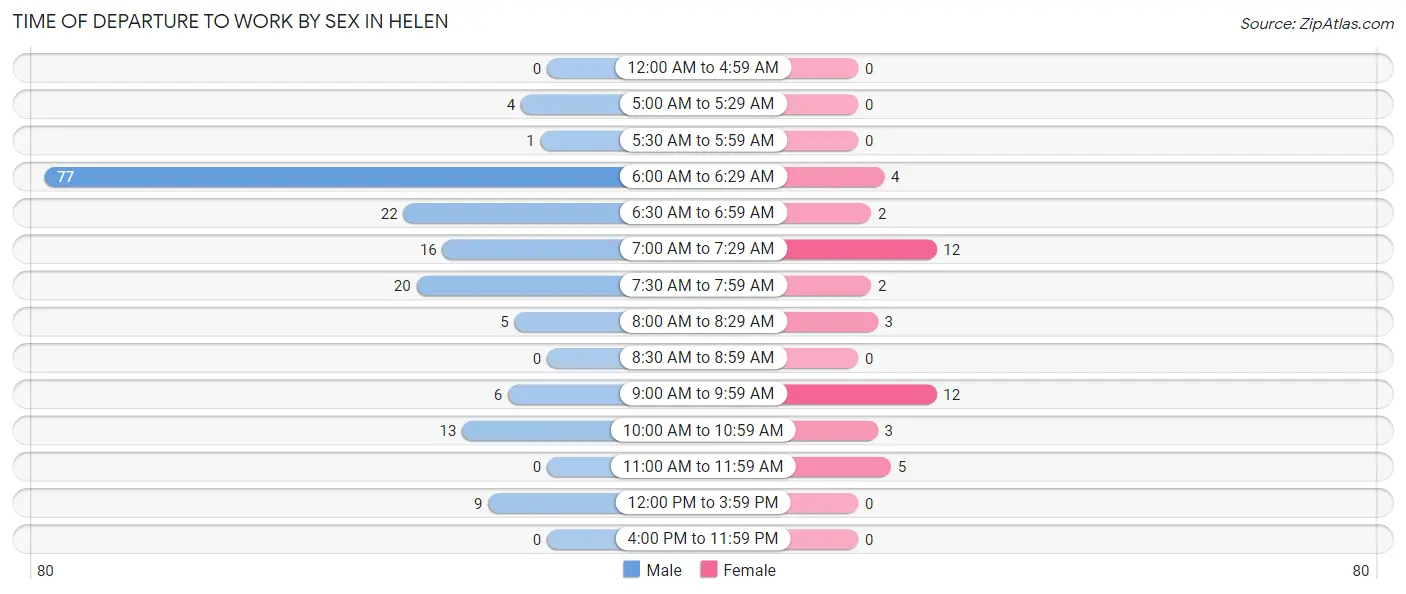
| Time of Departure | Male | Female |
| 12:00 AM to 4:59 AM | 0 (0.0%) | 0 (0.0%) |
| 5:00 AM to 5:29 AM | 4 (2.3%) | 0 (0.0%) |
| 5:30 AM to 5:59 AM | 1 (0.6%) | 0 (0.0%) |
| 6:00 AM to 6:29 AM | 77 (44.5%) | 4 (9.3%) |
| 6:30 AM to 6:59 AM | 22 (12.7%) | 2 (4.6%) |
| 7:00 AM to 7:29 AM | 16 (9.2%) | 12 (27.9%) |
| 7:30 AM to 7:59 AM | 20 (11.6%) | 2 (4.6%) |
| 8:00 AM to 8:29 AM | 5 (2.9%) | 3 (7.0%) |
| 8:30 AM to 8:59 AM | 0 (0.0%) | 0 (0.0%) |
| 9:00 AM to 9:59 AM | 6 (3.5%) | 12 (27.9%) |
| 10:00 AM to 10:59 AM | 13 (7.5%) | 3 (7.0%) |
| 11:00 AM to 11:59 AM | 0 (0.0%) | 5 (11.6%) |
| 12:00 PM to 3:59 PM | 9 (5.2%) | 0 (0.0%) |
| 4:00 PM to 11:59 PM | 0 (0.0%) | 0 (0.0%) |
| Total | 173 (100.0%) | 43 (100.0%) |
Housing Occupancy in Helen
Occupancy by Ownership in Helen
Of the total 241 dwellings in Helen, owner-occupied units account for 152 (63.1%), while renter-occupied units make up 89 (36.9%).
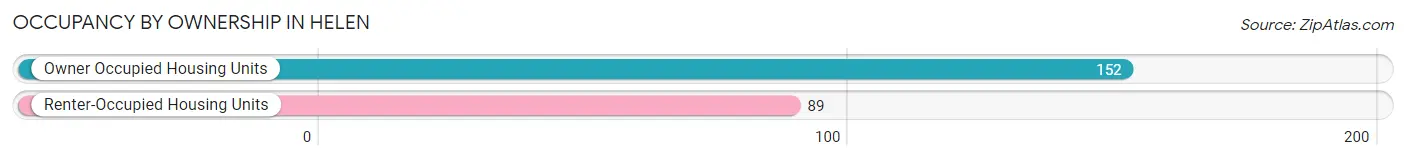
| Occupancy | # Housing Units | % Housing Units |
| Owner Occupied Housing Units | 152 | 63.1% |
| Renter-Occupied Housing Units | 89 | 36.9% |
| Total Occupied Housing Units | 241 | 100.0% |
Occupancy by Household Size in Helen
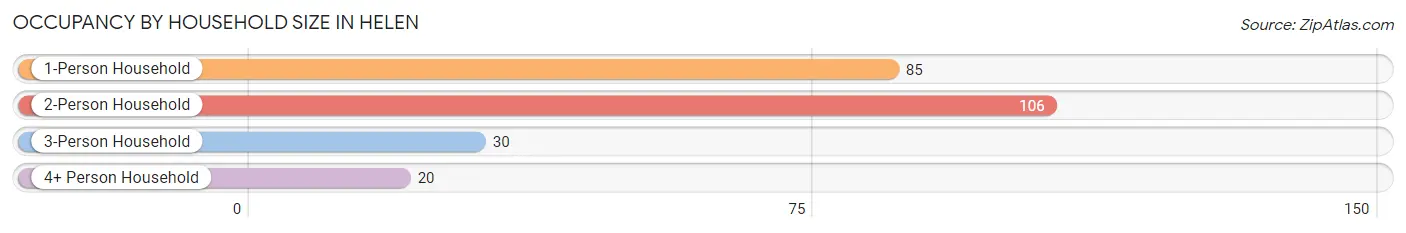
| Household Size | # Housing Units | % Housing Units |
| 1-Person Household | 85 | 35.3% |
| 2-Person Household | 106 | 44.0% |
| 3-Person Household | 30 | 12.4% |
| 4+ Person Household | 20 | 8.3% |
| Total Housing Units | 241 | 100.0% |
Occupancy by Ownership by Household Size in Helen
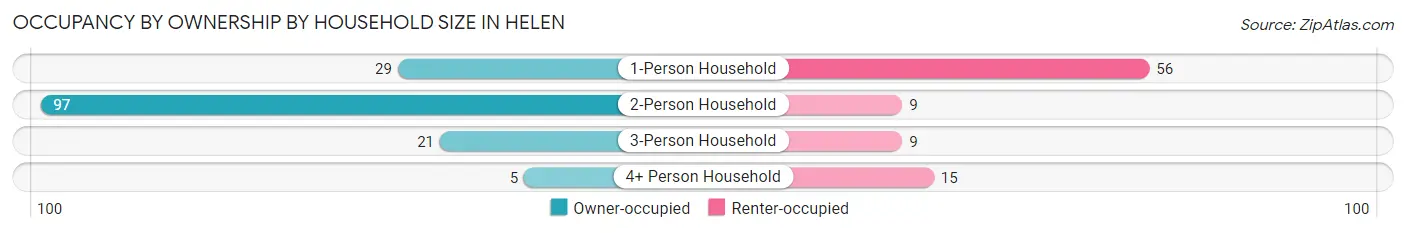
| Household Size | Owner-occupied | Renter-occupied |
| 1-Person Household | 29 (34.1%) | 56 (65.9%) |
| 2-Person Household | 97 (91.5%) | 9 (8.5%) |
| 3-Person Household | 21 (70.0%) | 9 (30.0%) |
| 4+ Person Household | 5 (25.0%) | 15 (75.0%) |
| Total Housing Units | 152 (63.1%) | 89 (36.9%) |
Occupancy by Educational Attainment in Helen
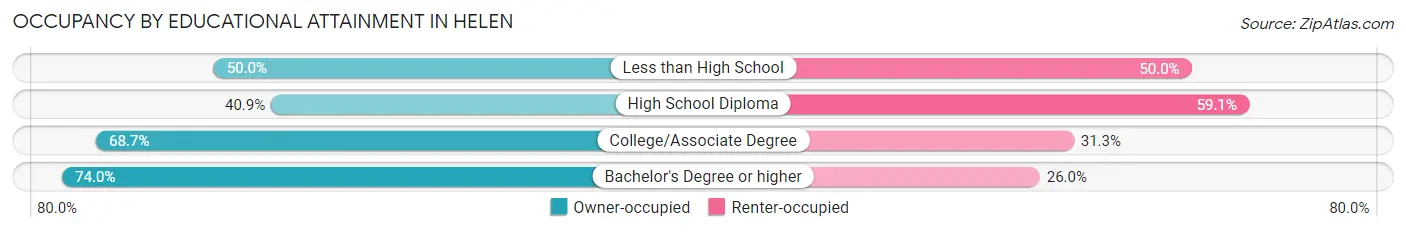
| Household Size | Owner-occupied | Renter-occupied |
| Less than High School | 2 (50.0%) | 2 (50.0%) |
| High School Diploma | 27 (40.9%) | 39 (59.1%) |
| College/Associate Degree | 46 (68.7%) | 21 (31.3%) |
| Bachelor's Degree or higher | 77 (74.0%) | 27 (26.0%) |
Occupancy by Age of Householder in Helen
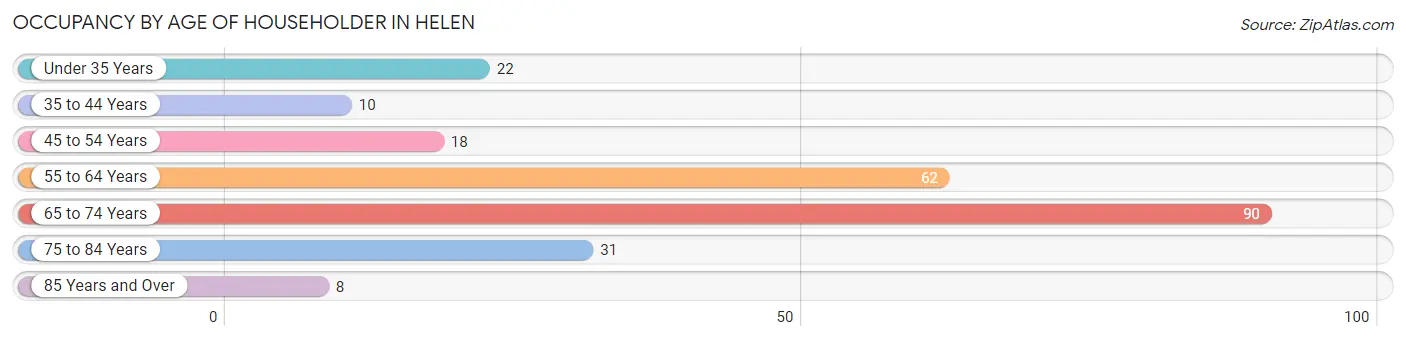
| Age Bracket | # Households | % Households |
| Under 35 Years | 22 | 9.1% |
| 35 to 44 Years | 10 | 4.2% |
| 45 to 54 Years | 18 | 7.5% |
| 55 to 64 Years | 62 | 25.7% |
| 65 to 74 Years | 90 | 37.3% |
| 75 to 84 Years | 31 | 12.9% |
| 85 Years and Over | 8 | 3.3% |
| Total | 241 | 100.0% |
Housing Finances in Helen
Median Income by Occupancy in Helen
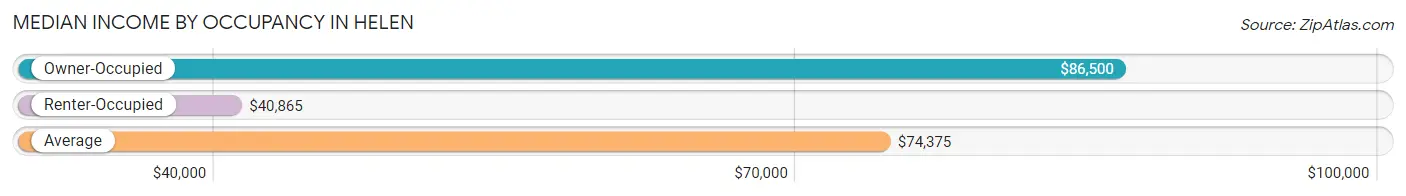
| Occupancy Type | # Households | Median Income |
| Owner-Occupied | 152 (63.1%) | $86,500 |
| Renter-Occupied | 89 (36.9%) | $40,865 |
| Average | 241 (100.0%) | $74,375 |
Occupancy by Householder Income Bracket in Helen
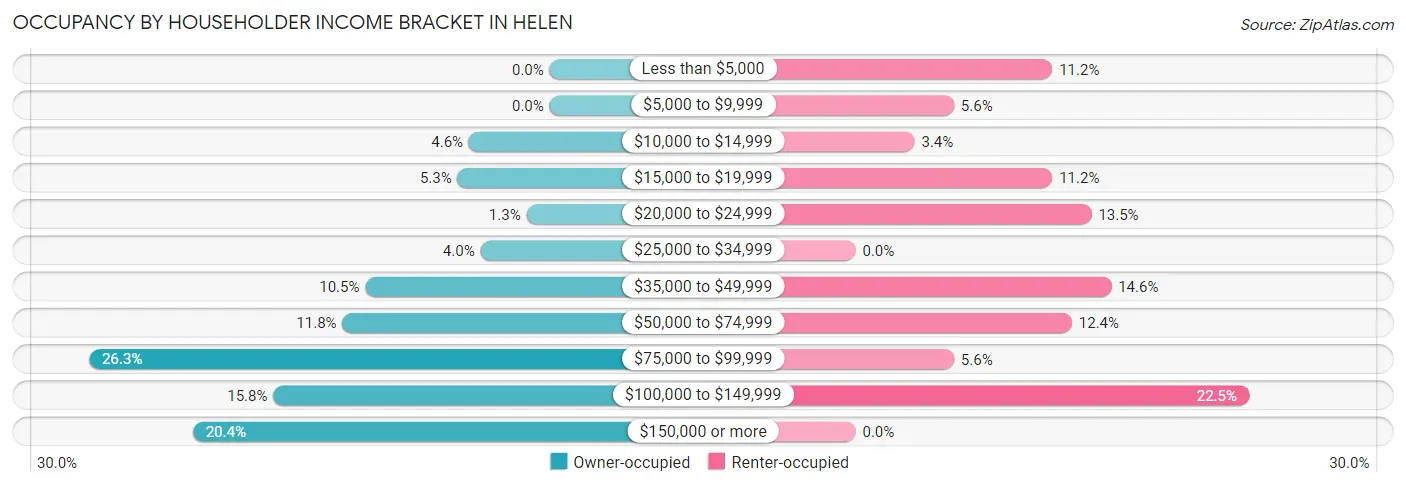
| Income Bracket | Owner-occupied | Renter-occupied |
| Less than $5,000 | 0 (0.0%) | 10 (11.2%) |
| $5,000 to $9,999 | 0 (0.0%) | 5 (5.6%) |
| $10,000 to $14,999 | 7 (4.6%) | 3 (3.4%) |
| $15,000 to $19,999 | 8 (5.3%) | 10 (11.2%) |
| $20,000 to $24,999 | 2 (1.3%) | 12 (13.5%) |
| $25,000 to $34,999 | 6 (4.0%) | 0 (0.0%) |
| $35,000 to $49,999 | 16 (10.5%) | 13 (14.6%) |
| $50,000 to $74,999 | 18 (11.8%) | 11 (12.4%) |
| $75,000 to $99,999 | 40 (26.3%) | 5 (5.6%) |
| $100,000 to $149,999 | 24 (15.8%) | 20 (22.5%) |
| $150,000 or more | 31 (20.4%) | 0 (0.0%) |
| Total | 152 (100.0%) | 89 (100.0%) |
Monthly Housing Cost Tiers in Helen
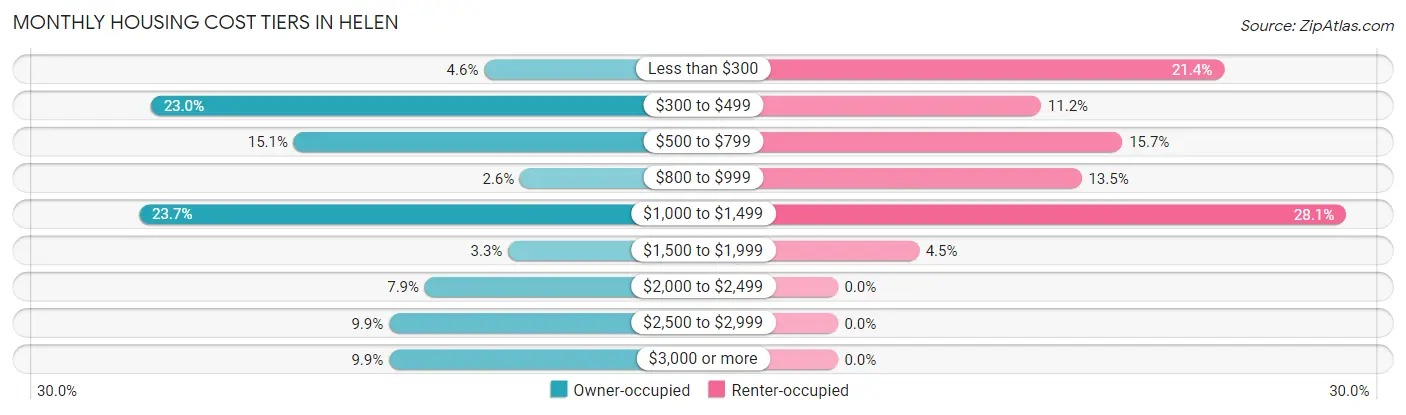
| Monthly Cost | Owner-occupied | Renter-occupied |
| Less than $300 | 7 (4.6%) | 19 (21.3%) |
| $300 to $499 | 35 (23.0%) | 10 (11.2%) |
| $500 to $799 | 23 (15.1%) | 14 (15.7%) |
| $800 to $999 | 4 (2.6%) | 12 (13.5%) |
| $1,000 to $1,499 | 36 (23.7%) | 25 (28.1%) |
| $1,500 to $1,999 | 5 (3.3%) | 4 (4.5%) |
| $2,000 to $2,499 | 12 (7.9%) | 0 (0.0%) |
| $2,500 to $2,999 | 15 (9.9%) | 0 (0.0%) |
| $3,000 or more | 15 (9.9%) | 0 (0.0%) |
| Total | 152 (100.0%) | 89 (100.0%) |
Physical Housing Characteristics in Helen
Housing Structures in Helen
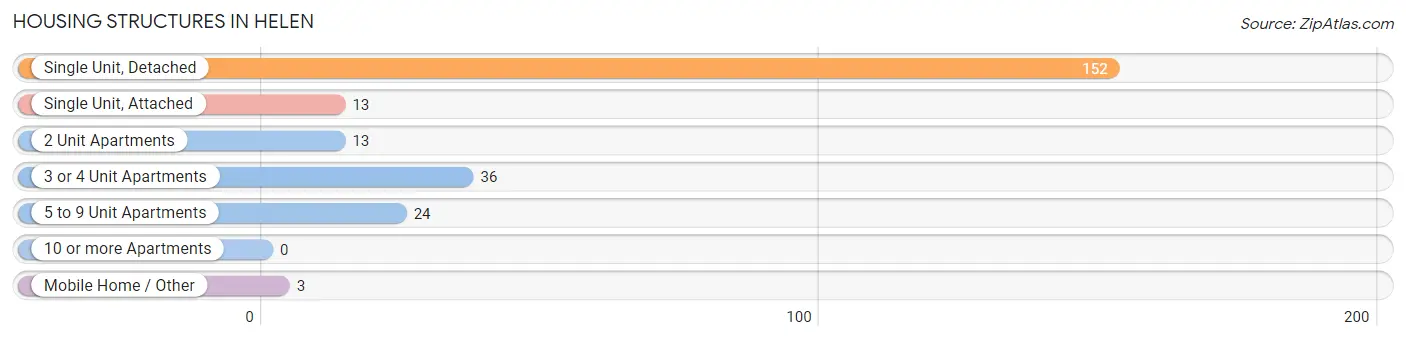
| Structure Type | # Housing Units | % Housing Units |
| Single Unit, Detached | 152 | 63.1% |
| Single Unit, Attached | 13 | 5.4% |
| 2 Unit Apartments | 13 | 5.4% |
| 3 or 4 Unit Apartments | 36 | 14.9% |
| 5 to 9 Unit Apartments | 24 | 10.0% |
| 10 or more Apartments | 0 | 0.0% |
| Mobile Home / Other | 3 | 1.2% |
| Total | 241 | 100.0% |
Housing Structures by Occupancy in Helen
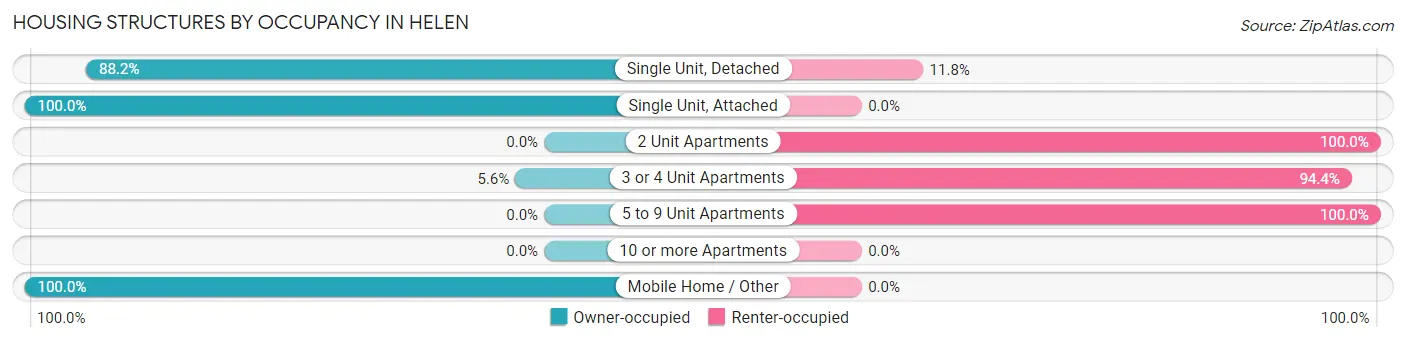
| Structure Type | Owner-occupied | Renter-occupied |
| Single Unit, Detached | 134 (88.2%) | 18 (11.8%) |
| Single Unit, Attached | 13 (100.0%) | 0 (0.0%) |
| 2 Unit Apartments | 0 (0.0%) | 13 (100.0%) |
| 3 or 4 Unit Apartments | 2 (5.6%) | 34 (94.4%) |
| 5 to 9 Unit Apartments | 0 (0.0%) | 24 (100.0%) |
| 10 or more Apartments | 0 (0.0%) | 0 (0.0%) |
| Mobile Home / Other | 3 (100.0%) | 0 (0.0%) |
| Total | 152 (63.1%) | 89 (36.9%) |
Housing Structures by Number of Rooms in Helen
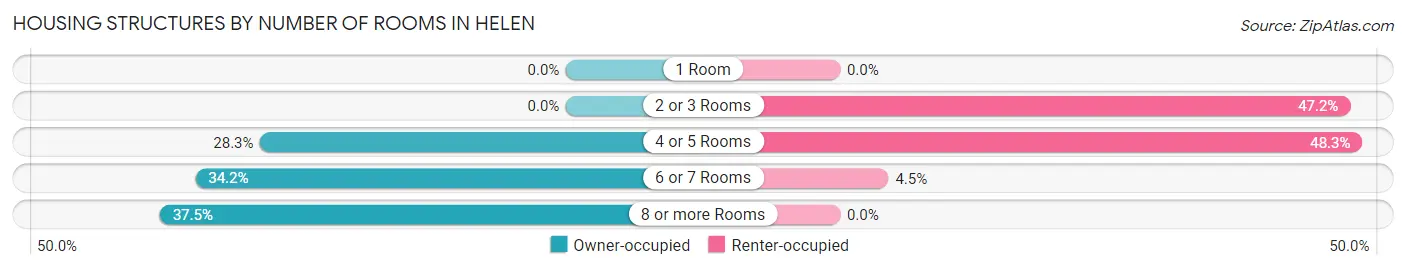
| Number of Rooms | Owner-occupied | Renter-occupied |
| 1 Room | 0 (0.0%) | 0 (0.0%) |
| 2 or 3 Rooms | 0 (0.0%) | 42 (47.2%) |
| 4 or 5 Rooms | 43 (28.3%) | 43 (48.3%) |
| 6 or 7 Rooms | 52 (34.2%) | 4 (4.5%) |
| 8 or more Rooms | 57 (37.5%) | 0 (0.0%) |
| Total | 152 (100.0%) | 89 (100.0%) |
Housing Structure by Heating Type in Helen
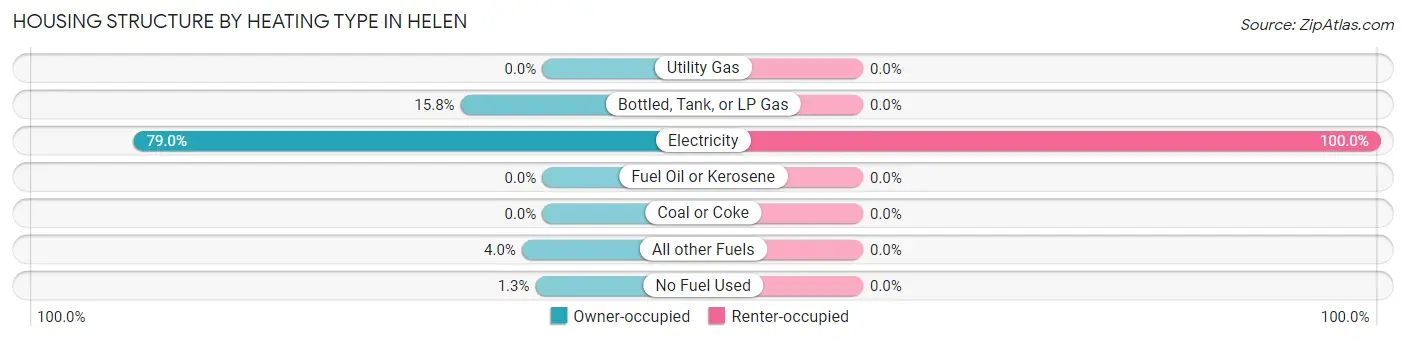
| Heating Type | Owner-occupied | Renter-occupied |
| Utility Gas | 0 (0.0%) | 0 (0.0%) |
| Bottled, Tank, or LP Gas | 24 (15.8%) | 0 (0.0%) |
| Electricity | 120 (78.9%) | 89 (100.0%) |
| Fuel Oil or Kerosene | 0 (0.0%) | 0 (0.0%) |
| Coal or Coke | 0 (0.0%) | 0 (0.0%) |
| All other Fuels | 6 (4.0%) | 0 (0.0%) |
| No Fuel Used | 2 (1.3%) | 0 (0.0%) |
| Total | 152 (100.0%) | 89 (100.0%) |
Household Vehicle Usage in Helen
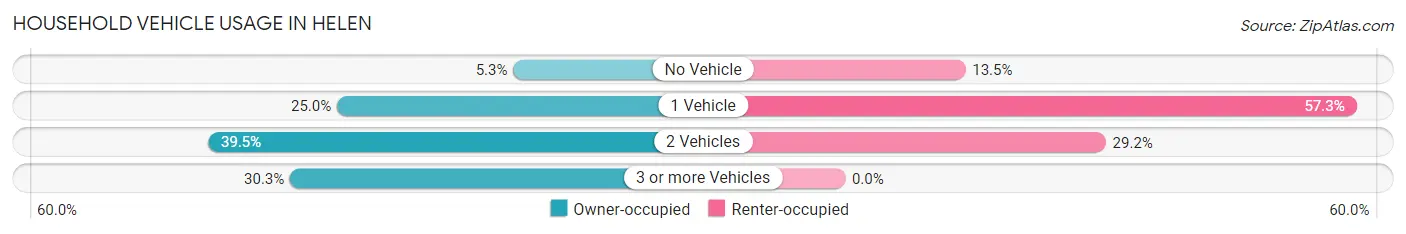
| Vehicles per Household | Owner-occupied | Renter-occupied |
| No Vehicle | 8 (5.3%) | 12 (13.5%) |
| 1 Vehicle | 38 (25.0%) | 51 (57.3%) |
| 2 Vehicles | 60 (39.5%) | 26 (29.2%) |
| 3 or more Vehicles | 46 (30.3%) | 0 (0.0%) |
| Total | 152 (100.0%) | 89 (100.0%) |
Real Estate & Mortgages in Helen
Real Estate and Mortgage Overview in Helen
| Characteristic | Without Mortgage | With Mortgage |
| Housing Units | 76 | 76 |
| Median Property Value | $273,500 | $445,000 |
| Median Household Income | $86,250 | $23 |
| Monthly Housing Costs | $433 | $15 |
| Real Estate Taxes | $1,875 | $0 |
Property Value by Mortgage Status in Helen
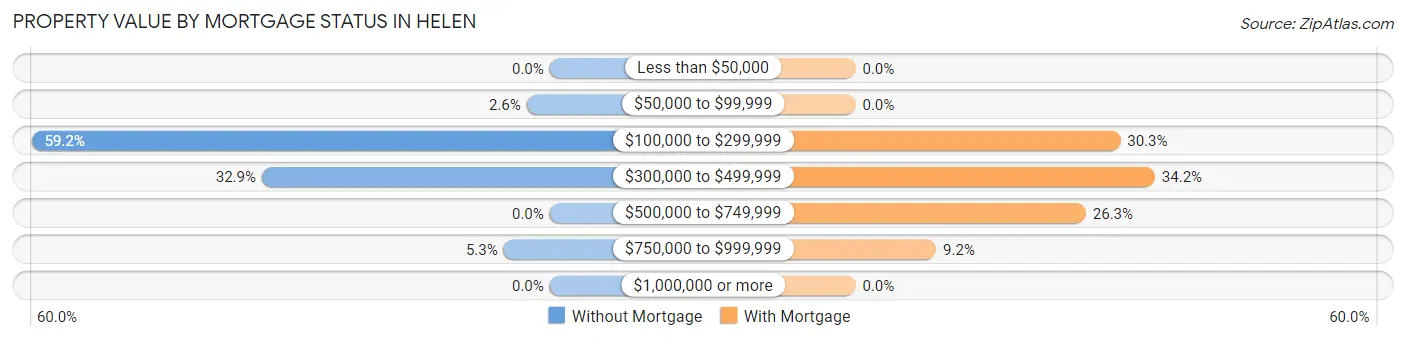
| Property Value | Without Mortgage | With Mortgage |
| Less than $50,000 | 0 (0.0%) | 0 (0.0%) |
| $50,000 to $99,999 | 2 (2.6%) | 0 (0.0%) |
| $100,000 to $299,999 | 45 (59.2%) | 23 (30.3%) |
| $300,000 to $499,999 | 25 (32.9%) | 26 (34.2%) |
| $500,000 to $749,999 | 0 (0.0%) | 20 (26.3%) |
| $750,000 to $999,999 | 4 (5.3%) | 7 (9.2%) |
| $1,000,000 or more | 0 (0.0%) | 0 (0.0%) |
| Total | 76 (100.0%) | 76 (100.0%) |
Household Income by Mortgage Status in Helen
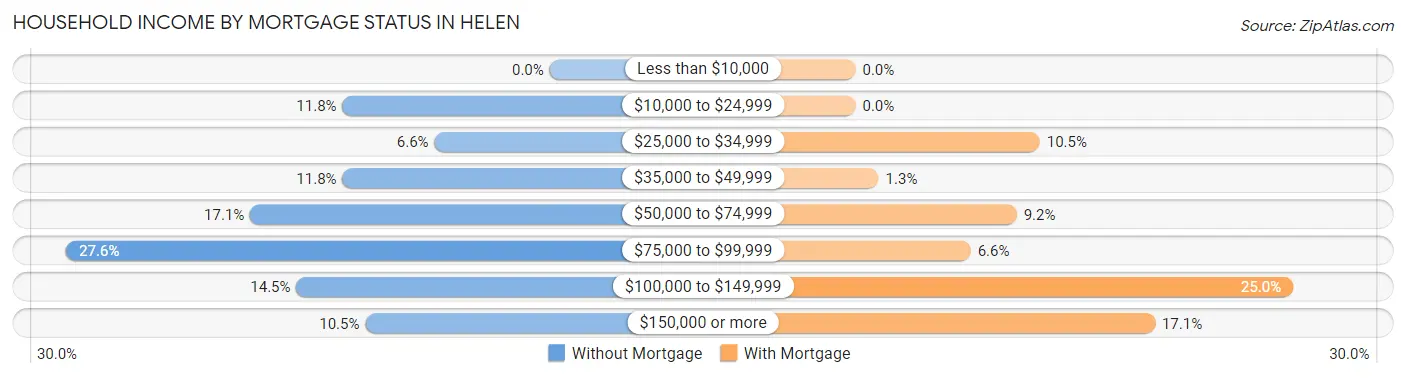
| Household Income | Without Mortgage | With Mortgage |
| Less than $10,000 | 0 (0.0%) | 0 (0.0%) |
| $10,000 to $24,999 | 9 (11.8%) | 0 (0.0%) |
| $25,000 to $34,999 | 5 (6.6%) | 8 (10.5%) |
| $35,000 to $49,999 | 9 (11.8%) | 1 (1.3%) |
| $50,000 to $74,999 | 13 (17.1%) | 7 (9.2%) |
| $75,000 to $99,999 | 21 (27.6%) | 5 (6.6%) |
| $100,000 to $149,999 | 11 (14.5%) | 19 (25.0%) |
| $150,000 or more | 8 (10.5%) | 13 (17.1%) |
| Total | 76 (100.0%) | 76 (100.0%) |
Property Value to Household Income Ratio in Helen
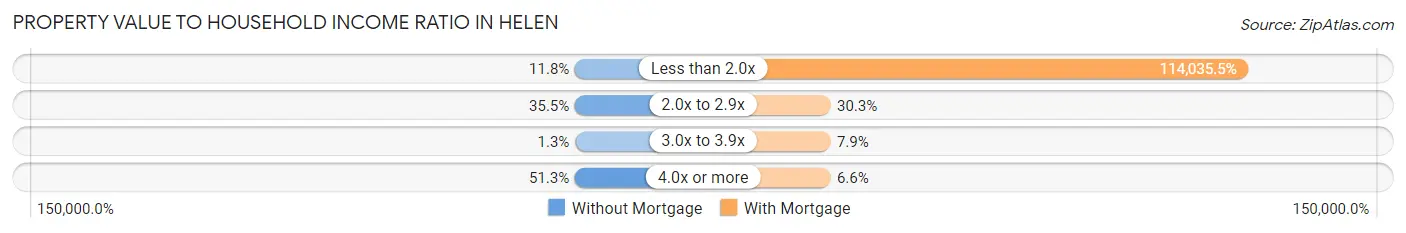
| Value-to-Income Ratio | Without Mortgage | With Mortgage |
| Less than 2.0x | 9 (11.8%) | 86,667 (114,035.5%) |
| 2.0x to 2.9x | 27 (35.5%) | 23 (30.3%) |
| 3.0x to 3.9x | 1 (1.3%) | 6 (7.9%) |
| 4.0x or more | 39 (51.3%) | 5 (6.6%) |
| Total | 76 (100.0%) | 76 (100.0%) |
Real Estate Taxes by Mortgage Status in Helen
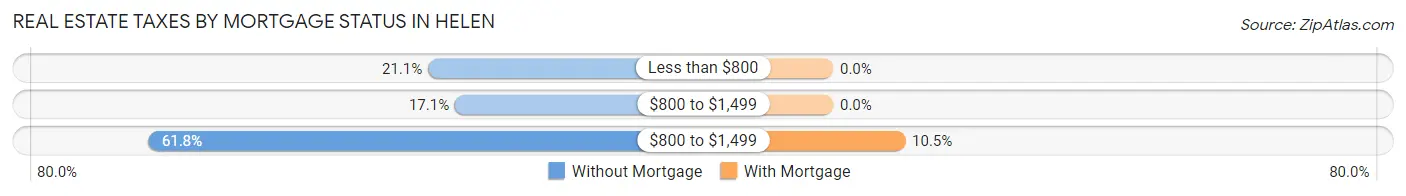
| Property Taxes | Without Mortgage | With Mortgage |
| Less than $800 | 16 (21.0%) | 0 (0.0%) |
| $800 to $1,499 | 13 (17.1%) | 0 (0.0%) |
| $800 to $1,499 | 47 (61.8%) | 8 (10.5%) |
| Total | 76 (100.0%) | 76 (100.0%) |
Health & Disability in Helen
Health Insurance Coverage by Age in Helen
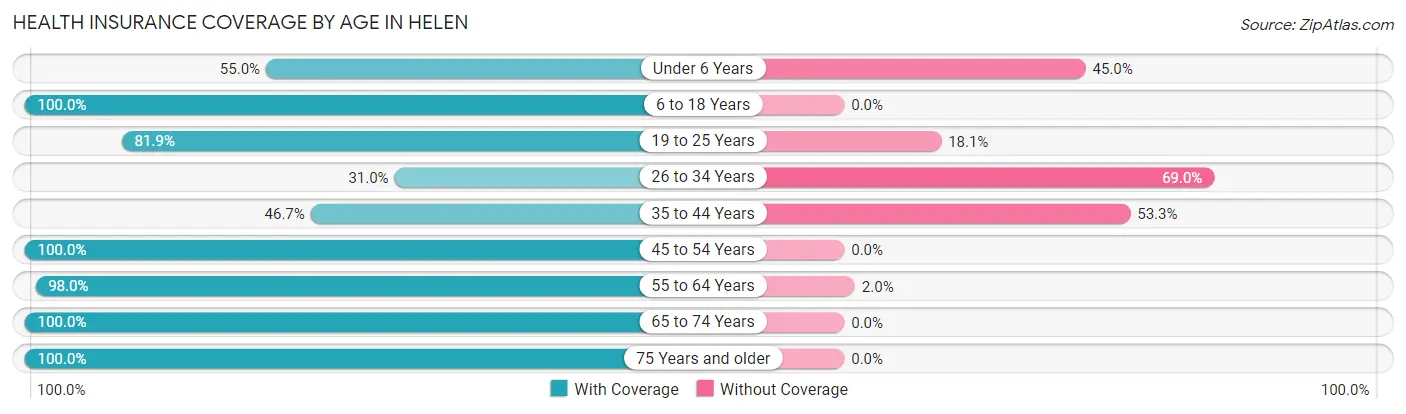
| Age Bracket | With Coverage | Without Coverage |
| Under 6 Years | 11 (55.0%) | 9 (45.0%) |
| 6 to 18 Years | 16 (100.0%) | 0 (0.0%) |
| 19 to 25 Years | 68 (81.9%) | 15 (18.1%) |
| 26 to 34 Years | 9 (31.0%) | 20 (69.0%) |
| 35 to 44 Years | 7 (46.7%) | 8 (53.3%) |
| 45 to 54 Years | 31 (100.0%) | 0 (0.0%) |
| 55 to 64 Years | 99 (98.0%) | 2 (2.0%) |
| 65 to 74 Years | 139 (100.0%) | 0 (0.0%) |
| 75 Years and older | 71 (100.0%) | 0 (0.0%) |
| Total | 451 (89.3%) | 54 (10.7%) |
Health Insurance Coverage by Citizenship Status in Helen
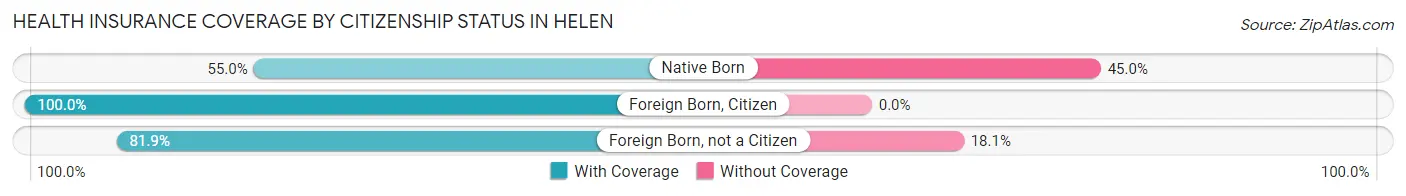
| Citizenship Status | With Coverage | Without Coverage |
| Native Born | 11 (55.0%) | 9 (45.0%) |
| Foreign Born, Citizen | 16 (100.0%) | 0 (0.0%) |
| Foreign Born, not a Citizen | 68 (81.9%) | 15 (18.1%) |
Health Insurance Coverage by Household Income in Helen
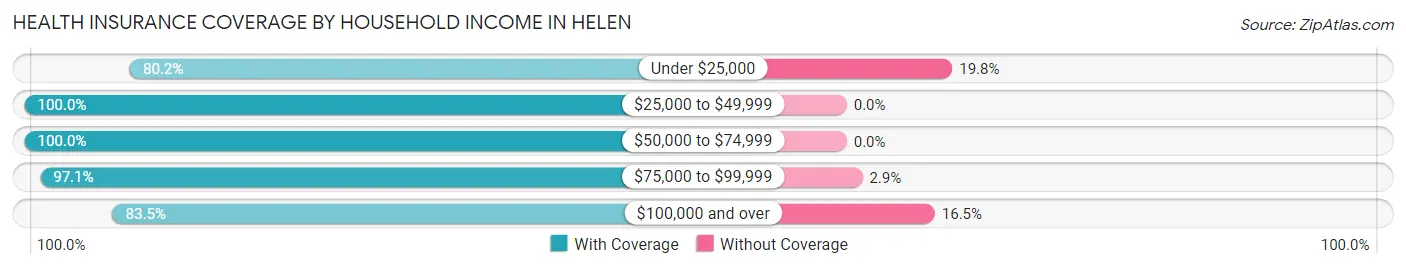
| Household Income | With Coverage | Without Coverage |
| Under $25,000 | 69 (80.2%) | 17 (19.8%) |
| $25,000 to $49,999 | 41 (100.0%) | 0 (0.0%) |
| $50,000 to $74,999 | 42 (100.0%) | 0 (0.0%) |
| $75,000 to $99,999 | 132 (97.1%) | 4 (2.9%) |
| $100,000 and over | 167 (83.5%) | 33 (16.5%) |
Public vs Private Health Insurance Coverage by Age in Helen
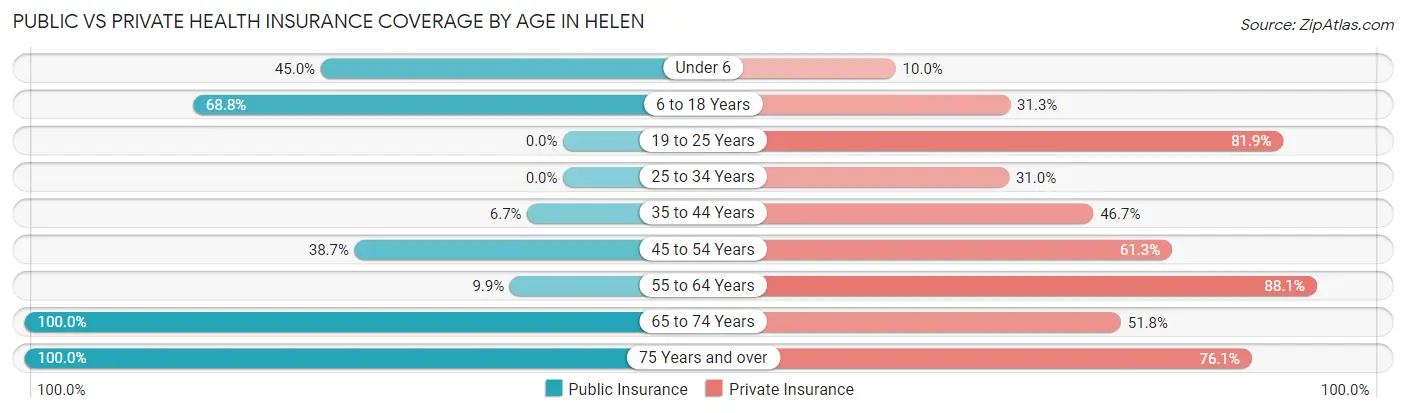
| Age Bracket | Public Insurance | Private Insurance |
| Under 6 | 9 (45.0%) | 2 (10.0%) |
| 6 to 18 Years | 11 (68.8%) | 5 (31.2%) |
| 19 to 25 Years | 0 (0.0%) | 68 (81.9%) |
| 25 to 34 Years | 0 (0.0%) | 9 (31.0%) |
| 35 to 44 Years | 1 (6.7%) | 7 (46.7%) |
| 45 to 54 Years | 12 (38.7%) | 19 (61.3%) |
| 55 to 64 Years | 10 (9.9%) | 89 (88.1%) |
| 65 to 74 Years | 139 (100.0%) | 72 (51.8%) |
| 75 Years and over | 71 (100.0%) | 54 (76.1%) |
| Total | 253 (50.1%) | 325 (64.4%) |
Disability Status by Sex by Age in Helen
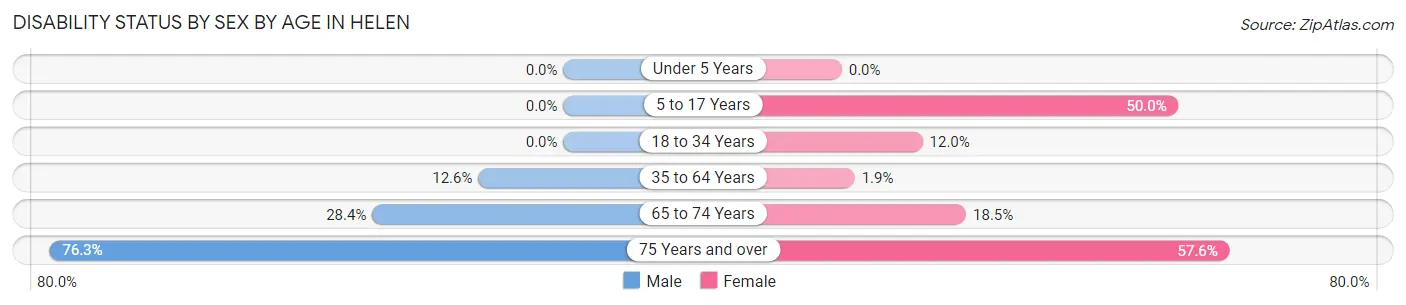
| Age Bracket | Male | Female |
| Under 5 Years | 0 (0.0%) | 0 (0.0%) |
| 5 to 17 Years | 0 (0.0%) | 1 (50.0%) |
| 18 to 34 Years | 0 (0.0%) | 3 (12.0%) |
| 35 to 64 Years | 12 (12.6%) | 1 (1.9%) |
| 65 to 74 Years | 21 (28.4%) | 12 (18.5%) |
| 75 Years and over | 29 (76.3%) | 19 (57.6%) |
Disability Class by Sex by Age in Helen
Disability Class: Hearing Difficulty
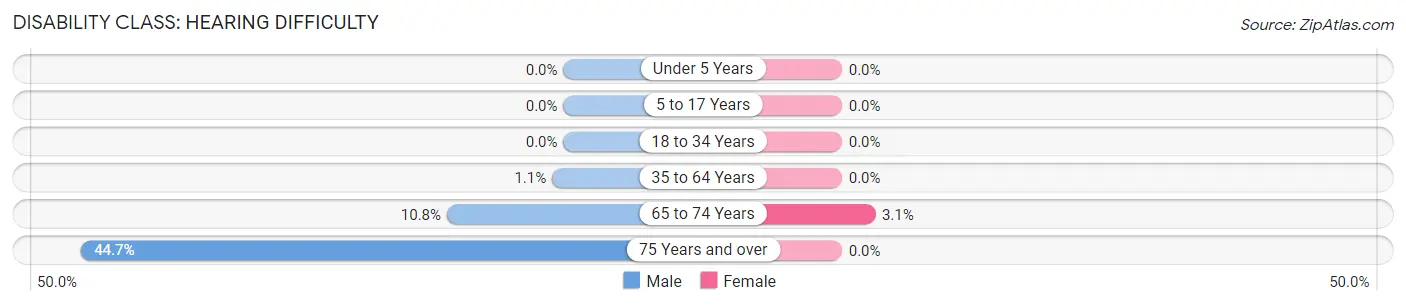
| Age Bracket | Male | Female |
| Under 5 Years | 0 (0.0%) | 0 (0.0%) |
| 5 to 17 Years | 0 (0.0%) | 0 (0.0%) |
| 18 to 34 Years | 0 (0.0%) | 0 (0.0%) |
| 35 to 64 Years | 1 (1.1%) | 0 (0.0%) |
| 65 to 74 Years | 8 (10.8%) | 2 (3.1%) |
| 75 Years and over | 17 (44.7%) | 0 (0.0%) |
Disability Class: Vision Difficulty
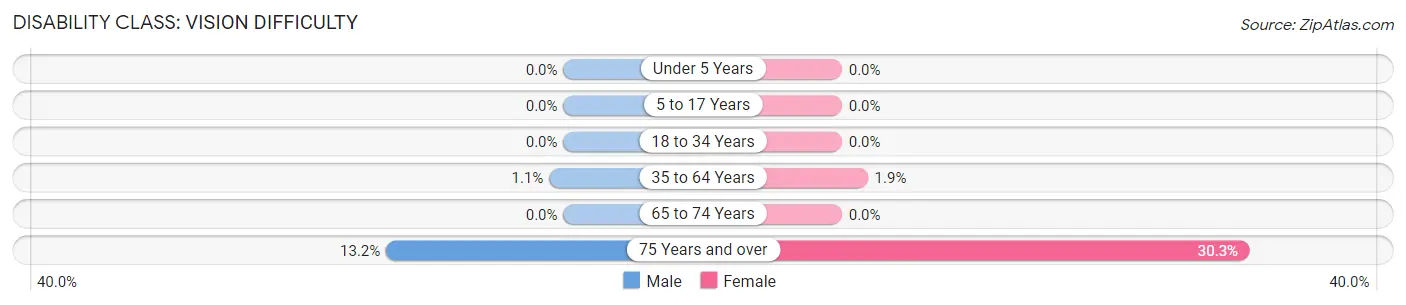
| Age Bracket | Male | Female |
| Under 5 Years | 0 (0.0%) | 0 (0.0%) |
| 5 to 17 Years | 0 (0.0%) | 0 (0.0%) |
| 18 to 34 Years | 0 (0.0%) | 0 (0.0%) |
| 35 to 64 Years | 1 (1.1%) | 1 (1.9%) |
| 65 to 74 Years | 0 (0.0%) | 0 (0.0%) |
| 75 Years and over | 5 (13.2%) | 10 (30.3%) |
Disability Class: Cognitive Difficulty
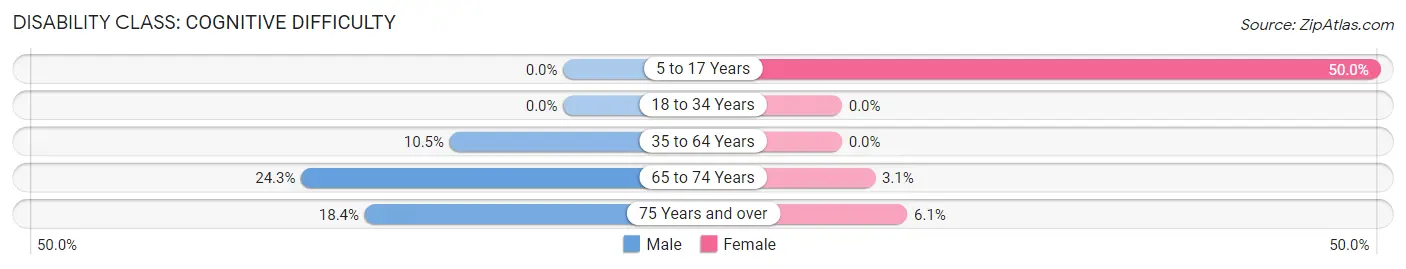
| Age Bracket | Male | Female |
| 5 to 17 Years | 0 (0.0%) | 1 (50.0%) |
| 18 to 34 Years | 0 (0.0%) | 0 (0.0%) |
| 35 to 64 Years | 10 (10.5%) | 0 (0.0%) |
| 65 to 74 Years | 18 (24.3%) | 2 (3.1%) |
| 75 Years and over | 7 (18.4%) | 2 (6.1%) |
Disability Class: Ambulatory Difficulty
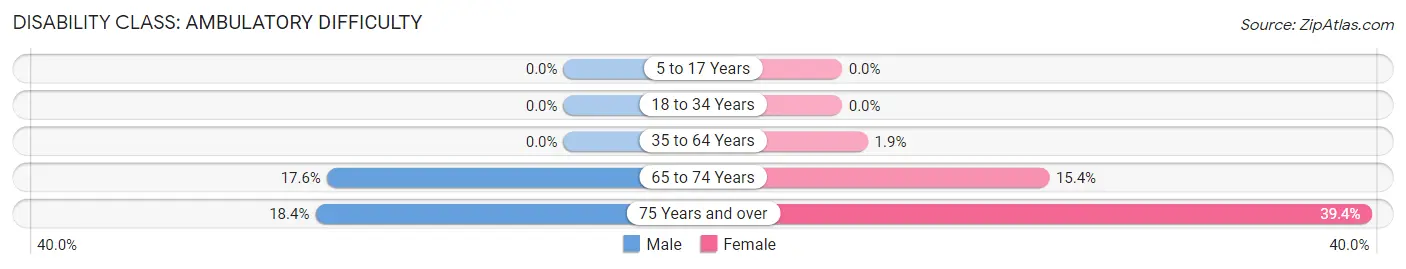
| Age Bracket | Male | Female |
| 5 to 17 Years | 0 (0.0%) | 0 (0.0%) |
| 18 to 34 Years | 0 (0.0%) | 0 (0.0%) |
| 35 to 64 Years | 0 (0.0%) | 1 (1.9%) |
| 65 to 74 Years | 13 (17.6%) | 10 (15.4%) |
| 75 Years and over | 7 (18.4%) | 13 (39.4%) |
Disability Class: Self-Care Difficulty
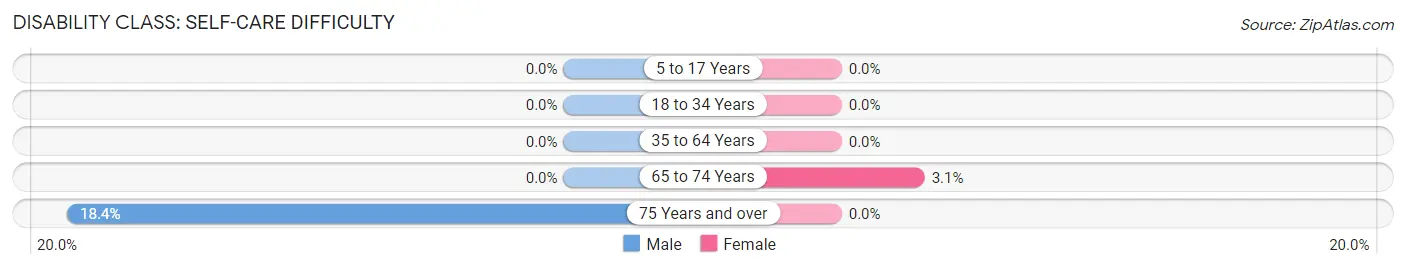
| Age Bracket | Male | Female |
| 5 to 17 Years | 0 (0.0%) | 0 (0.0%) |
| 18 to 34 Years | 0 (0.0%) | 0 (0.0%) |
| 35 to 64 Years | 0 (0.0%) | 0 (0.0%) |
| 65 to 74 Years | 0 (0.0%) | 2 (3.1%) |
| 75 Years and over | 7 (18.4%) | 0 (0.0%) |
Technology Access in Helen
Computing Device Access in Helen
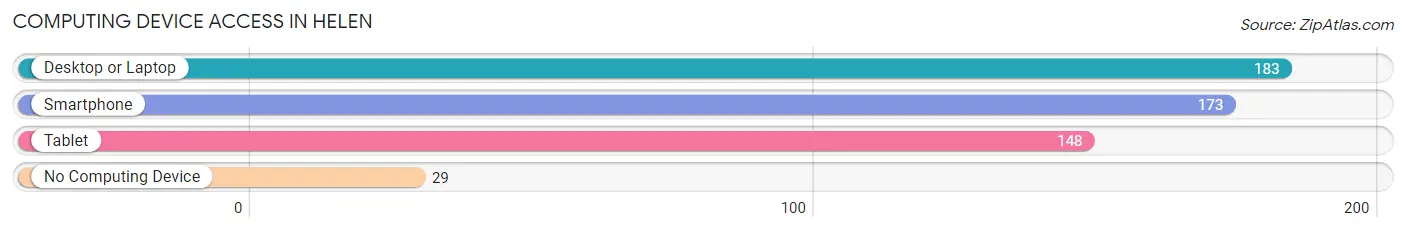
| Device Type | # Households | % Households |
| Desktop or Laptop | 183 | 75.9% |
| Smartphone | 173 | 71.8% |
| Tablet | 148 | 61.4% |
| No Computing Device | 29 | 12.0% |
| Total | 241 | 100.0% |
Internet Access in Helen
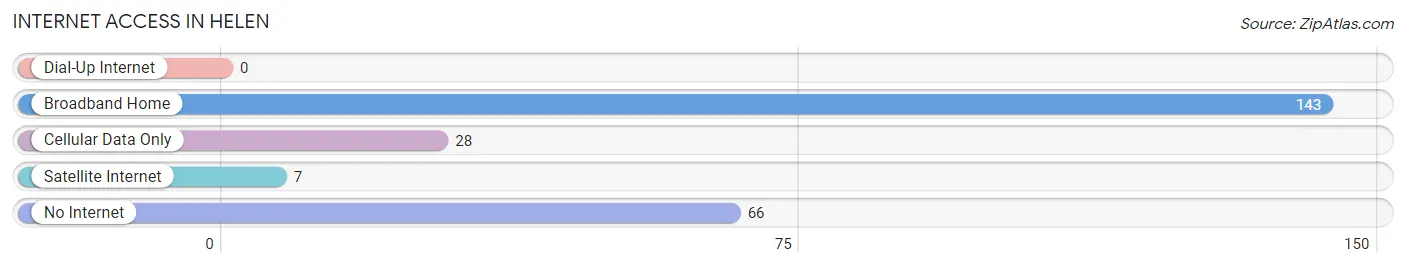
| Internet Type | # Households | % Households |
| Dial-Up Internet | 0 | 0.0% |
| Broadband Home | 143 | 59.3% |
| Cellular Data Only | 28 | 11.6% |
| Satellite Internet | 7 | 2.9% |
| No Internet | 66 | 27.4% |
| Total | 241 | 100.0% |
Helen Summary
Helen, Georgia is a small city located in the Blue Ridge Mountains of northeast Georgia. It is the county seat of White County and is situated along the Chattahoochee River. The city was founded in 1912 and is named after the daughter of a local businessman. It is known for its Bavarian-style architecture and is a popular tourist destination.
Geography
Helen is located in the Blue Ridge Mountains of northeast Georgia, approximately 90 miles north of Atlanta. It is situated along the Chattahoochee River and is surrounded by the Chattahoochee National Forest. The city has a total area of 1.7 square miles, all of which is land. The elevation of the city is 1,890 feet above sea level.
Climate
Helen has a humid subtropical climate, with hot, humid summers and mild winters. The average annual temperature is 61°F, with an average high of 76°F in July and an average low of 45°F in January. The average annual precipitation is 51 inches, with the wettest month being July, when an average of 6.5 inches of rain falls.
Demographics
As of the 2010 census, Helen had a population of 517 people. The racial makeup of the city was 97.3% White, 0.6% African American, 0.4% Native American, 0.2% Asian, 0.2% from other races, and 1.3% from two or more races. Hispanic or Latino of any race were 1.2% of the population.
Economy
Helen’s economy is largely based on tourism. The city is known for its Bavarian-style architecture and is a popular destination for visitors from all over the world. The city is home to several restaurants, shops, and attractions, including the Alpine Mini Golf and Go-Karts, the Helen Tubing and Water Park, and the Unicoi State Park and Lodge. The city also hosts several festivals throughout the year, including the annual Oktoberfest celebration.
In addition to tourism, Helen is home to several manufacturing companies, including a paper mill and a furniture factory. The city is also home to several small businesses, including restaurants, shops, and galleries.
Conclusion
Helen, Georgia is a small city located in the Blue Ridge Mountains of northeast Georgia. It is the county seat of White County and is situated along the Chattahoochee River. The city was founded in 1912 and is known for its Bavarian-style architecture and is a popular tourist destination. The economy of Helen is largely based on tourism, with several restaurants, shops, and attractions. The city is also home to several manufacturing companies and small businesses.
Common Questions
What is Per Capita Income in Helen?
Per Capita income in Helen is $44,324.
What is the Median Family Income in Helen?
Median Family Income in Helen is $96,944.
What is the Median Household income in Helen?
Median Household Income in Helen is $74,375.
What is Income or Wage Gap in Helen?
Income or Wage Gap in Helen is 4.2%.
Women in Helen earn 95.8 cents for every dollar earned by a man.
What is Inequality or Gini Index in Helen?
Inequality or Gini Index in Helen is 0.46.
What is the Total Population of Helen?
Total Population of Helen is 505.
What is the Total Male Population of Helen?
Total Male Population of Helen is 308.
What is the Total Female Population of Helen?
Total Female Population of Helen is 197.
What is the Ratio of Males per 100 Females in Helen?
There are 156.35 Males per 100 Females in Helen.
What is the Ratio of Females per 100 Males in Helen?
There are 63.96 Females per 100 Males in Helen.
What is the Median Population Age in Helen?
Median Population Age in Helen is 60.2 Years.
What is the Average Family Size in Helen
Average Family Size in Helen is 2.7 People.
What is the Average Household Size in Helen
Average Household Size in Helen is 2.1 People.
How Large is the Labor Force in Helen?
There are 234 People in the Labor Forcein in Helen.
What is the Percentage of People in the Labor Force in Helen?
49.3% of People are in the Labor Force in Helen.
What is the Unemployment Rate in Helen?
Unemployment Rate in Helen is 2.1%.