Gumlog, GA Map & Demographics
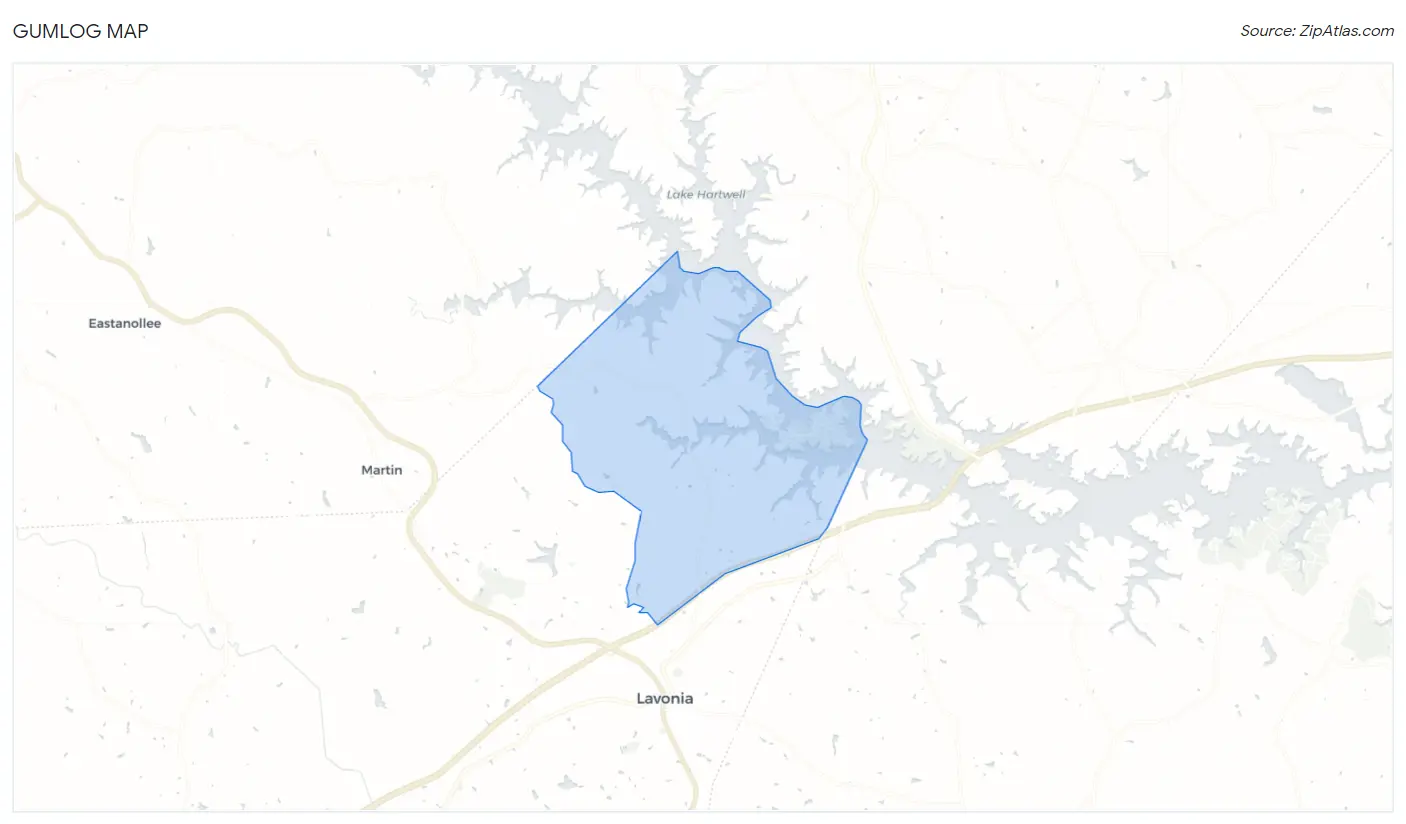
Gumlog Map
Gumlog Overview
$41,223
PER CAPITA INCOME
$73,401
AVG FAMILY INCOME
$63,735
AVG HOUSEHOLD INCOME
59.2%
WAGE / INCOME GAP [ % ]
40.8¢/ $1
WAGE / INCOME GAP [ $ ]
0.52
INEQUALITY / GINI INDEX
2,212
TOTAL POPULATION
1,102
MALE POPULATION
1,110
FEMALE POPULATION
99.28
MALES / 100 FEMALES
100.73
FEMALES / 100 MALES
54.1
MEDIAN AGE
2.8
AVG FAMILY SIZE
2.4
AVG HOUSEHOLD SIZE
987
LABOR FORCE [ PEOPLE ]
50.1%
PERCENT IN LABOR FORCE
5.0%
UNEMPLOYMENT RATE
Income in Gumlog
Income Overview in Gumlog
Per Capita Income in Gumlog is $41,223, while median incomes of families and households are $73,401 and $63,735 respectively.
| Characteristic | Number | Measure |
| Per Capita Income | 2,212 | $41,223 |
| Median Family Income | 647 | $73,401 |
| Mean Family Income | 647 | $104,150 |
| Median Household Income | 910 | $63,735 |
| Mean Household Income | 910 | $95,853 |
| Income Deficit | 647 | $0 |
| Wage / Income Gap (%) | 2,212 | 59.24% |
| Wage / Income Gap ($) | 2,212 | 40.76¢ per $1 |
| Gini / Inequality Index | 2,212 | 0.52 |
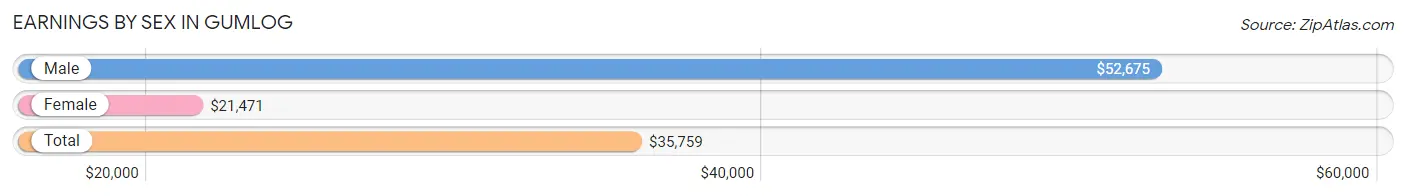
Earnings by Sex in Gumlog
Average Earnings in Gumlog are $35,759, $52,675 for men and $21,471 for women, a difference of 59.2%.
| Sex | Number | Average Earnings |
| Male | 559 (50.2%) | $52,675 |
| Female | 554 (49.8%) | $21,471 |
| Total | 1,113 (100.0%) | $35,759 |
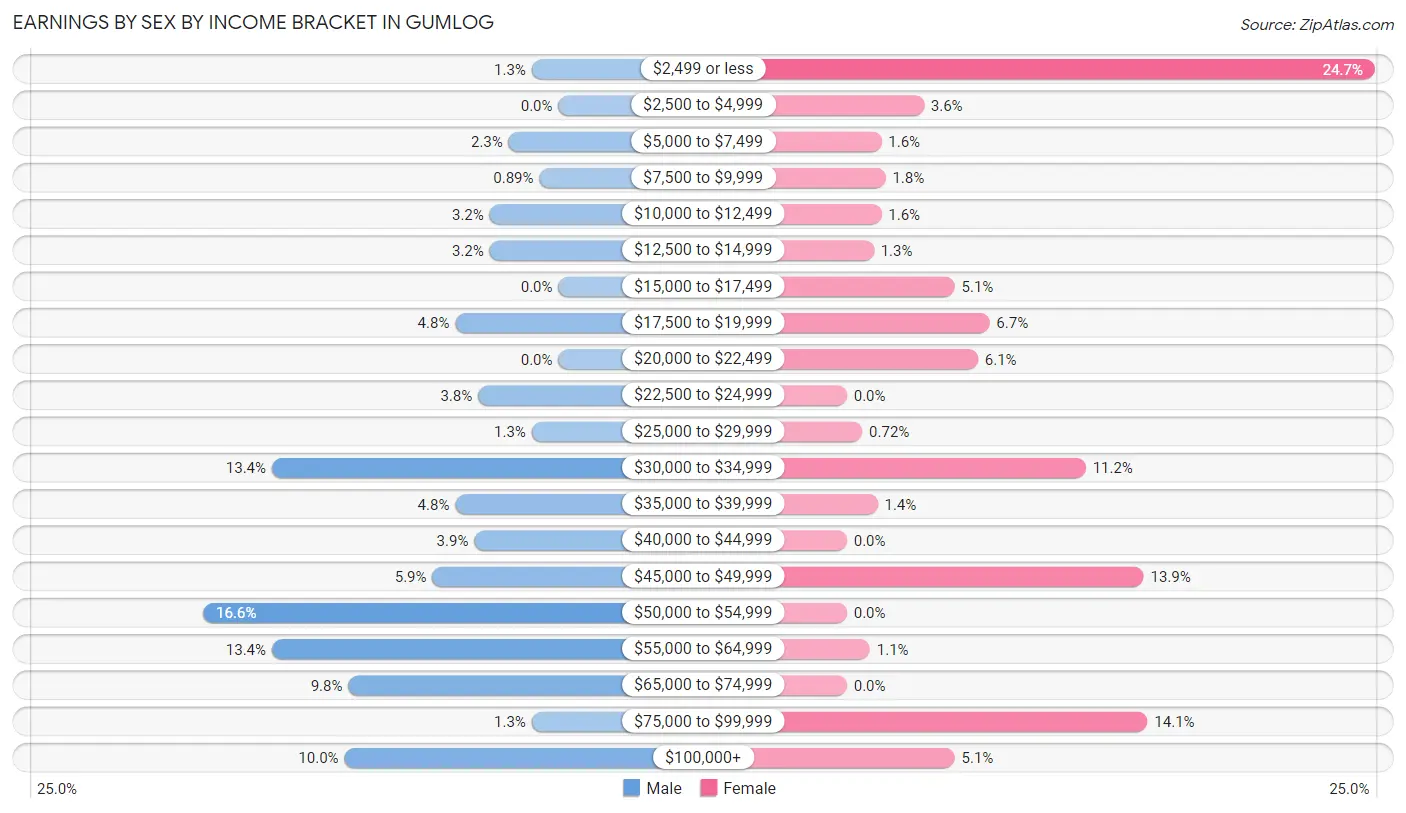
Earnings by Sex by Income Bracket in Gumlog
The most common earnings brackets in Gumlog are $50,000 to $54,999 for men (93 | 16.6%) and $2,499 or less for women (137 | 24.7%).
| Income | Male | Female |
| $2,499 or less | 7 (1.3%) | 137 (24.7%) |
| $2,500 to $4,999 | 0 (0.0%) | 20 (3.6%) |
| $5,000 to $7,499 | 13 (2.3%) | 9 (1.6%) |
| $7,500 to $9,999 | 5 (0.9%) | 10 (1.8%) |
| $10,000 to $12,499 | 18 (3.2%) | 9 (1.6%) |
| $12,500 to $14,999 | 18 (3.2%) | 7 (1.3%) |
| $15,000 to $17,499 | 0 (0.0%) | 28 (5.1%) |
| $17,500 to $19,999 | 27 (4.8%) | 37 (6.7%) |
| $20,000 to $22,499 | 0 (0.0%) | 34 (6.1%) |
| $22,500 to $24,999 | 21 (3.8%) | 0 (0.0%) |
| $25,000 to $29,999 | 7 (1.3%) | 4 (0.7%) |
| $30,000 to $34,999 | 75 (13.4%) | 62 (11.2%) |
| $35,000 to $39,999 | 27 (4.8%) | 8 (1.4%) |
| $40,000 to $44,999 | 22 (3.9%) | 0 (0.0%) |
| $45,000 to $49,999 | 33 (5.9%) | 77 (13.9%) |
| $50,000 to $54,999 | 93 (16.6%) | 0 (0.0%) |
| $55,000 to $64,999 | 75 (13.4%) | 6 (1.1%) |
| $65,000 to $74,999 | 55 (9.8%) | 0 (0.0%) |
| $75,000 to $99,999 | 7 (1.3%) | 78 (14.1%) |
| $100,000+ | 56 (10.0%) | 28 (5.1%) |
| Total | 559 (100.0%) | 554 (100.0%) |
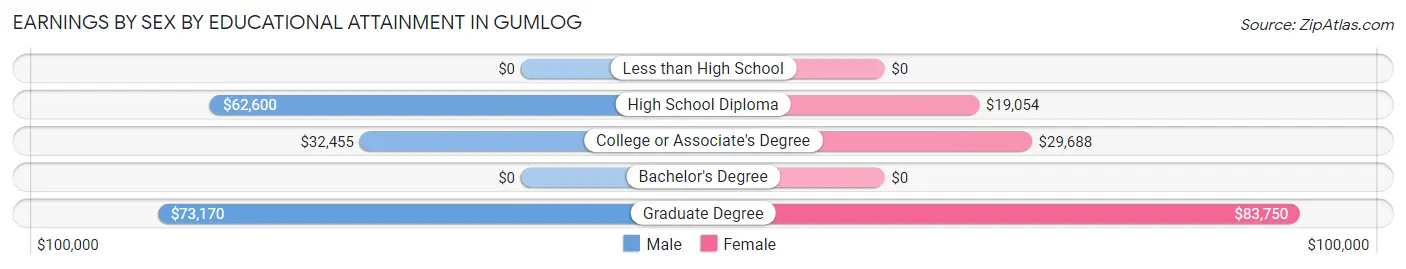
Earnings by Sex by Educational Attainment in Gumlog
Average earnings in Gumlog are $52,675 for men and $22,463 for women, a difference of 57.4%. Men with an educational attainment of graduate degree enjoy the highest average annual earnings of $73,170, while those with college or associate's degree education earn the least with $32,455. Women with an educational attainment of graduate degree earn the most with the average annual earnings of $83,750, while those with high school diploma education have the smallest earnings of $19,054.
| Educational Attainment | Male Income | Female Income |
| Less than High School | - | - |
| High School Diploma | $62,600 | $19,054 |
| College or Associate's Degree | $32,455 | $29,688 |
| Bachelor's Degree | - | - |
| Graduate Degree | $73,170 | $83,750 |
| Total | $52,675 | $22,463 |
Family Income in Gumlog
Family Income Brackets in Gumlog
According to the Gumlog family income data, there are 204 families falling into the $50,000 to $74,999 income range, which is the most common income bracket and makes up 31.5% of all families. Conversely, the $25,000 to $34,999 income bracket is the least frequent group with only 7 families (1.1%) belonging to this category.
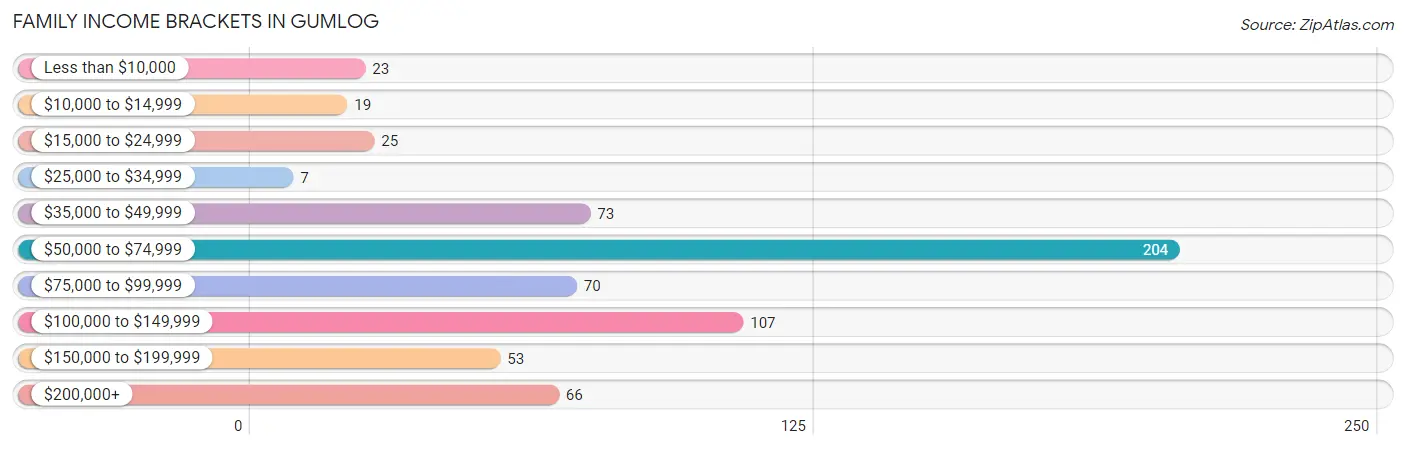
| Income Bracket | # Families | % Families |
| Less than $10,000 | 23 | 3.6% |
| $10,000 to $14,999 | 19 | 2.9% |
| $15,000 to $24,999 | 25 | 3.9% |
| $25,000 to $34,999 | 7 | 1.1% |
| $35,000 to $49,999 | 73 | 11.3% |
| $50,000 to $74,999 | 204 | 31.5% |
| $75,000 to $99,999 | 70 | 10.8% |
| $100,000 to $149,999 | 107 | 16.5% |
| $150,000 to $199,999 | 53 | 8.2% |
| $200,000+ | 66 | 10.2% |
Family Income by Famaliy Size in Gumlog
4-person families (46 | 7.1%) account for the highest median family income in Gumlog with $108,611 per family, while 3-person families (124 | 19.2%) have the highest median income of $36,017 per family member.
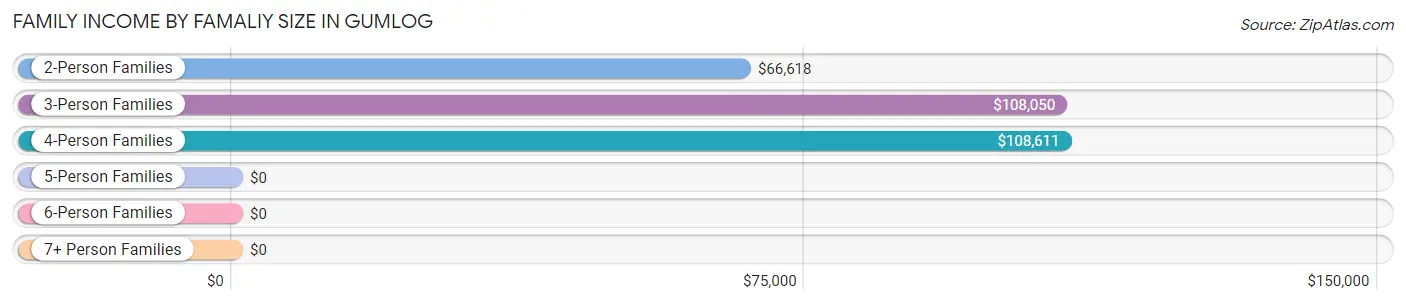
| Income Bracket | # Families | Median Income |
| 2-Person Families | 442 (68.3%) | $66,618 |
| 3-Person Families | 124 (19.2%) | $108,050 |
| 4-Person Families | 46 (7.1%) | $108,611 |
| 5-Person Families | 25 (3.9%) | $0 |
| 6-Person Families | 0 (0.0%) | $0 |
| 7+ Person Families | 10 (1.5%) | $0 |
| Total | 647 (100.0%) | $73,401 |
Family Income by Number of Earners in Gumlog
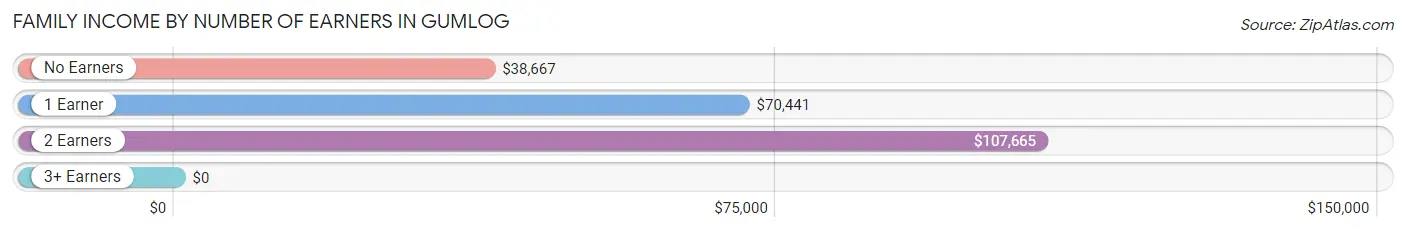
| Number of Earners | # Families | Median Income |
| No Earners | 168 (26.0%) | $38,667 |
| 1 Earner | 138 (21.3%) | $70,441 |
| 2 Earners | 307 (47.4%) | $107,665 |
| 3+ Earners | 34 (5.3%) | $0 |
| Total | 647 (100.0%) | $73,401 |
Household Income in Gumlog
Household Income Brackets in Gumlog
With 249 households falling in the category, the $50,000 to $74,999 income range is the most frequent in Gumlog, accounting for 27.4% of all households. In contrast, only 29 households (3.2%) fall into the $10,000 to $14,999 income bracket, making it the least populous group.
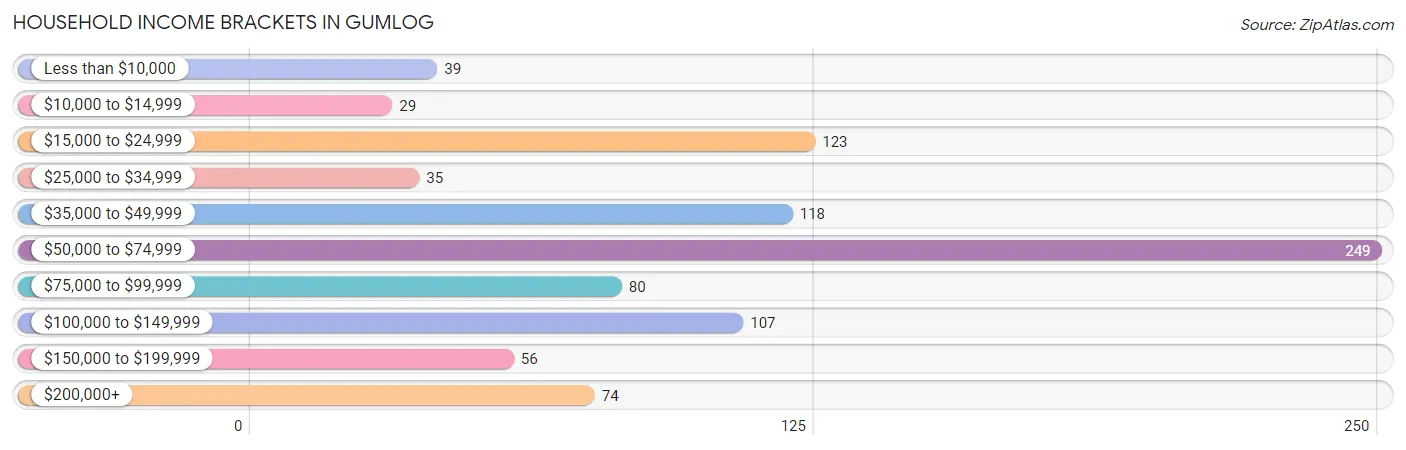
| Income Bracket | # Households | % Households |
| Less than $10,000 | 39 | 4.3% |
| $10,000 to $14,999 | 29 | 3.2% |
| $15,000 to $24,999 | 123 | 13.5% |
| $25,000 to $34,999 | 35 | 3.8% |
| $35,000 to $49,999 | 118 | 13.0% |
| $50,000 to $74,999 | 249 | 27.4% |
| $75,000 to $99,999 | 80 | 8.8% |
| $100,000 to $149,999 | 107 | 11.8% |
| $150,000 to $199,999 | 56 | 6.2% |
| $200,000+ | 74 | 8.1% |
Household Income by Householder Age in Gumlog
The median household income in Gumlog is $63,735, with the highest median household income of $74,155 found in the 25 to 44 years age bracket for the primary householder. A total of 213 households (23.4%) fall into this category.
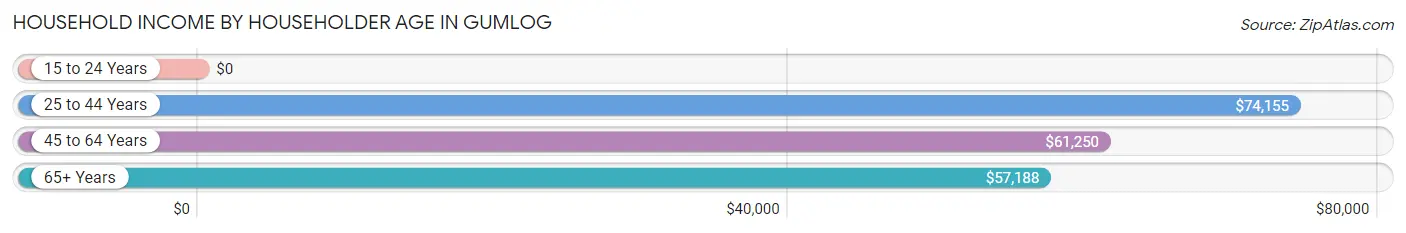
| Income Bracket | # Households | Median Income |
| 15 to 24 Years | 0 (0.0%) | $0 |
| 25 to 44 Years | 213 (23.4%) | $74,155 |
| 45 to 64 Years | 367 (40.3%) | $61,250 |
| 65+ Years | 330 (36.3%) | $57,188 |
| Total | 910 (100.0%) | $63,735 |
Poverty in Gumlog
Income Below Poverty by Sex and Age in Gumlog
With 12.3% poverty level for males and 11.6% for females among the residents of Gumlog, 35 to 44 year old males and 45 to 54 year old females are the most vulnerable to poverty, with 87 males (44.9%) and 60 females (43.5%) in their respective age groups living below the poverty level.
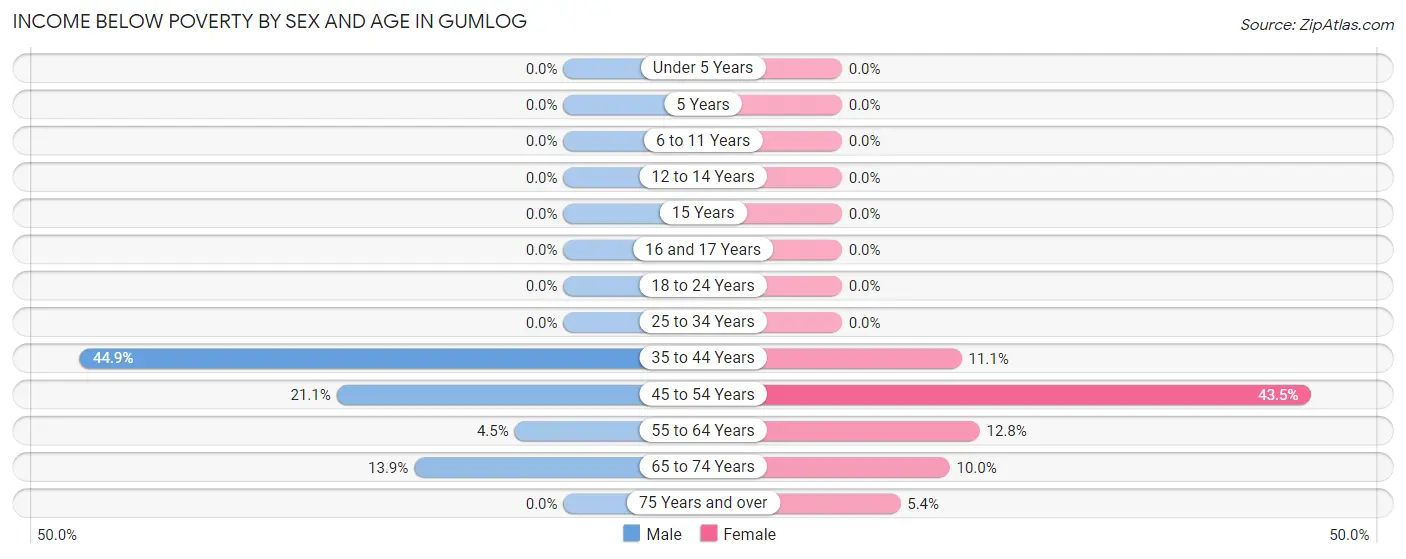
| Age Bracket | Male | Female |
| Under 5 Years | 0 (0.0%) | 0 (0.0%) |
| 5 Years | 0 (0.0%) | 0 (0.0%) |
| 6 to 11 Years | 0 (0.0%) | 0 (0.0%) |
| 12 to 14 Years | 0 (0.0%) | 0 (0.0%) |
| 15 Years | 0 (0.0%) | 0 (0.0%) |
| 16 and 17 Years | 0 (0.0%) | 0 (0.0%) |
| 18 to 24 Years | 0 (0.0%) | 0 (0.0%) |
| 25 to 34 Years | 0 (0.0%) | 0 (0.0%) |
| 35 to 44 Years | 87 (44.9%) | 12 (11.1%) |
| 45 to 54 Years | 20 (21.0%) | 60 (43.5%) |
| 55 to 64 Years | 11 (4.5%) | 33 (12.8%) |
| 65 to 74 Years | 18 (13.9%) | 11 (10.0%) |
| 75 Years and over | 0 (0.0%) | 12 (5.4%) |
| Total | 136 (12.3%) | 128 (11.6%) |
Income Above Poverty by Sex and Age in Gumlog
According to the poverty statistics in Gumlog, males aged under 5 years and females aged under 5 years are the age groups that are most secure financially, with 100.0% of males and 100.0% of females in these age groups living above the poverty line.
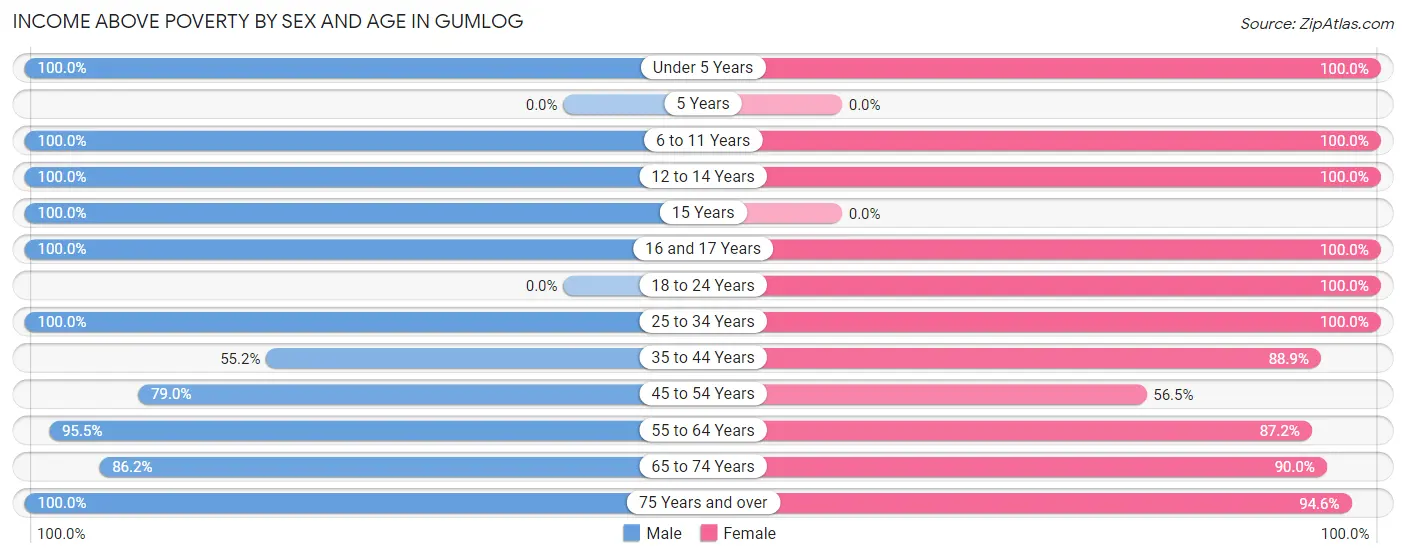
| Age Bracket | Male | Female |
| Under 5 Years | 49 (100.0%) | 6 (100.0%) |
| 5 Years | 0 (0.0%) | 0 (0.0%) |
| 6 to 11 Years | 50 (100.0%) | 63 (100.0%) |
| 12 to 14 Years | 21 (100.0%) | 26 (100.0%) |
| 15 Years | 16 (100.0%) | 0 (0.0%) |
| 16 and 17 Years | 29 (100.0%) | 18 (100.0%) |
| 18 to 24 Years | 0 (0.0%) | 9 (100.0%) |
| 25 to 34 Years | 168 (100.0%) | 143 (100.0%) |
| 35 to 44 Years | 107 (55.1%) | 96 (88.9%) |
| 45 to 54 Years | 75 (78.9%) | 78 (56.5%) |
| 55 to 64 Years | 232 (95.5%) | 225 (87.2%) |
| 65 to 74 Years | 112 (86.2%) | 99 (90.0%) |
| 75 Years and over | 107 (100.0%) | 209 (94.6%) |
| Total | 966 (87.7%) | 972 (88.4%) |
Income Below Poverty Among Married-Couple Families in Gumlog
The poverty statistics for married-couple families in Gumlog show that 5.8% or 34 of the total 588 families live below the poverty line. Families with no children have the highest poverty rate of 8.1%, comprising of 34 families. On the other hand, families with 1 or 2 children have the lowest poverty rate of 0.0%, which includes 0 families.
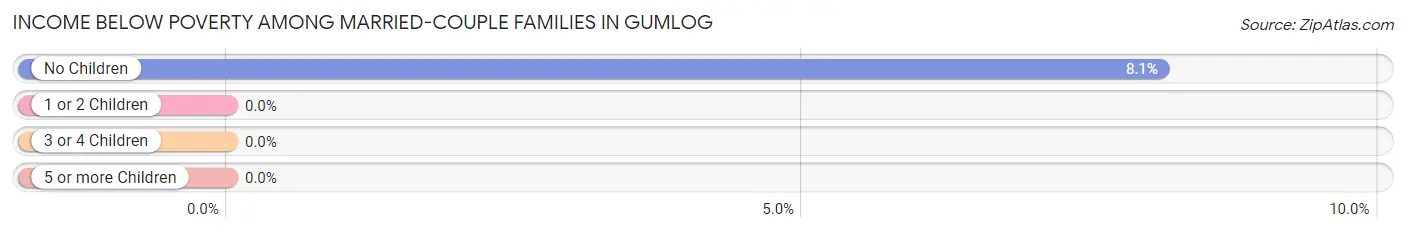
| Children | Above Poverty | Below Poverty |
| No Children | 385 (91.9%) | 34 (8.1%) |
| 1 or 2 Children | 159 (100.0%) | 0 (0.0%) |
| 3 or 4 Children | 0 (0.0%) | 0 (0.0%) |
| 5 or more Children | 10 (100.0%) | 0 (0.0%) |
| Total | 554 (94.2%) | 34 (5.8%) |
Income Below Poverty Among Single-Parent Households in Gumlog
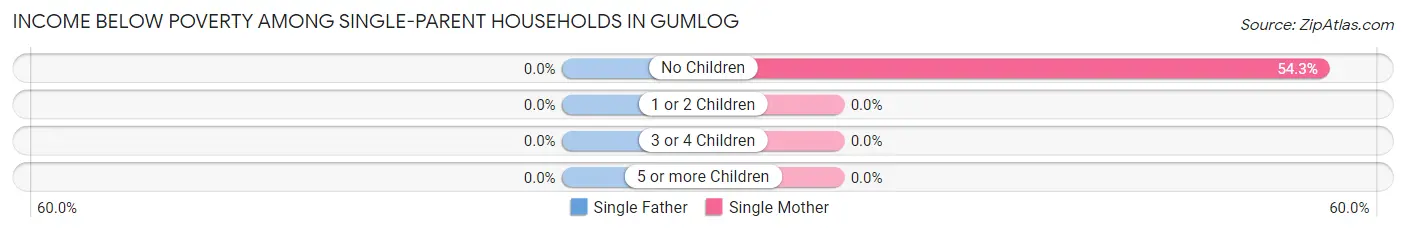
| Children | Single Father | Single Mother |
| No Children | 0 (0.0%) | 19 (54.3%) |
| 1 or 2 Children | 0 (0.0%) | 0 (0.0%) |
| 3 or 4 Children | 0 (0.0%) | 0 (0.0%) |
| 5 or more Children | 0 (0.0%) | 0 (0.0%) |
| Total | 0 (0.0%) | 19 (45.2%) |
Income Below Poverty Among Married-Couple vs Single-Parent Households in Gumlog
The poverty data for Gumlog shows that 34 of the married-couple family households (5.8%) and 19 of the single-parent households (32.2%) are living below the poverty level. Within the married-couple family households, those with no children have the highest poverty rate, with 34 households (8.1%) falling below the poverty line. Among the single-parent households, those with no children have the highest poverty rate, with 19 household (41.3%) living below poverty.
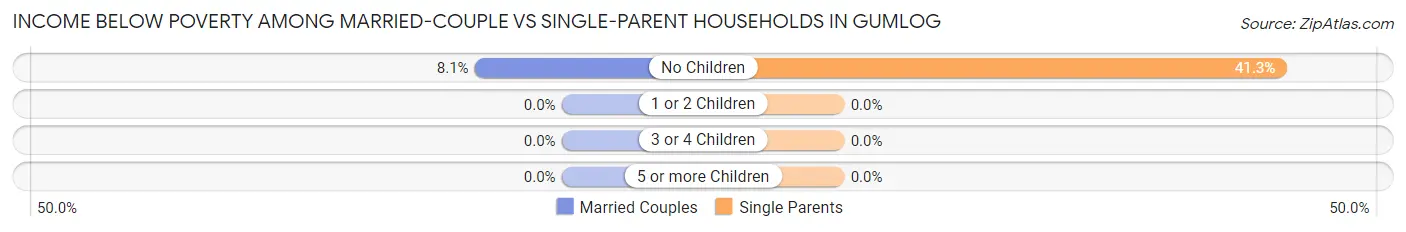
| Children | Married-Couple Families | Single-Parent Households |
| No Children | 34 (8.1%) | 19 (41.3%) |
| 1 or 2 Children | 0 (0.0%) | 0 (0.0%) |
| 3 or 4 Children | 0 (0.0%) | 0 (0.0%) |
| 5 or more Children | 0 (0.0%) | 0 (0.0%) |
| Total | 34 (5.8%) | 19 (32.2%) |
Race in Gumlog
The most populous races in Gumlog are White / Caucasian (1,922 | 86.9%), Black / African American (171 | 7.7%), and Two or more Races (106 | 4.8%).
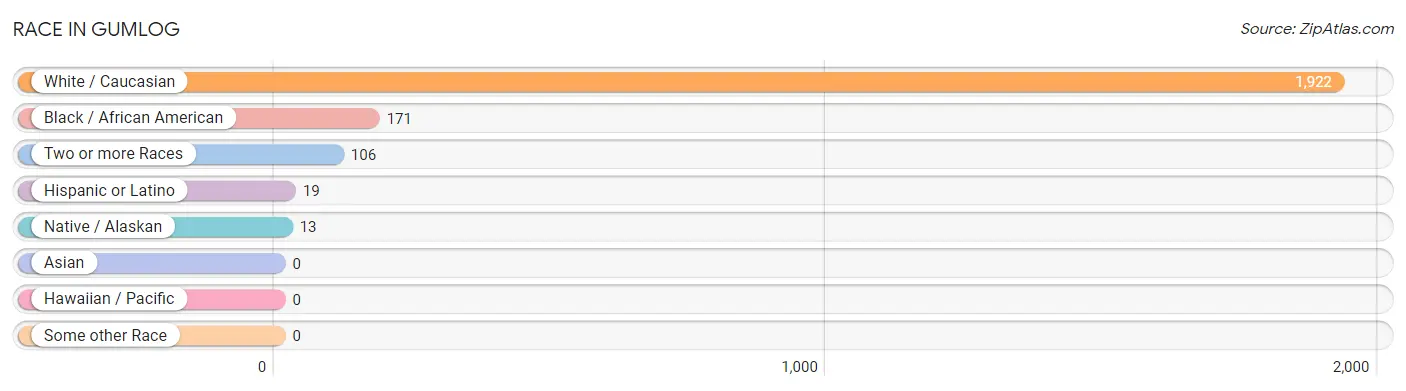
| Race | # Population | % Population |
| Asian | 0 | 0.0% |
| Black / African American | 171 | 7.7% |
| Hawaiian / Pacific | 0 | 0.0% |
| Hispanic or Latino | 19 | 0.9% |
| Native / Alaskan | 13 | 0.6% |
| White / Caucasian | 1,922 | 86.9% |
| Two or more Races | 106 | 4.8% |
| Some other Race | 0 | 0.0% |
| Total | 2,212 | 100.0% |
Ancestry in Gumlog
The most populous ancestries reported in Gumlog are American (380 | 17.2%), English (266 | 12.0%), Irish (206 | 9.3%), African (98 | 4.4%), and Subsaharan African (98 | 4.4%), together accounting for 47.4% of all Gumlog residents.
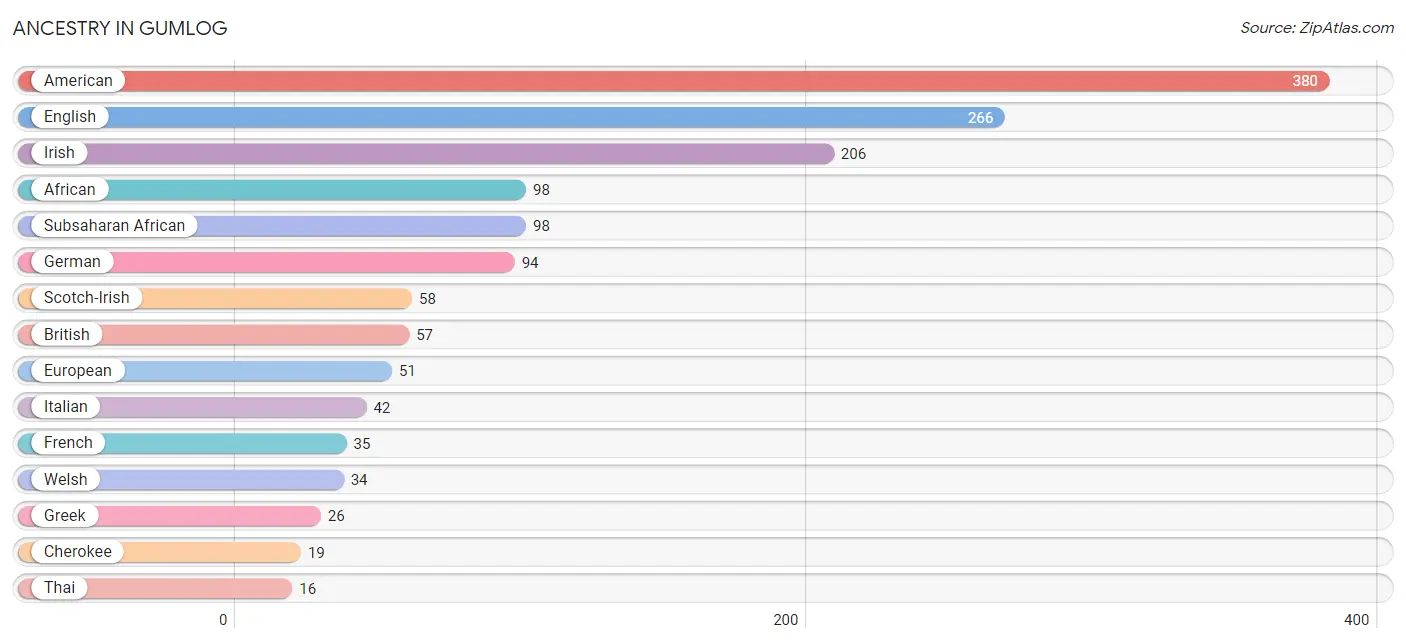
| Ancestry | # Population | % Population |
| African | 98 | 4.4% |
| American | 380 | 17.2% |
| Arab | 12 | 0.5% |
| Austrian | 9 | 0.4% |
| British | 57 | 2.6% |
| Cherokee | 19 | 0.9% |
| Dutch | 10 | 0.4% |
| Eastern European | 6 | 0.3% |
| English | 266 | 12.0% |
| European | 51 | 2.3% |
| French | 35 | 1.6% |
| German | 94 | 4.3% |
| Greek | 26 | 1.2% |
| Irish | 206 | 9.3% |
| Italian | 42 | 1.9% |
| Lebanese | 12 | 0.5% |
| Mexican | 10 | 0.4% |
| Polish | 14 | 0.6% |
| Russian | 8 | 0.4% |
| Scotch-Irish | 58 | 2.6% |
| Spaniard | 9 | 0.4% |
| Subsaharan African | 98 | 4.4% |
| Swedish | 9 | 0.4% |
| Thai | 16 | 0.7% |
| Turkish | 8 | 0.4% |
| Welsh | 34 | 1.5% | View All 26 Rows |
Immigrants in Gumlog

| Immigration Origin | # Population | % Population | View All 0 Rows |
Sex and Age in Gumlog
Sex and Age in Gumlog
The most populous age groups in Gumlog are 55 to 59 Years (149 | 13.5%) for men and 60 to 64 Years (132 | 11.9%) for women.
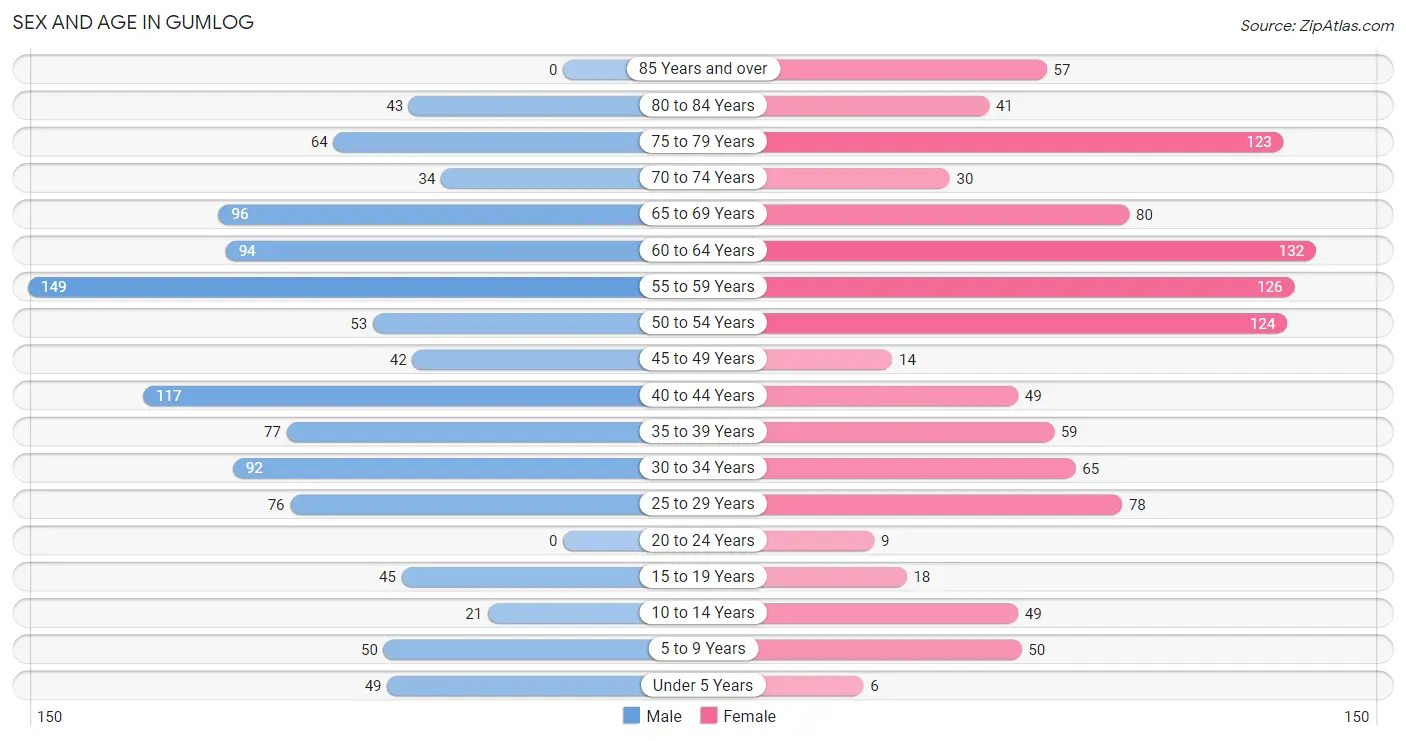
| Age Bracket | Male | Female |
| Under 5 Years | 49 (4.4%) | 6 (0.5%) |
| 5 to 9 Years | 50 (4.5%) | 50 (4.5%) |
| 10 to 14 Years | 21 (1.9%) | 49 (4.4%) |
| 15 to 19 Years | 45 (4.1%) | 18 (1.6%) |
| 20 to 24 Years | 0 (0.0%) | 9 (0.8%) |
| 25 to 29 Years | 76 (6.9%) | 78 (7.0%) |
| 30 to 34 Years | 92 (8.4%) | 65 (5.9%) |
| 35 to 39 Years | 77 (7.0%) | 59 (5.3%) |
| 40 to 44 Years | 117 (10.6%) | 49 (4.4%) |
| 45 to 49 Years | 42 (3.8%) | 14 (1.3%) |
| 50 to 54 Years | 53 (4.8%) | 124 (11.2%) |
| 55 to 59 Years | 149 (13.5%) | 126 (11.4%) |
| 60 to 64 Years | 94 (8.5%) | 132 (11.9%) |
| 65 to 69 Years | 96 (8.7%) | 80 (7.2%) |
| 70 to 74 Years | 34 (3.1%) | 30 (2.7%) |
| 75 to 79 Years | 64 (5.8%) | 123 (11.1%) |
| 80 to 84 Years | 43 (3.9%) | 41 (3.7%) |
| 85 Years and over | 0 (0.0%) | 57 (5.1%) |
| Total | 1,102 (100.0%) | 1,110 (100.0%) |
Families and Households in Gumlog
Median Family Size in Gumlog
The median family size in Gumlog is 2.77 persons per family, with single female/mother families (42 | 6.5%) accounting for the largest median family size of 4.52 persons per family. On the other hand, married-couple families (588 | 90.9%) represent the smallest median family size with 2.62 persons per family.
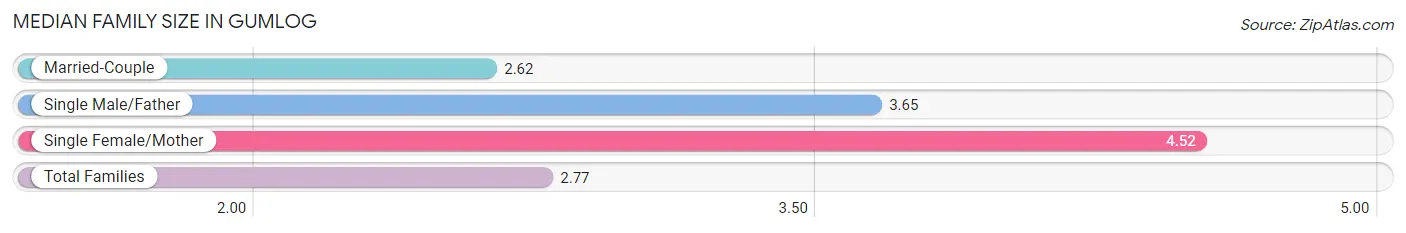
| Family Type | # Families | Family Size |
| Married-Couple | 588 (90.9%) | 2.62 |
| Single Male/Father | 17 (2.6%) | 3.65 |
| Single Female/Mother | 42 (6.5%) | 4.52 |
| Total Families | 647 (100.0%) | 2.77 |
Median Household Size in Gumlog
The median household size in Gumlog is 2.43 persons per household, with single female/mother households (42 | 4.6%) accounting for the largest median household size of 4.52 persons per household. non-family households (263 | 28.9%) represent the smallest median household size with 1.60 persons per household.
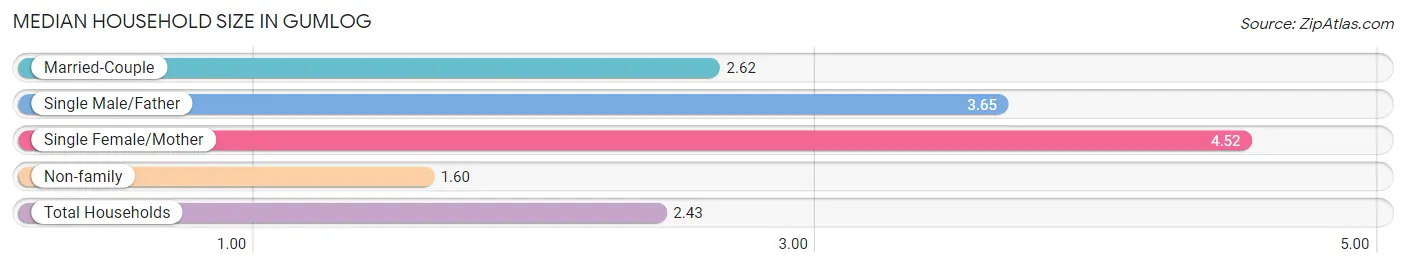
| Household Type | # Households | Household Size |
| Married-Couple | 588 (64.6%) | 2.62 |
| Single Male/Father | 17 (1.9%) | 3.65 |
| Single Female/Mother | 42 (4.6%) | 4.52 |
| Non-family | 263 (28.9%) | 1.60 |
| Total Households | 910 (100.0%) | 2.43 |
Household Size by Marriage Status in Gumlog
Out of a total of 910 households in Gumlog, 647 (71.1%) are family households, while 263 (28.9%) are nonfamily households. The most numerous type of family households are 2-person households, comprising 442, and the most common type of nonfamily households are 1-person households, comprising 169.
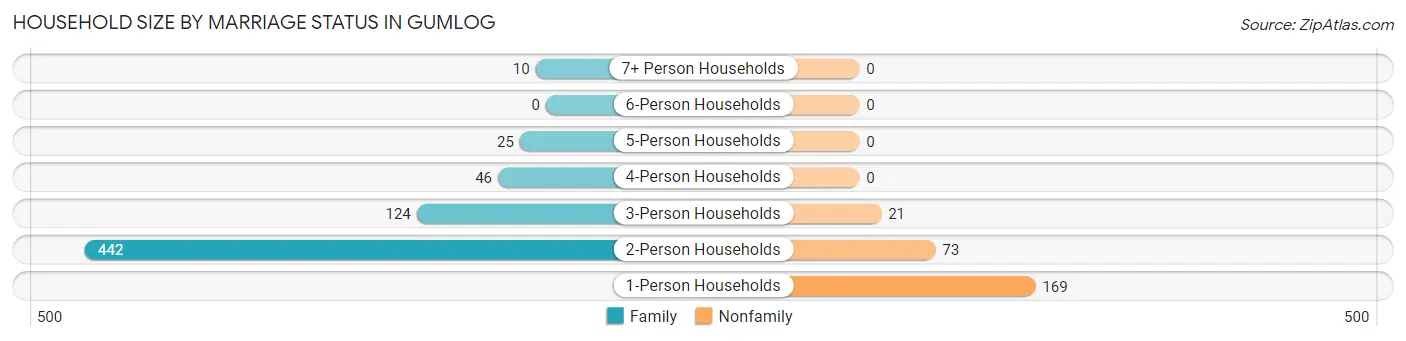
| Household Size | Family Households | Nonfamily Households |
| 1-Person Households | - | 169 (18.6%) |
| 2-Person Households | 442 (48.6%) | 73 (8.0%) |
| 3-Person Households | 124 (13.6%) | 21 (2.3%) |
| 4-Person Households | 46 (5.1%) | 0 (0.0%) |
| 5-Person Households | 25 (2.8%) | 0 (0.0%) |
| 6-Person Households | 0 (0.0%) | 0 (0.0%) |
| 7+ Person Households | 10 (1.1%) | 0 (0.0%) |
| Total | 647 (71.1%) | 263 (28.9%) |
Female Fertility in Gumlog
Fertility by Age in Gumlog
| Age Bracket | Women with Births | Births / 1,000 Women |
| 15 to 19 years | 0 (0.0%) | 0.0 |
| 20 to 34 years | 0 (0.0%) | 0.0 |
| 35 to 50 years | 0 (0.0%) | 0.0 |
| Total | 0 (0.0%) | 0.0 |
Fertility by Age by Marriage Status in Gumlog
| Age Bracket | Married | Unmarried |
| 15 to 19 years | 0 (0.0%) | 0 (0.0%) |
| 20 to 34 years | 0 (0.0%) | 0 (0.0%) |
| 35 to 50 years | 0 (0.0%) | 0 (0.0%) |
| Total | 0 (0.0%) | 0 (0.0%) |
Fertility by Education in Gumlog
| Educational Attainment | Women with Births | Births / 1,000 Women |
| Less than High School | 0 (0.0%) | 0.0 |
| High School Diploma | 0 (0.0%) | 0.0 |
| College or Associate's Degree | 0 (0.0%) | 0.0 |
| Bachelor's Degree | 0 (0.0%) | 0.0 |
| Graduate Degree | 0 (0.0%) | 0.0 |
| Total | 0 (0.0%) | 0.0 |
Fertility by Education by Marriage Status in Gumlog
| Educational Attainment | Married | Unmarried |
| Less than High School | 0 (0.0%) | 0 (0.0%) |
| High School Diploma | 0 (0.0%) | 0 (0.0%) |
| College or Associate's Degree | 0 (0.0%) | 0 (0.0%) |
| Bachelor's Degree | 0 (0.0%) | 0 (0.0%) |
| Graduate Degree | 0 (0.0%) | 0 (0.0%) |
| Total | 0 (0.0%) | 0 (0.0%) |
Employment Characteristics in Gumlog
Employment by Class of Employer in Gumlog
Among the 912 employed individuals in Gumlog, private company employees (576 | 63.2%), self-employed (not incorporated) (124 | 13.6%), and local government employees (85 | 9.3%) make up the most common classes of employment.
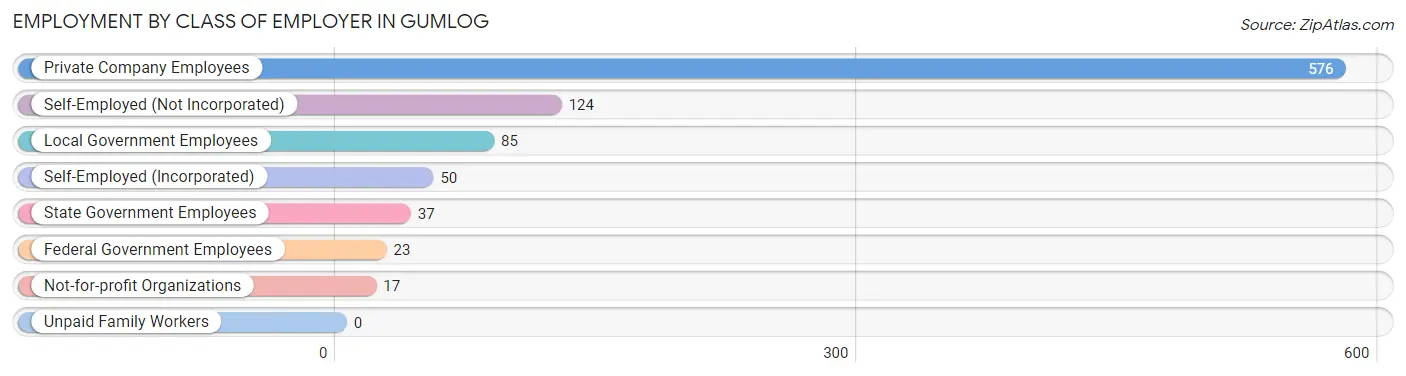
| Employer Class | # Employees | % Employees |
| Private Company Employees | 576 | 63.2% |
| Self-Employed (Incorporated) | 50 | 5.5% |
| Self-Employed (Not Incorporated) | 124 | 13.6% |
| Not-for-profit Organizations | 17 | 1.9% |
| Local Government Employees | 85 | 9.3% |
| State Government Employees | 37 | 4.1% |
| Federal Government Employees | 23 | 2.5% |
| Unpaid Family Workers | 0 | 0.0% |
| Total | 912 | 100.0% |
Employment Status by Age in Gumlog
According to the labor force statistics for Gumlog, out of the total population over 16 years of age (1,971), 50.1% or 987 individuals are in the labor force, with 5.0% or 49 of them unemployed. The age group with the highest labor force participation rate is 25 to 29 years, with 100.0% or 154 individuals in the labor force. Within the labor force, the 35 to 44 years age range has the highest percentage of unemployed individuals, with 24.6% or 49 of them being unemployed.
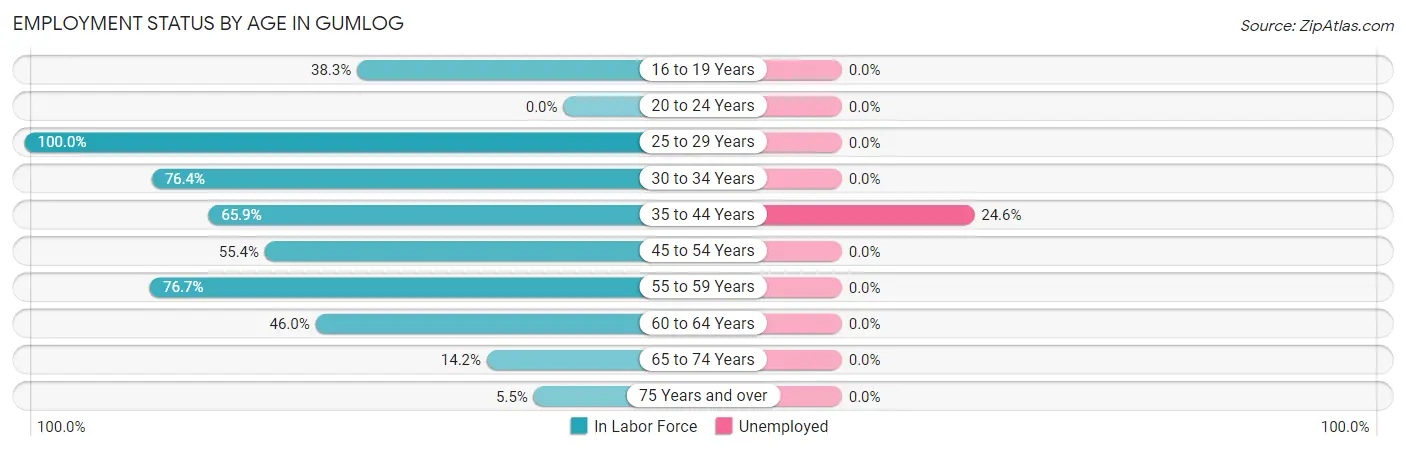
| Age Bracket | In Labor Force | Unemployed |
| 16 to 19 Years | 18 (38.3%) | 0 (0.0%) |
| 20 to 24 Years | 0 (0.0%) | 0 (0.0%) |
| 25 to 29 Years | 154 (100.0%) | 0 (0.0%) |
| 30 to 34 Years | 120 (76.4%) | 0 (0.0%) |
| 35 to 44 Years | 199 (65.9%) | 49 (24.6%) |
| 45 to 54 Years | 129 (55.4%) | 0 (0.0%) |
| 55 to 59 Years | 211 (76.7%) | 0 (0.0%) |
| 60 to 64 Years | 104 (46.0%) | 0 (0.0%) |
| 65 to 74 Years | 34 (14.2%) | 0 (0.0%) |
| 75 Years and over | 18 (5.5%) | 0 (0.0%) |
| Total | 987 (50.1%) | 49 (5.0%) |
Employment Status by Educational Attainment in Gumlog
According to labor force statistics for Gumlog, 68.1% of individuals (917) out of the total population between 25 and 64 years of age (1,347) are in the labor force, with 5.3% or 49 of them being unemployed. The group with the highest labor force participation rate are those with the educational attainment of bachelor's degree or higher, with 88.4% or 283 individuals in the labor force. Within the labor force, individuals with high school diploma education have the highest percentage of unemployment, with 20.4% or 49 of them being unemployed.
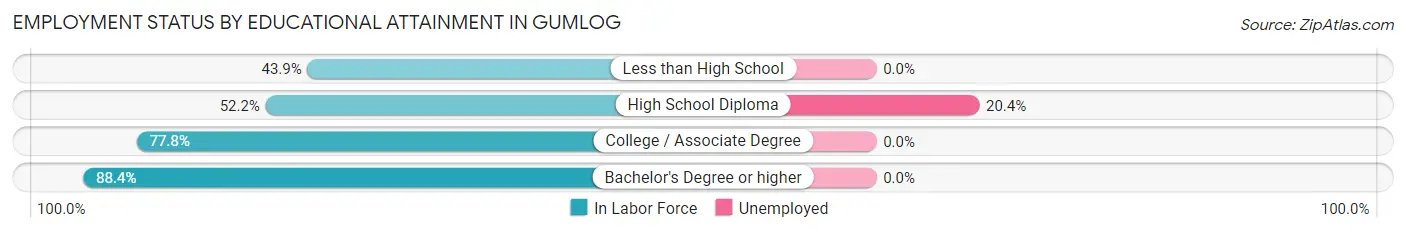
| Educational Attainment | In Labor Force | Unemployed |
| Less than High School | 61 (43.9%) | 0 (0.0%) |
| High School Diploma | 240 (52.2%) | 94 (20.4%) |
| College / Associate Degree | 333 (77.8%) | 0 (0.0%) |
| Bachelor's Degree or higher | 283 (88.4%) | 0 (0.0%) |
| Total | 917 (68.1%) | 71 (5.3%) |
Employment Occupations by Sex in Gumlog
Management, Business, Science and Arts Occupations
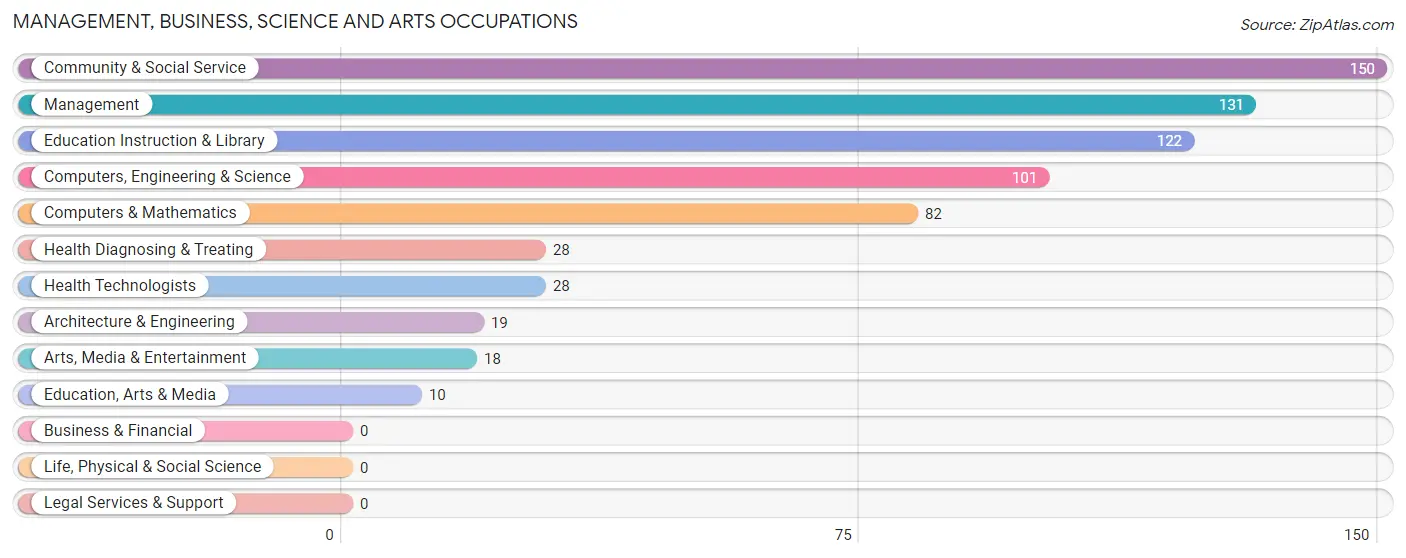
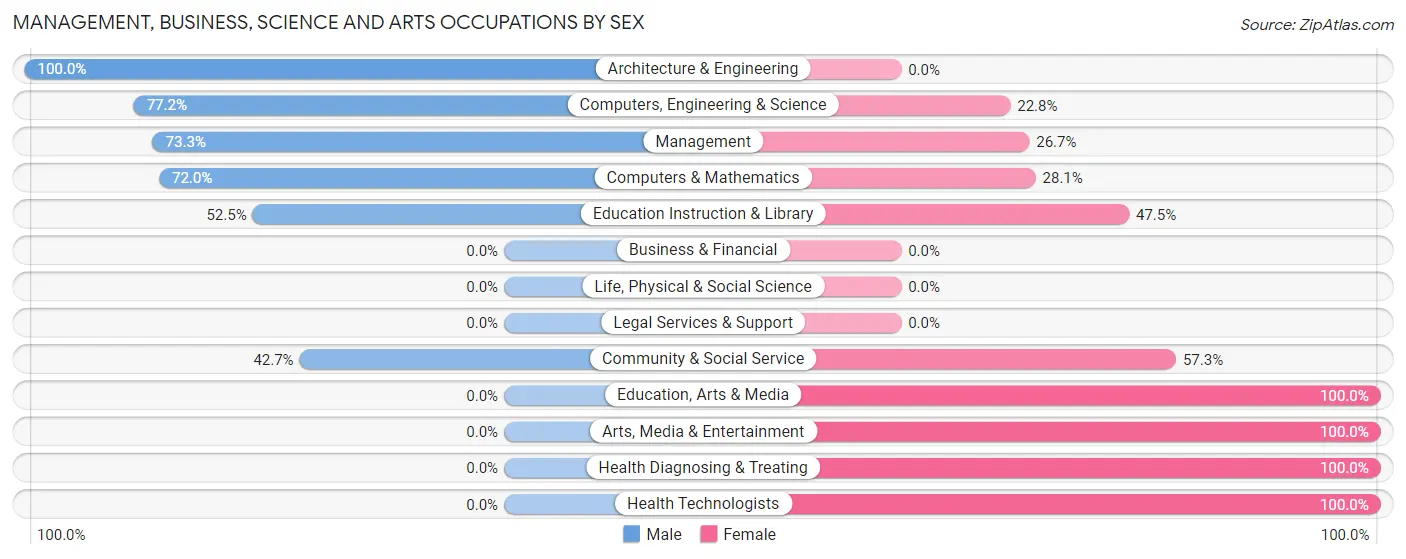
The most common Management, Business, Science and Arts occupations in Gumlog are Community & Social Service (150 | 16.0%), Management (131 | 14.0%), Education Instruction & Library (122 | 13.0%), Computers, Engineering & Science (101 | 10.8%), and Computers & Mathematics (82 | 8.7%).
Management, Business, Science and Arts Occupations by Sex
Within the Management, Business, Science and Arts occupations in Gumlog, the most male-oriented occupations are Architecture & Engineering (100.0%), Computers, Engineering & Science (77.2%), and Management (73.3%), while the most female-oriented occupations are Education, Arts & Media (100.0%), Arts, Media & Entertainment (100.0%), and Health Diagnosing & Treating (100.0%).
| Occupation | Male | Female |
| Management | 96 (73.3%) | 35 (26.7%) |
| Business & Financial | 0 (0.0%) | 0 (0.0%) |
| Computers, Engineering & Science | 78 (77.2%) | 23 (22.8%) |
| Computers & Mathematics | 59 (72.0%) | 23 (28.1%) |
| Architecture & Engineering | 19 (100.0%) | 0 (0.0%) |
| Life, Physical & Social Science | 0 (0.0%) | 0 (0.0%) |
| Community & Social Service | 64 (42.7%) | 86 (57.3%) |
| Education, Arts & Media | 0 (0.0%) | 10 (100.0%) |
| Legal Services & Support | 0 (0.0%) | 0 (0.0%) |
| Education Instruction & Library | 64 (52.5%) | 58 (47.5%) |
| Arts, Media & Entertainment | 0 (0.0%) | 18 (100.0%) |
| Health Diagnosing & Treating | 0 (0.0%) | 28 (100.0%) |
| Health Technologists | 0 (0.0%) | 28 (100.0%) |
| Total (Category) | 238 (58.1%) | 172 (41.9%) |
| Total (Overall) | 540 (57.6%) | 398 (42.4%) |
Services Occupations
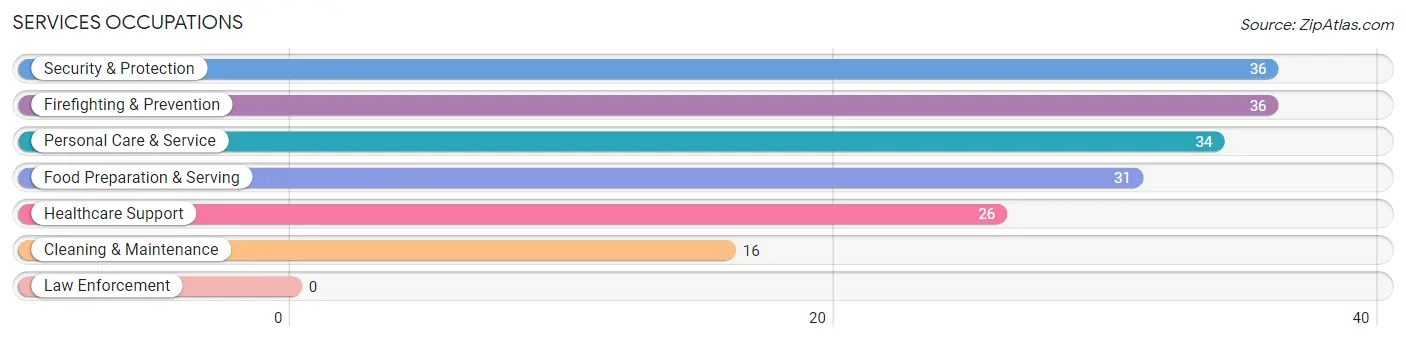
The most common Services occupations in Gumlog are Security & Protection (36 | 3.8%), Firefighting & Prevention (36 | 3.8%), Personal Care & Service (34 | 3.6%), Food Preparation & Serving (31 | 3.3%), and Healthcare Support (26 | 2.8%).
Services Occupations by Sex
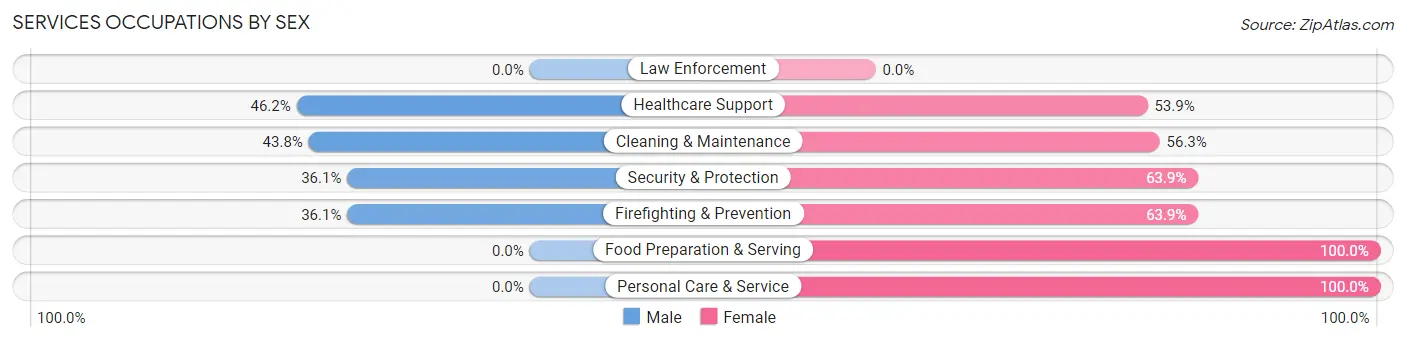
Within the Services occupations in Gumlog, the most male-oriented occupations are Healthcare Support (46.2%), Cleaning & Maintenance (43.8%), and Security & Protection (36.1%), while the most female-oriented occupations are Food Preparation & Serving (100.0%), Personal Care & Service (100.0%), and Security & Protection (63.9%).
| Occupation | Male | Female |
| Healthcare Support | 12 (46.2%) | 14 (53.8%) |
| Security & Protection | 13 (36.1%) | 23 (63.9%) |
| Firefighting & Prevention | 13 (36.1%) | 23 (63.9%) |
| Law Enforcement | 0 (0.0%) | 0 (0.0%) |
| Food Preparation & Serving | 0 (0.0%) | 31 (100.0%) |
| Cleaning & Maintenance | 7 (43.8%) | 9 (56.2%) |
| Personal Care & Service | 0 (0.0%) | 34 (100.0%) |
| Total (Category) | 32 (22.4%) | 111 (77.6%) |
| Total (Overall) | 540 (57.6%) | 398 (42.4%) |
Sales and Office Occupations
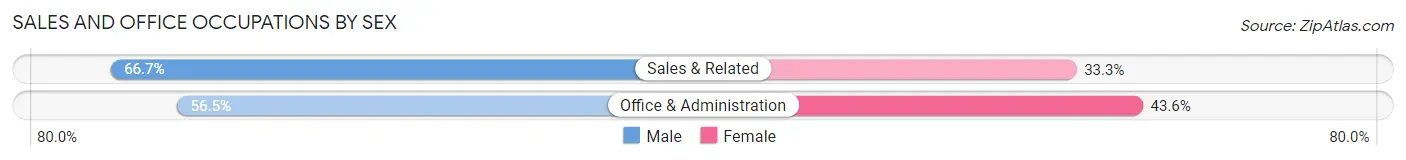
The most common Sales and Office occupations in Gumlog are Office & Administration (62 | 6.6%), and Sales & Related (51 | 5.4%).

Sales and Office Occupations by Sex
| Occupation | Male | Female |
| Sales & Related | 34 (66.7%) | 17 (33.3%) |
| Office & Administration | 35 (56.5%) | 27 (43.5%) |
| Total (Category) | 69 (61.1%) | 44 (38.9%) |
| Total (Overall) | 540 (57.6%) | 398 (42.4%) |
Natural Resources, Construction and Maintenance Occupations
The most common Natural Resources, Construction and Maintenance occupations in Gumlog are Installation, Maintenance & Repair (56 | 6.0%), and Construction & Extraction (10 | 1.1%).
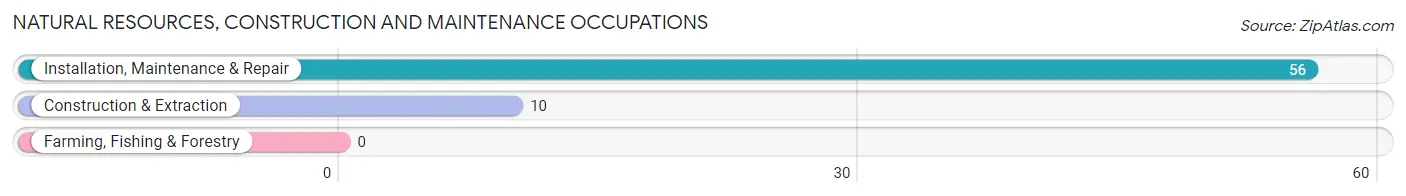
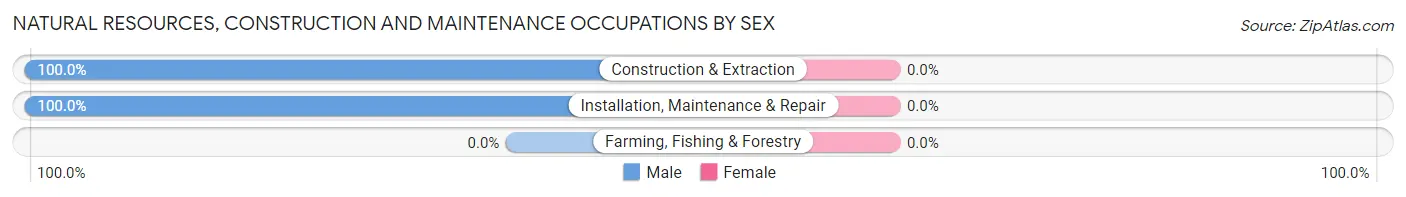
Natural Resources, Construction and Maintenance Occupations by Sex
| Occupation | Male | Female |
| Farming, Fishing & Forestry | 0 (0.0%) | 0 (0.0%) |
| Construction & Extraction | 10 (100.0%) | 0 (0.0%) |
| Installation, Maintenance & Repair | 56 (100.0%) | 0 (0.0%) |
| Total (Category) | 66 (100.0%) | 0 (0.0%) |
| Total (Overall) | 540 (57.6%) | 398 (42.4%) |
Production, Transportation and Moving Occupations
The most common Production, Transportation and Moving occupations in Gumlog are Production (124 | 13.2%), Transportation (67 | 7.1%), and Material Moving (15 | 1.6%).
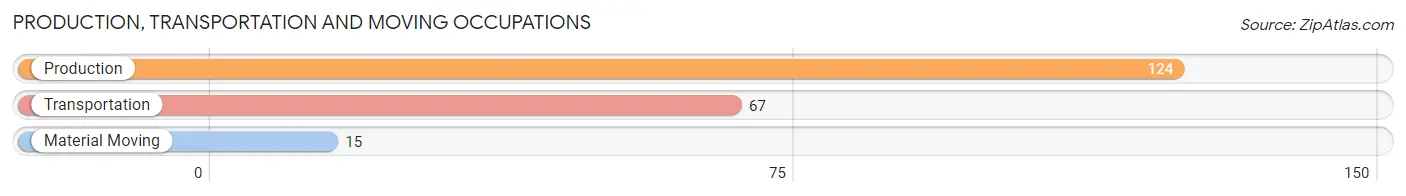
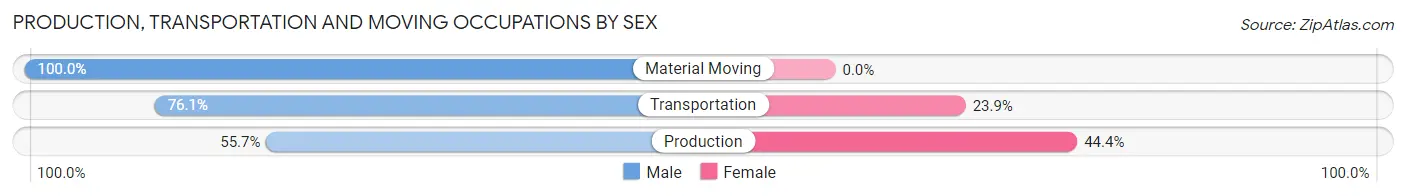
Production, Transportation and Moving Occupations by Sex
| Occupation | Male | Female |
| Production | 69 (55.6%) | 55 (44.4%) |
| Transportation | 51 (76.1%) | 16 (23.9%) |
| Material Moving | 15 (100.0%) | 0 (0.0%) |
| Total (Category) | 135 (65.5%) | 71 (34.5%) |
| Total (Overall) | 540 (57.6%) | 398 (42.4%) |
Employment Industries by Sex in Gumlog
Employment Industries in Gumlog
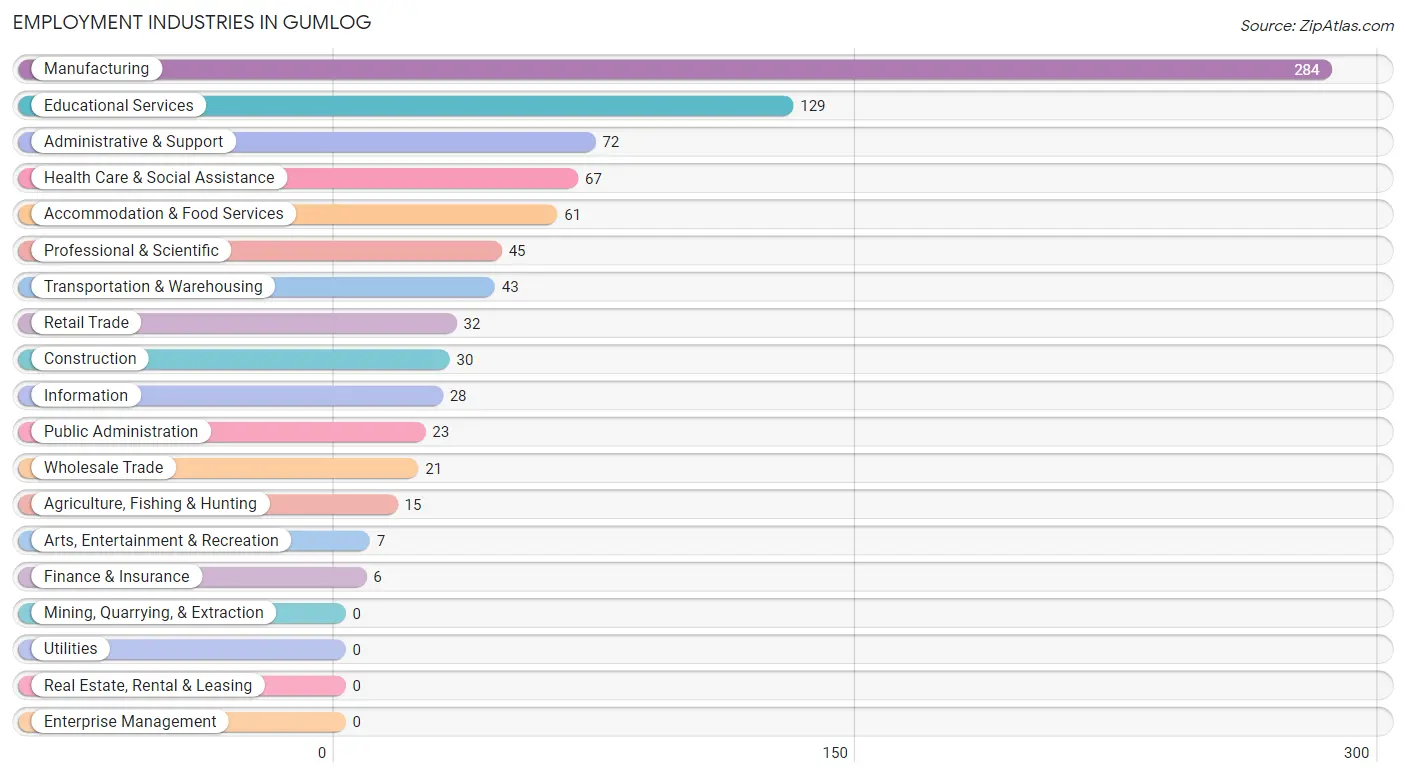
The major employment industries in Gumlog include Manufacturing (284 | 30.3%), Educational Services (129 | 13.8%), Administrative & Support (72 | 7.7%), Health Care & Social Assistance (67 | 7.1%), and Accommodation & Food Services (61 | 6.5%).
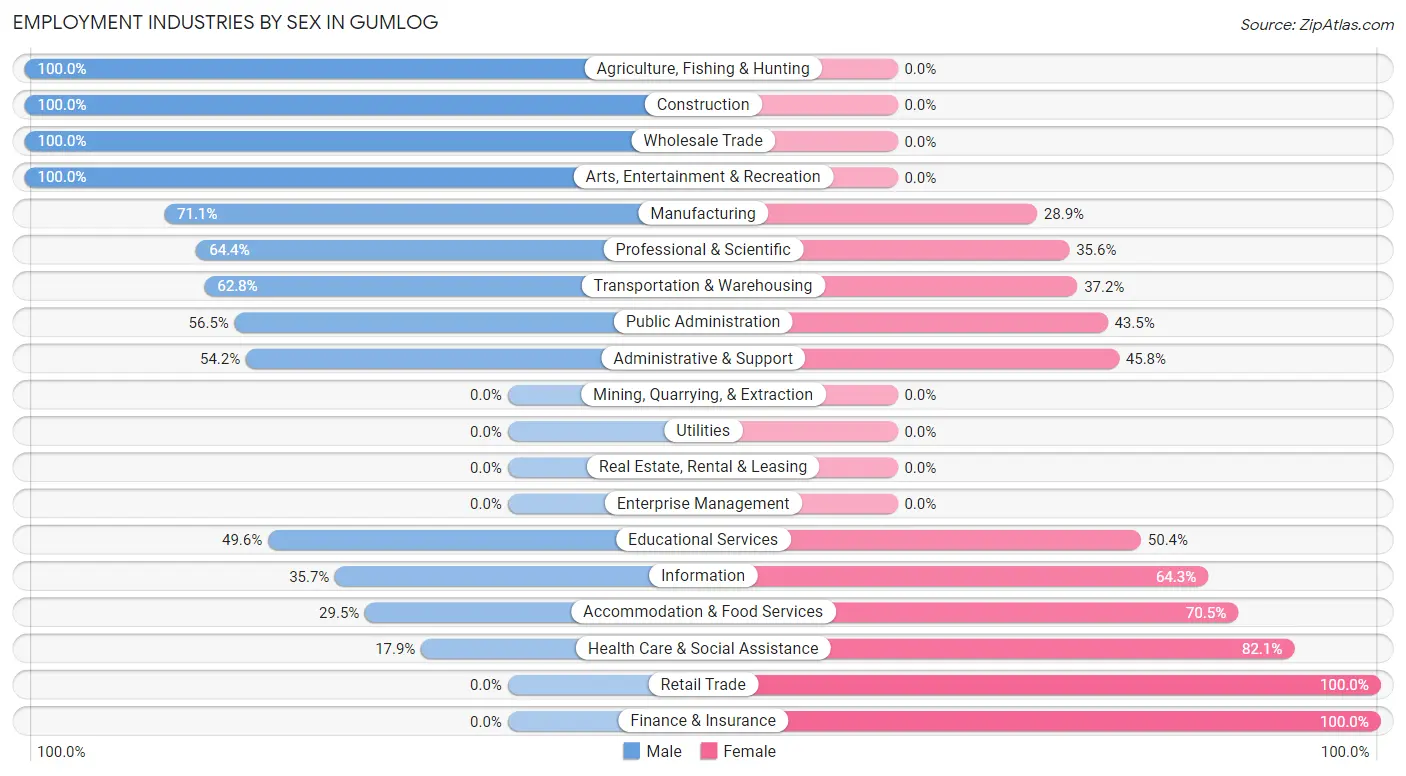
Employment Industries by Sex in Gumlog
The Gumlog industries that see more men than women are Agriculture, Fishing & Hunting (100.0%), Construction (100.0%), and Wholesale Trade (100.0%), whereas the industries that tend to have a higher number of women are Retail Trade (100.0%), Finance & Insurance (100.0%), and Health Care & Social Assistance (82.1%).
| Industry | Male | Female |
| Agriculture, Fishing & Hunting | 15 (100.0%) | 0 (0.0%) |
| Mining, Quarrying, & Extraction | 0 (0.0%) | 0 (0.0%) |
| Construction | 30 (100.0%) | 0 (0.0%) |
| Manufacturing | 202 (71.1%) | 82 (28.9%) |
| Wholesale Trade | 21 (100.0%) | 0 (0.0%) |
| Retail Trade | 0 (0.0%) | 32 (100.0%) |
| Transportation & Warehousing | 27 (62.8%) | 16 (37.2%) |
| Utilities | 0 (0.0%) | 0 (0.0%) |
| Information | 10 (35.7%) | 18 (64.3%) |
| Finance & Insurance | 0 (0.0%) | 6 (100.0%) |
| Real Estate, Rental & Leasing | 0 (0.0%) | 0 (0.0%) |
| Professional & Scientific | 29 (64.4%) | 16 (35.6%) |
| Enterprise Management | 0 (0.0%) | 0 (0.0%) |
| Administrative & Support | 39 (54.2%) | 33 (45.8%) |
| Educational Services | 64 (49.6%) | 65 (50.4%) |
| Health Care & Social Assistance | 12 (17.9%) | 55 (82.1%) |
| Arts, Entertainment & Recreation | 7 (100.0%) | 0 (0.0%) |
| Accommodation & Food Services | 18 (29.5%) | 43 (70.5%) |
| Public Administration | 13 (56.5%) | 10 (43.5%) |
| Total | 540 (57.6%) | 398 (42.4%) |
Education in Gumlog
School Enrollment in Gumlog
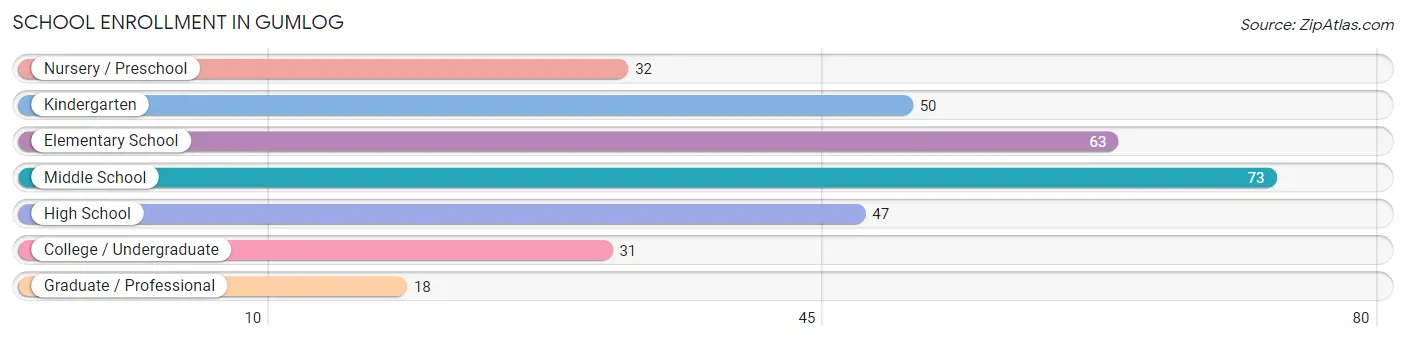
The most common levels of schooling among the 314 students in Gumlog are middle school (73 | 23.3%), elementary school (63 | 20.1%), and kindergarten (50 | 15.9%).
| School Level | # Students | % Students |
| Nursery / Preschool | 32 | 10.2% |
| Kindergarten | 50 | 15.9% |
| Elementary School | 63 | 20.1% |
| Middle School | 73 | 23.3% |
| High School | 47 | 15.0% |
| College / Undergraduate | 31 | 9.9% |
| Graduate / Professional | 18 | 5.7% |
| Total | 314 | 100.0% |
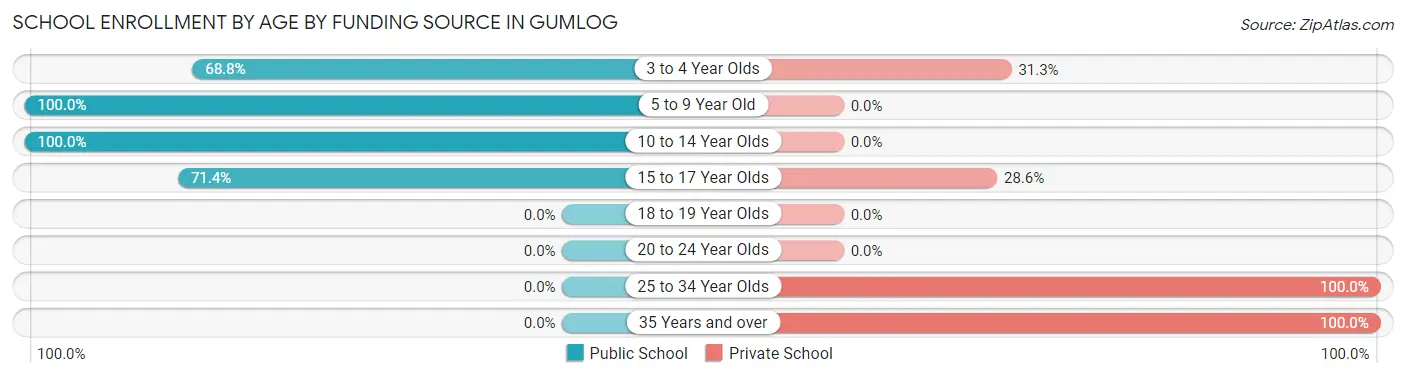
School Enrollment by Age by Funding Source in Gumlog
Out of a total of 314 students who are enrolled in schools in Gumlog, 77 (24.5%) attend a private institution, while the remaining 237 (75.5%) are enrolled in public schools. The age group of 25 to 34 year olds has the highest likelihood of being enrolled in private schools, with 18 (100.0% in the age bracket) enrolled. Conversely, the age group of 5 to 9 year old has the lowest likelihood of being enrolled in a private school, with 100 (100.0% in the age bracket) attending a public institution.
| Age Bracket | Public School | Private School |
| 3 to 4 Year Olds | 22 (68.8%) | 10 (31.2%) |
| 5 to 9 Year Old | 100 (100.0%) | 0 (0.0%) |
| 10 to 14 Year Olds | 70 (100.0%) | 0 (0.0%) |
| 15 to 17 Year Olds | 45 (71.4%) | 18 (28.6%) |
| 18 to 19 Year Olds | 0 (0.0%) | 0 (0.0%) |
| 20 to 24 Year Olds | 0 (0.0%) | 0 (0.0%) |
| 25 to 34 Year Olds | 0 (0.0%) | 18 (100.0%) |
| 35 Years and over | 0 (0.0%) | 31 (100.0%) |
| Total | 237 (75.5%) | 77 (24.5%) |
Educational Attainment by Field of Study in Gumlog
Business (83 | 17.0%), science & technology (75 | 15.3%), education (51 | 10.4%), engineering (50 | 10.2%), and liberal arts & history (50 | 10.2%) are the most common fields of study among 489 individuals in Gumlog who have obtained a bachelor's degree or higher.
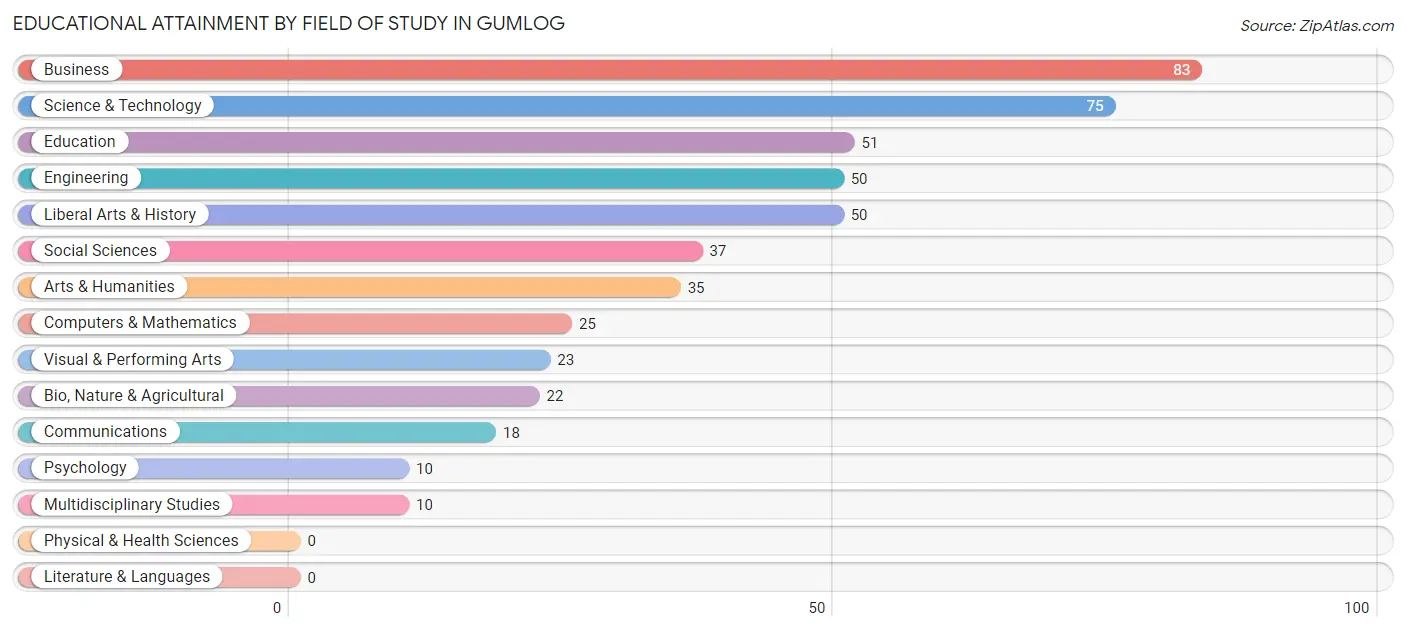
| Field of Study | # Graduates | % Graduates |
| Computers & Mathematics | 25 | 5.1% |
| Bio, Nature & Agricultural | 22 | 4.5% |
| Physical & Health Sciences | 0 | 0.0% |
| Psychology | 10 | 2.0% |
| Social Sciences | 37 | 7.6% |
| Engineering | 50 | 10.2% |
| Multidisciplinary Studies | 10 | 2.0% |
| Science & Technology | 75 | 15.3% |
| Business | 83 | 17.0% |
| Education | 51 | 10.4% |
| Literature & Languages | 0 | 0.0% |
| Liberal Arts & History | 50 | 10.2% |
| Visual & Performing Arts | 23 | 4.7% |
| Communications | 18 | 3.7% |
| Arts & Humanities | 35 | 7.2% |
| Total | 489 | 100.0% |
Transportation & Commute in Gumlog
Vehicle Availability by Sex in Gumlog
The most prevalent vehicle ownership categories in Gumlog are males with 2 vehicles (208, accounting for 38.5%) and females with 2 vehicles (120, making up 55.9%).
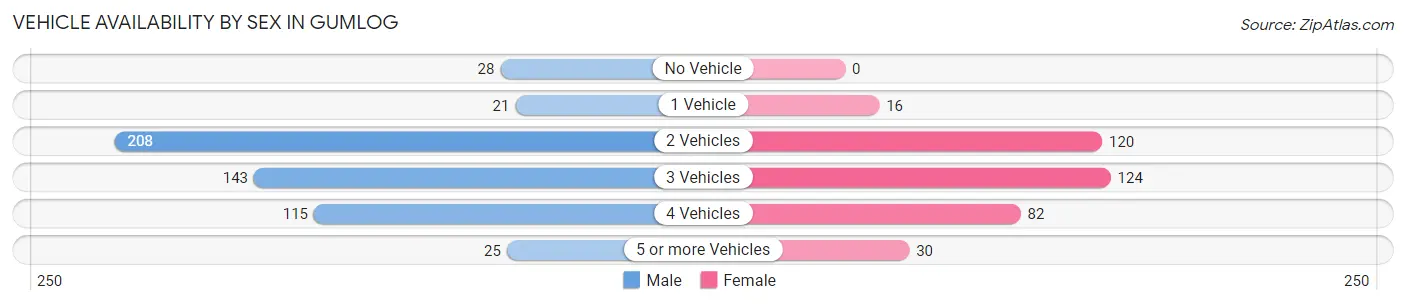
| Vehicles Available | Male | Female |
| No Vehicle | 28 (5.2%) | 0 (0.0%) |
| 1 Vehicle | 21 (3.9%) | 16 (4.3%) |
| 2 Vehicles | 208 (38.5%) | 120 (32.3%) |
| 3 Vehicles | 143 (26.5%) | 124 (33.3%) |
| 4 Vehicles | 115 (21.3%) | 82 (22.0%) |
| 5 or more Vehicles | 25 (4.6%) | 30 (8.1%) |
| Total | 540 (100.0%) | 372 (100.0%) |
Commute Time in Gumlog
The most frequently occuring commute durations in Gumlog are 15 to 19 minutes (114 commuters, 13.7%), 20 to 24 minutes (113 commuters, 13.6%), and 35 to 39 minutes (111 commuters, 13.4%).
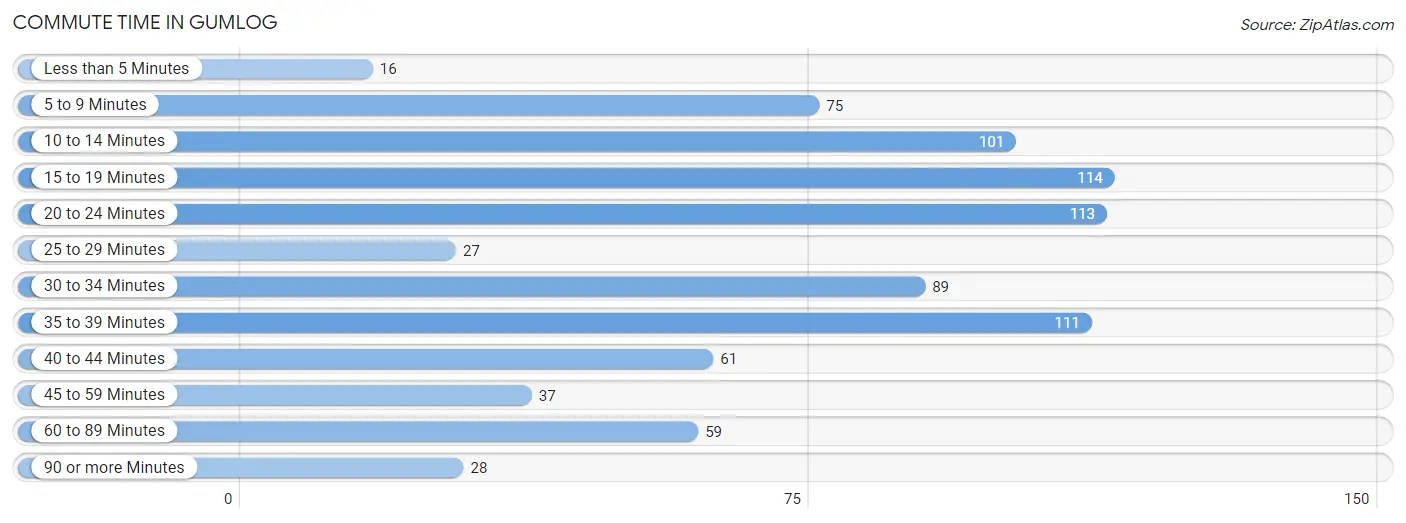
| Commute Time | # Commuters | % Commuters |
| Less than 5 Minutes | 16 | 1.9% |
| 5 to 9 Minutes | 75 | 9.0% |
| 10 to 14 Minutes | 101 | 12.1% |
| 15 to 19 Minutes | 114 | 13.7% |
| 20 to 24 Minutes | 113 | 13.6% |
| 25 to 29 Minutes | 27 | 3.3% |
| 30 to 34 Minutes | 89 | 10.7% |
| 35 to 39 Minutes | 111 | 13.4% |
| 40 to 44 Minutes | 61 | 7.3% |
| 45 to 59 Minutes | 37 | 4.4% |
| 60 to 89 Minutes | 59 | 7.1% |
| 90 or more Minutes | 28 | 3.4% |
Commute Time by Sex in Gumlog
The most common commute times in Gumlog are 15 to 19 minutes (96 commuters, 18.6%) for males and 30 to 34 minutes (58 commuters, 18.4%) for females.
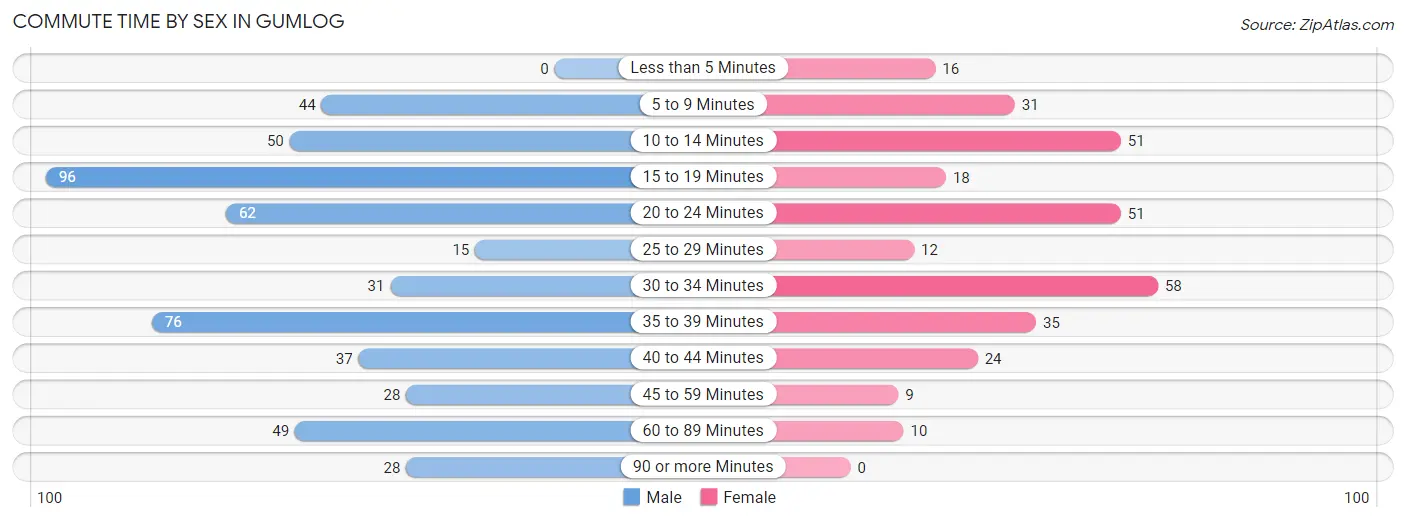
| Commute Time | Male | Female |
| Less than 5 Minutes | 0 (0.0%) | 16 (5.1%) |
| 5 to 9 Minutes | 44 (8.5%) | 31 (9.8%) |
| 10 to 14 Minutes | 50 (9.7%) | 51 (16.2%) |
| 15 to 19 Minutes | 96 (18.6%) | 18 (5.7%) |
| 20 to 24 Minutes | 62 (12.0%) | 51 (16.2%) |
| 25 to 29 Minutes | 15 (2.9%) | 12 (3.8%) |
| 30 to 34 Minutes | 31 (6.0%) | 58 (18.4%) |
| 35 to 39 Minutes | 76 (14.7%) | 35 (11.1%) |
| 40 to 44 Minutes | 37 (7.2%) | 24 (7.6%) |
| 45 to 59 Minutes | 28 (5.4%) | 9 (2.9%) |
| 60 to 89 Minutes | 49 (9.5%) | 10 (3.2%) |
| 90 or more Minutes | 28 (5.4%) | 0 (0.0%) |
Time of Departure to Work by Sex in Gumlog
The most frequent times of departure to work in Gumlog are 7:30 AM to 7:59 AM (96, 18.6%) for males and 7:00 AM to 7:29 AM (76, 24.1%) for females.
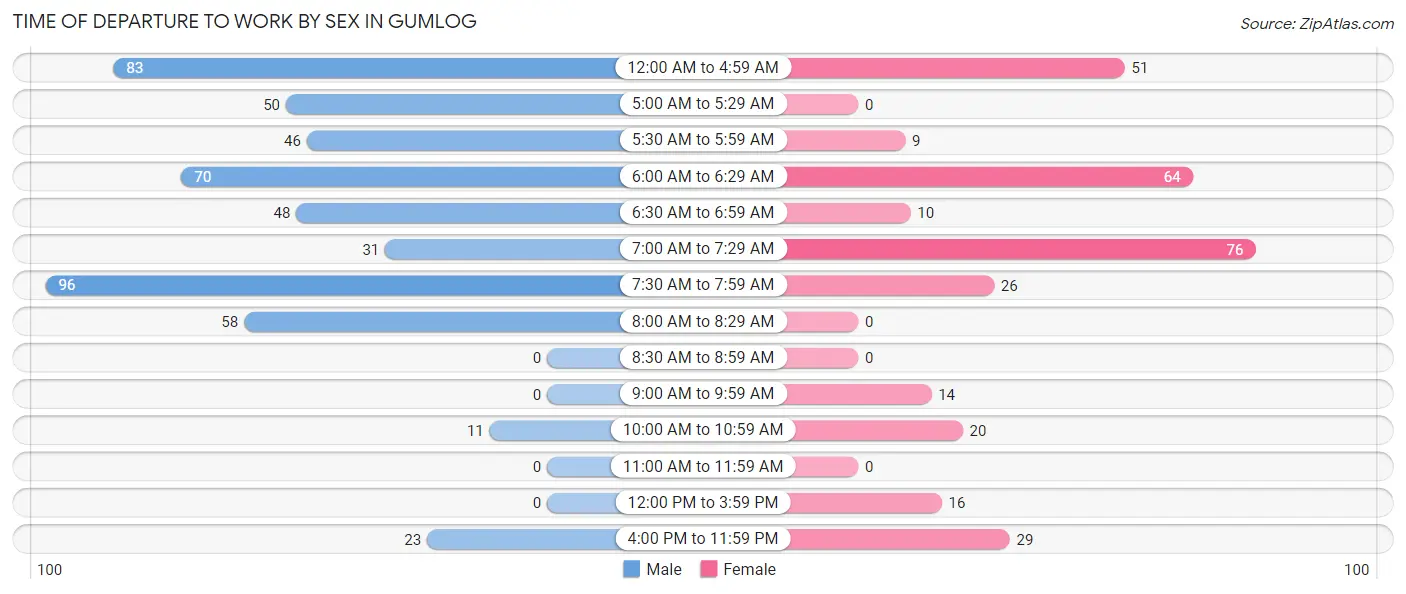
| Time of Departure | Male | Female |
| 12:00 AM to 4:59 AM | 83 (16.1%) | 51 (16.2%) |
| 5:00 AM to 5:29 AM | 50 (9.7%) | 0 (0.0%) |
| 5:30 AM to 5:59 AM | 46 (8.9%) | 9 (2.9%) |
| 6:00 AM to 6:29 AM | 70 (13.6%) | 64 (20.3%) |
| 6:30 AM to 6:59 AM | 48 (9.3%) | 10 (3.2%) |
| 7:00 AM to 7:29 AM | 31 (6.0%) | 76 (24.1%) |
| 7:30 AM to 7:59 AM | 96 (18.6%) | 26 (8.3%) |
| 8:00 AM to 8:29 AM | 58 (11.2%) | 0 (0.0%) |
| 8:30 AM to 8:59 AM | 0 (0.0%) | 0 (0.0%) |
| 9:00 AM to 9:59 AM | 0 (0.0%) | 14 (4.4%) |
| 10:00 AM to 10:59 AM | 11 (2.1%) | 20 (6.4%) |
| 11:00 AM to 11:59 AM | 0 (0.0%) | 0 (0.0%) |
| 12:00 PM to 3:59 PM | 0 (0.0%) | 16 (5.1%) |
| 4:00 PM to 11:59 PM | 23 (4.5%) | 29 (9.2%) |
| Total | 516 (100.0%) | 315 (100.0%) |
Housing Occupancy in Gumlog
Occupancy by Ownership in Gumlog
Of the total 910 dwellings in Gumlog, owner-occupied units account for 762 (83.7%), while renter-occupied units make up 148 (16.3%).
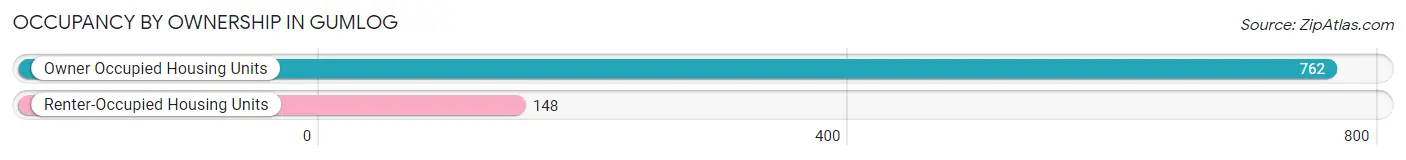
| Occupancy | # Housing Units | % Housing Units |
| Owner Occupied Housing Units | 762 | 83.7% |
| Renter-Occupied Housing Units | 148 | 16.3% |
| Total Occupied Housing Units | 910 | 100.0% |
Occupancy by Household Size in Gumlog
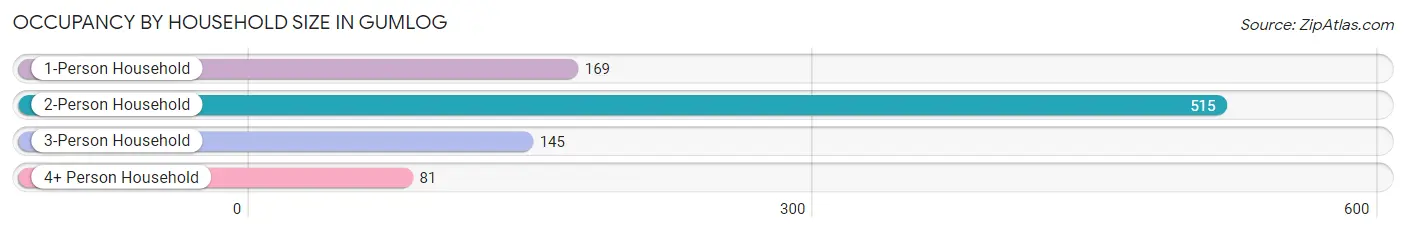
| Household Size | # Housing Units | % Housing Units |
| 1-Person Household | 169 | 18.6% |
| 2-Person Household | 515 | 56.6% |
| 3-Person Household | 145 | 15.9% |
| 4+ Person Household | 81 | 8.9% |
| Total Housing Units | 910 | 100.0% |
Occupancy by Ownership by Household Size in Gumlog
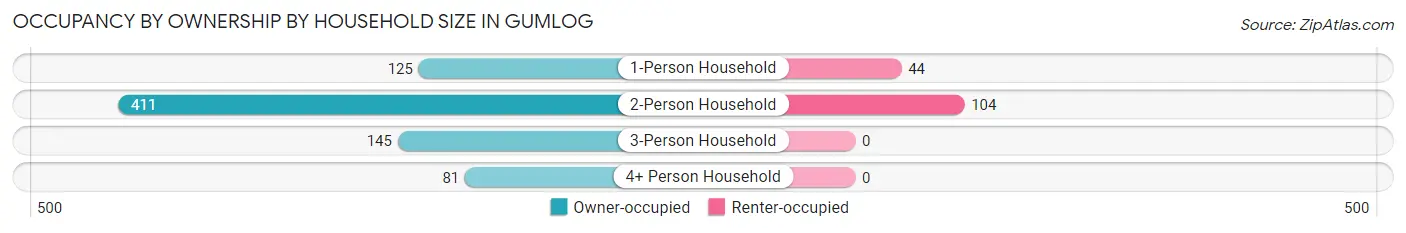
| Household Size | Owner-occupied | Renter-occupied |
| 1-Person Household | 125 (74.0%) | 44 (26.0%) |
| 2-Person Household | 411 (79.8%) | 104 (20.2%) |
| 3-Person Household | 145 (100.0%) | 0 (0.0%) |
| 4+ Person Household | 81 (100.0%) | 0 (0.0%) |
| Total Housing Units | 762 (83.7%) | 148 (16.3%) |
Occupancy by Educational Attainment in Gumlog
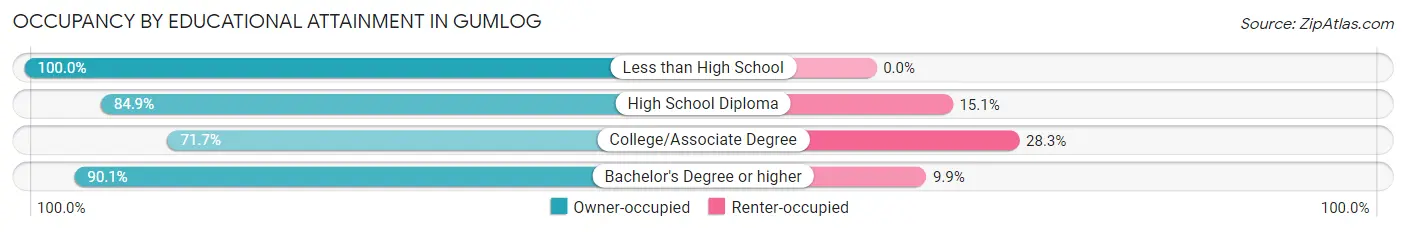
| Household Size | Owner-occupied | Renter-occupied |
| Less than High School | 63 (100.0%) | 0 (0.0%) |
| High School Diploma | 303 (84.9%) | 54 (15.1%) |
| College/Associate Degree | 177 (71.7%) | 70 (28.3%) |
| Bachelor's Degree or higher | 219 (90.1%) | 24 (9.9%) |
Occupancy by Age of Householder in Gumlog
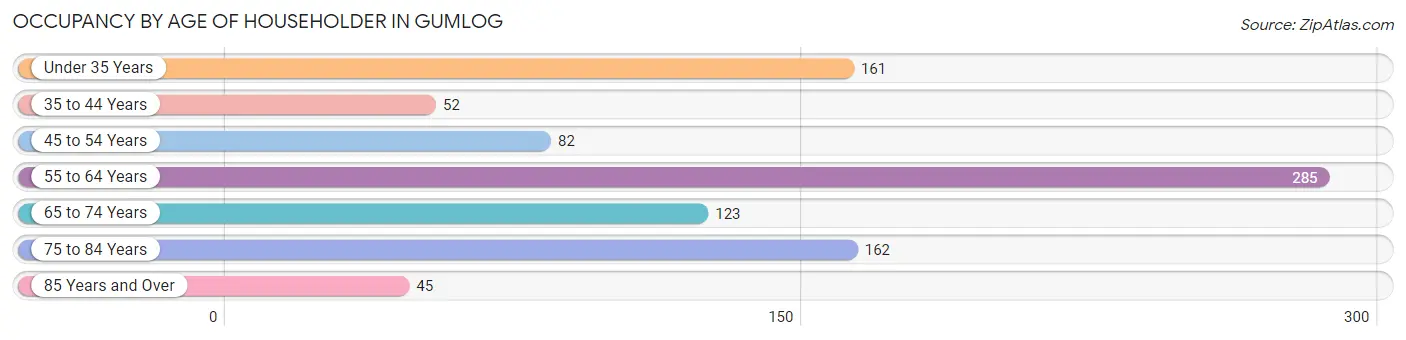
| Age Bracket | # Households | % Households |
| Under 35 Years | 161 | 17.7% |
| 35 to 44 Years | 52 | 5.7% |
| 45 to 54 Years | 82 | 9.0% |
| 55 to 64 Years | 285 | 31.3% |
| 65 to 74 Years | 123 | 13.5% |
| 75 to 84 Years | 162 | 17.8% |
| 85 Years and Over | 45 | 5.0% |
| Total | 910 | 100.0% |
Housing Finances in Gumlog
Median Income by Occupancy in Gumlog
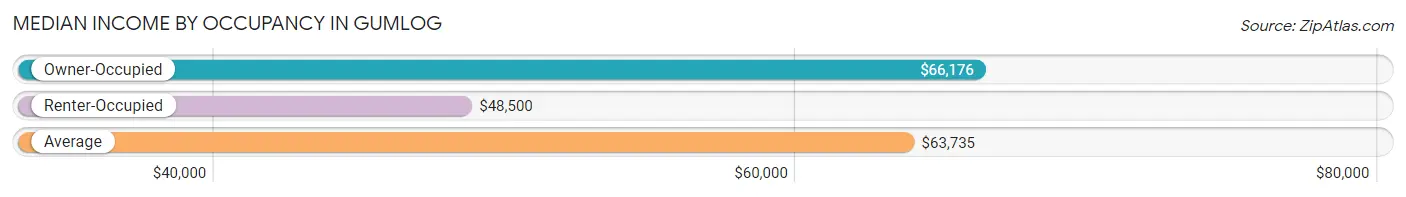
| Occupancy Type | # Households | Median Income |
| Owner-Occupied | 762 (83.7%) | $66,176 |
| Renter-Occupied | 148 (16.3%) | $48,500 |
| Average | 910 (100.0%) | $63,735 |
Occupancy by Householder Income Bracket in Gumlog
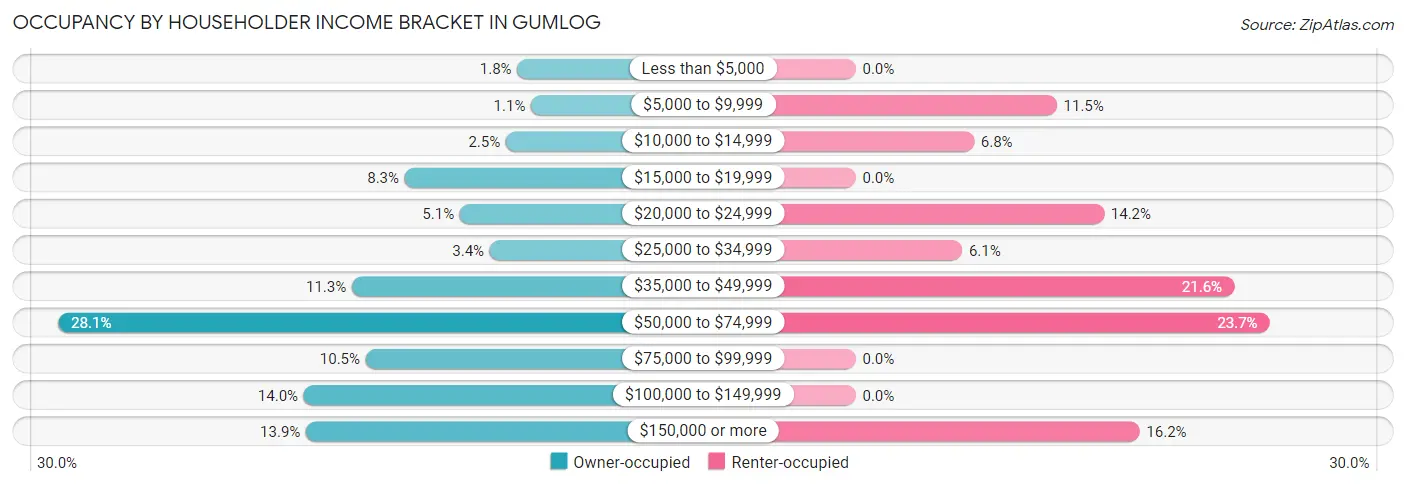
| Income Bracket | Owner-occupied | Renter-occupied |
| Less than $5,000 | 14 (1.8%) | 0 (0.0%) |
| $5,000 to $9,999 | 8 (1.1%) | 17 (11.5%) |
| $10,000 to $14,999 | 19 (2.5%) | 10 (6.8%) |
| $15,000 to $19,999 | 63 (8.3%) | 0 (0.0%) |
| $20,000 to $24,999 | 39 (5.1%) | 21 (14.2%) |
| $25,000 to $34,999 | 26 (3.4%) | 9 (6.1%) |
| $35,000 to $49,999 | 86 (11.3%) | 32 (21.6%) |
| $50,000 to $74,999 | 214 (28.1%) | 35 (23.6%) |
| $75,000 to $99,999 | 80 (10.5%) | 0 (0.0%) |
| $100,000 to $149,999 | 107 (14.0%) | 0 (0.0%) |
| $150,000 or more | 106 (13.9%) | 24 (16.2%) |
| Total | 762 (100.0%) | 148 (100.0%) |
Monthly Housing Cost Tiers in Gumlog
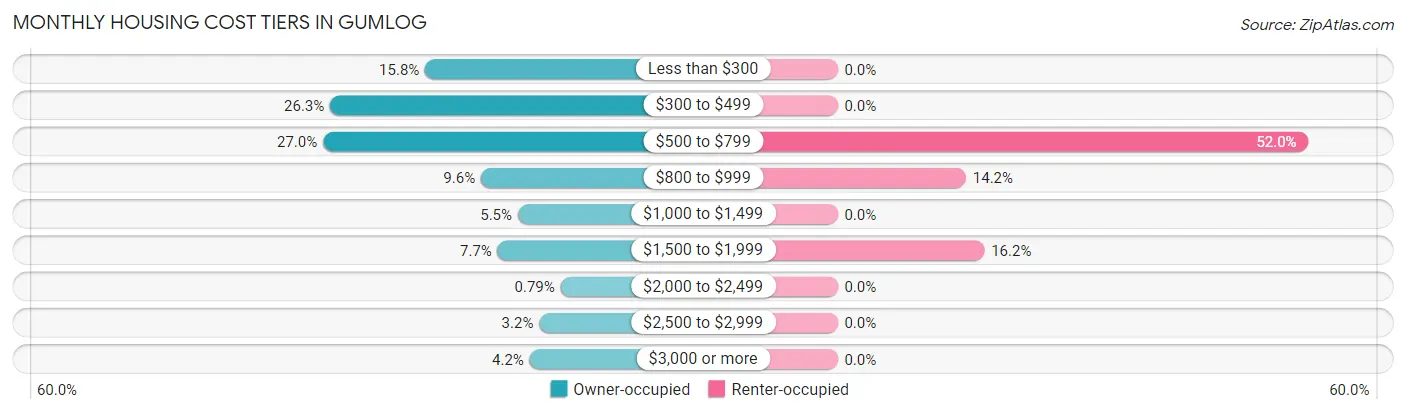
| Monthly Cost | Owner-occupied | Renter-occupied |
| Less than $300 | 120 (15.8%) | 0 (0.0%) |
| $300 to $499 | 200 (26.3%) | 0 (0.0%) |
| $500 to $799 | 206 (27.0%) | 77 (52.0%) |
| $800 to $999 | 73 (9.6%) | 21 (14.2%) |
| $1,000 to $1,499 | 42 (5.5%) | 0 (0.0%) |
| $1,500 to $1,999 | 59 (7.7%) | 24 (16.2%) |
| $2,000 to $2,499 | 6 (0.8%) | 0 (0.0%) |
| $2,500 to $2,999 | 24 (3.2%) | 0 (0.0%) |
| $3,000 or more | 32 (4.2%) | 0 (0.0%) |
| Total | 762 (100.0%) | 148 (100.0%) |
Physical Housing Characteristics in Gumlog
Housing Structures in Gumlog
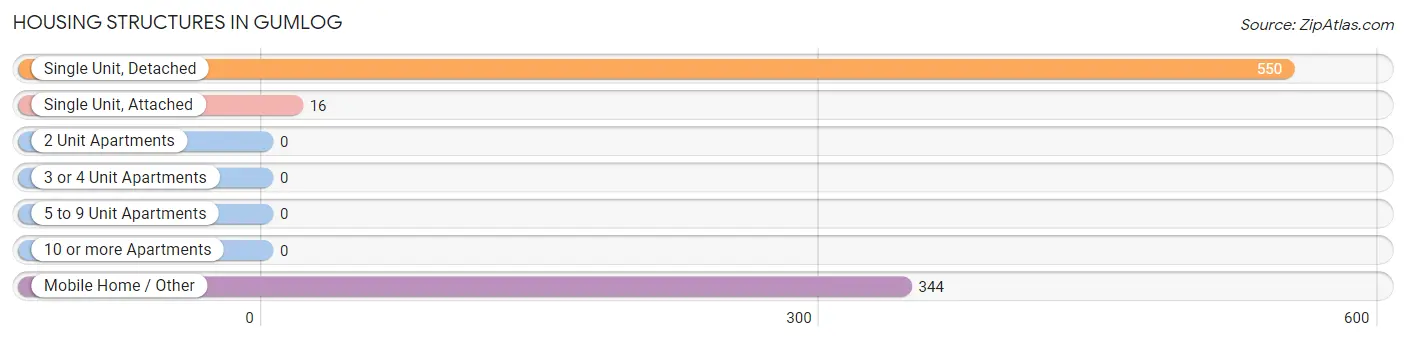
| Structure Type | # Housing Units | % Housing Units |
| Single Unit, Detached | 550 | 60.4% |
| Single Unit, Attached | 16 | 1.8% |
| 2 Unit Apartments | 0 | 0.0% |
| 3 or 4 Unit Apartments | 0 | 0.0% |
| 5 to 9 Unit Apartments | 0 | 0.0% |
| 10 or more Apartments | 0 | 0.0% |
| Mobile Home / Other | 344 | 37.8% |
| Total | 910 | 100.0% |
Housing Structures by Occupancy in Gumlog
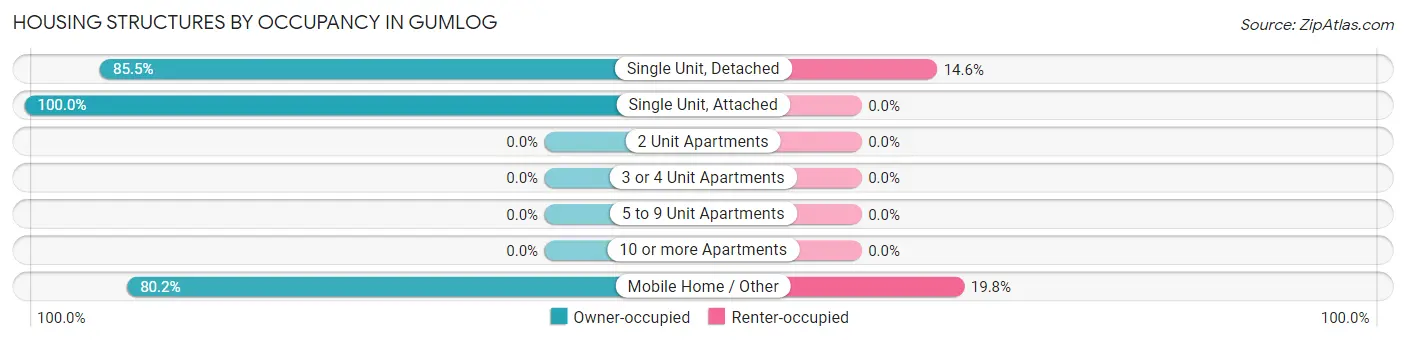
| Structure Type | Owner-occupied | Renter-occupied |
| Single Unit, Detached | 470 (85.5%) | 80 (14.5%) |
| Single Unit, Attached | 16 (100.0%) | 0 (0.0%) |
| 2 Unit Apartments | 0 (0.0%) | 0 (0.0%) |
| 3 or 4 Unit Apartments | 0 (0.0%) | 0 (0.0%) |
| 5 to 9 Unit Apartments | 0 (0.0%) | 0 (0.0%) |
| 10 or more Apartments | 0 (0.0%) | 0 (0.0%) |
| Mobile Home / Other | 276 (80.2%) | 68 (19.8%) |
| Total | 762 (83.7%) | 148 (16.3%) |
Housing Structures by Number of Rooms in Gumlog
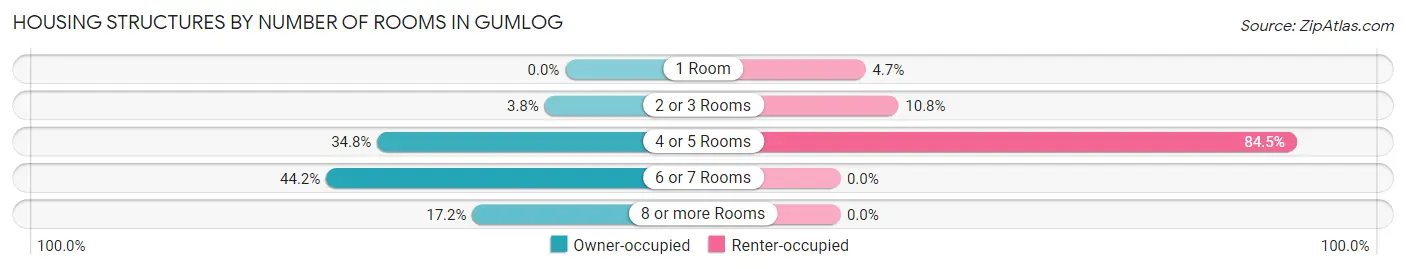
| Number of Rooms | Owner-occupied | Renter-occupied |
| 1 Room | 0 (0.0%) | 7 (4.7%) |
| 2 or 3 Rooms | 29 (3.8%) | 16 (10.8%) |
| 4 or 5 Rooms | 265 (34.8%) | 125 (84.5%) |
| 6 or 7 Rooms | 337 (44.2%) | 0 (0.0%) |
| 8 or more Rooms | 131 (17.2%) | 0 (0.0%) |
| Total | 762 (100.0%) | 148 (100.0%) |
Housing Structure by Heating Type in Gumlog
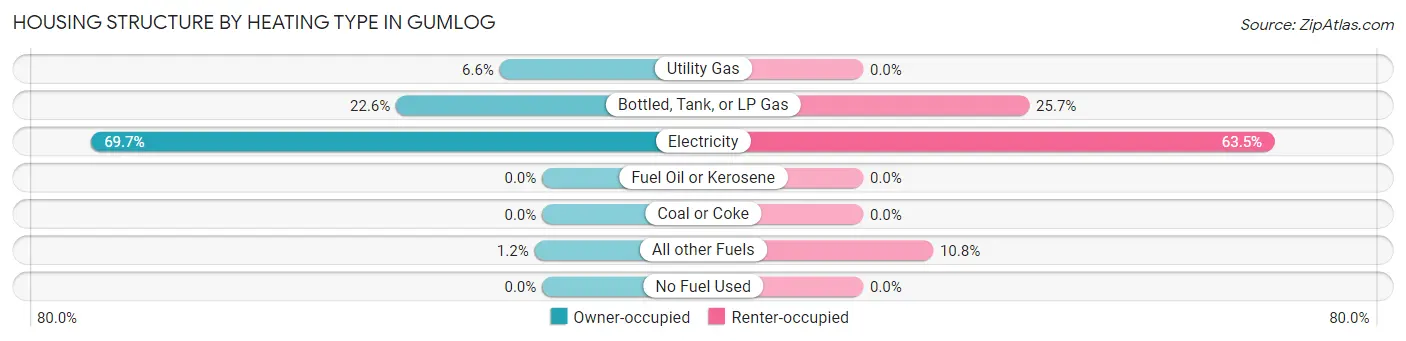
| Heating Type | Owner-occupied | Renter-occupied |
| Utility Gas | 50 (6.6%) | 0 (0.0%) |
| Bottled, Tank, or LP Gas | 172 (22.6%) | 38 (25.7%) |
| Electricity | 531 (69.7%) | 94 (63.5%) |
| Fuel Oil or Kerosene | 0 (0.0%) | 0 (0.0%) |
| Coal or Coke | 0 (0.0%) | 0 (0.0%) |
| All other Fuels | 9 (1.2%) | 16 (10.8%) |
| No Fuel Used | 0 (0.0%) | 0 (0.0%) |
| Total | 762 (100.0%) | 148 (100.0%) |
Household Vehicle Usage in Gumlog
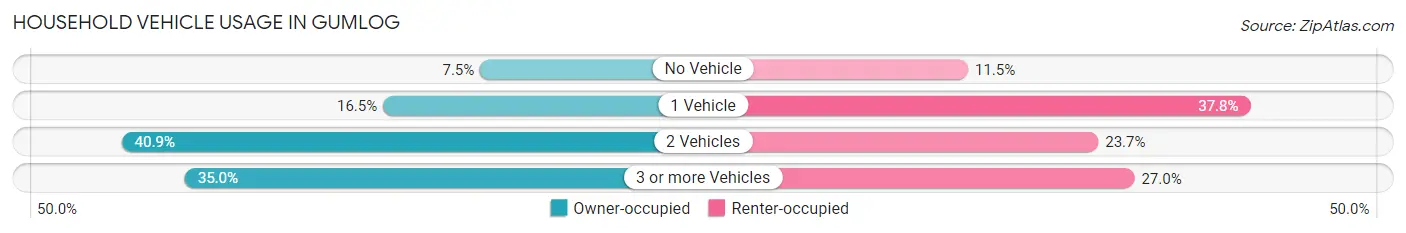
| Vehicles per Household | Owner-occupied | Renter-occupied |
| No Vehicle | 57 (7.5%) | 17 (11.5%) |
| 1 Vehicle | 126 (16.5%) | 56 (37.8%) |
| 2 Vehicles | 312 (40.9%) | 35 (23.6%) |
| 3 or more Vehicles | 267 (35.0%) | 40 (27.0%) |
| Total | 762 (100.0%) | 148 (100.0%) |
Real Estate & Mortgages in Gumlog
Real Estate and Mortgage Overview in Gumlog
| Characteristic | Without Mortgage | With Mortgage |
| Housing Units | 496 | 266 |
| Median Property Value | $201,500 | $110,500 |
| Median Household Income | $64,797 | $61 |
| Monthly Housing Costs | $443 | $25 |
| Real Estate Taxes | $1,304 | $0 |
Property Value by Mortgage Status in Gumlog
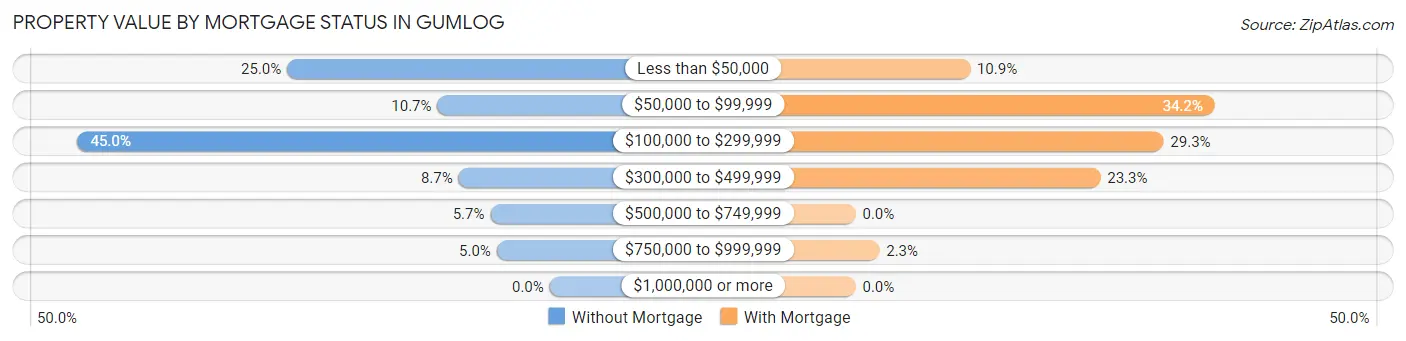
| Property Value | Without Mortgage | With Mortgage |
| Less than $50,000 | 124 (25.0%) | 29 (10.9%) |
| $50,000 to $99,999 | 53 (10.7%) | 91 (34.2%) |
| $100,000 to $299,999 | 223 (45.0%) | 78 (29.3%) |
| $300,000 to $499,999 | 43 (8.7%) | 62 (23.3%) |
| $500,000 to $749,999 | 28 (5.7%) | 0 (0.0%) |
| $750,000 to $999,999 | 25 (5.0%) | 6 (2.3%) |
| $1,000,000 or more | 0 (0.0%) | 0 (0.0%) |
| Total | 496 (100.0%) | 266 (100.0%) |
Household Income by Mortgage Status in Gumlog
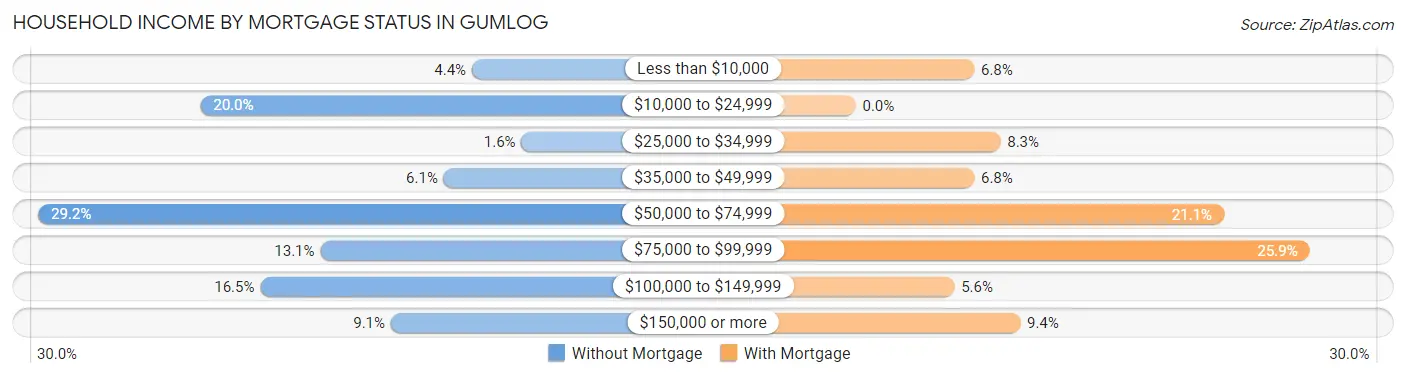
| Household Income | Without Mortgage | With Mortgage |
| Less than $10,000 | 22 (4.4%) | 18 (6.8%) |
| $10,000 to $24,999 | 99 (20.0%) | 0 (0.0%) |
| $25,000 to $34,999 | 8 (1.6%) | 22 (8.3%) |
| $35,000 to $49,999 | 30 (6.0%) | 18 (6.8%) |
| $50,000 to $74,999 | 145 (29.2%) | 56 (21.0%) |
| $75,000 to $99,999 | 65 (13.1%) | 69 (25.9%) |
| $100,000 to $149,999 | 82 (16.5%) | 15 (5.6%) |
| $150,000 or more | 45 (9.1%) | 25 (9.4%) |
| Total | 496 (100.0%) | 266 (100.0%) |
Property Value to Household Income Ratio in Gumlog
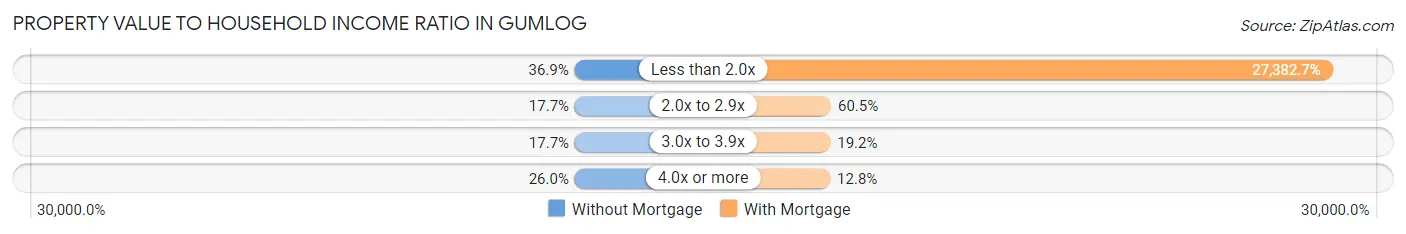
| Value-to-Income Ratio | Without Mortgage | With Mortgage |
| Less than 2.0x | 183 (36.9%) | 72,838 (27,382.7%) |
| 2.0x to 2.9x | 88 (17.7%) | 161 (60.5%) |
| 3.0x to 3.9x | 88 (17.7%) | 51 (19.2%) |
| 4.0x or more | 129 (26.0%) | 34 (12.8%) |
| Total | 496 (100.0%) | 266 (100.0%) |
Real Estate Taxes by Mortgage Status in Gumlog
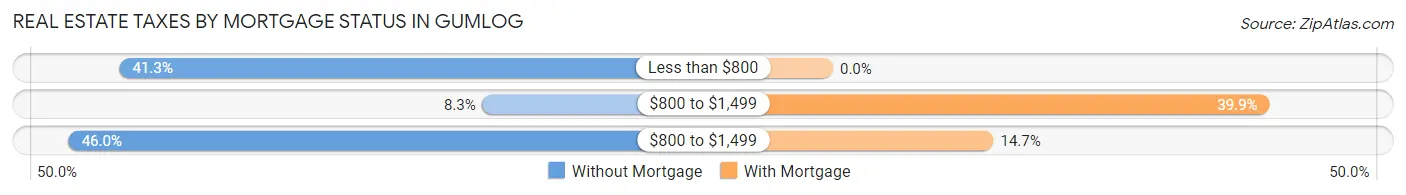
| Property Taxes | Without Mortgage | With Mortgage |
| Less than $800 | 205 (41.3%) | 0 (0.0%) |
| $800 to $1,499 | 41 (8.3%) | 106 (39.9%) |
| $800 to $1,499 | 228 (46.0%) | 39 (14.7%) |
| Total | 496 (100.0%) | 266 (100.0%) |
Health & Disability in Gumlog
Health Insurance Coverage by Age in Gumlog
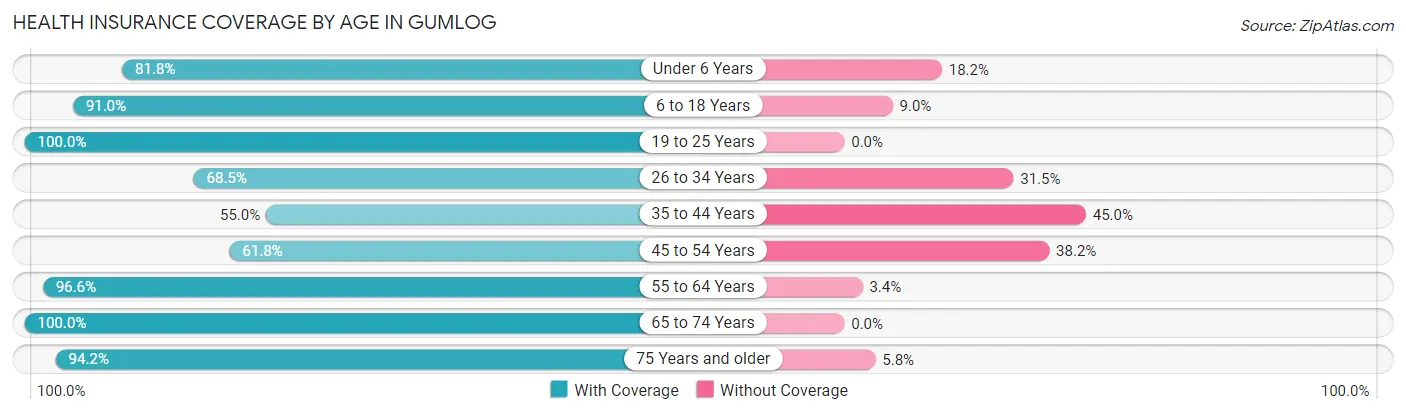
| Age Bracket | With Coverage | Without Coverage |
| Under 6 Years | 45 (81.8%) | 10 (18.2%) |
| 6 to 18 Years | 212 (91.0%) | 21 (9.0%) |
| 19 to 25 Years | 44 (100.0%) | 0 (0.0%) |
| 26 to 34 Years | 189 (68.5%) | 87 (31.5%) |
| 35 to 44 Years | 166 (55.0%) | 136 (45.0%) |
| 45 to 54 Years | 144 (61.8%) | 89 (38.2%) |
| 55 to 64 Years | 484 (96.6%) | 17 (3.4%) |
| 65 to 74 Years | 240 (100.0%) | 0 (0.0%) |
| 75 Years and older | 309 (94.2%) | 19 (5.8%) |
| Total | 1,833 (82.9%) | 379 (17.1%) |
Health Insurance Coverage by Citizenship Status in Gumlog
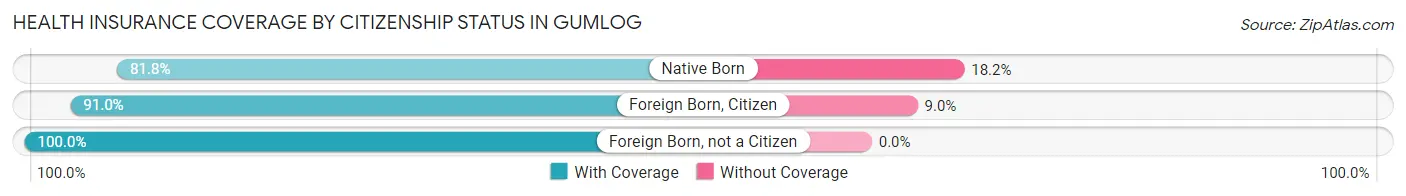
| Citizenship Status | With Coverage | Without Coverage |
| Native Born | 45 (81.8%) | 10 (18.2%) |
| Foreign Born, Citizen | 212 (91.0%) | 21 (9.0%) |
| Foreign Born, not a Citizen | 44 (100.0%) | 0 (0.0%) |
Health Insurance Coverage by Household Income in Gumlog
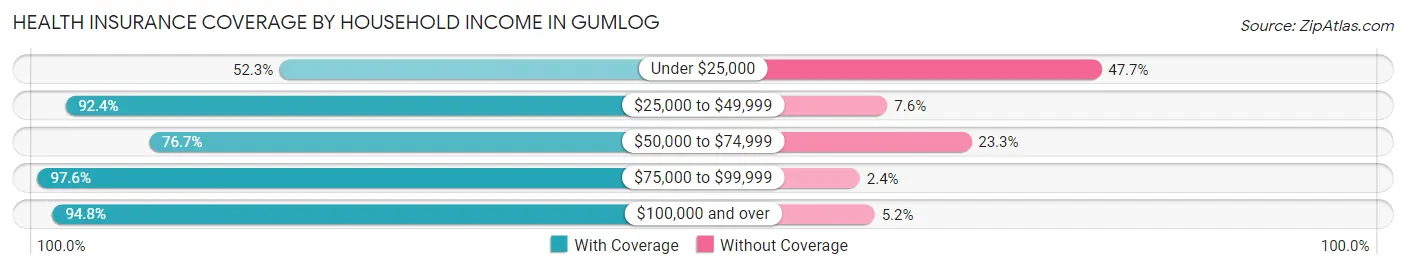
| Household Income | With Coverage | Without Coverage |
| Under $25,000 | 192 (52.3%) | 175 (47.7%) |
| $25,000 to $49,999 | 267 (92.4%) | 22 (7.6%) |
| $50,000 to $74,999 | 470 (76.7%) | 143 (23.3%) |
| $75,000 to $99,999 | 360 (97.6%) | 9 (2.4%) |
| $100,000 and over | 544 (94.8%) | 30 (5.2%) |
Public vs Private Health Insurance Coverage by Age in Gumlog
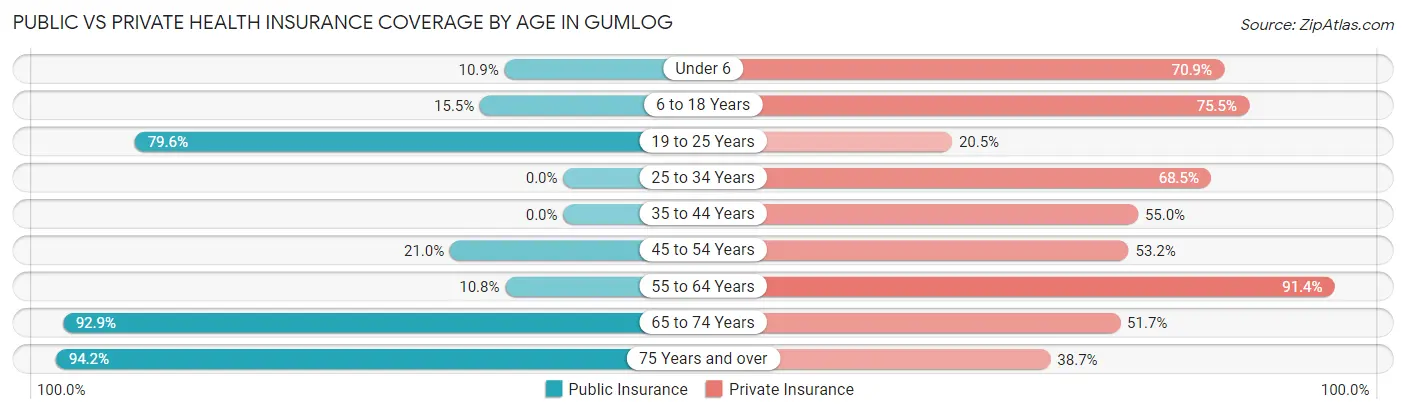
| Age Bracket | Public Insurance | Private Insurance |
| Under 6 | 6 (10.9%) | 39 (70.9%) |
| 6 to 18 Years | 36 (15.4%) | 176 (75.5%) |
| 19 to 25 Years | 35 (79.5%) | 9 (20.4%) |
| 25 to 34 Years | 0 (0.0%) | 189 (68.5%) |
| 35 to 44 Years | 0 (0.0%) | 166 (55.0%) |
| 45 to 54 Years | 49 (21.0%) | 124 (53.2%) |
| 55 to 64 Years | 54 (10.8%) | 458 (91.4%) |
| 65 to 74 Years | 223 (92.9%) | 124 (51.7%) |
| 75 Years and over | 309 (94.2%) | 127 (38.7%) |
| Total | 712 (32.2%) | 1,412 (63.8%) |
Disability Status by Sex by Age in Gumlog
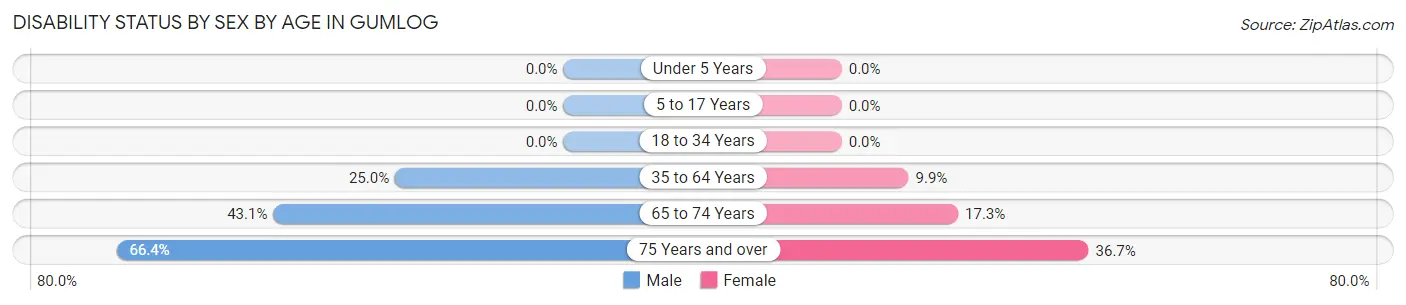
| Age Bracket | Male | Female |
| Under 5 Years | 0 (0.0%) | 0 (0.0%) |
| 5 to 17 Years | 0 (0.0%) | 0 (0.0%) |
| 18 to 34 Years | 0 (0.0%) | 0 (0.0%) |
| 35 to 64 Years | 133 (25.0%) | 50 (9.9%) |
| 65 to 74 Years | 56 (43.1%) | 19 (17.3%) |
| 75 Years and over | 71 (66.4%) | 81 (36.6%) |
Disability Class by Sex by Age in Gumlog
Disability Class: Hearing Difficulty
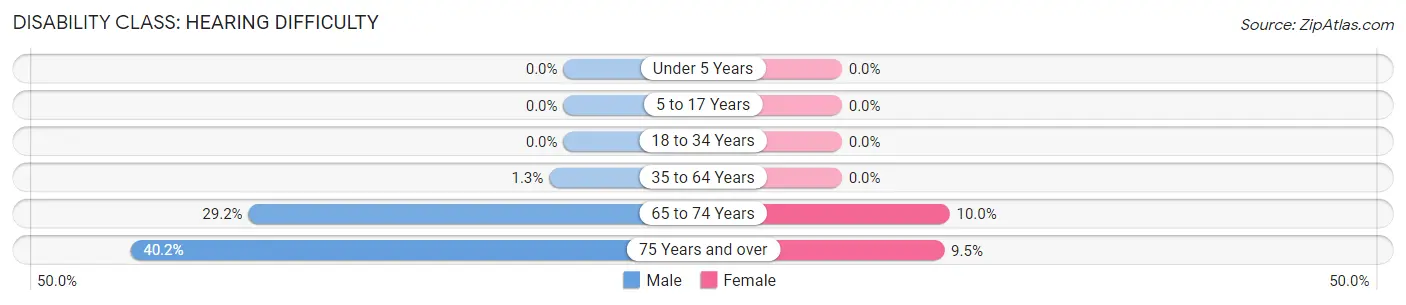
| Age Bracket | Male | Female |
| Under 5 Years | 0 (0.0%) | 0 (0.0%) |
| 5 to 17 Years | 0 (0.0%) | 0 (0.0%) |
| 18 to 34 Years | 0 (0.0%) | 0 (0.0%) |
| 35 to 64 Years | 7 (1.3%) | 0 (0.0%) |
| 65 to 74 Years | 38 (29.2%) | 11 (10.0%) |
| 75 Years and over | 43 (40.2%) | 21 (9.5%) |
Disability Class: Vision Difficulty
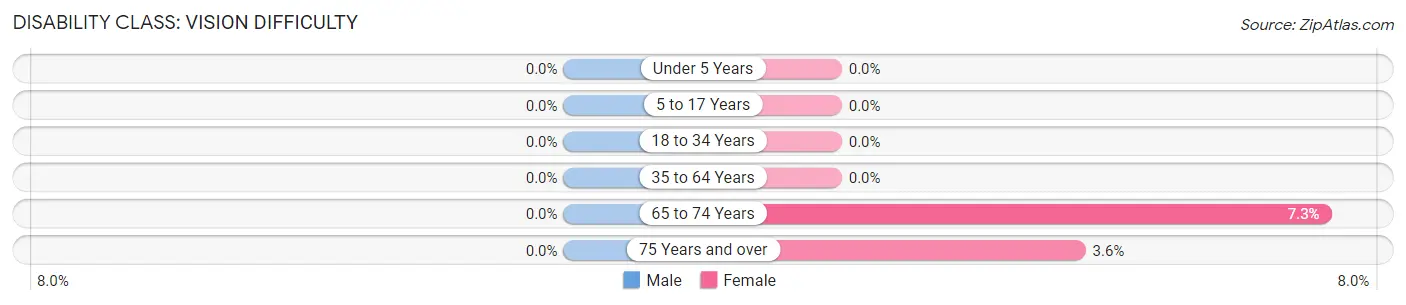
| Age Bracket | Male | Female |
| Under 5 Years | 0 (0.0%) | 0 (0.0%) |
| 5 to 17 Years | 0 (0.0%) | 0 (0.0%) |
| 18 to 34 Years | 0 (0.0%) | 0 (0.0%) |
| 35 to 64 Years | 0 (0.0%) | 0 (0.0%) |
| 65 to 74 Years | 0 (0.0%) | 8 (7.3%) |
| 75 Years and over | 0 (0.0%) | 8 (3.6%) |
Disability Class: Cognitive Difficulty
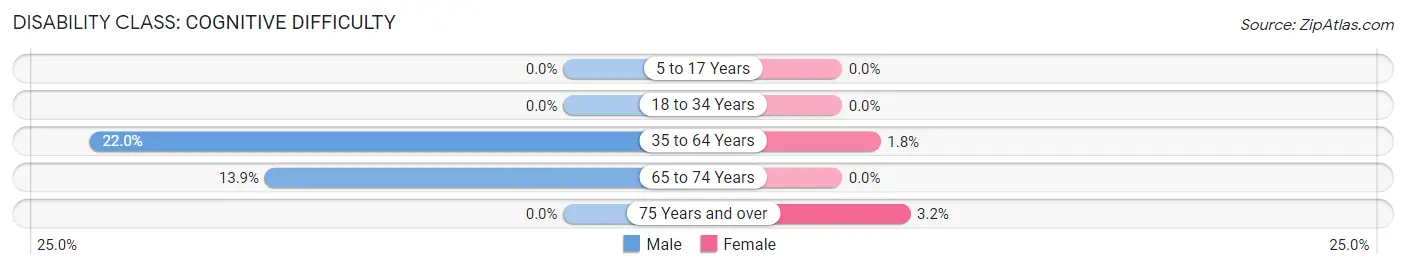
| Age Bracket | Male | Female |
| 5 to 17 Years | 0 (0.0%) | 0 (0.0%) |
| 18 to 34 Years | 0 (0.0%) | 0 (0.0%) |
| 35 to 64 Years | 117 (22.0%) | 9 (1.8%) |
| 65 to 74 Years | 18 (13.9%) | 0 (0.0%) |
| 75 Years and over | 0 (0.0%) | 7 (3.2%) |
Disability Class: Ambulatory Difficulty
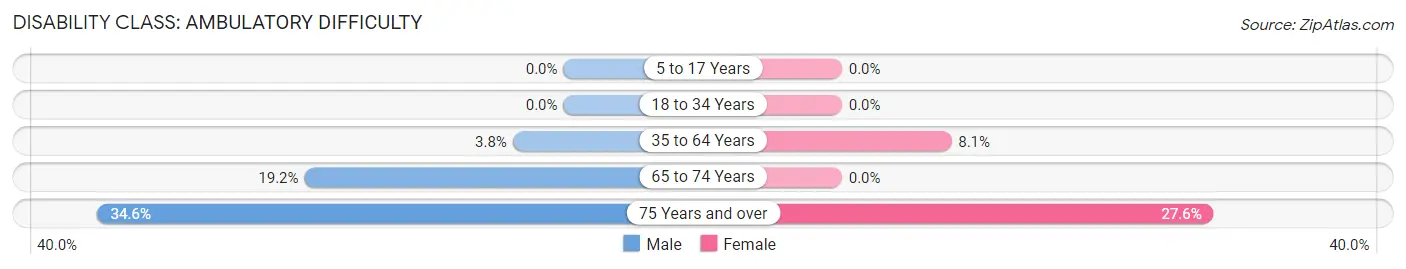
| Age Bracket | Male | Female |
| 5 to 17 Years | 0 (0.0%) | 0 (0.0%) |
| 18 to 34 Years | 0 (0.0%) | 0 (0.0%) |
| 35 to 64 Years | 20 (3.8%) | 41 (8.1%) |
| 65 to 74 Years | 25 (19.2%) | 0 (0.0%) |
| 75 Years and over | 37 (34.6%) | 61 (27.6%) |
Disability Class: Self-Care Difficulty
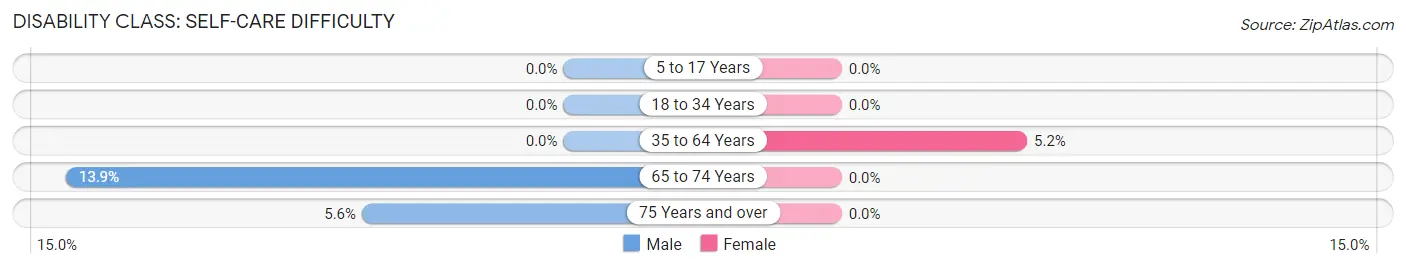
| Age Bracket | Male | Female |
| 5 to 17 Years | 0 (0.0%) | 0 (0.0%) |
| 18 to 34 Years | 0 (0.0%) | 0 (0.0%) |
| 35 to 64 Years | 0 (0.0%) | 26 (5.2%) |
| 65 to 74 Years | 18 (13.9%) | 0 (0.0%) |
| 75 Years and over | 6 (5.6%) | 0 (0.0%) |
Technology Access in Gumlog
Computing Device Access in Gumlog
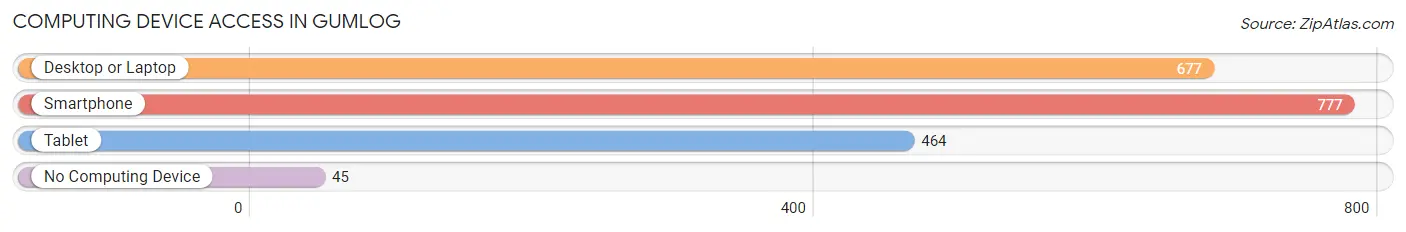
| Device Type | # Households | % Households |
| Desktop or Laptop | 677 | 74.4% |
| Smartphone | 777 | 85.4% |
| Tablet | 464 | 51.0% |
| No Computing Device | 45 | 5.0% |
| Total | 910 | 100.0% |
Internet Access in Gumlog
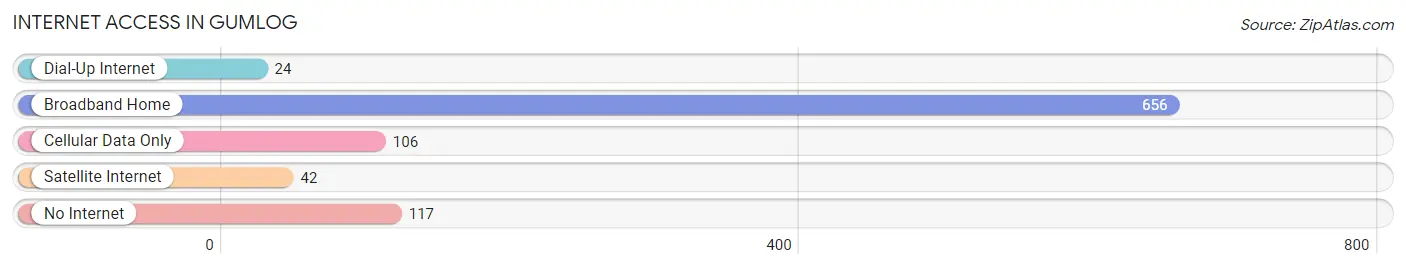
| Internet Type | # Households | % Households |
| Dial-Up Internet | 24 | 2.6% |
| Broadband Home | 656 | 72.1% |
| Cellular Data Only | 106 | 11.7% |
| Satellite Internet | 42 | 4.6% |
| No Internet | 117 | 12.9% |
| Total | 910 | 100.0% |
Gumlog Summary
Gumlog is a small unincorporated community located in the northeastern corner of Habersham County, Georgia. It is situated in the foothills of the Blue Ridge Mountains, approximately 30 miles northeast of Gainesville. The community is named after a nearby creek, which was named for the abundance of gum trees in the area.
History
Gumlog was first settled in the early 1800s by a group of settlers from North Carolina. The settlers were attracted to the area by the abundance of timber and the fertile soil. The first post office was established in 1845, and the community was officially incorporated in 1848.
The town grew slowly over the years, and by the turn of the century, it had become a thriving agricultural community. The town was home to several sawmills, gristmills, and a cotton gin. The town also had a general store, a blacksmith shop, and a school.
In the early 1900s, the town began to decline as the timber industry moved away and the population began to dwindle. The town was eventually abandoned in the 1950s, and the post office was closed in 1960.
Geography
Gumlog is located in the foothills of the Blue Ridge Mountains, approximately 30 miles northeast of Gainesville. The town is situated on the banks of Gumlog Creek, which is a tributary of the Chattahoochee River. The town is surrounded by rolling hills and forests, and is home to several small lakes and streams.
The climate in Gumlog is mild and humid, with temperatures ranging from the mid-50s in the winter to the mid-80s in the summer. The area receives an average of 50 inches of rain per year.
Economy
Gumlog is a small, rural community with a population of less than 500 people. The town is home to several small businesses, including a general store, a gas station, and a few restaurants. The town is also home to a few small farms, which produce a variety of crops, including corn, soybeans, and hay.
The town is also home to a few small manufacturing companies, which produce a variety of products, including furniture, clothing, and wood products.
Demographics
As of the 2010 census, the population of Gumlog was 478. The racial makeup of the town was 97.3% White, 0.4% African American, 0.2% Native American, 0.2% Asian, 0.2% from other races, and 1.9% from two or more races. Hispanic or Latino of any race were 1.3% of the population.
The median household income in Gumlog was $31,250, and the median family income was $37,500. The per capita income for the town was $15,945. About 15.3% of families and 18.2% of the population were below the poverty line, including 25.3% of those under age 18 and 11.1% of those age 65 or over.
Common Questions
What is Per Capita Income in Gumlog?
Per Capita income in Gumlog is $41,223.
What is the Median Family Income in Gumlog?
Median Family Income in Gumlog is $73,401.
What is the Median Household income in Gumlog?
Median Household Income in Gumlog is $63,735.
What is Income or Wage Gap in Gumlog?
Income or Wage Gap in Gumlog is 59.2%.
Women in Gumlog earn 40.8 cents for every dollar earned by a man.
What is Inequality or Gini Index in Gumlog?
Inequality or Gini Index in Gumlog is 0.52.
What is the Total Population of Gumlog?
Total Population of Gumlog is 2,212.
What is the Total Male Population of Gumlog?
Total Male Population of Gumlog is 1,102.
What is the Total Female Population of Gumlog?
Total Female Population of Gumlog is 1,110.
What is the Ratio of Males per 100 Females in Gumlog?
There are 99.28 Males per 100 Females in Gumlog.
What is the Ratio of Females per 100 Males in Gumlog?
There are 100.73 Females per 100 Males in Gumlog.
What is the Median Population Age in Gumlog?
Median Population Age in Gumlog is 54.1 Years.
What is the Average Family Size in Gumlog
Average Family Size in Gumlog is 2.8 People.
What is the Average Household Size in Gumlog
Average Household Size in Gumlog is 2.4 People.
How Large is the Labor Force in Gumlog?
There are 987 People in the Labor Forcein in Gumlog.
What is the Percentage of People in the Labor Force in Gumlog?
50.1% of People are in the Labor Force in Gumlog.
What is the Unemployment Rate in Gumlog?
Unemployment Rate in Gumlog is 5.0%.