Greensboro, GA Map & Demographics
Greensboro Map
Greensboro Overview
$29,907
PER CAPITA INCOME
$44,605
AVG FAMILY INCOME
$42,534
AVG HOUSEHOLD INCOME
$14,075
FAMILY INCOME DEFICIT
0.55
INEQUALITY / GINI INDEX
3,573
TOTAL POPULATION
1,402
MALE POPULATION
2,171
FEMALE POPULATION
64.58
MALES / 100 FEMALES
154.85
FEMALES / 100 MALES
40.4
MEDIAN AGE
3.3
AVG FAMILY SIZE
2.3
AVG HOUSEHOLD SIZE
1,662
LABOR FORCE [ PEOPLE ]
55.6%
PERCENT IN LABOR FORCE
10.1%
UNEMPLOYMENT RATE
Greensboro Zip Codes
Income in Greensboro
Income Overview in Greensboro
Per Capita Income in Greensboro is $29,907, while median incomes of families and households are $44,605 and $42,534 respectively.
| Characteristic | Number | Measure |
| Per Capita Income | 3,573 | $29,907 |
| Median Family Income | 822 | $44,605 |
| Mean Family Income | 822 | $88,614 |
| Median Household Income | 1,526 | $42,534 |
| Mean Household Income | 1,526 | $65,369 |
| Income Deficit | 822 | $14,075 |
| Wage / Income Gap (%) | 3,573 | 0.00% |
| Wage / Income Gap ($) | 3,573 | 100.00¢ per $1 |
| Gini / Inequality Index | 3,573 | 0.55 |
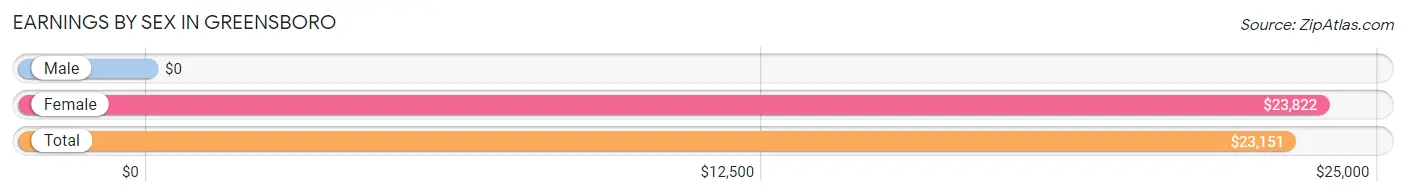
Earnings by Sex in Greensboro
| Sex | Number | Average Earnings |
| Male | 832 (45.1%) | $0 |
| Female | 1,014 (54.9%) | $23,822 |
| Total | 1,846 (100.0%) | $23,151 |
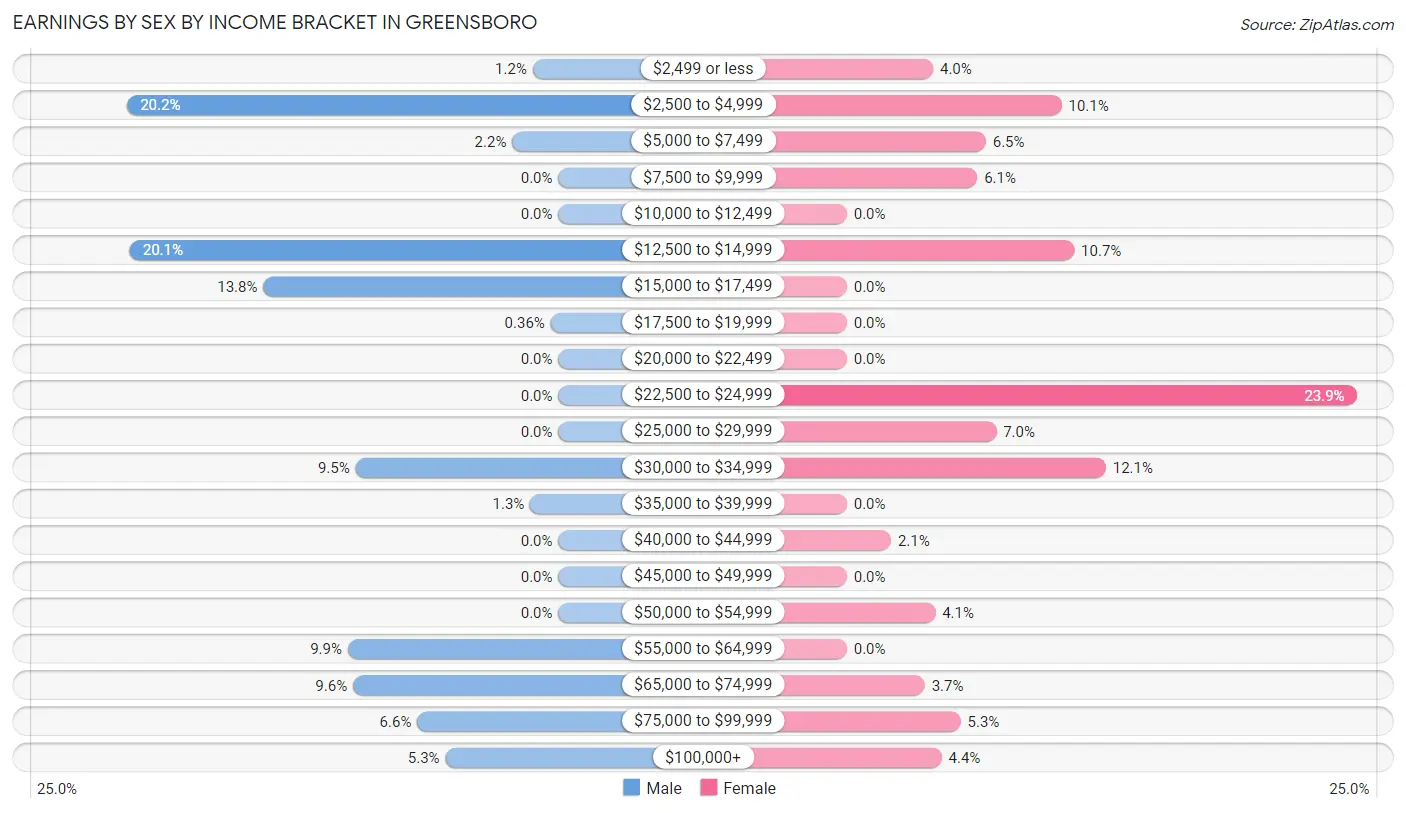
Earnings by Sex by Income Bracket in Greensboro
The most common earnings brackets in Greensboro are $2,500 to $4,999 for men (168 | 20.2%) and $22,500 to $24,999 for women (242 | 23.9%).
| Income | Male | Female |
| $2,499 or less | 10 (1.2%) | 41 (4.0%) |
| $2,500 to $4,999 | 168 (20.2%) | 102 (10.1%) |
| $5,000 to $7,499 | 18 (2.2%) | 66 (6.5%) |
| $7,500 to $9,999 | 0 (0.0%) | 62 (6.1%) |
| $10,000 to $12,499 | 0 (0.0%) | 0 (0.0%) |
| $12,500 to $14,999 | 167 (20.1%) | 108 (10.6%) |
| $15,000 to $17,499 | 115 (13.8%) | 0 (0.0%) |
| $17,500 to $19,999 | 3 (0.4%) | 0 (0.0%) |
| $20,000 to $22,499 | 0 (0.0%) | 0 (0.0%) |
| $22,500 to $24,999 | 0 (0.0%) | 242 (23.9%) |
| $25,000 to $29,999 | 0 (0.0%) | 71 (7.0%) |
| $30,000 to $34,999 | 79 (9.5%) | 123 (12.1%) |
| $35,000 to $39,999 | 11 (1.3%) | 0 (0.0%) |
| $40,000 to $44,999 | 0 (0.0%) | 21 (2.1%) |
| $45,000 to $49,999 | 0 (0.0%) | 0 (0.0%) |
| $50,000 to $54,999 | 0 (0.0%) | 42 (4.1%) |
| $55,000 to $64,999 | 82 (9.9%) | 0 (0.0%) |
| $65,000 to $74,999 | 80 (9.6%) | 37 (3.6%) |
| $75,000 to $99,999 | 55 (6.6%) | 54 (5.3%) |
| $100,000+ | 44 (5.3%) | 45 (4.4%) |
| Total | 832 (100.0%) | 1,014 (100.0%) |
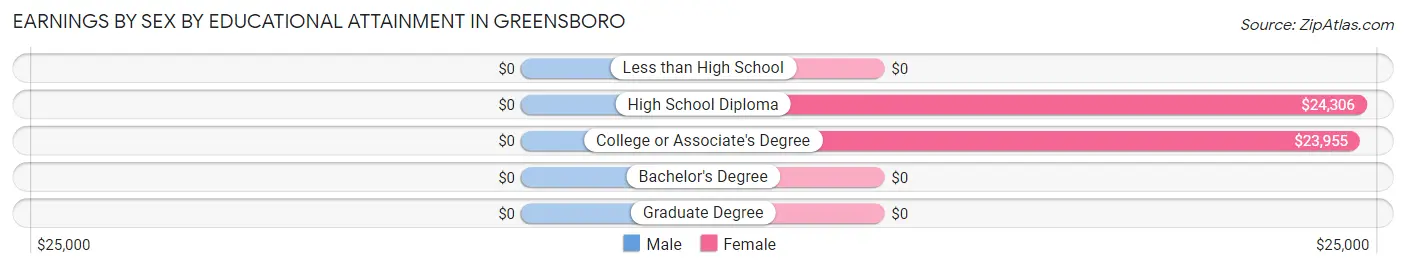
Earnings by Sex by Educational Attainment in Greensboro
| Educational Attainment | Male Income | Female Income |
| Less than High School | - | - |
| High School Diploma | - | - |
| College or Associate's Degree | - | - |
| Bachelor's Degree | - | - |
| Graduate Degree | - | - |
| Total | $55,381 | $24,731 |
Family Income in Greensboro
Family Income Brackets in Greensboro
According to the Greensboro family income data, there are 210 families falling into the $35,000 to $49,999 income range, which is the most common income bracket and makes up 25.6% of all families.
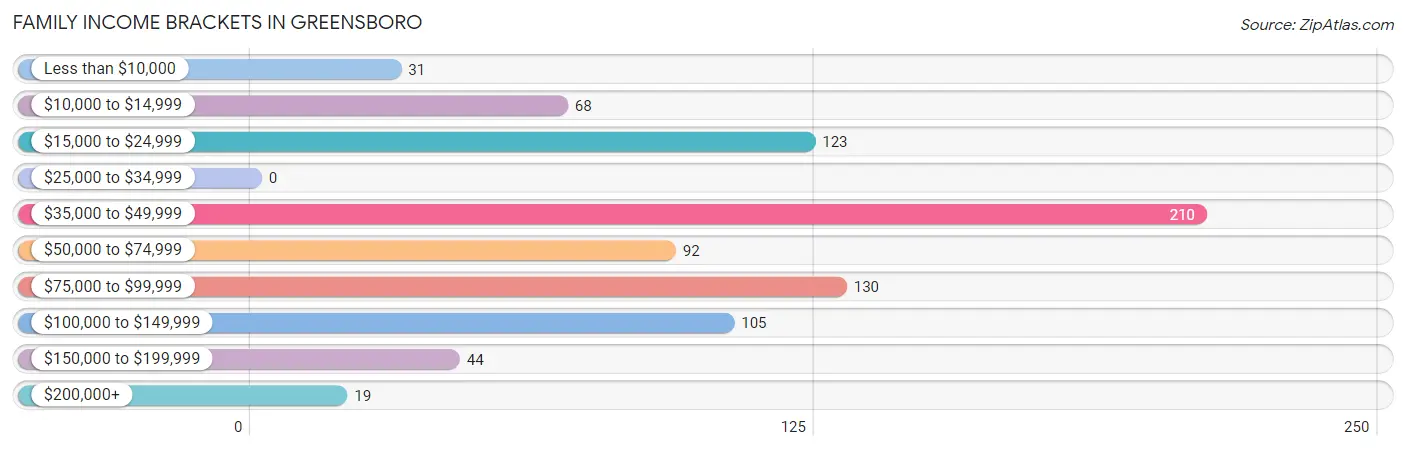
| Income Bracket | # Families | % Families |
| Less than $10,000 | 31 | 3.8% |
| $10,000 to $14,999 | 68 | 8.3% |
| $15,000 to $24,999 | 123 | 15.0% |
| $25,000 to $34,999 | 0 | 0.0% |
| $35,000 to $49,999 | 210 | 25.5% |
| $50,000 to $74,999 | 92 | 11.2% |
| $75,000 to $99,999 | 130 | 15.8% |
| $100,000 to $149,999 | 105 | 12.8% |
| $150,000 to $199,999 | 44 | 5.4% |
| $200,000+ | 19 | 2.3% |
Family Income by Famaliy Size in Greensboro
2-person families (341 | 41.5%) account for the highest median family income in Greensboro with $87,720 per family, while 2-person families (341 | 41.5%) have the highest median income of $43,860 per family member.
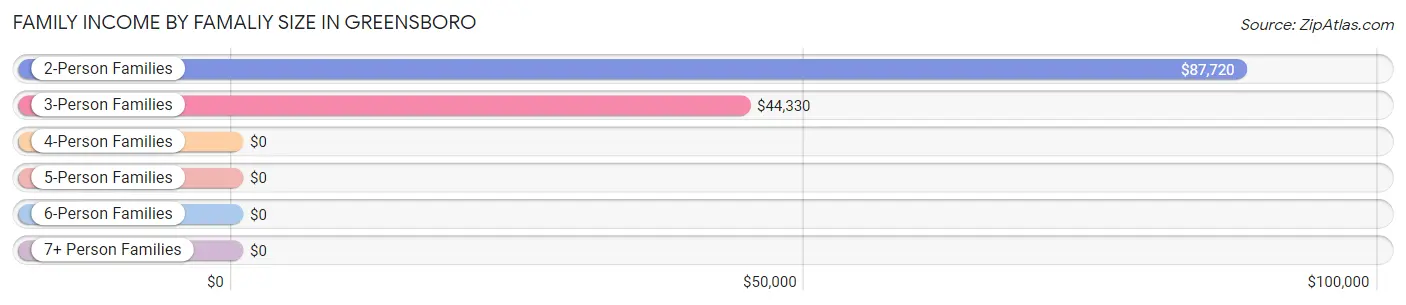
| Income Bracket | # Families | Median Income |
| 2-Person Families | 341 (41.5%) | $87,720 |
| 3-Person Families | 340 (41.4%) | $44,330 |
| 4-Person Families | 141 (17.2%) | $0 |
| 5-Person Families | 0 (0.0%) | $0 |
| 6-Person Families | 0 (0.0%) | $0 |
| 7+ Person Families | 0 (0.0%) | $0 |
| Total | 822 (100.0%) | $44,605 |
Family Income by Number of Earners in Greensboro
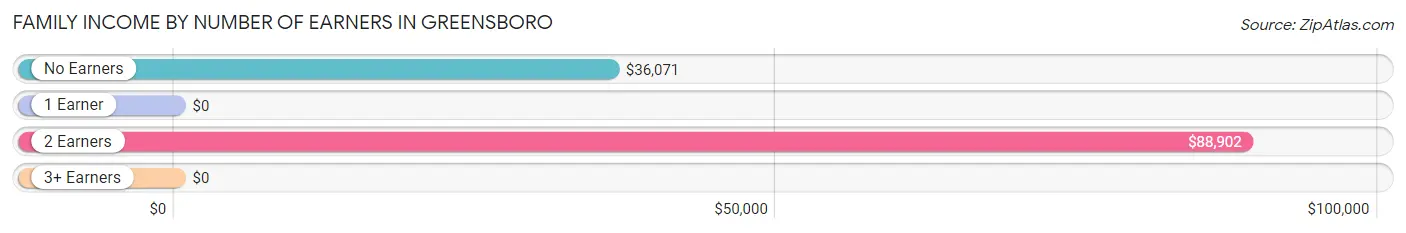
| Number of Earners | # Families | Median Income |
| No Earners | 128 (15.6%) | $36,071 |
| 1 Earner | 280 (34.1%) | $0 |
| 2 Earners | 299 (36.4%) | $88,902 |
| 3+ Earners | 115 (14.0%) | $0 |
| Total | 822 (100.0%) | $44,605 |
Household Income in Greensboro
Household Income Brackets in Greensboro
With 240 households falling in the category, the $10,000 to $14,999 income range is the most frequent in Greensboro, accounting for 15.7% of all households. In contrast, only 18 households (1.2%) fall into the $200,000+ income bracket, making it the least populous group.
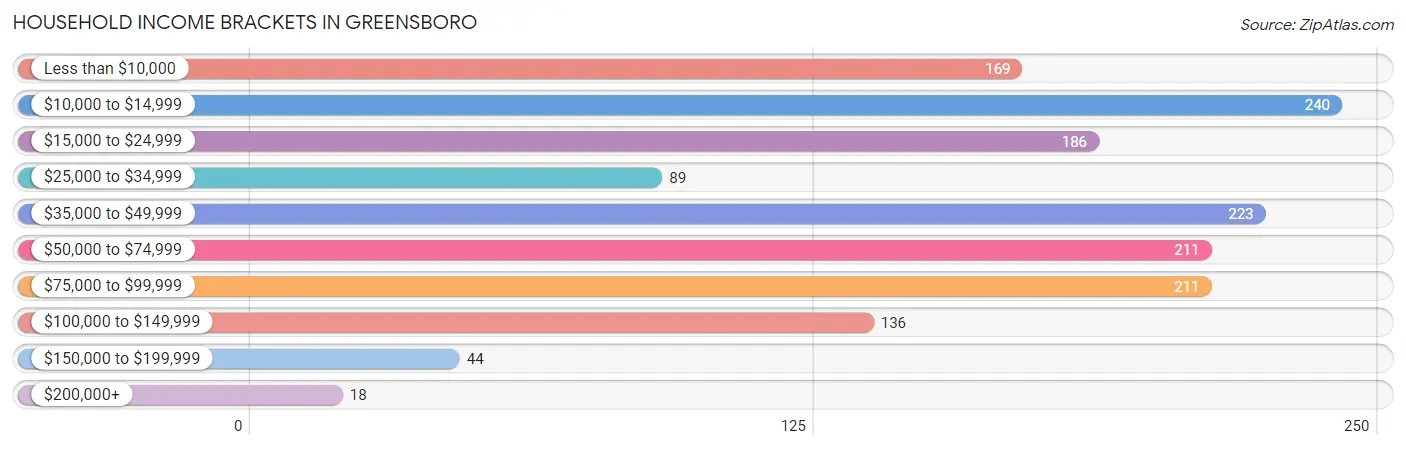
| Income Bracket | # Households | % Households |
| Less than $10,000 | 169 | 11.1% |
| $10,000 to $14,999 | 240 | 15.7% |
| $15,000 to $24,999 | 186 | 12.2% |
| $25,000 to $34,999 | 89 | 5.8% |
| $35,000 to $49,999 | 223 | 14.6% |
| $50,000 to $74,999 | 211 | 13.8% |
| $75,000 to $99,999 | 211 | 13.8% |
| $100,000 to $149,999 | 136 | 8.9% |
| $150,000 to $199,999 | 44 | 2.9% |
| $200,000+ | 18 | 1.2% |
Household Income by Householder Age in Greensboro
The median household income in Greensboro is $42,534, with the highest median household income of $66,743 found in the 25 to 44 years age bracket for the primary householder. A total of 393 households (25.8%) fall into this category. Meanwhile, the 15 to 24 years age bracket for the primary householder has the lowest median household income of $0, with 68 households (4.5%) in this group.
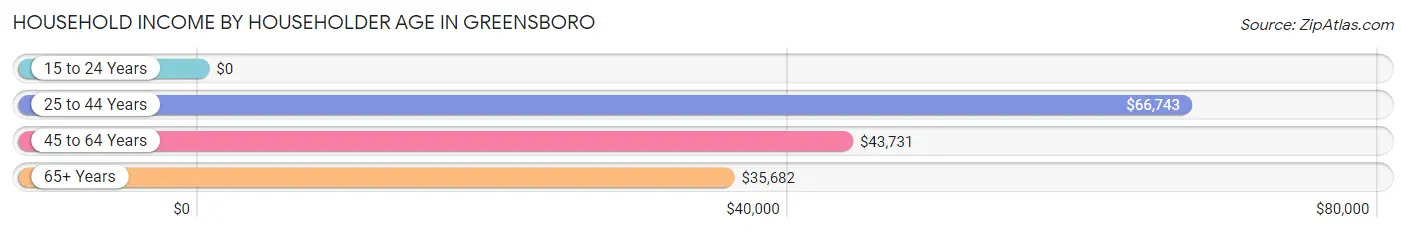
| Income Bracket | # Households | Median Income |
| 15 to 24 Years | 68 (4.5%) | $0 |
| 25 to 44 Years | 393 (25.8%) | $66,743 |
| 45 to 64 Years | 515 (33.8%) | $43,731 |
| 65+ Years | 550 (36.0%) | $35,682 |
| Total | 1,526 (100.0%) | $42,534 |
Poverty in Greensboro
Income Below Poverty by Sex and Age in Greensboro
With 9.9% poverty level for males and 32.0% for females among the residents of Greensboro, 12 to 14 year old males and under 5 year old females are the most vulnerable to poverty, with 42 males (100.0%) and 77 females (100.0%) in their respective age groups living below the poverty level.
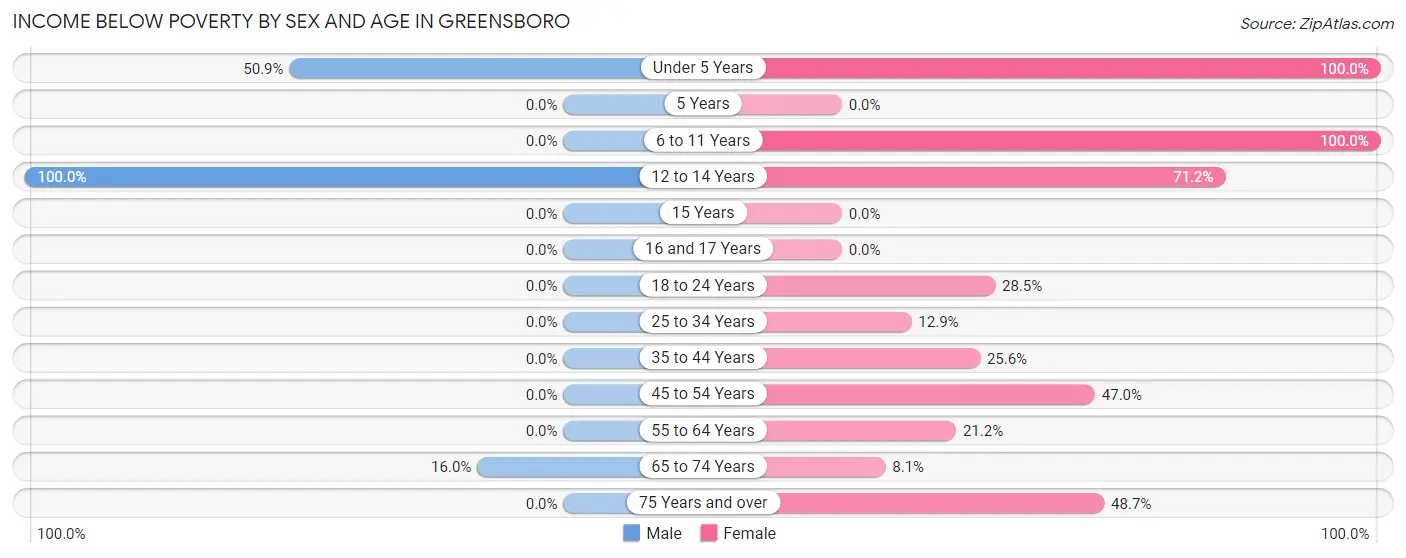
| Age Bracket | Male | Female |
| Under 5 Years | 59 (50.9%) | 77 (100.0%) |
| 5 Years | 0 (0.0%) | 0 (0.0%) |
| 6 to 11 Years | 0 (0.0%) | 39 (100.0%) |
| 12 to 14 Years | 42 (100.0%) | 79 (71.2%) |
| 15 Years | 0 (0.0%) | 0 (0.0%) |
| 16 and 17 Years | 0 (0.0%) | 0 (0.0%) |
| 18 to 24 Years | 0 (0.0%) | 68 (28.4%) |
| 25 to 34 Years | 0 (0.0%) | 31 (12.9%) |
| 35 to 44 Years | 0 (0.0%) | 40 (25.6%) |
| 45 to 54 Years | 0 (0.0%) | 163 (47.0%) |
| 55 to 64 Years | 0 (0.0%) | 88 (21.2%) |
| 65 to 74 Years | 32 (16.0%) | 27 (8.1%) |
| 75 Years and over | 0 (0.0%) | 75 (48.7%) |
| Total | 133 (9.9%) | 687 (32.0%) |
Income Above Poverty by Sex and Age in Greensboro
According to the poverty statistics in Greensboro, males aged 5 years and females aged 5 years are the age groups that are most secure financially, with 100.0% of males and 100.0% of females in these age groups living above the poverty line.
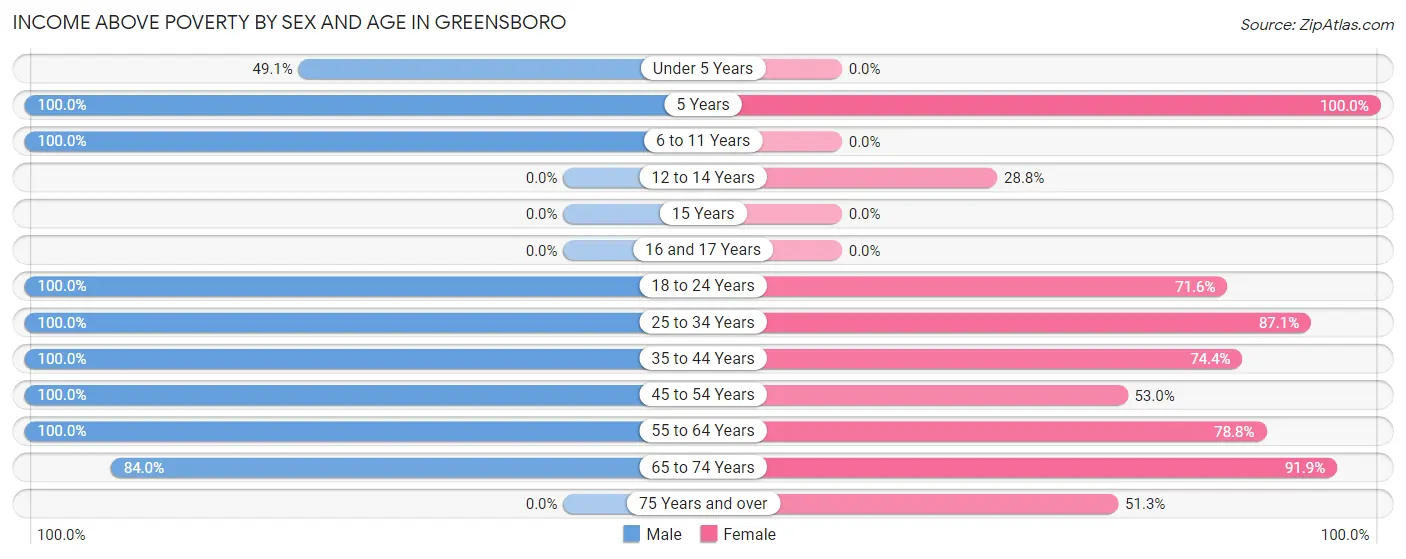
| Age Bracket | Male | Female |
| Under 5 Years | 57 (49.1%) | 0 (0.0%) |
| 5 Years | 59 (100.0%) | 38 (100.0%) |
| 6 to 11 Years | 101 (100.0%) | 0 (0.0%) |
| 12 to 14 Years | 0 (0.0%) | 32 (28.8%) |
| 15 Years | 0 (0.0%) | 0 (0.0%) |
| 16 and 17 Years | 0 (0.0%) | 0 (0.0%) |
| 18 to 24 Years | 335 (100.0%) | 171 (71.6%) |
| 25 to 34 Years | 230 (100.0%) | 209 (87.1%) |
| 35 to 44 Years | 95 (100.0%) | 116 (74.4%) |
| 45 to 54 Years | 106 (100.0%) | 184 (53.0%) |
| 55 to 64 Years | 61 (100.0%) | 327 (78.8%) |
| 65 to 74 Years | 168 (84.0%) | 307 (91.9%) |
| 75 Years and over | 0 (0.0%) | 79 (51.3%) |
| Total | 1,212 (90.1%) | 1,463 (68.0%) |
Income Below Poverty Among Married-Couple Families in Greensboro
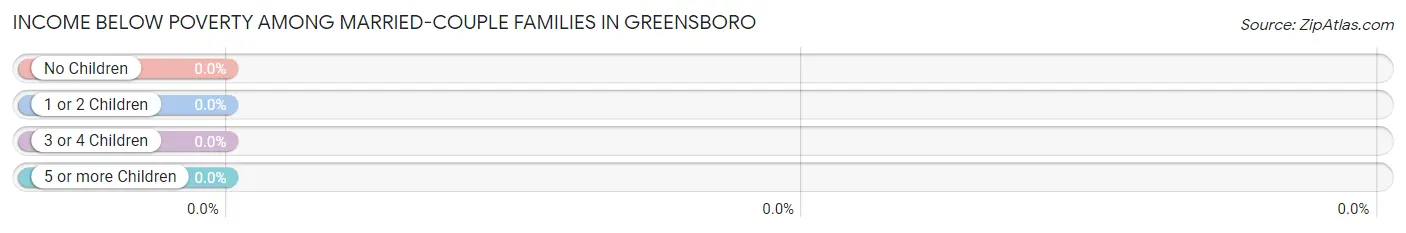
| Children | Above Poverty | Below Poverty |
| No Children | 252 (100.0%) | 0 (0.0%) |
| 1 or 2 Children | 62 (100.0%) | 0 (0.0%) |
| 3 or 4 Children | 0 (0.0%) | 0 (0.0%) |
| 5 or more Children | 0 (0.0%) | 0 (0.0%) |
| Total | 314 (100.0%) | 0 (0.0%) |
Income Below Poverty Among Single-Parent Households in Greensboro
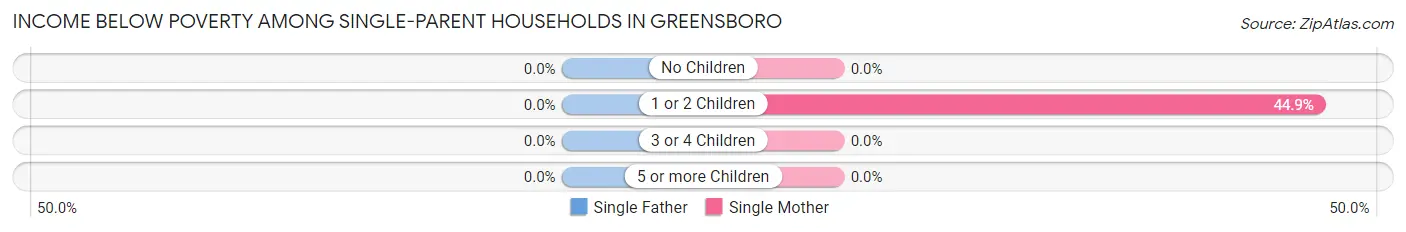
| Children | Single Father | Single Mother |
| No Children | 0 (0.0%) | 0 (0.0%) |
| 1 or 2 Children | 0 (0.0%) | 123 (44.9%) |
| 3 or 4 Children | 0 (0.0%) | 0 (0.0%) |
| 5 or more Children | 0 (0.0%) | 0 (0.0%) |
| Total | 0 (0.0%) | 123 (24.2%) |
Income Below Poverty Among Married-Couple vs Single-Parent Households in Greensboro
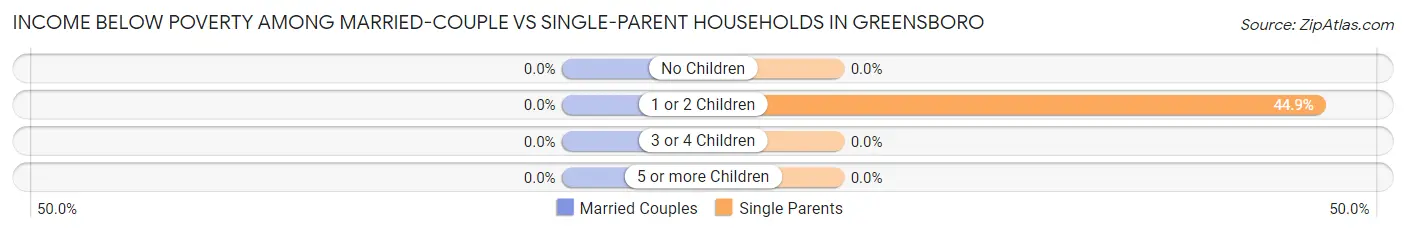
| Children | Married-Couple Families | Single-Parent Households |
| No Children | 0 (0.0%) | 0 (0.0%) |
| 1 or 2 Children | 0 (0.0%) | 123 (44.9%) |
| 3 or 4 Children | 0 (0.0%) | 0 (0.0%) |
| 5 or more Children | 0 (0.0%) | 0 (0.0%) |
| Total | 0 (0.0%) | 123 (24.2%) |
Race in Greensboro
The most populous races in Greensboro are Black / African American (1,780 | 49.8%), White / Caucasian (1,515 | 42.4%), and Some other Race (194 | 5.4%).
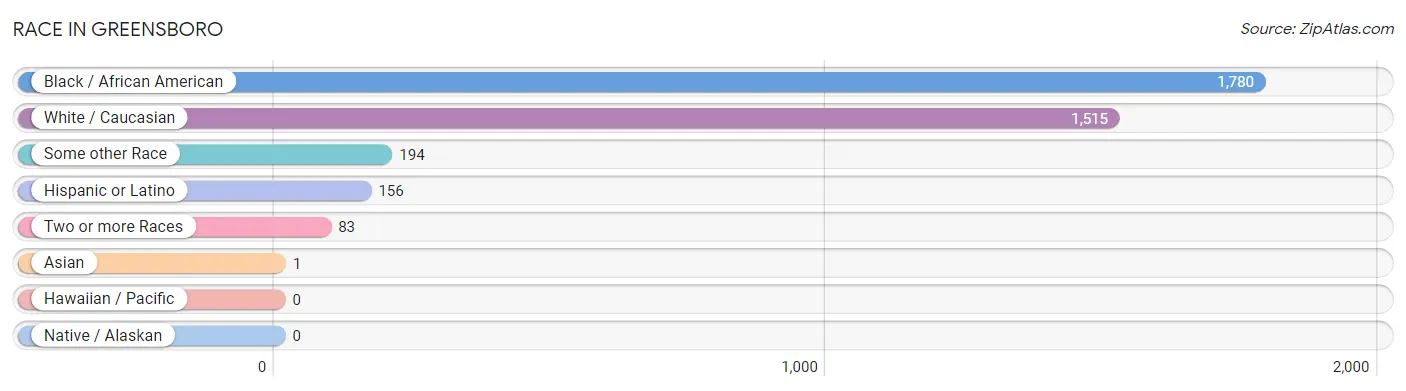
| Race | # Population | % Population |
| Asian | 1 | 0.0% |
| Black / African American | 1,780 | 49.8% |
| Hawaiian / Pacific | 0 | 0.0% |
| Hispanic or Latino | 156 | 4.4% |
| Native / Alaskan | 0 | 0.0% |
| White / Caucasian | 1,515 | 42.4% |
| Two or more Races | 83 | 2.3% |
| Some other Race | 194 | 5.4% |
| Total | 3,573 | 100.0% |
Ancestry in Greensboro
The most populous ancestries reported in Greensboro are American (550 | 15.4%), English (268 | 7.5%), Irish (170 | 4.8%), Mexican (156 | 4.4%), and Scotch-Irish (120 | 3.4%), together accounting for 35.4% of all Greensboro residents.
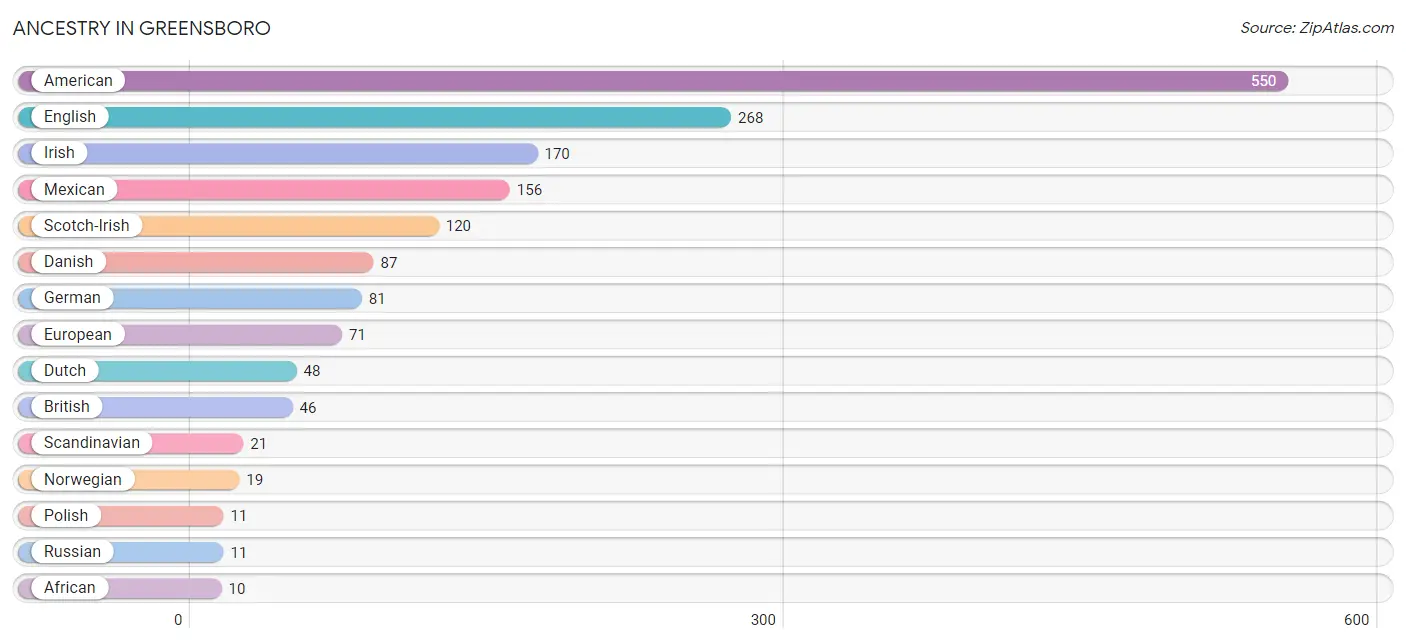
| Ancestry | # Population | % Population |
| African | 10 | 0.3% |
| American | 550 | 15.4% |
| British | 46 | 1.3% |
| Burmese | 1 | 0.0% |
| Danish | 87 | 2.4% |
| Dutch | 48 | 1.3% |
| English | 268 | 7.5% |
| European | 71 | 2.0% |
| German | 81 | 2.3% |
| Irish | 170 | 4.8% |
| Mexican | 156 | 4.4% |
| Norwegian | 19 | 0.5% |
| Polish | 11 | 0.3% |
| Russian | 11 | 0.3% |
| Scandinavian | 21 | 0.6% |
| Scotch-Irish | 120 | 3.4% |
| Subsaharan African | 10 | 0.3% | View All 17 Rows |
Immigrants in Greensboro
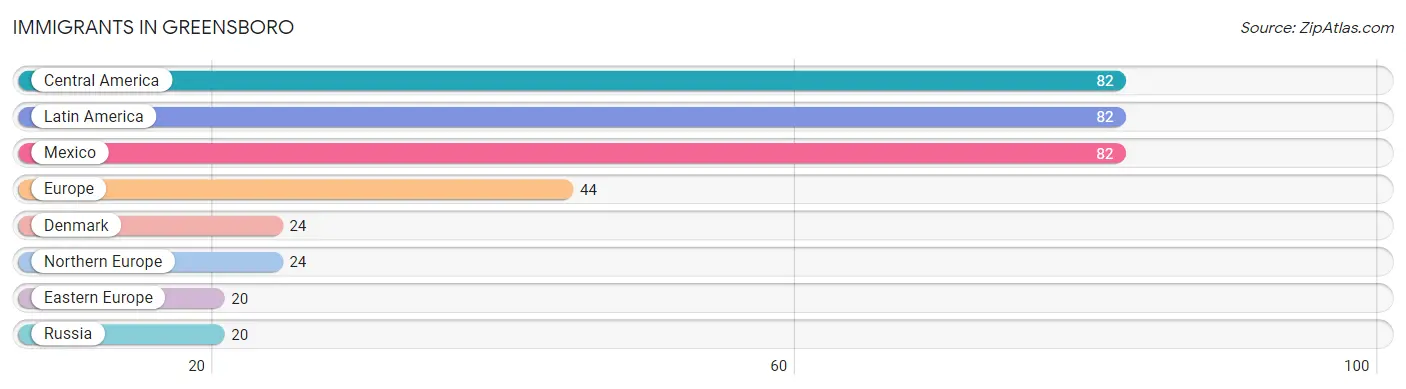
The most numerous immigrant groups reported in Greensboro came from Central America (82 | 2.3%), Latin America (82 | 2.3%), Mexico (82 | 2.3%), Europe (44 | 1.2%), and Denmark (24 | 0.7%), together accounting for 8.8% of all Greensboro residents.
| Immigration Origin | # Population | % Population |
| Central America | 82 | 2.3% |
| Denmark | 24 | 0.7% |
| Eastern Europe | 20 | 0.6% |
| Europe | 44 | 1.2% |
| Latin America | 82 | 2.3% |
| Mexico | 82 | 2.3% |
| Northern Europe | 24 | 0.7% |
| Russia | 20 | 0.6% | View All 8 Rows |
Sex and Age in Greensboro
Sex and Age in Greensboro
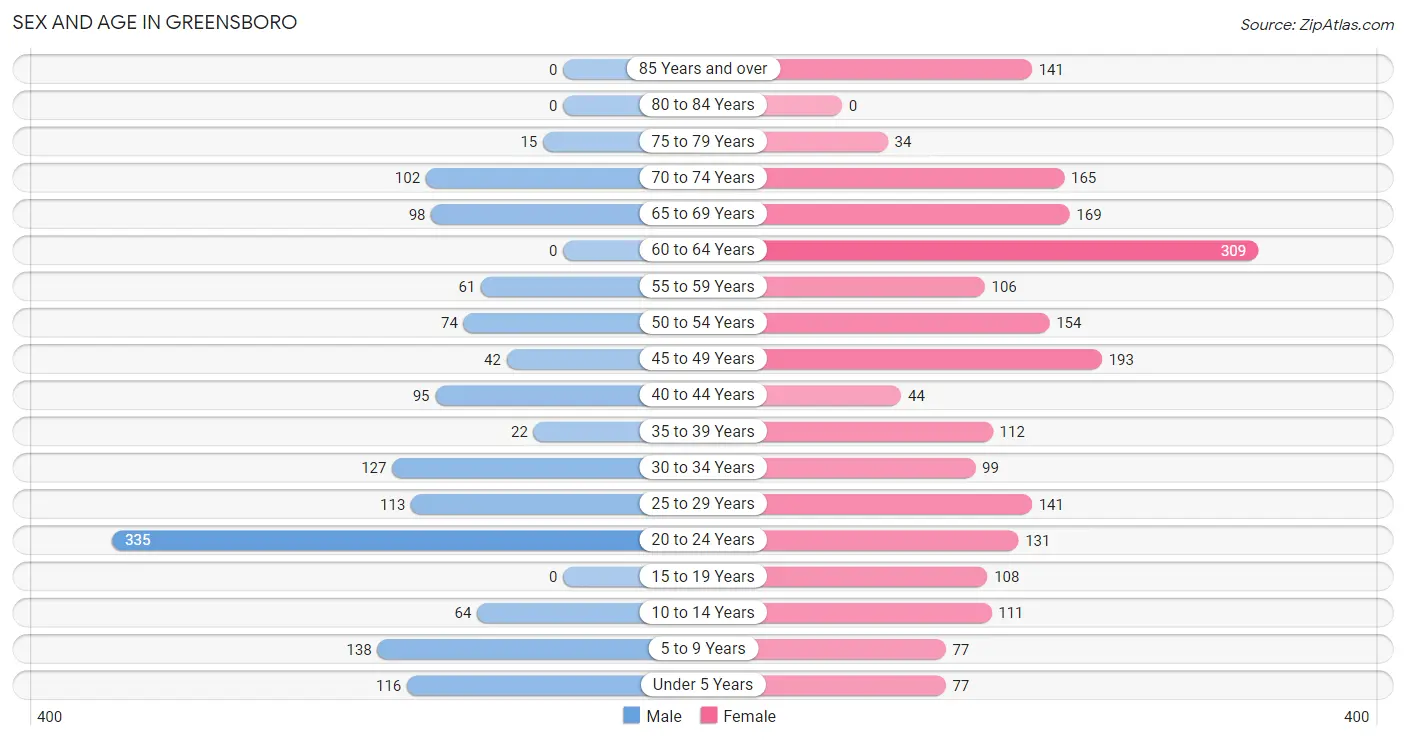
The most populous age groups in Greensboro are 20 to 24 Years (335 | 23.9%) for men and 60 to 64 Years (309 | 14.2%) for women.
| Age Bracket | Male | Female |
| Under 5 Years | 116 (8.3%) | 77 (3.5%) |
| 5 to 9 Years | 138 (9.8%) | 77 (3.5%) |
| 10 to 14 Years | 64 (4.6%) | 111 (5.1%) |
| 15 to 19 Years | 0 (0.0%) | 108 (5.0%) |
| 20 to 24 Years | 335 (23.9%) | 131 (6.0%) |
| 25 to 29 Years | 113 (8.1%) | 141 (6.5%) |
| 30 to 34 Years | 127 (9.1%) | 99 (4.6%) |
| 35 to 39 Years | 22 (1.6%) | 112 (5.2%) |
| 40 to 44 Years | 95 (6.8%) | 44 (2.0%) |
| 45 to 49 Years | 42 (3.0%) | 193 (8.9%) |
| 50 to 54 Years | 74 (5.3%) | 154 (7.1%) |
| 55 to 59 Years | 61 (4.3%) | 106 (4.9%) |
| 60 to 64 Years | 0 (0.0%) | 309 (14.2%) |
| 65 to 69 Years | 98 (7.0%) | 169 (7.8%) |
| 70 to 74 Years | 102 (7.3%) | 165 (7.6%) |
| 75 to 79 Years | 15 (1.1%) | 34 (1.6%) |
| 80 to 84 Years | 0 (0.0%) | 0 (0.0%) |
| 85 Years and over | 0 (0.0%) | 141 (6.5%) |
| Total | 1,402 (100.0%) | 2,171 (100.0%) |
Families and Households in Greensboro
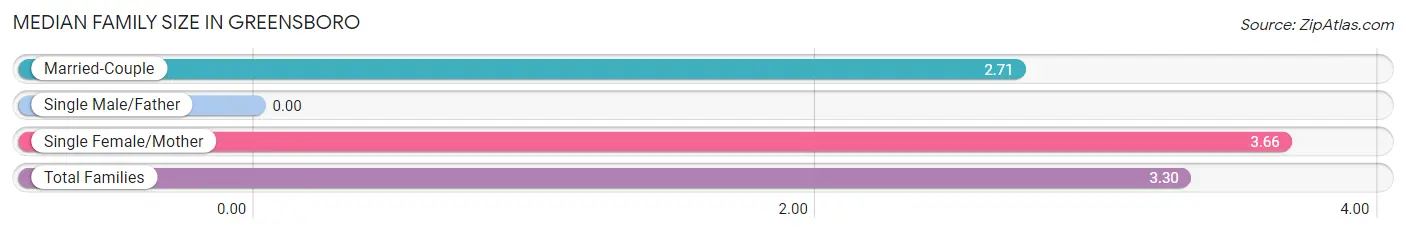
Median Family Size in Greensboro
| Family Type | # Families | Family Size |
| Married-Couple | 314 (38.2%) | 2.71 |
| Single Male/Father | 0 (0.0%) | - |
| Single Female/Mother | 508 (61.8%) | 3.66 |
| Total Families | 822 (100.0%) | 3.30 |
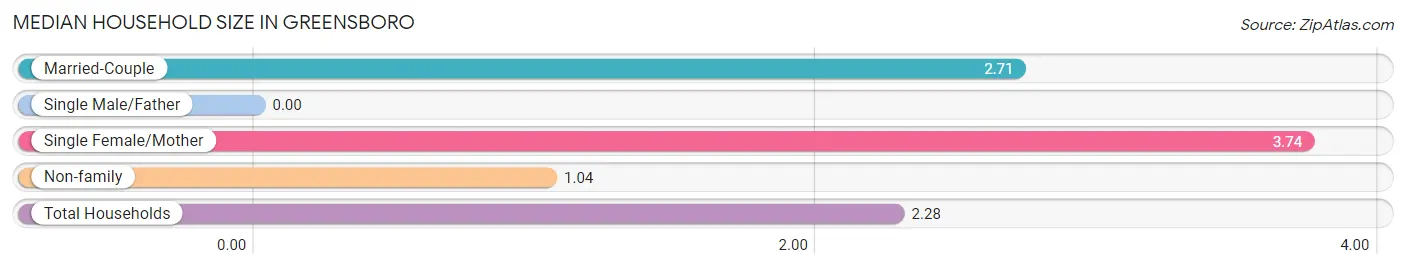
Median Household Size in Greensboro
| Household Type | # Households | Household Size |
| Married-Couple | 314 (20.6%) | 2.71 |
| Single Male/Father | 0 (0.0%) | - |
| Single Female/Mother | 508 (33.3%) | 3.74 |
| Non-family | 704 (46.1%) | 1.04 |
| Total Households | 1,526 (100.0%) | 2.28 |
Household Size by Marriage Status in Greensboro
Out of a total of 1,526 households in Greensboro, 822 (53.9%) are family households, while 704 (46.1%) are nonfamily households. The most numerous type of family households are 2-person households, comprising 341, and the most common type of nonfamily households are 1-person households, comprising 668.
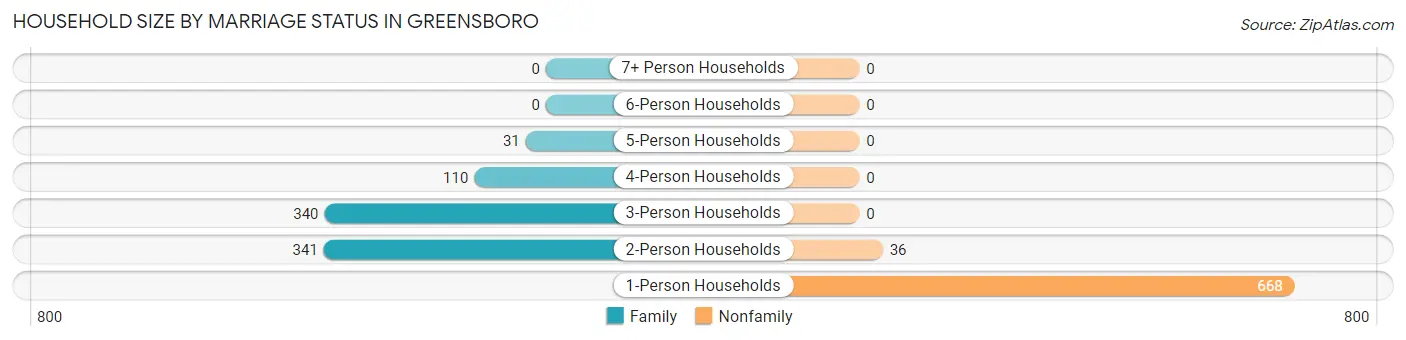
| Household Size | Family Households | Nonfamily Households |
| 1-Person Households | - | 668 (43.8%) |
| 2-Person Households | 341 (22.4%) | 36 (2.4%) |
| 3-Person Households | 340 (22.3%) | 0 (0.0%) |
| 4-Person Households | 110 (7.2%) | 0 (0.0%) |
| 5-Person Households | 31 (2.0%) | 0 (0.0%) |
| 6-Person Households | 0 (0.0%) | 0 (0.0%) |
| 7+ Person Households | 0 (0.0%) | 0 (0.0%) |
| Total | 822 (53.9%) | 704 (46.1%) |
Female Fertility in Greensboro
Fertility by Age in Greensboro
| Age Bracket | Women with Births | Births / 1,000 Women |
| 15 to 19 years | 0 (0.0%) | 0.0 |
| 20 to 34 years | 0 (0.0%) | 0.0 |
| 35 to 50 years | 0 (0.0%) | 0.0 |
| Total | 0 (0.0%) | 0.0 |
Fertility by Age by Marriage Status in Greensboro
| Age Bracket | Married | Unmarried |
| 15 to 19 years | 0 (0.0%) | 0 (0.0%) |
| 20 to 34 years | 0 (0.0%) | 0 (0.0%) |
| 35 to 50 years | 0 (0.0%) | 0 (0.0%) |
| Total | 0 (0.0%) | 0 (0.0%) |
Fertility by Education in Greensboro
| Educational Attainment | Women with Births | Births / 1,000 Women |
| Less than High School | 0 (0.0%) | 0.0 |
| High School Diploma | 0 (0.0%) | 0.0 |
| College or Associate's Degree | 0 (0.0%) | 0.0 |
| Bachelor's Degree | 0 (0.0%) | 0.0 |
| Graduate Degree | 0 (0.0%) | 0.0 |
| Total | 0 (0.0%) | 0.0 |
Fertility by Education by Marriage Status in Greensboro
| Educational Attainment | Married | Unmarried |
| Less than High School | 0 (0.0%) | 0 (0.0%) |
| High School Diploma | 0 (0.0%) | 0 (0.0%) |
| College or Associate's Degree | 0 (0.0%) | 0 (0.0%) |
| Bachelor's Degree | 0 (0.0%) | 0 (0.0%) |
| Graduate Degree | 0 (0.0%) | 0 (0.0%) |
| Total | 0 (0.0%) | 0 (0.0%) |
Employment Characteristics in Greensboro
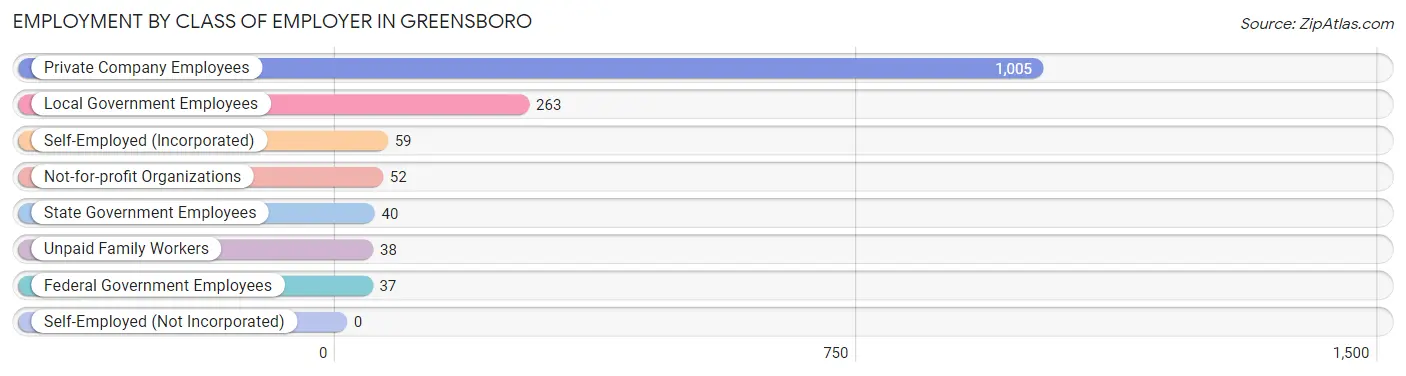
Employment by Class of Employer in Greensboro
Among the 1,494 employed individuals in Greensboro, private company employees (1,005 | 67.3%), local government employees (263 | 17.6%), and self-employed (incorporated) (59 | 4.0%) make up the most common classes of employment.
| Employer Class | # Employees | % Employees |
| Private Company Employees | 1,005 | 67.3% |
| Self-Employed (Incorporated) | 59 | 4.0% |
| Self-Employed (Not Incorporated) | 0 | 0.0% |
| Not-for-profit Organizations | 52 | 3.5% |
| Local Government Employees | 263 | 17.6% |
| State Government Employees | 40 | 2.7% |
| Federal Government Employees | 37 | 2.5% |
| Unpaid Family Workers | 38 | 2.5% |
| Total | 1,494 | 100.0% |
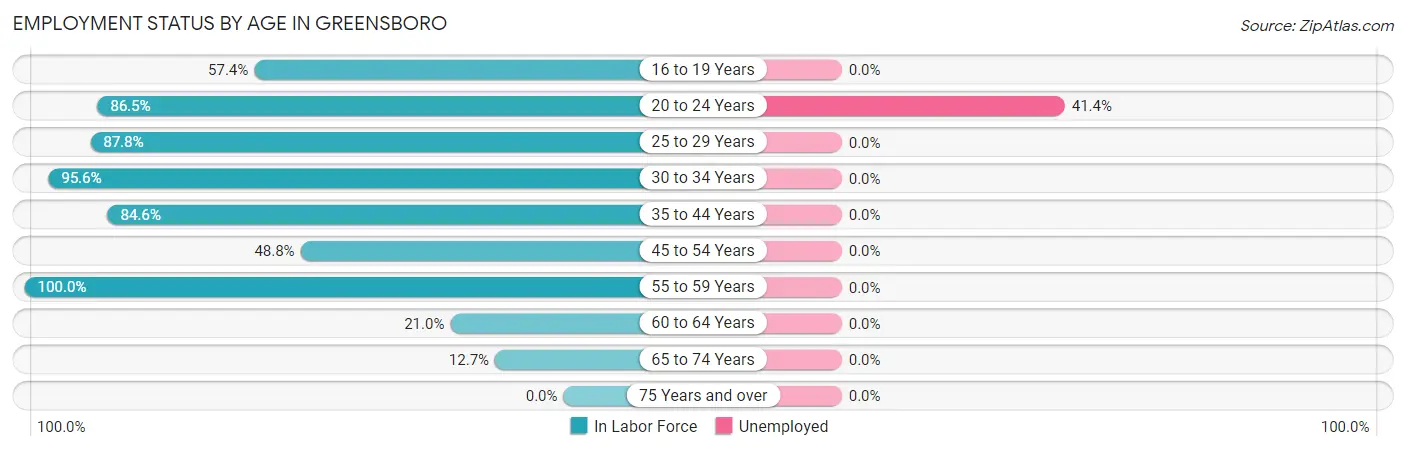
Employment Status by Age in Greensboro
According to the labor force statistics for Greensboro, out of the total population over 16 years of age (2,990), 55.6% or 1,662 individuals are in the labor force, with 10.1% or 168 of them unemployed. The age group with the highest labor force participation rate is 55 to 59 years, with 100.0% or 167 individuals in the labor force. Within the labor force, the 20 to 24 years age range has the highest percentage of unemployed individuals, with 41.4% or 167 of them being unemployed.
| Age Bracket | In Labor Force | Unemployed |
| 16 to 19 Years | 62 (57.4%) | 0 (0.0%) |
| 20 to 24 Years | 403 (86.5%) | 167 (41.4%) |
| 25 to 29 Years | 223 (87.8%) | 0 (0.0%) |
| 30 to 34 Years | 216 (95.6%) | 0 (0.0%) |
| 35 to 44 Years | 231 (84.6%) | 0 (0.0%) |
| 45 to 54 Years | 226 (48.8%) | 0 (0.0%) |
| 55 to 59 Years | 167 (100.0%) | 0 (0.0%) |
| 60 to 64 Years | 65 (21.0%) | 0 (0.0%) |
| 65 to 74 Years | 68 (12.7%) | 0 (0.0%) |
| 75 Years and over | 0 (0.0%) | 0 (0.0%) |
| Total | 1,662 (55.6%) | 168 (10.1%) |
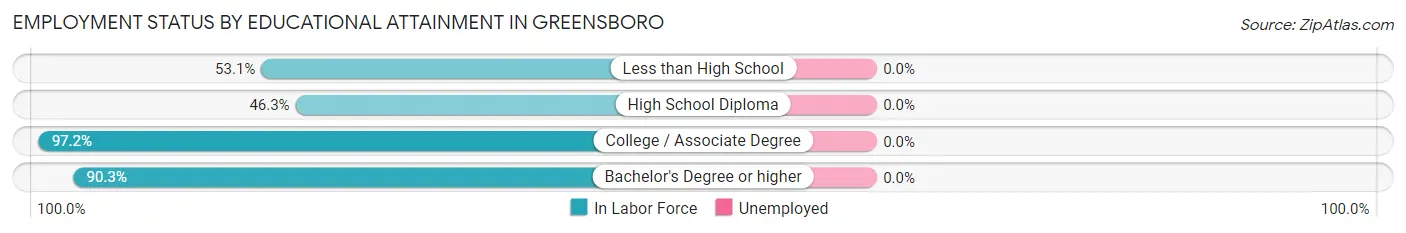
Employment Status by Educational Attainment in Greensboro
| Educational Attainment | In Labor Force | Unemployed |
| Less than High School | 197 (53.1%) | 0 (0.0%) |
| High School Diploma | 302 (46.3%) | 0 (0.0%) |
| College / Associate Degree | 349 (97.2%) | 0 (0.0%) |
| Bachelor's Degree or higher | 280 (90.3%) | 0 (0.0%) |
| Total | 1,129 (66.7%) | 0 (0.0%) |
Employment Occupations by Sex in Greensboro
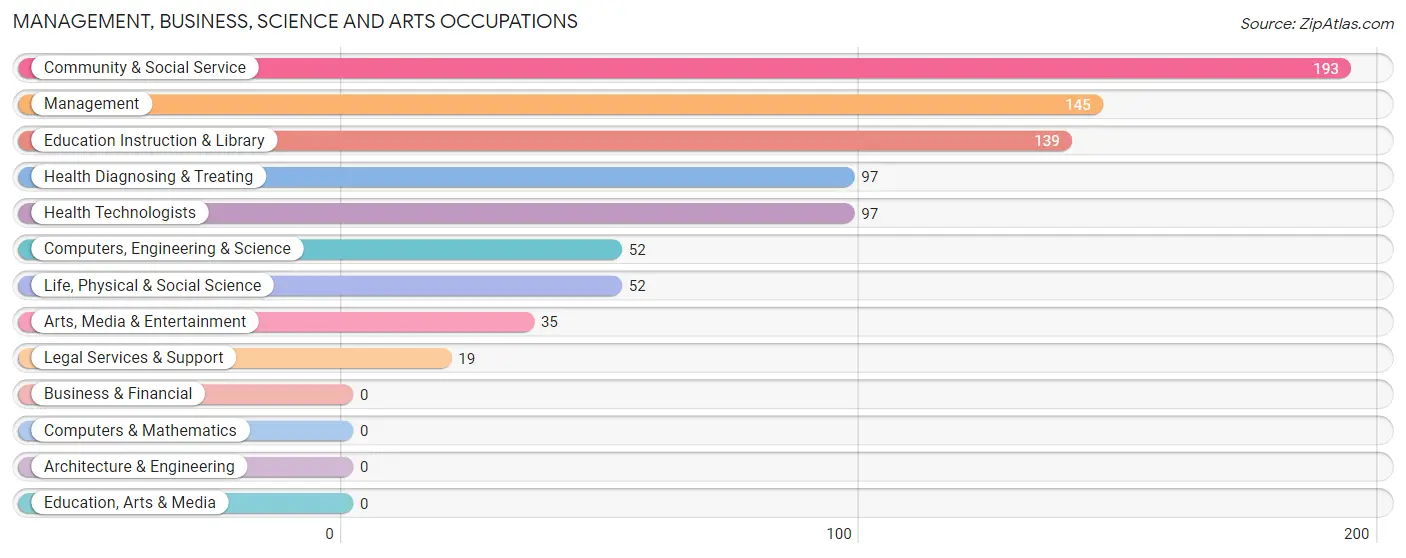
Management, Business, Science and Arts Occupations
The most common Management, Business, Science and Arts occupations in Greensboro are Community & Social Service (193 | 12.9%), Management (145 | 9.7%), Education Instruction & Library (139 | 9.3%), Health Diagnosing & Treating (97 | 6.5%), and Health Technologists (97 | 6.5%).
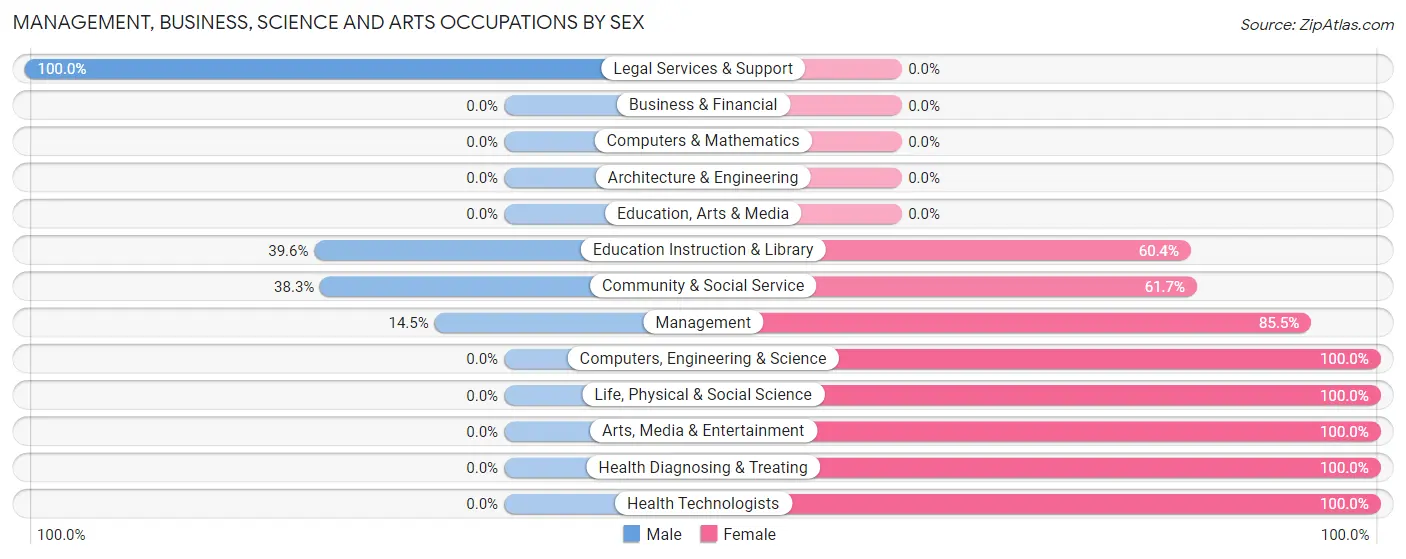
Management, Business, Science and Arts Occupations by Sex
Within the Management, Business, Science and Arts occupations in Greensboro, the most male-oriented occupations are Legal Services & Support (100.0%), Education Instruction & Library (39.6%), and Community & Social Service (38.3%), while the most female-oriented occupations are Computers, Engineering & Science (100.0%), Life, Physical & Social Science (100.0%), and Arts, Media & Entertainment (100.0%).
| Occupation | Male | Female |
| Management | 21 (14.5%) | 124 (85.5%) |
| Business & Financial | 0 (0.0%) | 0 (0.0%) |
| Computers, Engineering & Science | 0 (0.0%) | 52 (100.0%) |
| Computers & Mathematics | 0 (0.0%) | 0 (0.0%) |
| Architecture & Engineering | 0 (0.0%) | 0 (0.0%) |
| Life, Physical & Social Science | 0 (0.0%) | 52 (100.0%) |
| Community & Social Service | 74 (38.3%) | 119 (61.7%) |
| Education, Arts & Media | 0 (0.0%) | 0 (0.0%) |
| Legal Services & Support | 19 (100.0%) | 0 (0.0%) |
| Education Instruction & Library | 55 (39.6%) | 84 (60.4%) |
| Arts, Media & Entertainment | 0 (0.0%) | 35 (100.0%) |
| Health Diagnosing & Treating | 0 (0.0%) | 97 (100.0%) |
| Health Technologists | 0 (0.0%) | 97 (100.0%) |
| Total (Category) | 95 (19.5%) | 392 (80.5%) |
| Total (Overall) | 633 (42.4%) | 861 (57.6%) |
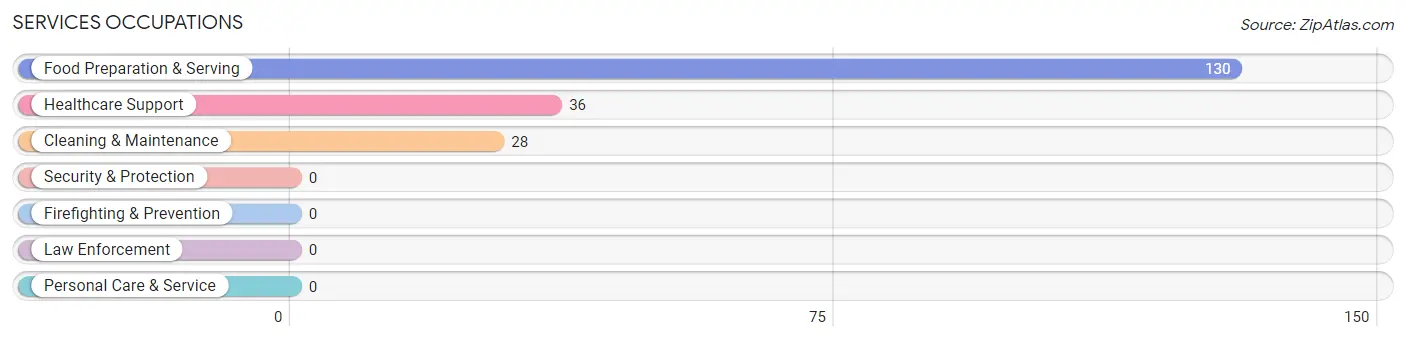
Services Occupations
The most common Services occupations in Greensboro are Food Preparation & Serving (130 | 8.7%), Healthcare Support (36 | 2.4%), and Cleaning & Maintenance (28 | 1.9%).
Services Occupations by Sex
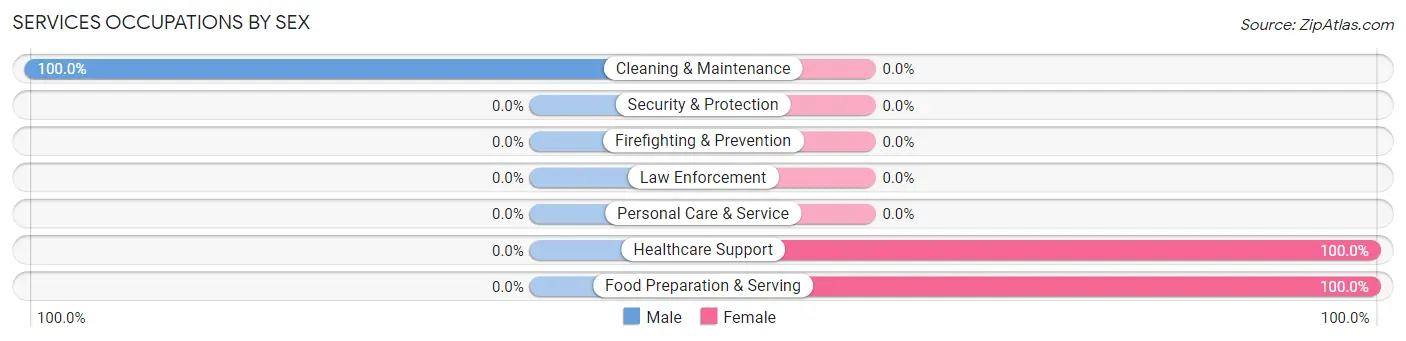
| Occupation | Male | Female |
| Healthcare Support | 0 (0.0%) | 36 (100.0%) |
| Security & Protection | 0 (0.0%) | 0 (0.0%) |
| Firefighting & Prevention | 0 (0.0%) | 0 (0.0%) |
| Law Enforcement | 0 (0.0%) | 0 (0.0%) |
| Food Preparation & Serving | 0 (0.0%) | 130 (100.0%) |
| Cleaning & Maintenance | 28 (100.0%) | 0 (0.0%) |
| Personal Care & Service | 0 (0.0%) | 0 (0.0%) |
| Total (Category) | 28 (14.4%) | 166 (85.6%) |
| Total (Overall) | 633 (42.4%) | 861 (57.6%) |
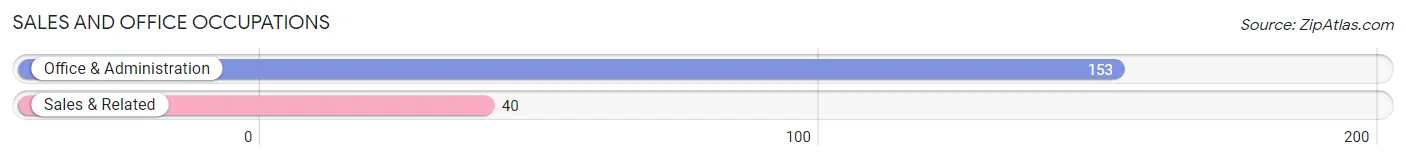
Sales and Office Occupations
The most common Sales and Office occupations in Greensboro are Office & Administration (153 | 10.2%), and Sales & Related (40 | 2.7%).
Sales and Office Occupations by Sex
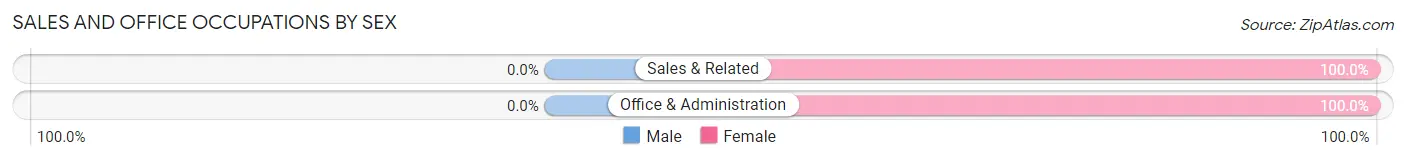
| Occupation | Male | Female |
| Sales & Related | 0 (0.0%) | 40 (100.0%) |
| Office & Administration | 0 (0.0%) | 153 (100.0%) |
| Total (Category) | 0 (0.0%) | 193 (100.0%) |
| Total (Overall) | 633 (42.4%) | 861 (57.6%) |
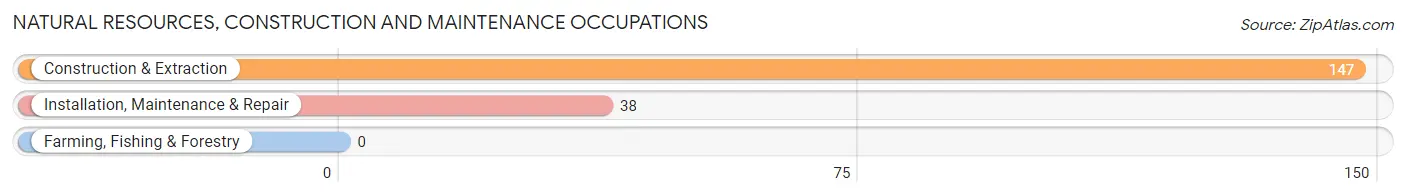
Natural Resources, Construction and Maintenance Occupations
The most common Natural Resources, Construction and Maintenance occupations in Greensboro are Construction & Extraction (147 | 9.8%), and Installation, Maintenance & Repair (38 | 2.5%).
Natural Resources, Construction and Maintenance Occupations by Sex
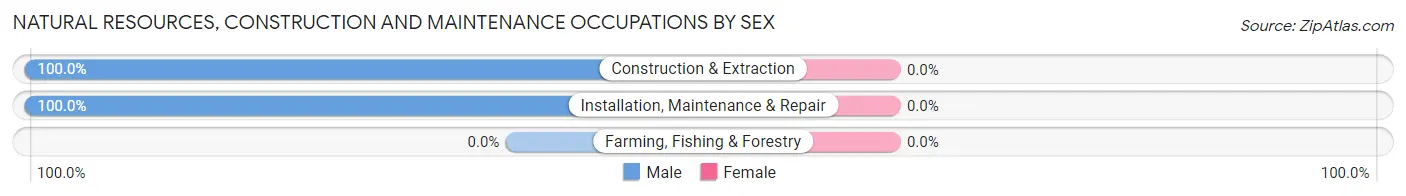
| Occupation | Male | Female |
| Farming, Fishing & Forestry | 0 (0.0%) | 0 (0.0%) |
| Construction & Extraction | 147 (100.0%) | 0 (0.0%) |
| Installation, Maintenance & Repair | 38 (100.0%) | 0 (0.0%) |
| Total (Category) | 185 (100.0%) | 0 (0.0%) |
| Total (Overall) | 633 (42.4%) | 861 (57.6%) |
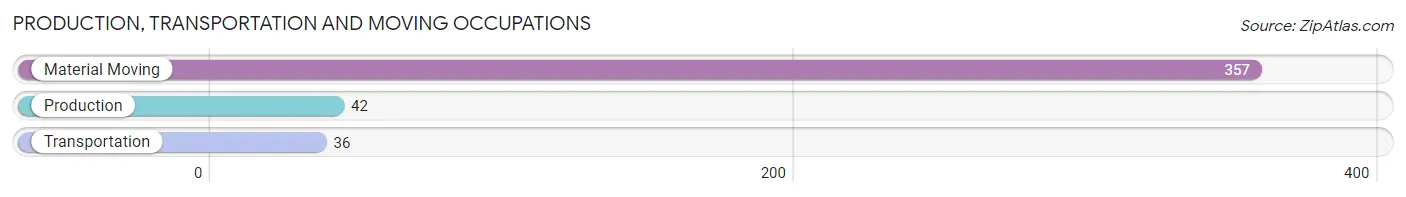
Production, Transportation and Moving Occupations
The most common Production, Transportation and Moving occupations in Greensboro are Material Moving (357 | 23.9%), Production (42 | 2.8%), and Transportation (36 | 2.4%).
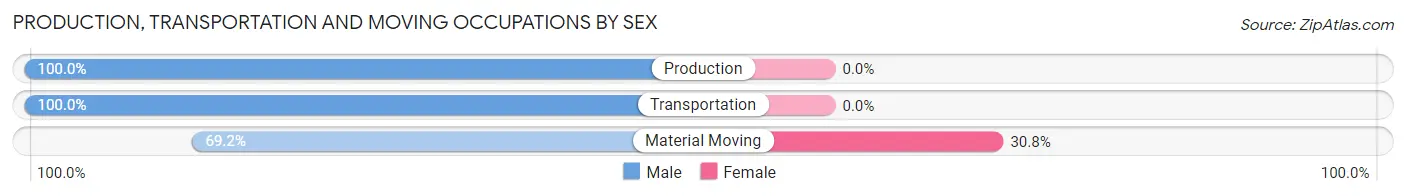
Production, Transportation and Moving Occupations by Sex
| Occupation | Male | Female |
| Production | 42 (100.0%) | 0 (0.0%) |
| Transportation | 36 (100.0%) | 0 (0.0%) |
| Material Moving | 247 (69.2%) | 110 (30.8%) |
| Total (Category) | 325 (74.7%) | 110 (25.3%) |
| Total (Overall) | 633 (42.4%) | 861 (57.6%) |
Employment Industries by Sex in Greensboro
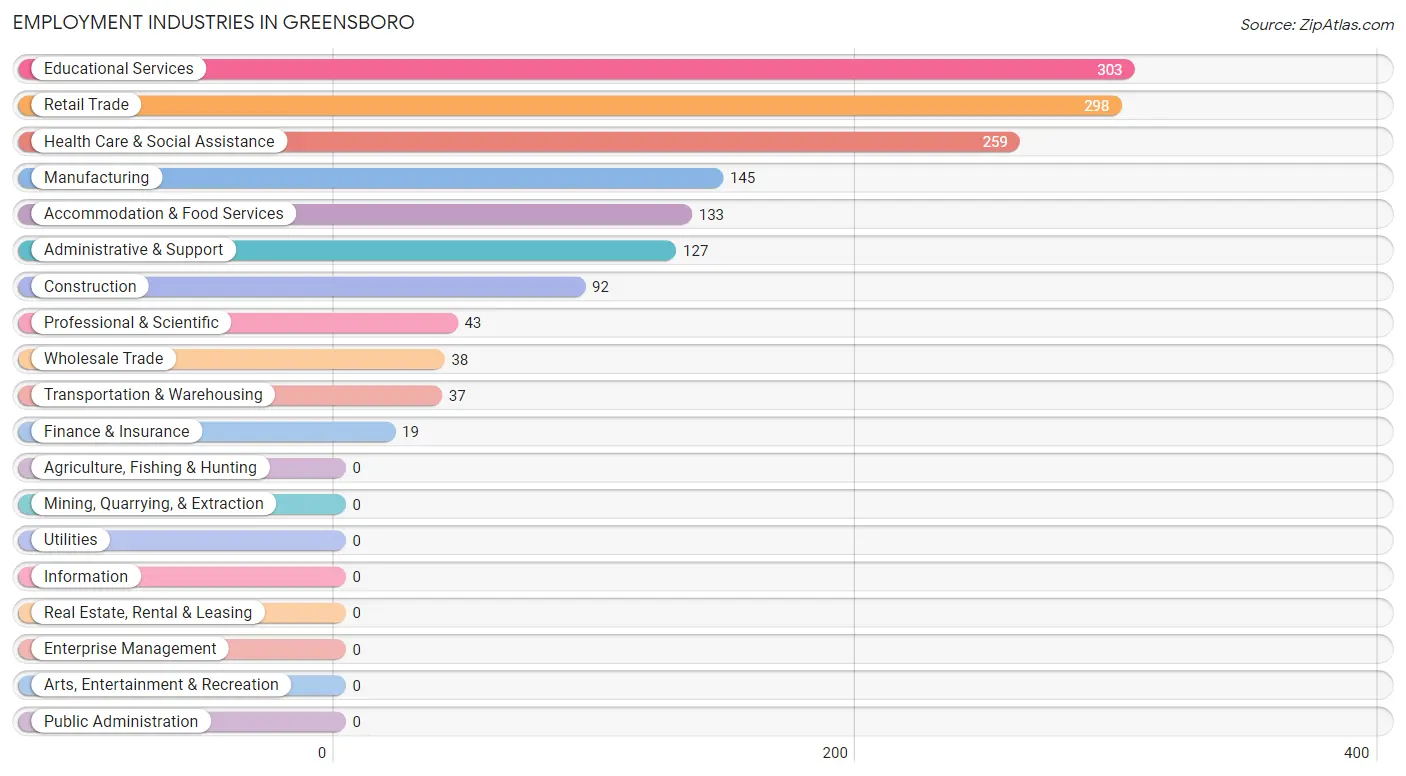
Employment Industries in Greensboro
The major employment industries in Greensboro include Educational Services (303 | 20.3%), Retail Trade (298 | 20.0%), Health Care & Social Assistance (259 | 17.3%), Manufacturing (145 | 9.7%), and Accommodation & Food Services (133 | 8.9%).
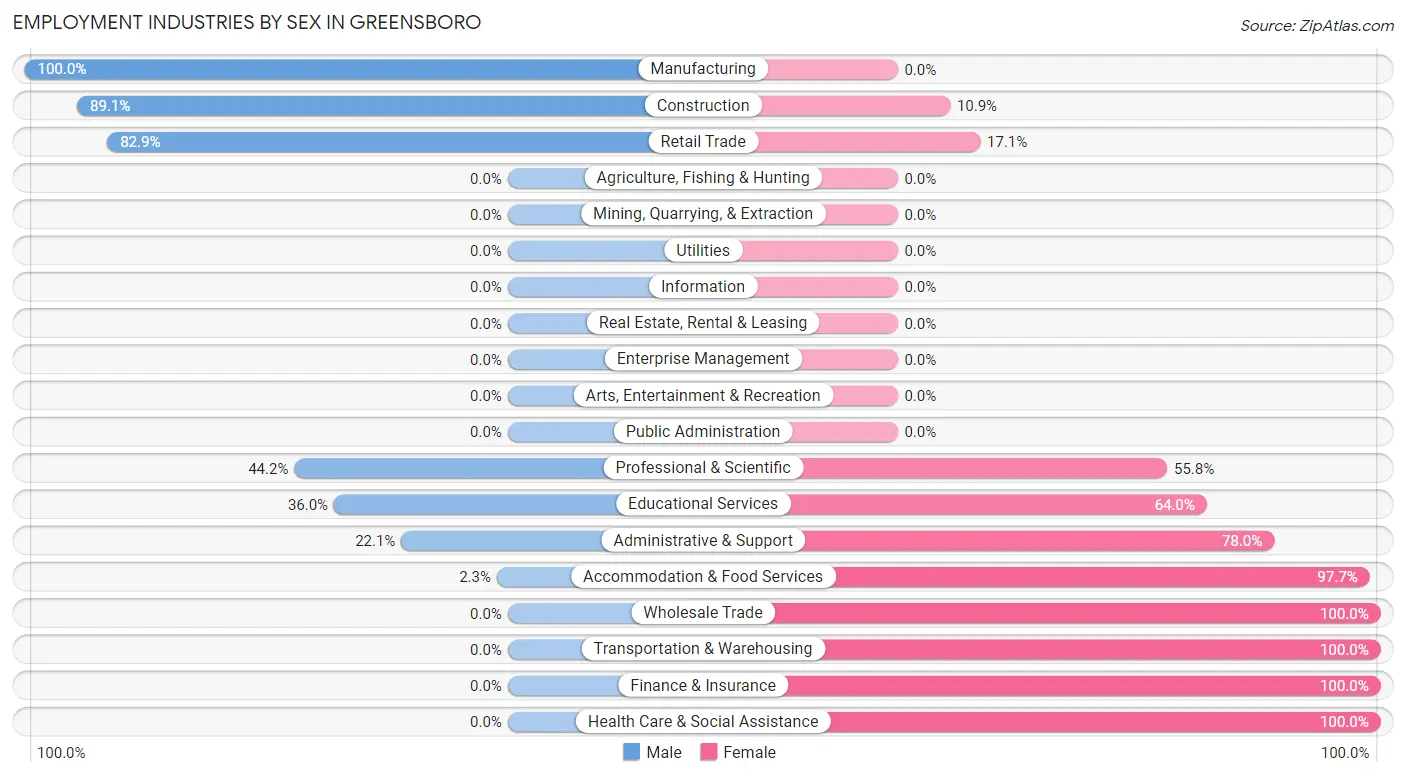
Employment Industries by Sex in Greensboro
The Greensboro industries that see more men than women are Manufacturing (100.0%), Construction (89.1%), and Retail Trade (82.9%), whereas the industries that tend to have a higher number of women are Wholesale Trade (100.0%), Transportation & Warehousing (100.0%), and Finance & Insurance (100.0%).
| Industry | Male | Female |
| Agriculture, Fishing & Hunting | 0 (0.0%) | 0 (0.0%) |
| Mining, Quarrying, & Extraction | 0 (0.0%) | 0 (0.0%) |
| Construction | 82 (89.1%) | 10 (10.9%) |
| Manufacturing | 145 (100.0%) | 0 (0.0%) |
| Wholesale Trade | 0 (0.0%) | 38 (100.0%) |
| Retail Trade | 247 (82.9%) | 51 (17.1%) |
| Transportation & Warehousing | 0 (0.0%) | 37 (100.0%) |
| Utilities | 0 (0.0%) | 0 (0.0%) |
| Information | 0 (0.0%) | 0 (0.0%) |
| Finance & Insurance | 0 (0.0%) | 19 (100.0%) |
| Real Estate, Rental & Leasing | 0 (0.0%) | 0 (0.0%) |
| Professional & Scientific | 19 (44.2%) | 24 (55.8%) |
| Enterprise Management | 0 (0.0%) | 0 (0.0%) |
| Administrative & Support | 28 (22.1%) | 99 (77.9%) |
| Educational Services | 109 (36.0%) | 194 (64.0%) |
| Health Care & Social Assistance | 0 (0.0%) | 259 (100.0%) |
| Arts, Entertainment & Recreation | 0 (0.0%) | 0 (0.0%) |
| Accommodation & Food Services | 3 (2.3%) | 130 (97.7%) |
| Public Administration | 0 (0.0%) | 0 (0.0%) |
| Total | 633 (42.4%) | 861 (57.6%) |
Education in Greensboro
School Enrollment in Greensboro
The most common levels of schooling among the 657 students in Greensboro are college / undergraduate (202 | 30.7%), middle school (133 | 20.2%), and elementary school (98 | 14.9%).
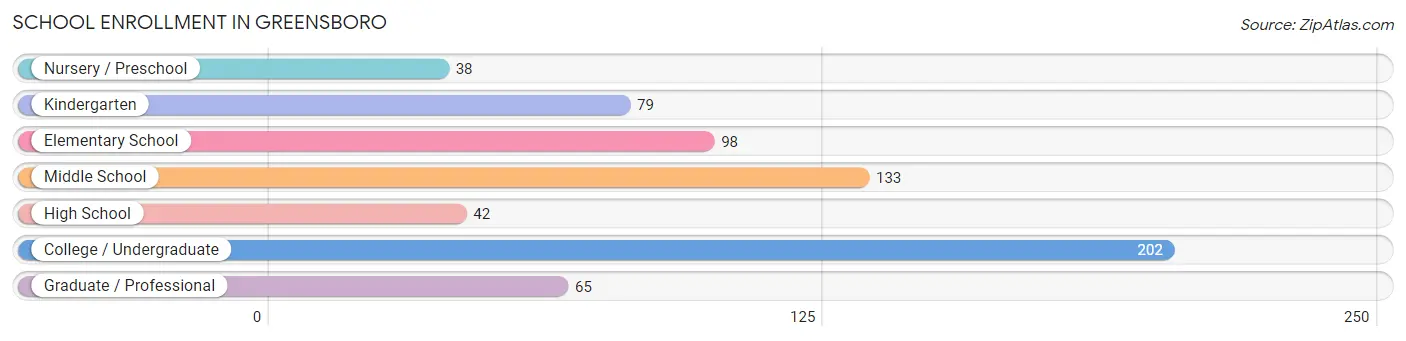
| School Level | # Students | % Students |
| Nursery / Preschool | 38 | 5.8% |
| Kindergarten | 79 | 12.0% |
| Elementary School | 98 | 14.9% |
| Middle School | 133 | 20.2% |
| High School | 42 | 6.4% |
| College / Undergraduate | 202 | 30.7% |
| Graduate / Professional | 65 | 9.9% |
| Total | 657 | 100.0% |
School Enrollment by Age by Funding Source in Greensboro
Out of a total of 657 students who are enrolled in schools in Greensboro, 108 (16.4%) attend a private institution, while the remaining 549 (83.6%) are enrolled in public schools. The age group of 18 to 19 year olds has the highest likelihood of being enrolled in private schools, with 108 (100.0% in the age bracket) enrolled. Conversely, the age group of 5 to 9 year old has the lowest likelihood of being enrolled in a private school, with 215 (100.0% in the age bracket) attending a public institution.
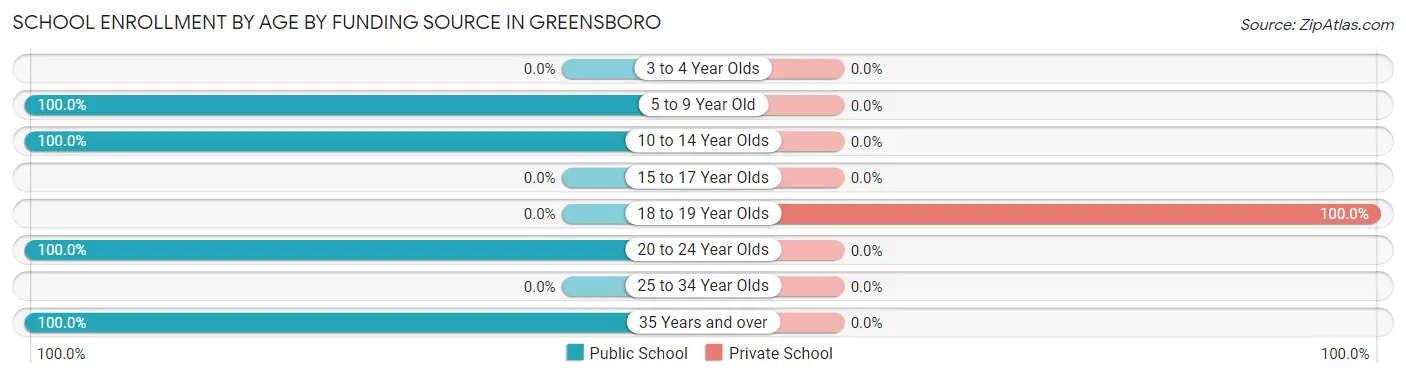
| Age Bracket | Public School | Private School |
| 3 to 4 Year Olds | 0 (0.0%) | 0 (0.0%) |
| 5 to 9 Year Old | 215 (100.0%) | 0 (0.0%) |
| 10 to 14 Year Olds | 175 (100.0%) | 0 (0.0%) |
| 15 to 17 Year Olds | 0 (0.0%) | 0 (0.0%) |
| 18 to 19 Year Olds | 0 (0.0%) | 108 (100.0%) |
| 20 to 24 Year Olds | 63 (100.0%) | 0 (0.0%) |
| 25 to 34 Year Olds | 0 (0.0%) | 0 (0.0%) |
| 35 Years and over | 96 (100.0%) | 0 (0.0%) |
| Total | 549 (83.6%) | 108 (16.4%) |
Educational Attainment by Field of Study in Greensboro
Education (330 | 59.1%), psychology (55 | 9.9%), engineering (38 | 6.8%), visual & performing arts (29 | 5.2%), and science & technology (26 | 4.7%) are the most common fields of study among 558 individuals in Greensboro who have obtained a bachelor's degree or higher.
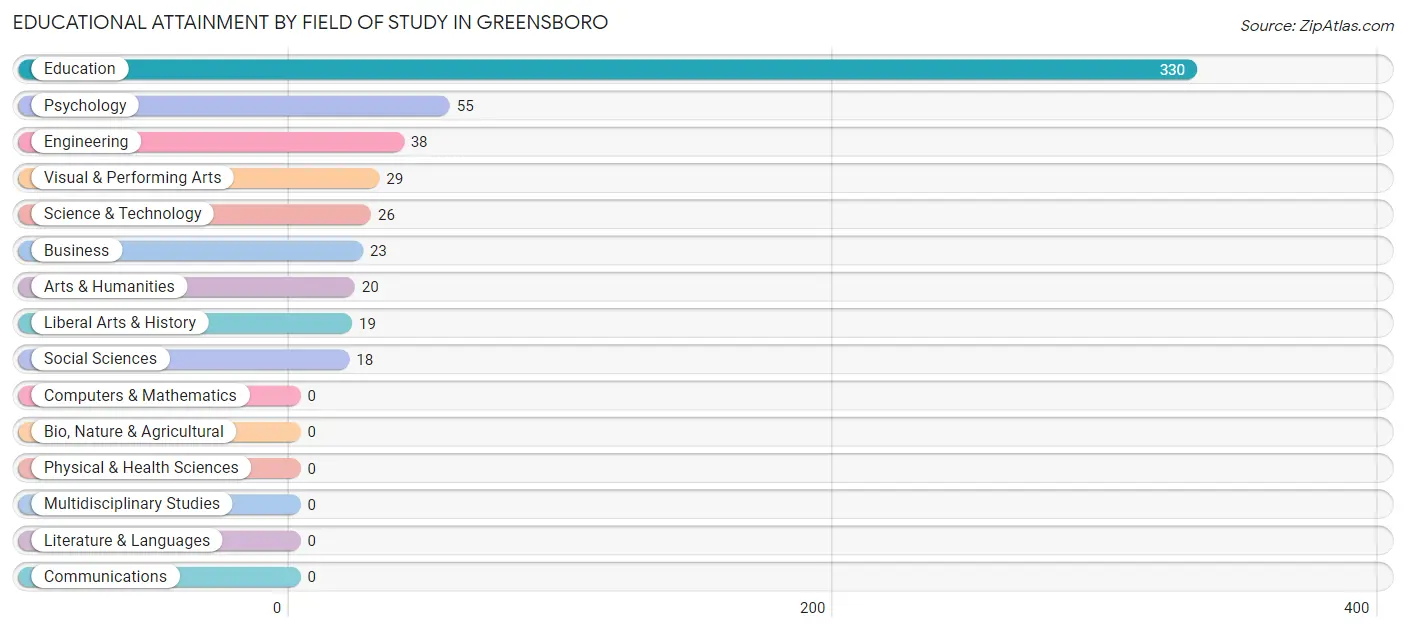
| Field of Study | # Graduates | % Graduates |
| Computers & Mathematics | 0 | 0.0% |
| Bio, Nature & Agricultural | 0 | 0.0% |
| Physical & Health Sciences | 0 | 0.0% |
| Psychology | 55 | 9.9% |
| Social Sciences | 18 | 3.2% |
| Engineering | 38 | 6.8% |
| Multidisciplinary Studies | 0 | 0.0% |
| Science & Technology | 26 | 4.7% |
| Business | 23 | 4.1% |
| Education | 330 | 59.1% |
| Literature & Languages | 0 | 0.0% |
| Liberal Arts & History | 19 | 3.4% |
| Visual & Performing Arts | 29 | 5.2% |
| Communications | 0 | 0.0% |
| Arts & Humanities | 20 | 3.6% |
| Total | 558 | 100.0% |
Transportation & Commute in Greensboro
Vehicle Availability by Sex in Greensboro
The most prevalent vehicle ownership categories in Greensboro are males with 1 vehicle (206, accounting for 32.7%) and females with 1 vehicle (411, making up 23.9%).
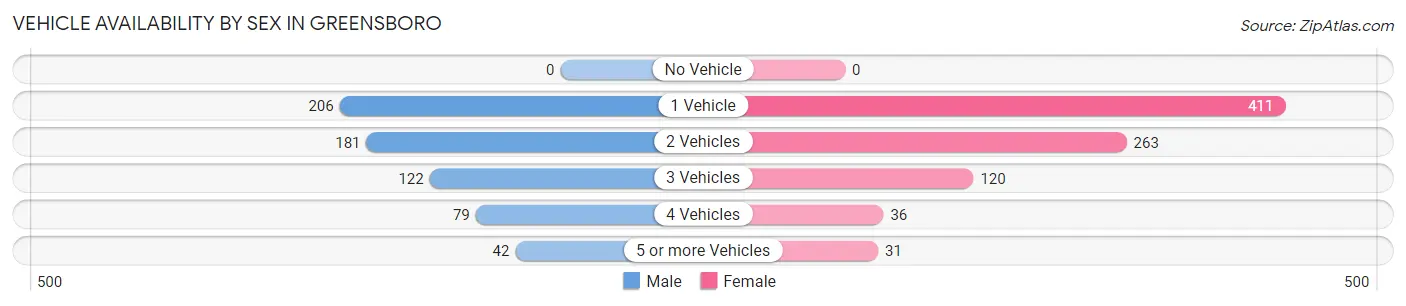
| Vehicles Available | Male | Female |
| No Vehicle | 0 (0.0%) | 0 (0.0%) |
| 1 Vehicle | 206 (32.7%) | 411 (47.7%) |
| 2 Vehicles | 181 (28.7%) | 263 (30.5%) |
| 3 Vehicles | 122 (19.4%) | 120 (13.9%) |
| 4 Vehicles | 79 (12.5%) | 36 (4.2%) |
| 5 or more Vehicles | 42 (6.7%) | 31 (3.6%) |
| Total | 630 (100.0%) | 861 (100.0%) |
Commute Time in Greensboro
The most frequently occuring commute durations in Greensboro are 10 to 14 minutes (466 commuters, 31.2%), 5 to 9 minutes (249 commuters, 16.7%), and 45 to 59 minutes (248 commuters, 16.6%).
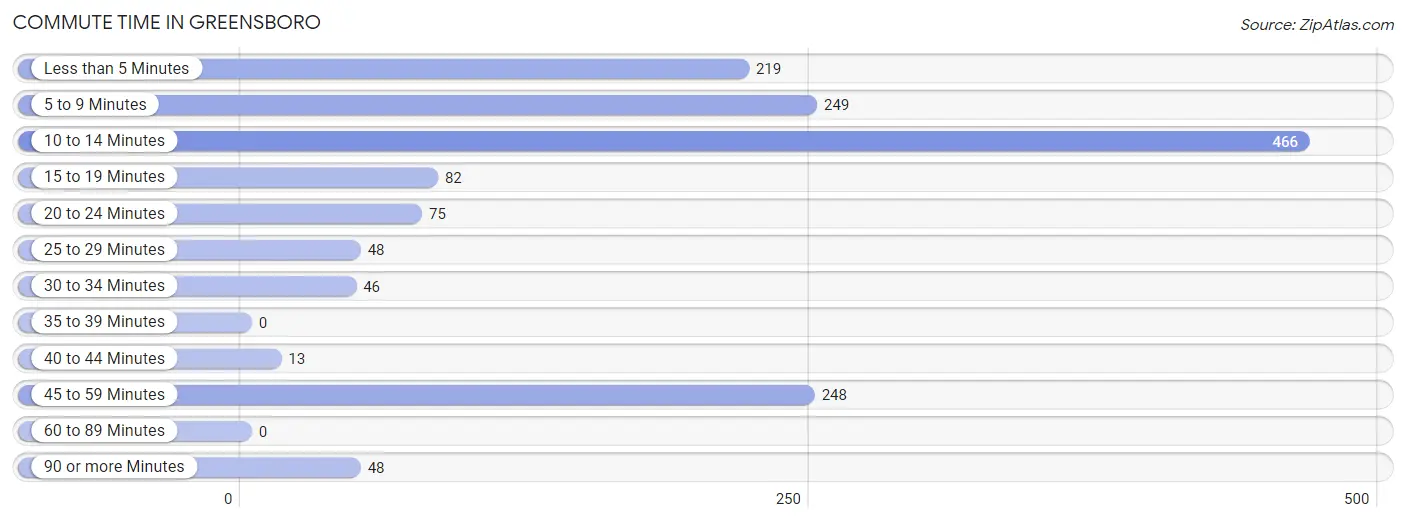
| Commute Time | # Commuters | % Commuters |
| Less than 5 Minutes | 219 | 14.7% |
| 5 to 9 Minutes | 249 | 16.7% |
| 10 to 14 Minutes | 466 | 31.2% |
| 15 to 19 Minutes | 82 | 5.5% |
| 20 to 24 Minutes | 75 | 5.0% |
| 25 to 29 Minutes | 48 | 3.2% |
| 30 to 34 Minutes | 46 | 3.1% |
| 35 to 39 Minutes | 0 | 0.0% |
| 40 to 44 Minutes | 13 | 0.9% |
| 45 to 59 Minutes | 248 | 16.6% |
| 60 to 89 Minutes | 0 | 0.0% |
| 90 or more Minutes | 48 | 3.2% |
Commute Time by Sex in Greensboro
The most common commute times in Greensboro are 10 to 14 minutes (357 commuters, 56.4%) for males and 45 to 59 minutes (248 commuters, 28.8%) for females.
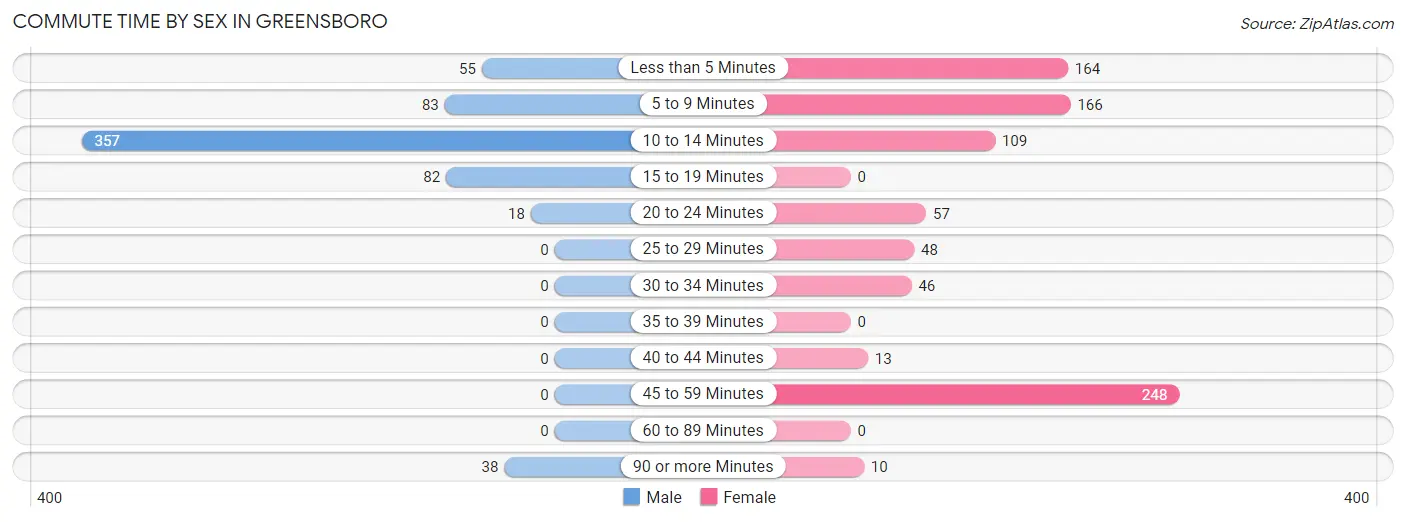
| Commute Time | Male | Female |
| Less than 5 Minutes | 55 (8.7%) | 164 (19.1%) |
| 5 to 9 Minutes | 83 (13.1%) | 166 (19.3%) |
| 10 to 14 Minutes | 357 (56.4%) | 109 (12.7%) |
| 15 to 19 Minutes | 82 (13.0%) | 0 (0.0%) |
| 20 to 24 Minutes | 18 (2.8%) | 57 (6.6%) |
| 25 to 29 Minutes | 0 (0.0%) | 48 (5.6%) |
| 30 to 34 Minutes | 0 (0.0%) | 46 (5.3%) |
| 35 to 39 Minutes | 0 (0.0%) | 0 (0.0%) |
| 40 to 44 Minutes | 0 (0.0%) | 13 (1.5%) |
| 45 to 59 Minutes | 0 (0.0%) | 248 (28.8%) |
| 60 to 89 Minutes | 0 (0.0%) | 0 (0.0%) |
| 90 or more Minutes | 38 (6.0%) | 10 (1.2%) |
Time of Departure to Work by Sex in Greensboro
The most frequent times of departure to work in Greensboro are 7:00 AM to 7:29 AM (196, 31.0%) for males and 12:00 PM to 3:59 PM (244, 28.3%) for females.
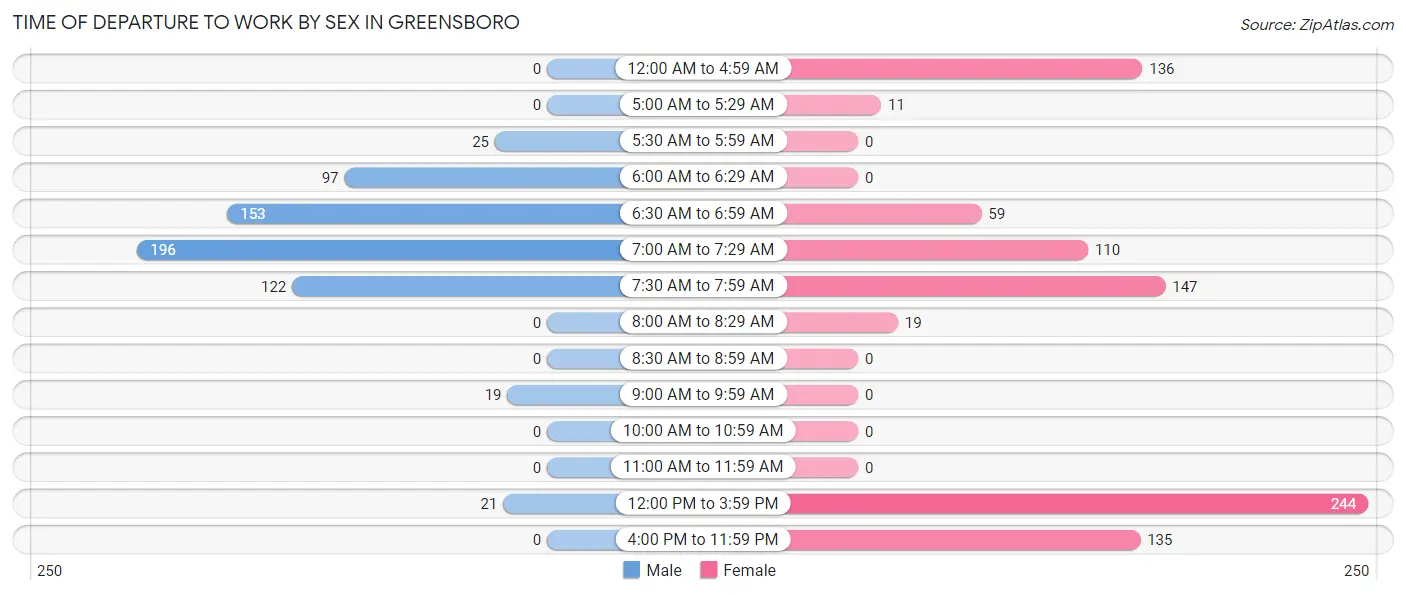
| Time of Departure | Male | Female |
| 12:00 AM to 4:59 AM | 0 (0.0%) | 136 (15.8%) |
| 5:00 AM to 5:29 AM | 0 (0.0%) | 11 (1.3%) |
| 5:30 AM to 5:59 AM | 25 (4.0%) | 0 (0.0%) |
| 6:00 AM to 6:29 AM | 97 (15.3%) | 0 (0.0%) |
| 6:30 AM to 6:59 AM | 153 (24.2%) | 59 (6.9%) |
| 7:00 AM to 7:29 AM | 196 (31.0%) | 110 (12.8%) |
| 7:30 AM to 7:59 AM | 122 (19.3%) | 147 (17.1%) |
| 8:00 AM to 8:29 AM | 0 (0.0%) | 19 (2.2%) |
| 8:30 AM to 8:59 AM | 0 (0.0%) | 0 (0.0%) |
| 9:00 AM to 9:59 AM | 19 (3.0%) | 0 (0.0%) |
| 10:00 AM to 10:59 AM | 0 (0.0%) | 0 (0.0%) |
| 11:00 AM to 11:59 AM | 0 (0.0%) | 0 (0.0%) |
| 12:00 PM to 3:59 PM | 21 (3.3%) | 244 (28.3%) |
| 4:00 PM to 11:59 PM | 0 (0.0%) | 135 (15.7%) |
| Total | 633 (100.0%) | 861 (100.0%) |
Housing Occupancy in Greensboro
Occupancy by Ownership in Greensboro
Of the total 1,526 dwellings in Greensboro, owner-occupied units account for 957 (62.7%), while renter-occupied units make up 569 (37.3%).
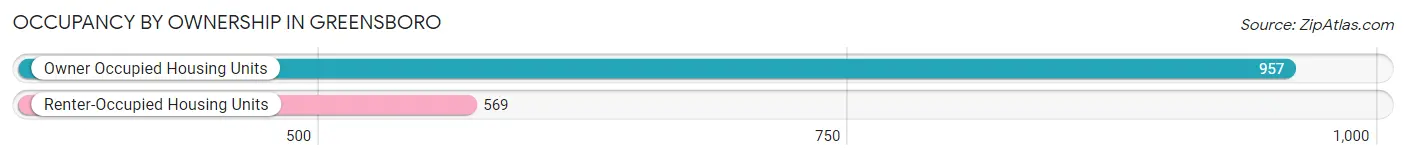
| Occupancy | # Housing Units | % Housing Units |
| Owner Occupied Housing Units | 957 | 62.7% |
| Renter-Occupied Housing Units | 569 | 37.3% |
| Total Occupied Housing Units | 1,526 | 100.0% |
Occupancy by Household Size in Greensboro
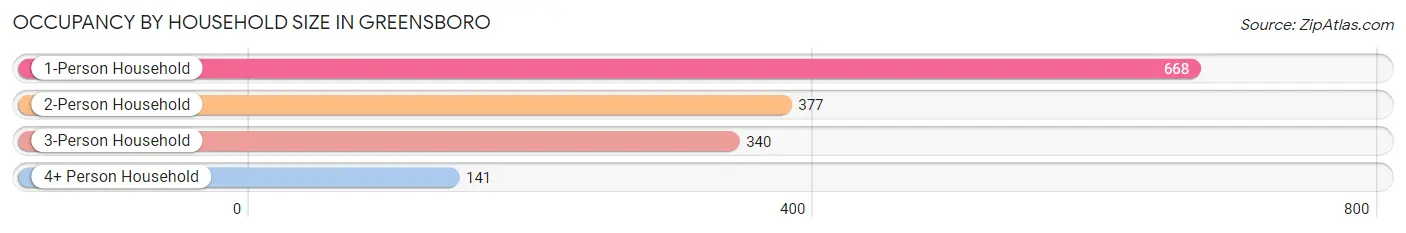
| Household Size | # Housing Units | % Housing Units |
| 1-Person Household | 668 | 43.8% |
| 2-Person Household | 377 | 24.7% |
| 3-Person Household | 340 | 22.3% |
| 4+ Person Household | 141 | 9.2% |
| Total Housing Units | 1,526 | 100.0% |
Occupancy by Ownership by Household Size in Greensboro
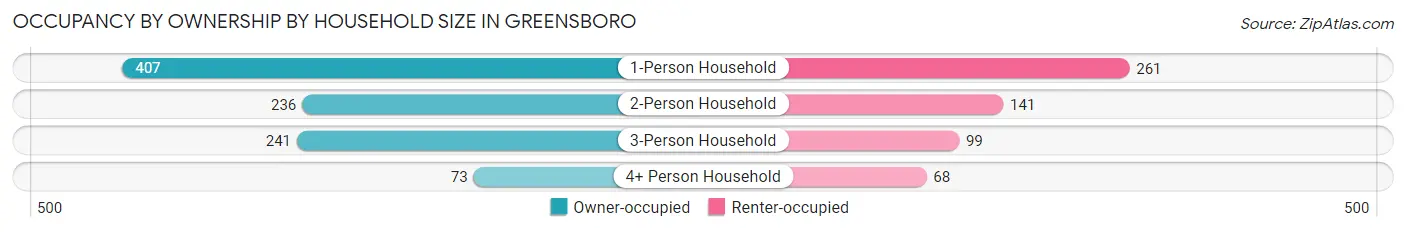
| Household Size | Owner-occupied | Renter-occupied |
| 1-Person Household | 407 (60.9%) | 261 (39.1%) |
| 2-Person Household | 236 (62.6%) | 141 (37.4%) |
| 3-Person Household | 241 (70.9%) | 99 (29.1%) |
| 4+ Person Household | 73 (51.8%) | 68 (48.2%) |
| Total Housing Units | 957 (62.7%) | 569 (37.3%) |
Occupancy by Educational Attainment in Greensboro
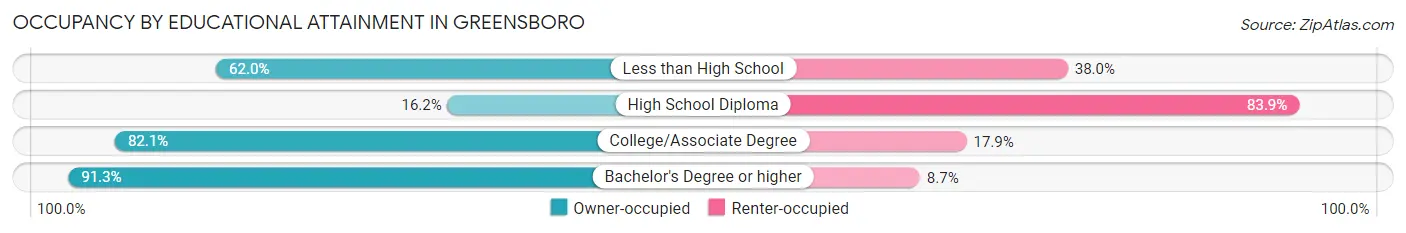
| Household Size | Owner-occupied | Renter-occupied |
| Less than High School | 111 (62.0%) | 68 (38.0%) |
| High School Diploma | 73 (16.2%) | 379 (83.9%) |
| College/Associate Degree | 394 (82.1%) | 86 (17.9%) |
| Bachelor's Degree or higher | 379 (91.3%) | 36 (8.7%) |
Occupancy by Age of Householder in Greensboro
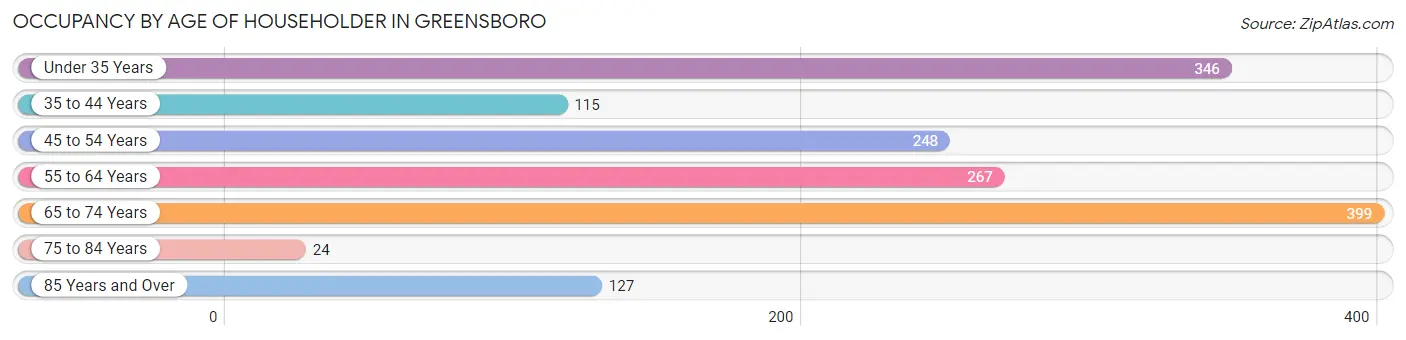
| Age Bracket | # Households | % Households |
| Under 35 Years | 346 | 22.7% |
| 35 to 44 Years | 115 | 7.5% |
| 45 to 54 Years | 248 | 16.3% |
| 55 to 64 Years | 267 | 17.5% |
| 65 to 74 Years | 399 | 26.2% |
| 75 to 84 Years | 24 | 1.6% |
| 85 Years and Over | 127 | 8.3% |
| Total | 1,526 | 100.0% |
Housing Finances in Greensboro
Median Income by Occupancy in Greensboro
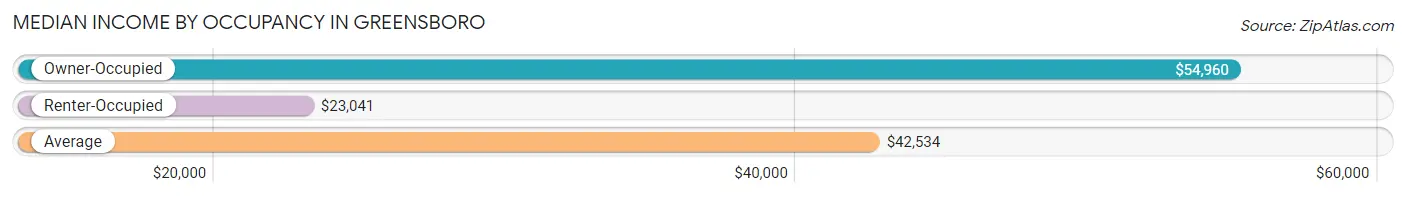
| Occupancy Type | # Households | Median Income |
| Owner-Occupied | 957 (62.7%) | $54,960 |
| Renter-Occupied | 569 (37.3%) | $23,041 |
| Average | 1,526 (100.0%) | $42,534 |
Occupancy by Householder Income Bracket in Greensboro
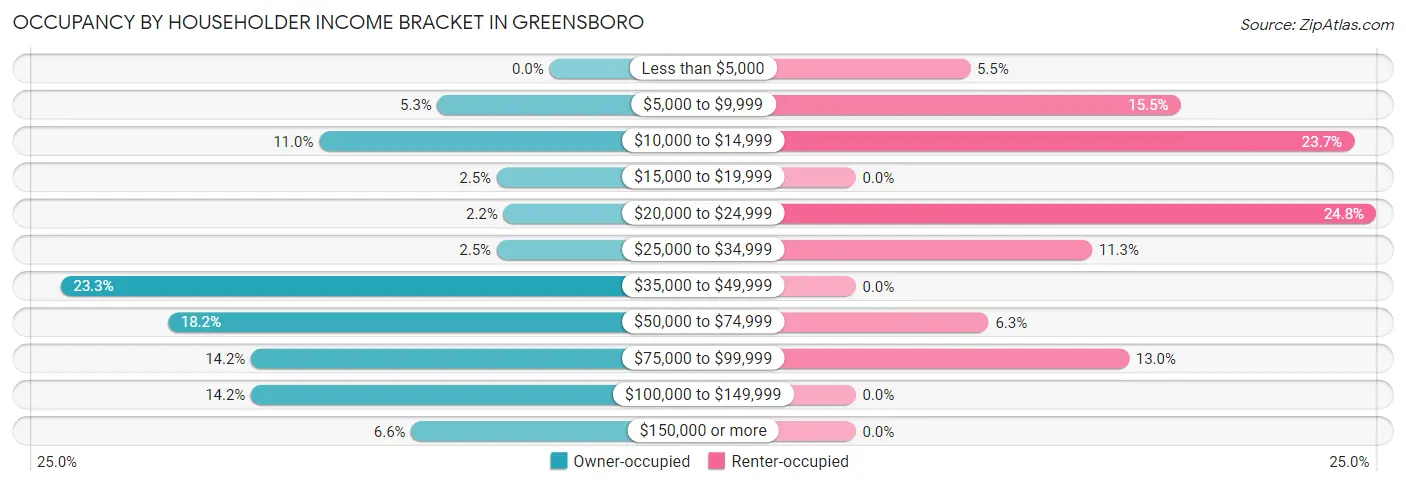
| Income Bracket | Owner-occupied | Renter-occupied |
| Less than $5,000 | 0 (0.0%) | 31 (5.4%) |
| $5,000 to $9,999 | 51 (5.3%) | 88 (15.5%) |
| $10,000 to $14,999 | 105 (11.0%) | 135 (23.7%) |
| $15,000 to $19,999 | 24 (2.5%) | 0 (0.0%) |
| $20,000 to $24,999 | 21 (2.2%) | 141 (24.8%) |
| $25,000 to $34,999 | 24 (2.5%) | 64 (11.3%) |
| $35,000 to $49,999 | 223 (23.3%) | 0 (0.0%) |
| $50,000 to $74,999 | 174 (18.2%) | 36 (6.3%) |
| $75,000 to $99,999 | 136 (14.2%) | 74 (13.0%) |
| $100,000 to $149,999 | 136 (14.2%) | 0 (0.0%) |
| $150,000 or more | 63 (6.6%) | 0 (0.0%) |
| Total | 957 (100.0%) | 569 (100.0%) |
Monthly Housing Cost Tiers in Greensboro
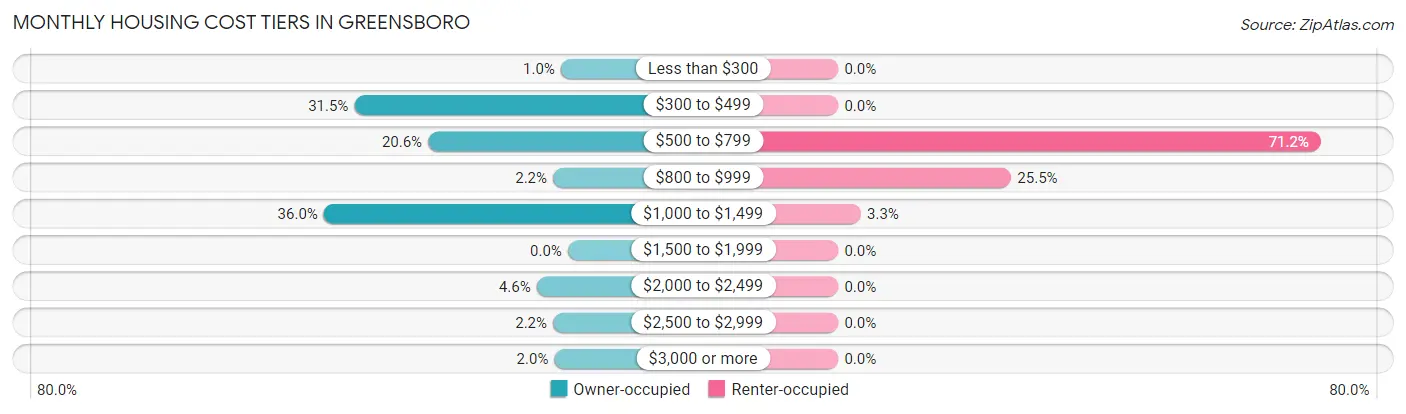
| Monthly Cost | Owner-occupied | Renter-occupied |
| Less than $300 | 10 (1.0%) | 0 (0.0%) |
| $300 to $499 | 301 (31.5%) | 0 (0.0%) |
| $500 to $799 | 197 (20.6%) | 405 (71.2%) |
| $800 to $999 | 21 (2.2%) | 145 (25.5%) |
| $1,000 to $1,499 | 344 (35.9%) | 19 (3.3%) |
| $1,500 to $1,999 | 0 (0.0%) | 0 (0.0%) |
| $2,000 to $2,499 | 44 (4.6%) | 0 (0.0%) |
| $2,500 to $2,999 | 21 (2.2%) | 0 (0.0%) |
| $3,000 or more | 19 (2.0%) | 0 (0.0%) |
| Total | 957 (100.0%) | 569 (100.0%) |
Physical Housing Characteristics in Greensboro
Housing Structures in Greensboro
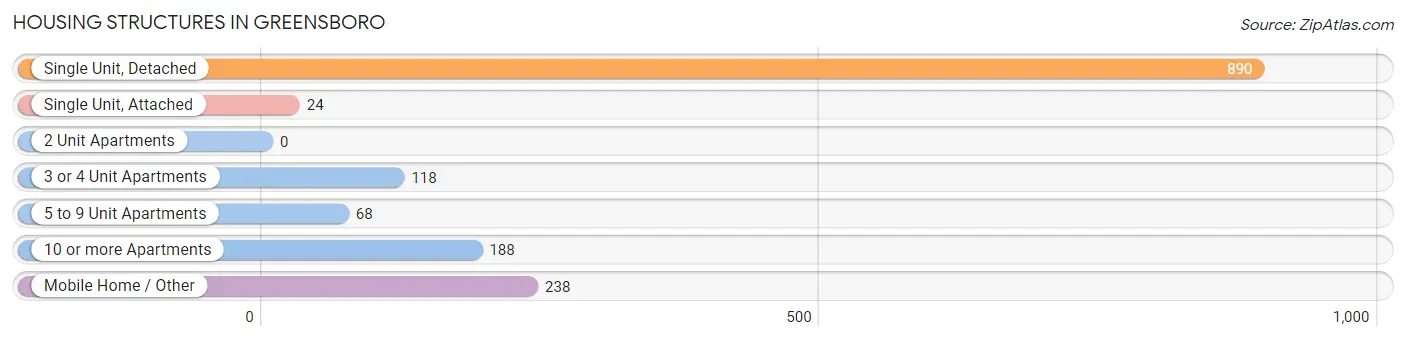
| Structure Type | # Housing Units | % Housing Units |
| Single Unit, Detached | 890 | 58.3% |
| Single Unit, Attached | 24 | 1.6% |
| 2 Unit Apartments | 0 | 0.0% |
| 3 or 4 Unit Apartments | 118 | 7.7% |
| 5 to 9 Unit Apartments | 68 | 4.5% |
| 10 or more Apartments | 188 | 12.3% |
| Mobile Home / Other | 238 | 15.6% |
| Total | 1,526 | 100.0% |
Housing Structures by Occupancy in Greensboro
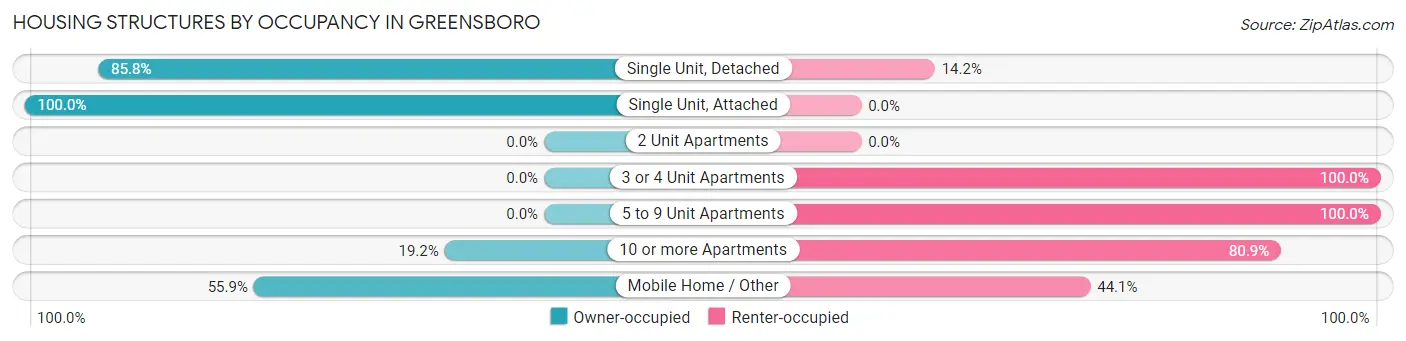
| Structure Type | Owner-occupied | Renter-occupied |
| Single Unit, Detached | 764 (85.8%) | 126 (14.2%) |
| Single Unit, Attached | 24 (100.0%) | 0 (0.0%) |
| 2 Unit Apartments | 0 (0.0%) | 0 (0.0%) |
| 3 or 4 Unit Apartments | 0 (0.0%) | 118 (100.0%) |
| 5 to 9 Unit Apartments | 0 (0.0%) | 68 (100.0%) |
| 10 or more Apartments | 36 (19.2%) | 152 (80.8%) |
| Mobile Home / Other | 133 (55.9%) | 105 (44.1%) |
| Total | 957 (62.7%) | 569 (37.3%) |
Housing Structures by Number of Rooms in Greensboro
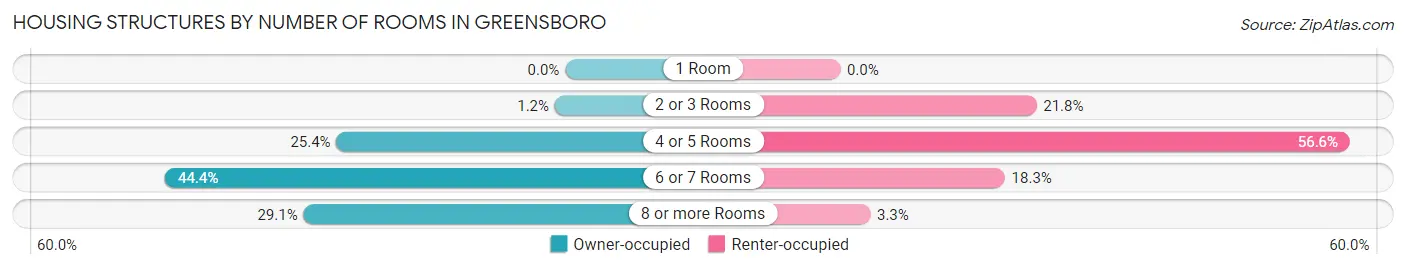
| Number of Rooms | Owner-occupied | Renter-occupied |
| 1 Room | 0 (0.0%) | 0 (0.0%) |
| 2 or 3 Rooms | 11 (1.1%) | 124 (21.8%) |
| 4 or 5 Rooms | 243 (25.4%) | 322 (56.6%) |
| 6 or 7 Rooms | 425 (44.4%) | 104 (18.3%) |
| 8 or more Rooms | 278 (29.0%) | 19 (3.3%) |
| Total | 957 (100.0%) | 569 (100.0%) |
Housing Structure by Heating Type in Greensboro
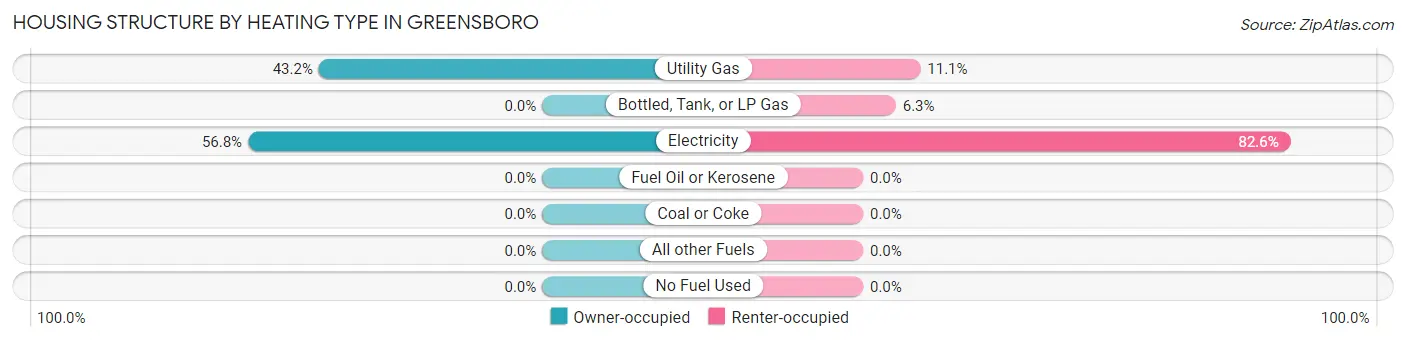
| Heating Type | Owner-occupied | Renter-occupied |
| Utility Gas | 413 (43.2%) | 63 (11.1%) |
| Bottled, Tank, or LP Gas | 0 (0.0%) | 36 (6.3%) |
| Electricity | 544 (56.8%) | 470 (82.6%) |
| Fuel Oil or Kerosene | 0 (0.0%) | 0 (0.0%) |
| Coal or Coke | 0 (0.0%) | 0 (0.0%) |
| All other Fuels | 0 (0.0%) | 0 (0.0%) |
| No Fuel Used | 0 (0.0%) | 0 (0.0%) |
| Total | 957 (100.0%) | 569 (100.0%) |
Household Vehicle Usage in Greensboro
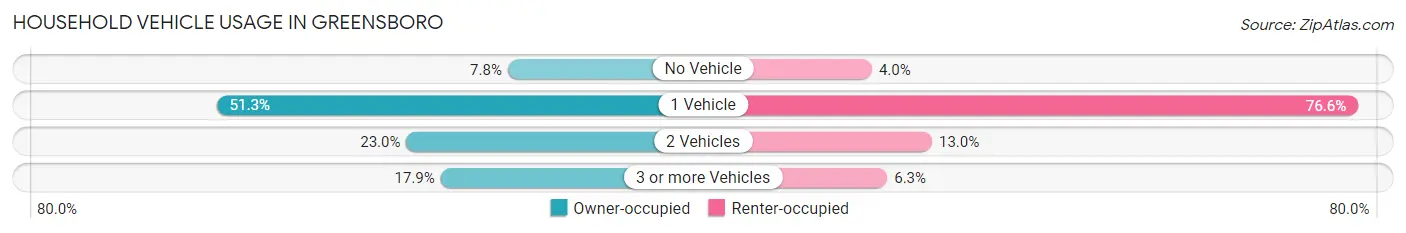
| Vehicles per Household | Owner-occupied | Renter-occupied |
| No Vehicle | 75 (7.8%) | 23 (4.0%) |
| 1 Vehicle | 491 (51.3%) | 436 (76.6%) |
| 2 Vehicles | 220 (23.0%) | 74 (13.0%) |
| 3 or more Vehicles | 171 (17.9%) | 36 (6.3%) |
| Total | 957 (100.0%) | 569 (100.0%) |
Real Estate & Mortgages in Greensboro
Real Estate and Mortgage Overview in Greensboro
| Characteristic | Without Mortgage | With Mortgage |
| Housing Units | 508 | 449 |
| Median Property Value | $95,400 | $143,800 |
| Median Household Income | $36,623 | $63 |
| Monthly Housing Costs | $462 | $19 |
| Real Estate Taxes | $800 | $0 |
Property Value by Mortgage Status in Greensboro
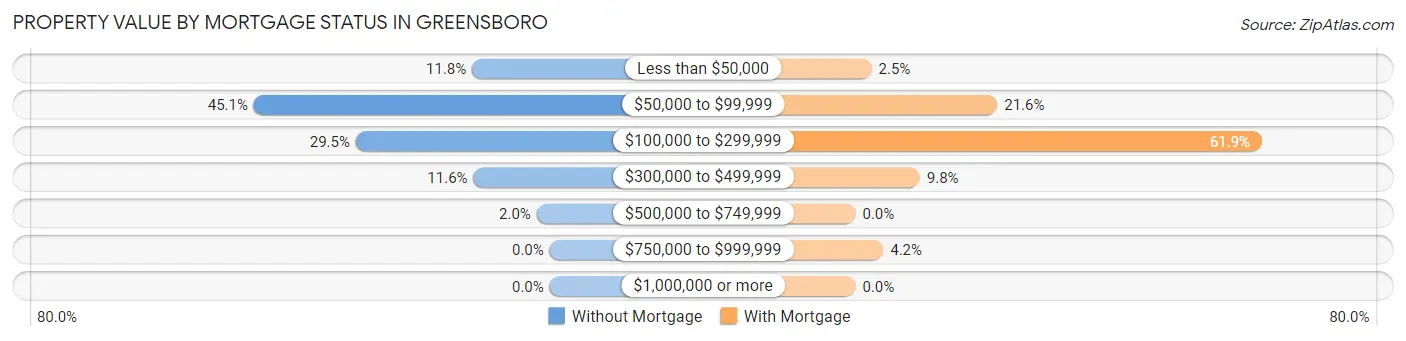
| Property Value | Without Mortgage | With Mortgage |
| Less than $50,000 | 60 (11.8%) | 11 (2.5%) |
| $50,000 to $99,999 | 229 (45.1%) | 97 (21.6%) |
| $100,000 to $299,999 | 150 (29.5%) | 278 (61.9%) |
| $300,000 to $499,999 | 59 (11.6%) | 44 (9.8%) |
| $500,000 to $749,999 | 10 (2.0%) | 0 (0.0%) |
| $750,000 to $999,999 | 0 (0.0%) | 19 (4.2%) |
| $1,000,000 or more | 0 (0.0%) | 0 (0.0%) |
| Total | 508 (100.0%) | 449 (100.0%) |
Household Income by Mortgage Status in Greensboro
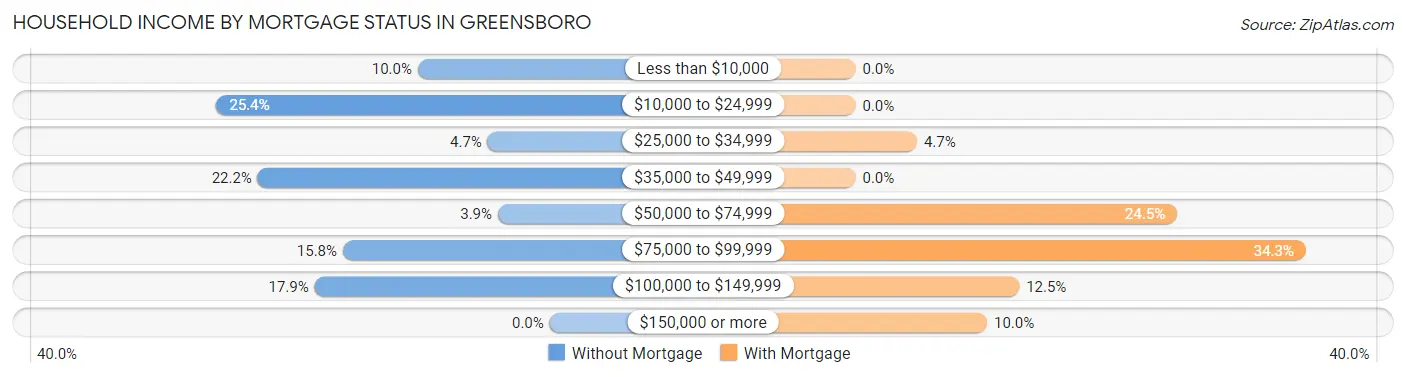
| Household Income | Without Mortgage | With Mortgage |
| Less than $10,000 | 51 (10.0%) | 0 (0.0%) |
| $10,000 to $24,999 | 129 (25.4%) | 0 (0.0%) |
| $25,000 to $34,999 | 24 (4.7%) | 21 (4.7%) |
| $35,000 to $49,999 | 113 (22.2%) | 0 (0.0%) |
| $50,000 to $74,999 | 20 (3.9%) | 110 (24.5%) |
| $75,000 to $99,999 | 80 (15.8%) | 154 (34.3%) |
| $100,000 to $149,999 | 91 (17.9%) | 56 (12.5%) |
| $150,000 or more | 0 (0.0%) | 45 (10.0%) |
| Total | 508 (100.0%) | 449 (100.0%) |
Property Value to Household Income Ratio in Greensboro
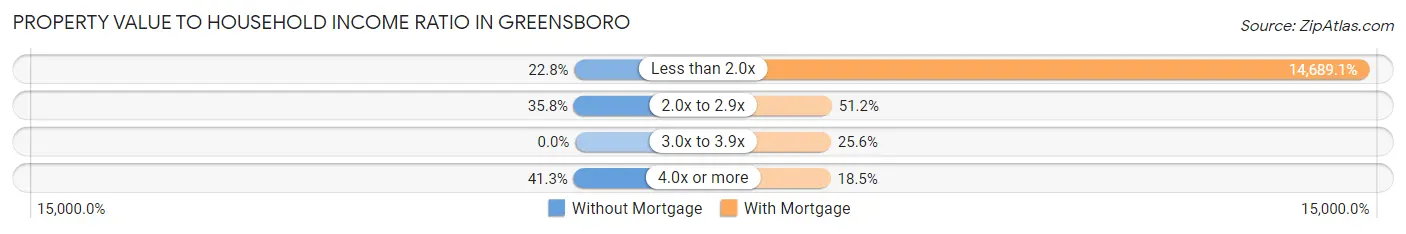
| Value-to-Income Ratio | Without Mortgage | With Mortgage |
| Less than 2.0x | 116 (22.8%) | 65,954 (14,689.1%) |
| 2.0x to 2.9x | 182 (35.8%) | 230 (51.2%) |
| 3.0x to 3.9x | 0 (0.0%) | 115 (25.6%) |
| 4.0x or more | 210 (41.3%) | 83 (18.5%) |
| Total | 508 (100.0%) | 449 (100.0%) |
Real Estate Taxes by Mortgage Status in Greensboro
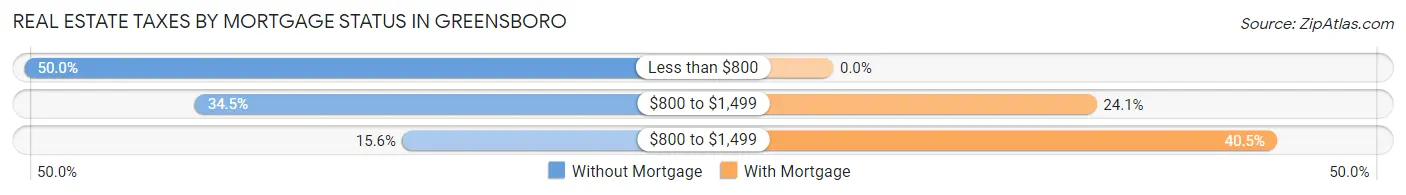
| Property Taxes | Without Mortgage | With Mortgage |
| Less than $800 | 254 (50.0%) | 0 (0.0%) |
| $800 to $1,499 | 175 (34.4%) | 108 (24.0%) |
| $800 to $1,499 | 79 (15.5%) | 182 (40.5%) |
| Total | 508 (100.0%) | 449 (100.0%) |
Health & Disability in Greensboro
Health Insurance Coverage by Age in Greensboro
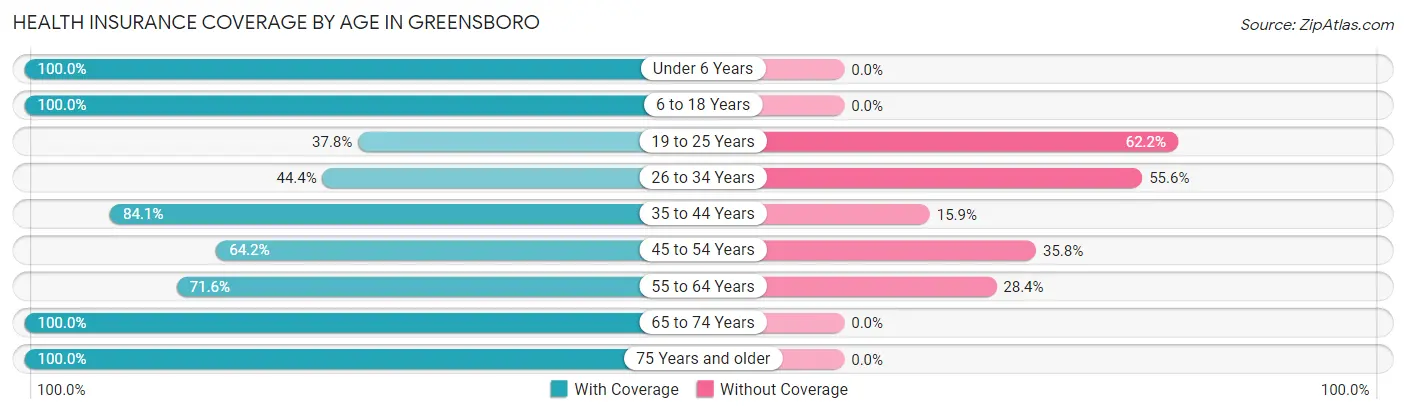
| Age Bracket | With Coverage | Without Coverage |
| Under 6 Years | 290 (100.0%) | 0 (0.0%) |
| 6 to 18 Years | 293 (100.0%) | 0 (0.0%) |
| 19 to 25 Years | 245 (37.8%) | 403 (62.2%) |
| 26 to 34 Years | 176 (44.4%) | 220 (55.6%) |
| 35 to 44 Years | 211 (84.1%) | 40 (15.9%) |
| 45 to 54 Years | 291 (64.2%) | 162 (35.8%) |
| 55 to 64 Years | 341 (71.6%) | 135 (28.4%) |
| 65 to 74 Years | 534 (100.0%) | 0 (0.0%) |
| 75 Years and older | 154 (100.0%) | 0 (0.0%) |
| Total | 2,535 (72.5%) | 960 (27.5%) |
Health Insurance Coverage by Citizenship Status in Greensboro
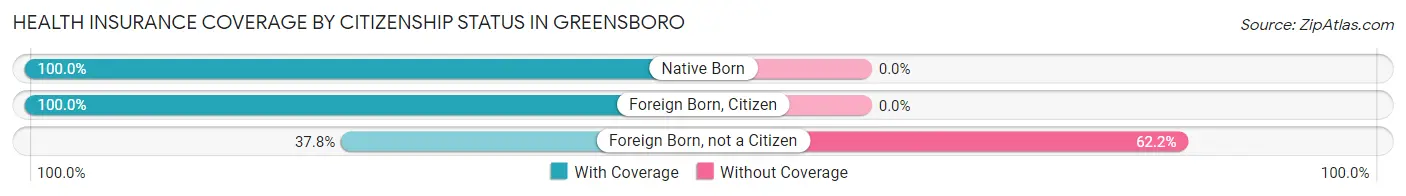
| Citizenship Status | With Coverage | Without Coverage |
| Native Born | 290 (100.0%) | 0 (0.0%) |
| Foreign Born, Citizen | 293 (100.0%) | 0 (0.0%) |
| Foreign Born, not a Citizen | 245 (37.8%) | 403 (62.2%) |
Health Insurance Coverage by Household Income in Greensboro
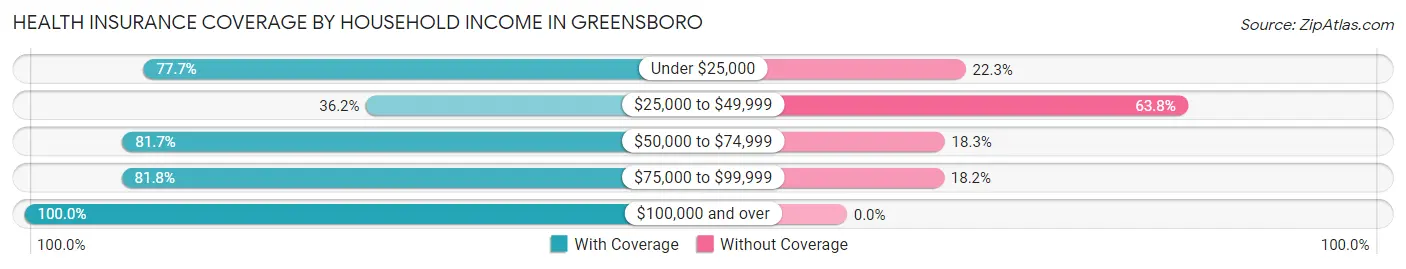
| Household Income | With Coverage | Without Coverage |
| Under $25,000 | 911 (77.7%) | 261 (22.3%) |
| $25,000 to $49,999 | 311 (36.2%) | 549 (63.8%) |
| $50,000 to $74,999 | 303 (81.7%) | 68 (18.3%) |
| $75,000 to $99,999 | 369 (81.8%) | 82 (18.2%) |
| $100,000 and over | 631 (100.0%) | 0 (0.0%) |
Public vs Private Health Insurance Coverage by Age in Greensboro
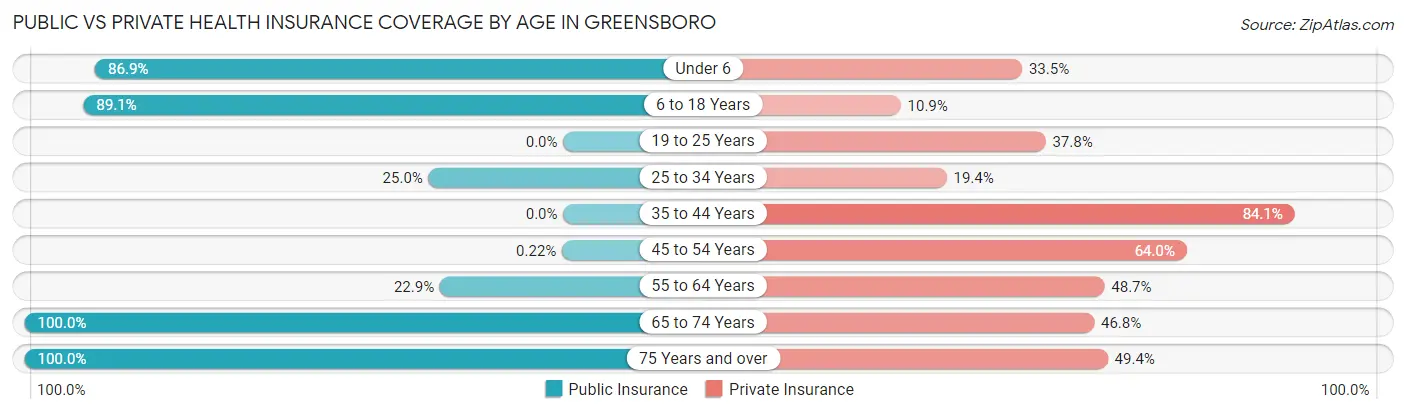
| Age Bracket | Public Insurance | Private Insurance |
| Under 6 | 252 (86.9%) | 97 (33.5%) |
| 6 to 18 Years | 261 (89.1%) | 32 (10.9%) |
| 19 to 25 Years | 0 (0.0%) | 245 (37.8%) |
| 25 to 34 Years | 99 (25.0%) | 77 (19.4%) |
| 35 to 44 Years | 0 (0.0%) | 211 (84.1%) |
| 45 to 54 Years | 1 (0.2%) | 290 (64.0%) |
| 55 to 64 Years | 109 (22.9%) | 232 (48.7%) |
| 65 to 74 Years | 534 (100.0%) | 250 (46.8%) |
| 75 Years and over | 154 (100.0%) | 76 (49.3%) |
| Total | 1,410 (40.3%) | 1,510 (43.2%) |
Disability Status by Sex by Age in Greensboro
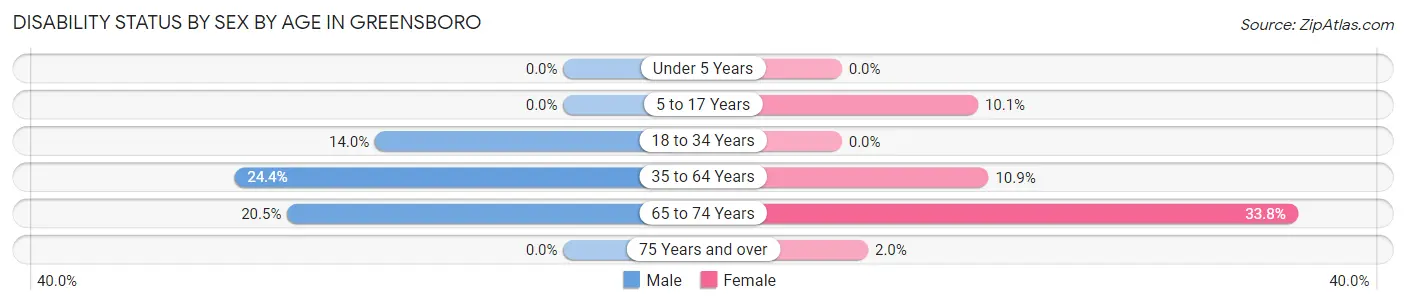
| Age Bracket | Male | Female |
| Under 5 Years | 0 (0.0%) | 0 (0.0%) |
| 5 to 17 Years | 0 (0.0%) | 19 (10.1%) |
| 18 to 34 Years | 79 (14.0%) | 0 (0.0%) |
| 35 to 64 Years | 64 (24.4%) | 100 (10.9%) |
| 65 to 74 Years | 41 (20.5%) | 113 (33.8%) |
| 75 Years and over | 0 (0.0%) | 3 (1.9%) |
Disability Class by Sex by Age in Greensboro
Disability Class: Hearing Difficulty
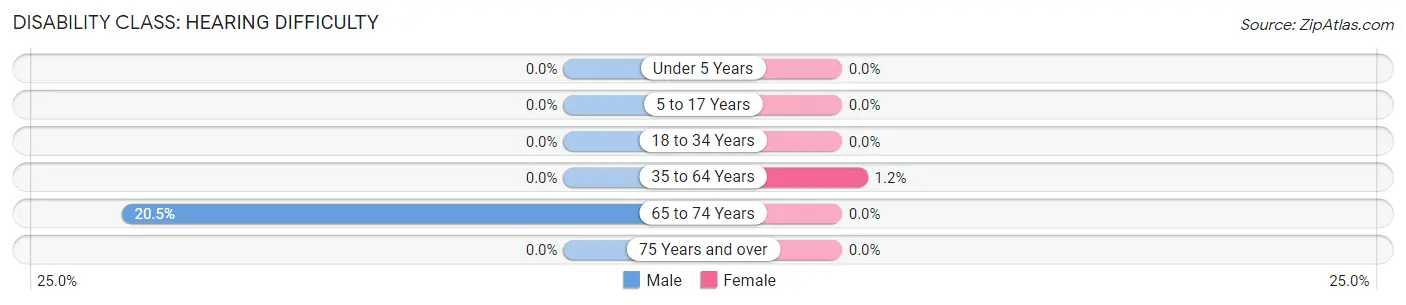
| Age Bracket | Male | Female |
| Under 5 Years | 0 (0.0%) | 0 (0.0%) |
| 5 to 17 Years | 0 (0.0%) | 0 (0.0%) |
| 18 to 34 Years | 0 (0.0%) | 0 (0.0%) |
| 35 to 64 Years | 0 (0.0%) | 11 (1.2%) |
| 65 to 74 Years | 41 (20.5%) | 0 (0.0%) |
| 75 Years and over | 0 (0.0%) | 0 (0.0%) |
Disability Class: Vision Difficulty
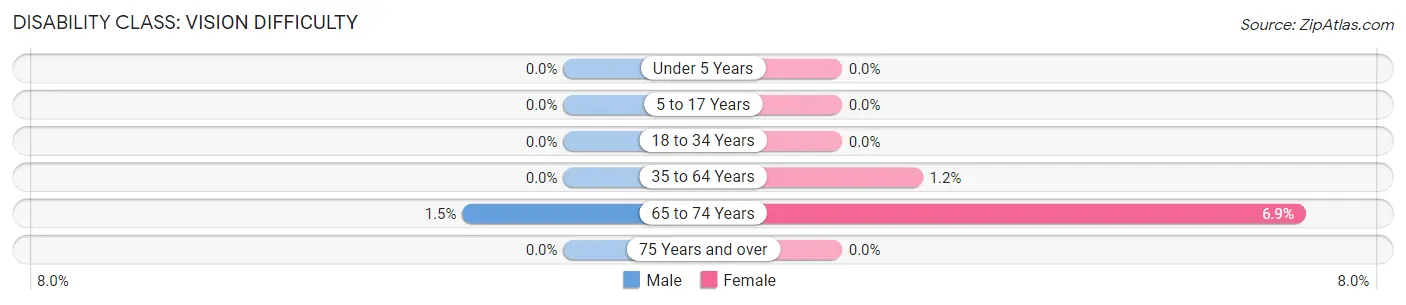
| Age Bracket | Male | Female |
| Under 5 Years | 0 (0.0%) | 0 (0.0%) |
| 5 to 17 Years | 0 (0.0%) | 0 (0.0%) |
| 18 to 34 Years | 0 (0.0%) | 0 (0.0%) |
| 35 to 64 Years | 0 (0.0%) | 11 (1.2%) |
| 65 to 74 Years | 3 (1.5%) | 23 (6.9%) |
| 75 Years and over | 0 (0.0%) | 0 (0.0%) |
Disability Class: Cognitive Difficulty
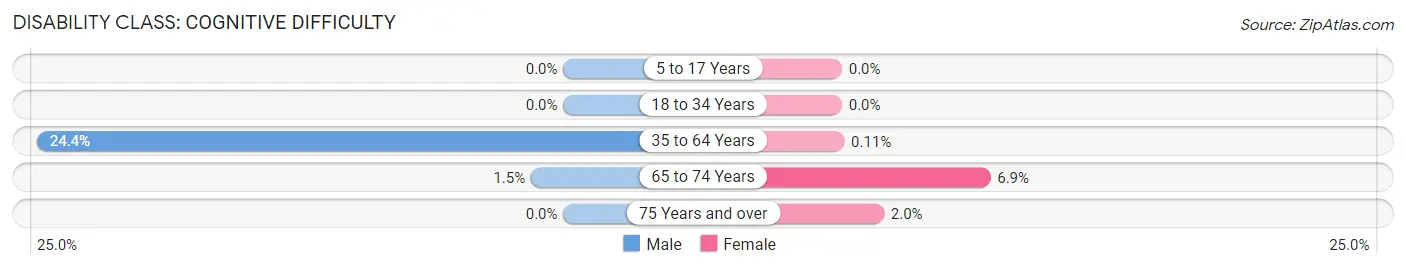
| Age Bracket | Male | Female |
| 5 to 17 Years | 0 (0.0%) | 0 (0.0%) |
| 18 to 34 Years | 0 (0.0%) | 0 (0.0%) |
| 35 to 64 Years | 64 (24.4%) | 1 (0.1%) |
| 65 to 74 Years | 3 (1.5%) | 23 (6.9%) |
| 75 Years and over | 0 (0.0%) | 3 (1.9%) |
Disability Class: Ambulatory Difficulty
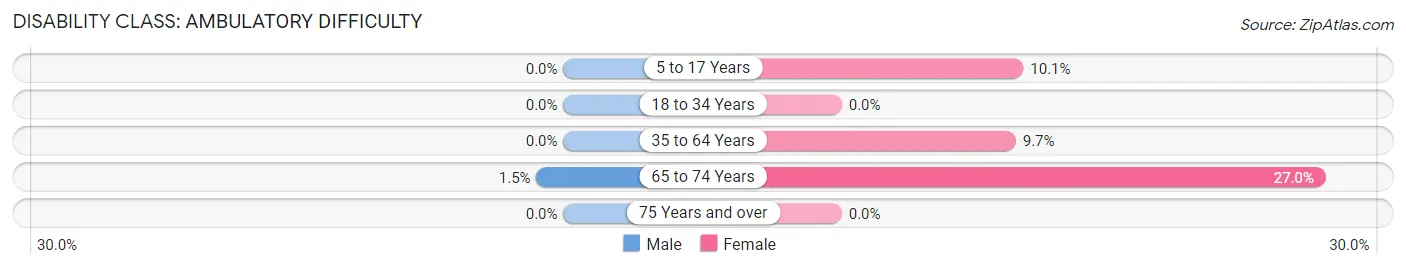
| Age Bracket | Male | Female |
| 5 to 17 Years | 0 (0.0%) | 19 (10.1%) |
| 18 to 34 Years | 0 (0.0%) | 0 (0.0%) |
| 35 to 64 Years | 0 (0.0%) | 89 (9.7%) |
| 65 to 74 Years | 3 (1.5%) | 90 (27.0%) |
| 75 Years and over | 0 (0.0%) | 0 (0.0%) |
Disability Class: Self-Care Difficulty
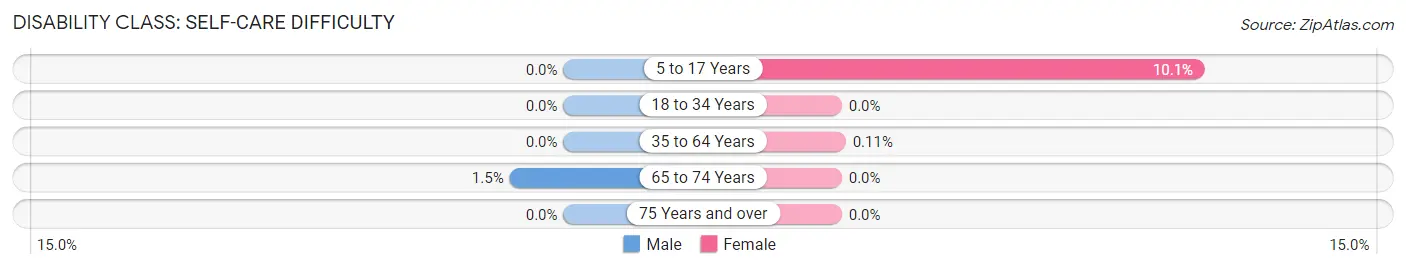
| Age Bracket | Male | Female |
| 5 to 17 Years | 0 (0.0%) | 19 (10.1%) |
| 18 to 34 Years | 0 (0.0%) | 0 (0.0%) |
| 35 to 64 Years | 0 (0.0%) | 1 (0.1%) |
| 65 to 74 Years | 3 (1.5%) | 0 (0.0%) |
| 75 Years and over | 0 (0.0%) | 0 (0.0%) |
Technology Access in Greensboro
Computing Device Access in Greensboro
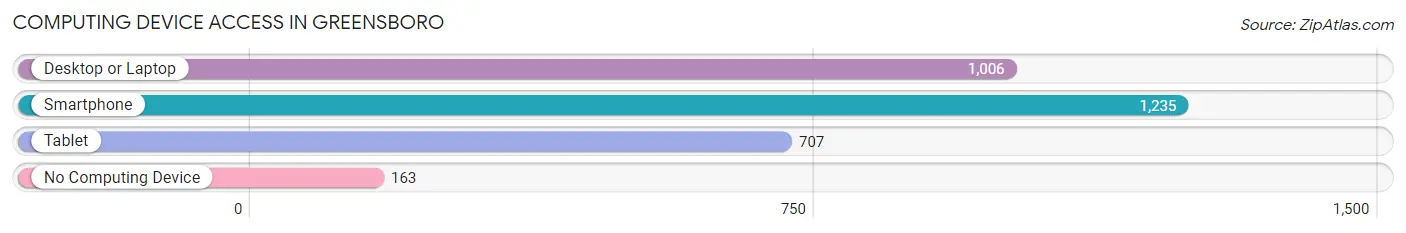
| Device Type | # Households | % Households |
| Desktop or Laptop | 1,006 | 65.9% |
| Smartphone | 1,235 | 80.9% |
| Tablet | 707 | 46.3% |
| No Computing Device | 163 | 10.7% |
| Total | 1,526 | 100.0% |
Internet Access in Greensboro
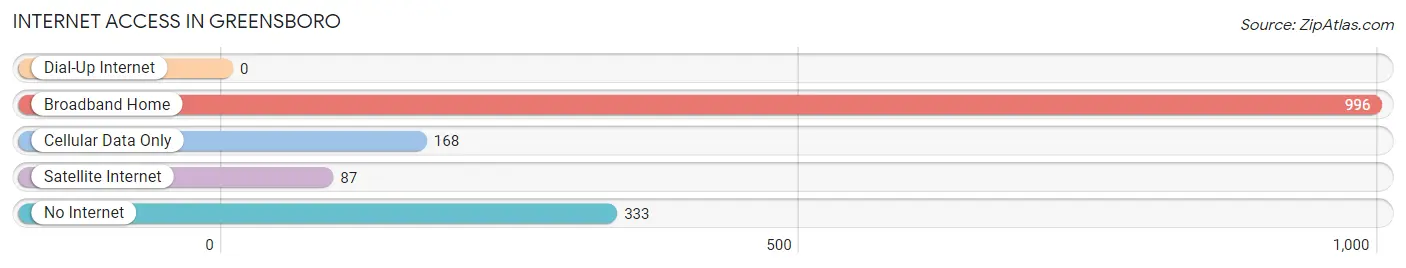
| Internet Type | # Households | % Households |
| Dial-Up Internet | 0 | 0.0% |
| Broadband Home | 996 | 65.3% |
| Cellular Data Only | 168 | 11.0% |
| Satellite Internet | 87 | 5.7% |
| No Internet | 333 | 21.8% |
| Total | 1,526 | 100.0% |
Greensboro Summary
Greensboro, Georgia is a small city located in Greene County, Georgia, United States. It is the county seat of Greene County and is located approximately 70 miles east of Atlanta. The city has a population of 3,453 as of the 2010 census.
Geography
Greensboro is located at 33°30'N 83°7'W (33.50, -83.12). According to the United States Census Bureau, the city has a total area of 4.2 square miles (10.8 km2), all land.
History
Greensboro was founded in 1786 by Revolutionary War veteran General Elijah Clarke. The city was named after General Nathanael Greene, a hero of the American Revolution. The city was incorporated in 1803 and has been the county seat of Greene County since its founding.
Greensboro was a major cotton-producing center in the 19th century and was home to several large cotton mills. The city was also home to a large number of African-American residents, many of whom worked in the cotton mills.
Economy
Greensboro’s economy is largely based on agriculture and manufacturing. The city is home to several large poultry processing plants, as well as a number of smaller manufacturing companies. The city is also home to a number of retail stores, restaurants, and other businesses.
Demographics
As of the 2010 census, there were 3,453 people, 1,323 households, and 890 families residing in the city. The population density was 819.3 people per square mile (315.9/km2). There were 1,521 housing units at an average density of 363.3 per square mile (140.4/km2). The racial makeup of the city was 57.2% White, 39.3% African American, 0.2% Native American, 0.7% Asian, 0.1% Pacific Islander, 1.2% from other races, and 1.4% from two or more races. Hispanic or Latino of any race were 2.7% of the population.
There were 1,323 households, out of which 28.3% had children under the age of 18 living with them, 41.2% were married couples living together, 20.2% had a female householder with no husband present, and 34.2% were non-families. 29.2% of all households were made up of individuals, and 11.7% had someone living alone who was 65 years of age or older. The average household size was 2.50 and the average family size was 3.09.
In the city, the population was spread out, with 25.2% under the age of 18, 8.3% from 18 to 24, 27.2% from 25 to 44, 24.2% from 45 to 64, and 15.1% who were 65 years of age or older. The median age was 37 years. For every 100 females, there were 87.2 males. For every 100 females age 18 and over, there were 81.3 males.
The median income for a household in the city was $30,938, and the median income for a family was $37,917. Males had a median income of $30,000 versus $21,250 for females. The per capita income for the city was $15,945. About 14.2% of families and 17.3% of the population were below the poverty line, including 24.2% of those under age 18 and 15.2% of those age 65 or over.
Common Questions
What is Per Capita Income in Greensboro?
Per Capita income in Greensboro is $29,907.
What is the Median Family Income in Greensboro?
Median Family Income in Greensboro is $44,605.
What is the Median Household income in Greensboro?
Median Household Income in Greensboro is $42,534.
What is Family Income Deficit in Greensboro?
Family Income Deficit in Greensboro is $14,075.
Families that are below poverty line in Greensboro earn $14,075 less on average than the poverty threshold level.
What is Inequality or Gini Index in Greensboro?
Inequality or Gini Index in Greensboro is 0.55.
What is the Total Population of Greensboro?
Total Population of Greensboro is 3,573.
What is the Total Male Population of Greensboro?
Total Male Population of Greensboro is 1,402.
What is the Total Female Population of Greensboro?
Total Female Population of Greensboro is 2,171.
What is the Ratio of Males per 100 Females in Greensboro?
There are 64.58 Males per 100 Females in Greensboro.
What is the Ratio of Females per 100 Males in Greensboro?
There are 154.85 Females per 100 Males in Greensboro.
What is the Median Population Age in Greensboro?
Median Population Age in Greensboro is 40.4 Years.
What is the Average Family Size in Greensboro
Average Family Size in Greensboro is 3.3 People.
What is the Average Household Size in Greensboro
Average Household Size in Greensboro is 2.3 People.
How Large is the Labor Force in Greensboro?
There are 1,662 People in the Labor Forcein in Greensboro.
What is the Percentage of People in the Labor Force in Greensboro?
55.6% of People are in the Labor Force in Greensboro.
What is the Unemployment Rate in Greensboro?
Unemployment Rate in Greensboro is 10.1%.