Girard, GA Map & Demographics
Girard Map
Girard Overview
$27,449
PER CAPITA INCOME
$59,265
AVG FAMILY INCOME
$58,309
AVG HOUSEHOLD INCOME
33.7%
WAGE / INCOME GAP [ % ]
66.3¢/ $1
WAGE / INCOME GAP [ $ ]
0.44
INEQUALITY / GINI INDEX
202
TOTAL POPULATION
89
MALE POPULATION
113
FEMALE POPULATION
78.76
MALES / 100 FEMALES
126.97
FEMALES / 100 MALES
36.8
MEDIAN AGE
4.7
AVG FAMILY SIZE
3.3
AVG HOUSEHOLD SIZE
47
LABOR FORCE [ PEOPLE ]
34.3%
PERCENT IN LABOR FORCE
2.1%
UNEMPLOYMENT RATE
Girard Zip Codes
Girard Area Codes
Income in Girard
Income Overview in Girard
Per Capita Income in Girard is $27,449, while median incomes of families and households are $59,265 and $58,309 respectively.
| Characteristic | Number | Measure |
| Per Capita Income | 202 | $27,449 |
| Median Family Income | 34 | $59,265 |
| Mean Family Income | 34 | $89,938 |
| Median Household Income | 61 | $58,309 |
| Mean Household Income | 61 | $75,802 |
| Income Deficit | 34 | $0 |
| Wage / Income Gap (%) | 202 | 33.66% |
| Wage / Income Gap ($) | 202 | 66.34¢ per $1 |
| Gini / Inequality Index | 202 | 0.44 |
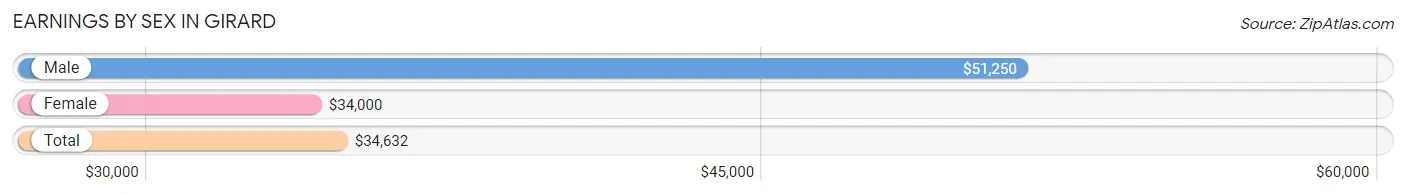
Earnings by Sex in Girard
Average Earnings in Girard are $34,632, $51,250 for men and $34,000 for women, a difference of 33.7%.
| Sex | Number | Average Earnings |
| Male | 15 (30.6%) | $51,250 |
| Female | 34 (69.4%) | $34,000 |
| Total | 49 (100.0%) | $34,632 |
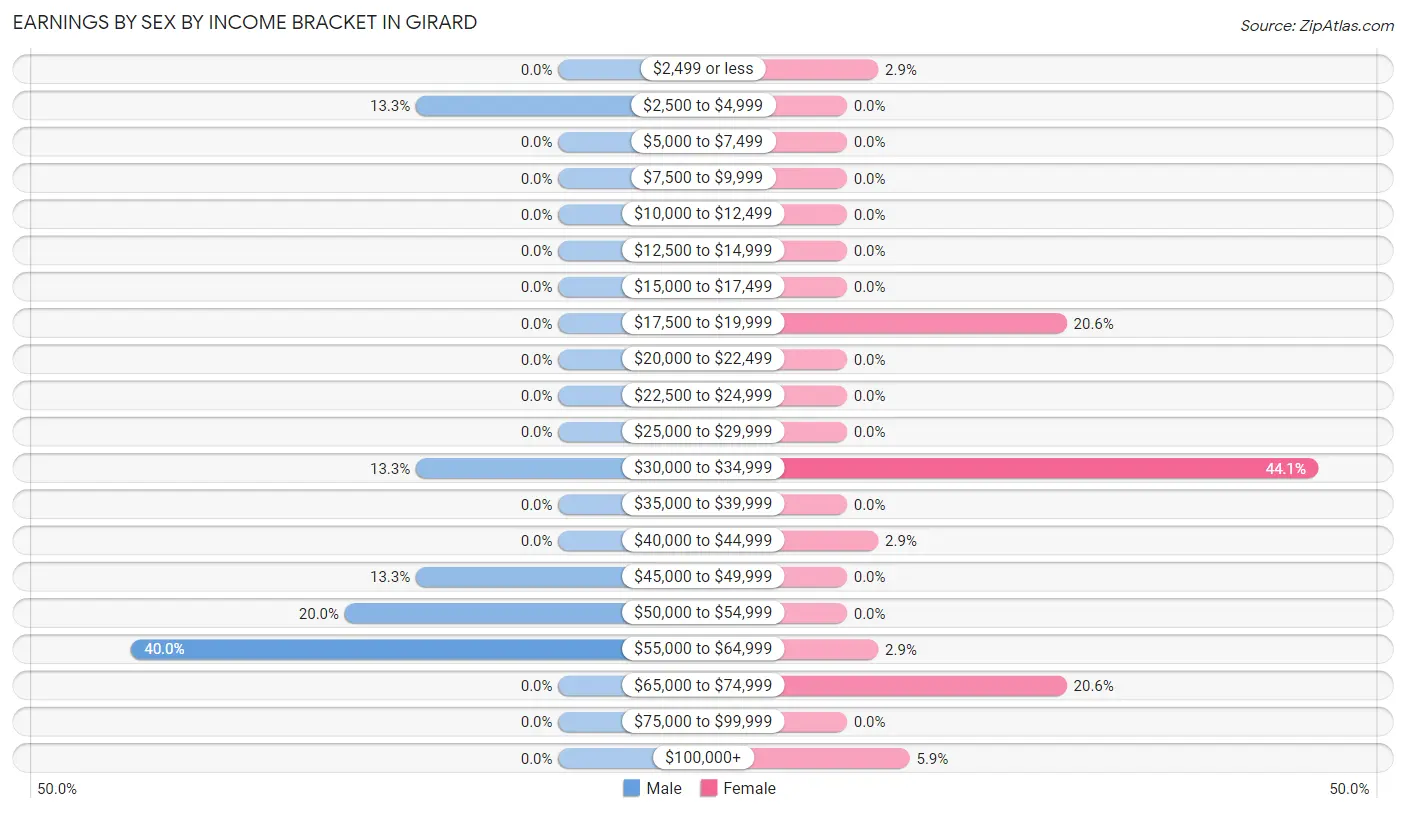
Earnings by Sex by Income Bracket in Girard
The most common earnings brackets in Girard are $55,000 to $64,999 for men (6 | 40.0%) and $30,000 to $34,999 for women (15 | 44.1%).
| Income | Male | Female |
| $2,499 or less | 0 (0.0%) | 1 (2.9%) |
| $2,500 to $4,999 | 2 (13.3%) | 0 (0.0%) |
| $5,000 to $7,499 | 0 (0.0%) | 0 (0.0%) |
| $7,500 to $9,999 | 0 (0.0%) | 0 (0.0%) |
| $10,000 to $12,499 | 0 (0.0%) | 0 (0.0%) |
| $12,500 to $14,999 | 0 (0.0%) | 0 (0.0%) |
| $15,000 to $17,499 | 0 (0.0%) | 0 (0.0%) |
| $17,500 to $19,999 | 0 (0.0%) | 7 (20.6%) |
| $20,000 to $22,499 | 0 (0.0%) | 0 (0.0%) |
| $22,500 to $24,999 | 0 (0.0%) | 0 (0.0%) |
| $25,000 to $29,999 | 0 (0.0%) | 0 (0.0%) |
| $30,000 to $34,999 | 2 (13.3%) | 15 (44.1%) |
| $35,000 to $39,999 | 0 (0.0%) | 0 (0.0%) |
| $40,000 to $44,999 | 0 (0.0%) | 1 (2.9%) |
| $45,000 to $49,999 | 2 (13.3%) | 0 (0.0%) |
| $50,000 to $54,999 | 3 (20.0%) | 0 (0.0%) |
| $55,000 to $64,999 | 6 (40.0%) | 1 (2.9%) |
| $65,000 to $74,999 | 0 (0.0%) | 7 (20.6%) |
| $75,000 to $99,999 | 0 (0.0%) | 0 (0.0%) |
| $100,000+ | 0 (0.0%) | 2 (5.9%) |
| Total | 15 (100.0%) | 34 (100.0%) |
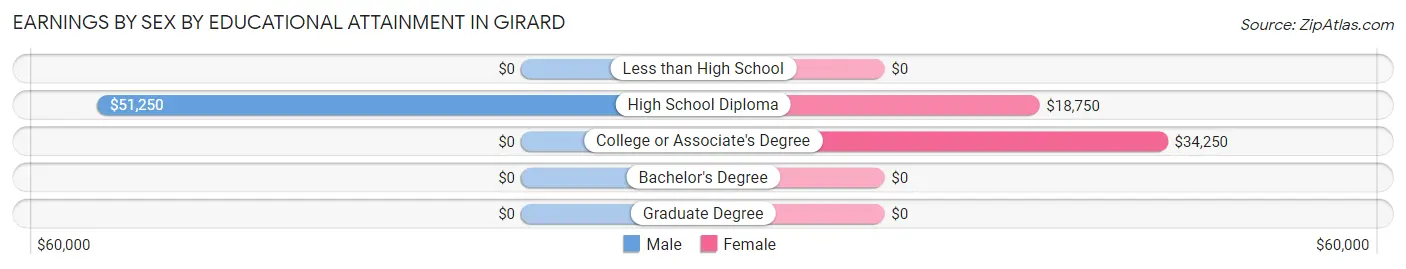
Earnings by Sex by Educational Attainment in Girard
Average earnings in Girard are $51,250 for men and $34,000 for women, a difference of 33.7%. Men with an educational attainment of high school diploma enjoy the highest average annual earnings of $51,250, while those with high school diploma education earn the least with $51,250. Women with an educational attainment of college or associate's degree earn the most with the average annual earnings of $34,250, while those with high school diploma education have the smallest earnings of $18,750.
| Educational Attainment | Male Income | Female Income |
| Less than High School | - | - |
| High School Diploma | $51,250 | $18,750 |
| College or Associate's Degree | - | - |
| Bachelor's Degree | - | - |
| Graduate Degree | - | - |
| Total | $51,250 | $34,000 |
Family Income in Girard
Family Income Brackets in Girard
According to the Girard family income data, there are 19 families falling into the $50,000 to $74,999 income range, which is the most common income bracket and makes up 55.9% of all families.
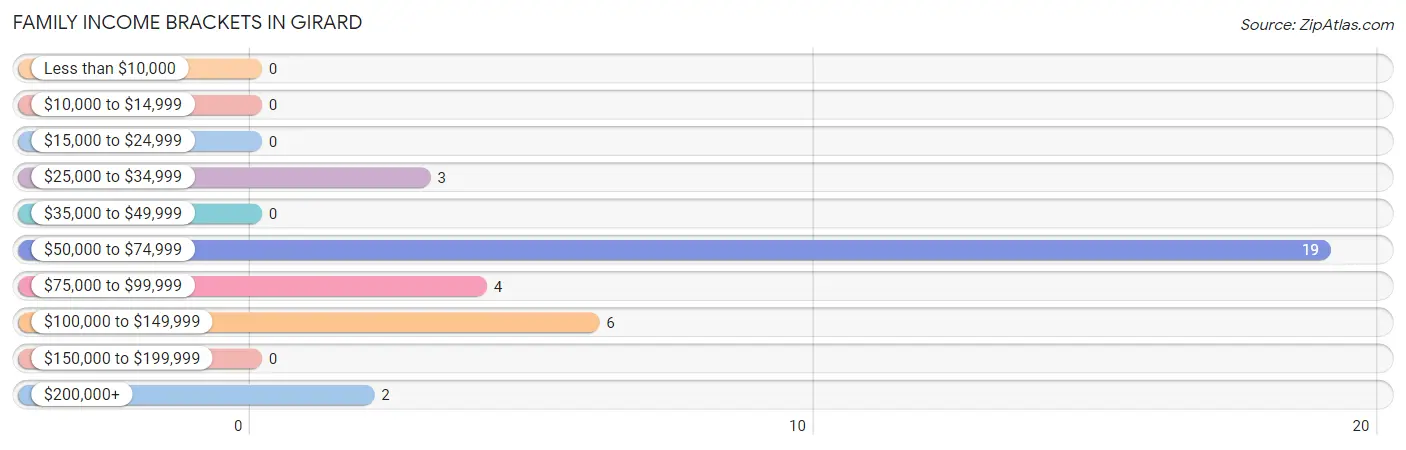
| Income Bracket | # Families | % Families |
| Less than $10,000 | 0 | 0.0% |
| $10,000 to $14,999 | 0 | 0.0% |
| $15,000 to $24,999 | 0 | 0.0% |
| $25,000 to $34,999 | 3 | 8.8% |
| $35,000 to $49,999 | 0 | 0.0% |
| $50,000 to $74,999 | 19 | 55.9% |
| $75,000 to $99,999 | 4 | 11.8% |
| $100,000 to $149,999 | 6 | 17.6% |
| $150,000 to $199,999 | 0 | 0.0% |
| $200,000+ | 2 | 5.9% |
Family Income by Famaliy Size in Girard
2-person families (15 | 44.1%) account for the highest median family income in Girard with $58,542 per family, while 2-person families (15 | 44.1%) have the highest median income of $29,271 per family member.
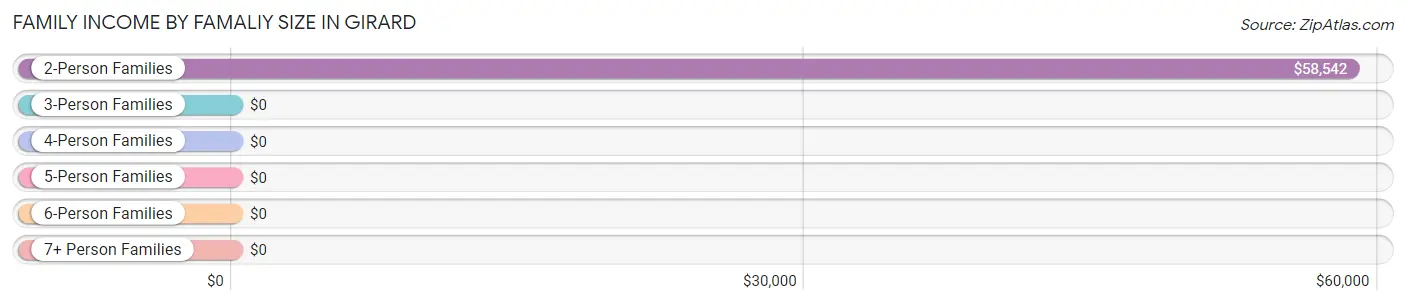
| Income Bracket | # Families | Median Income |
| 2-Person Families | 15 (44.1%) | $58,542 |
| 3-Person Families | 0 (0.0%) | $0 |
| 4-Person Families | 17 (50.0%) | $0 |
| 5-Person Families | 0 (0.0%) | $0 |
| 6-Person Families | 2 (5.9%) | $0 |
| 7+ Person Families | 0 (0.0%) | $0 |
| Total | 34 (100.0%) | $59,265 |
Family Income by Number of Earners in Girard
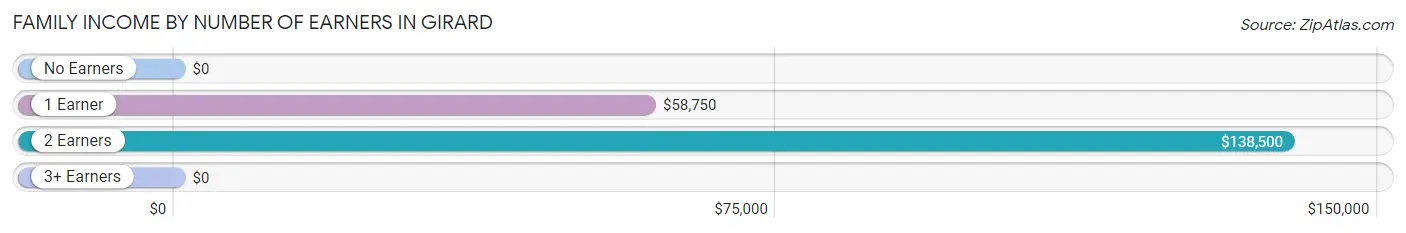
| Number of Earners | # Families | Median Income |
| No Earners | 9 (26.5%) | $0 |
| 1 Earner | 15 (44.1%) | $58,750 |
| 2 Earners | 10 (29.4%) | $138,500 |
| 3+ Earners | 0 (0.0%) | $0 |
| Total | 34 (100.0%) | $59,265 |
Household Income in Girard
Household Income Brackets in Girard
With 23 households falling in the category, the $50,000 to $74,999 income range is the most frequent in Girard, accounting for 37.7% of all households.
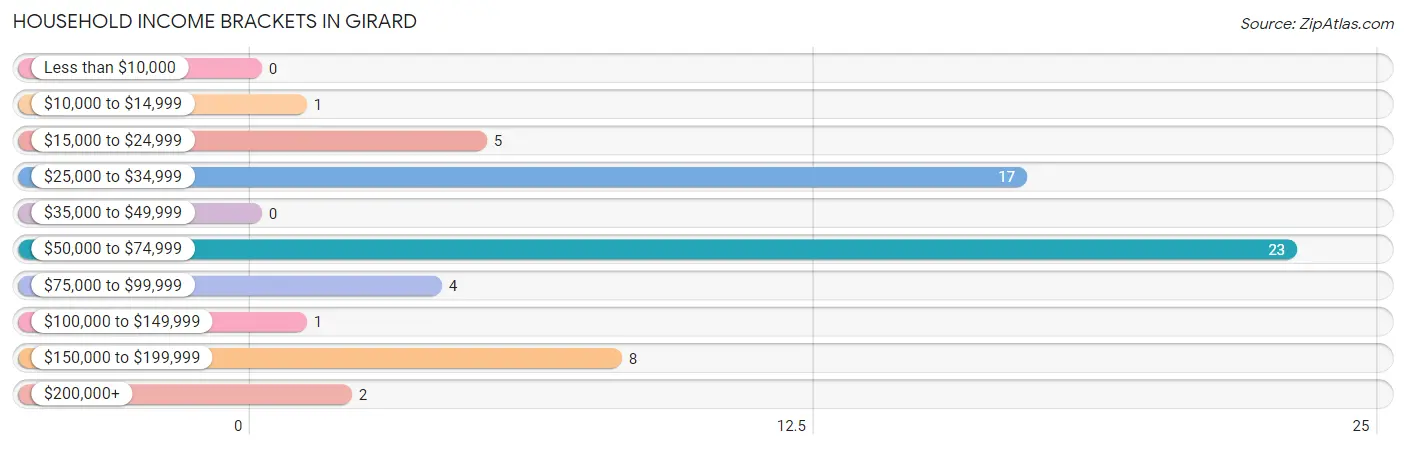
| Income Bracket | # Households | % Households |
| Less than $10,000 | 0 | 0.0% |
| $10,000 to $14,999 | 1 | 1.6% |
| $15,000 to $24,999 | 5 | 8.2% |
| $25,000 to $34,999 | 17 | 27.9% |
| $35,000 to $49,999 | 0 | 0.0% |
| $50,000 to $74,999 | 23 | 37.7% |
| $75,000 to $99,999 | 4 | 6.6% |
| $100,000 to $149,999 | 1 | 1.6% |
| $150,000 to $199,999 | 8 | 13.1% |
| $200,000+ | 2 | 3.3% |
Household Income by Householder Age in Girard
| Income Bracket | # Households | Median Income |
| 15 to 24 Years | 0 (0.0%) | $0 |
| 25 to 44 Years | 12 (19.7%) | $0 |
| 45 to 64 Years | 14 (23.0%) | $0 |
| 65+ Years | 35 (57.4%) | $0 |
| Total | 61 (100.0%) | $58,309 |
Poverty in Girard
Income Below Poverty by Sex and Age in Girard
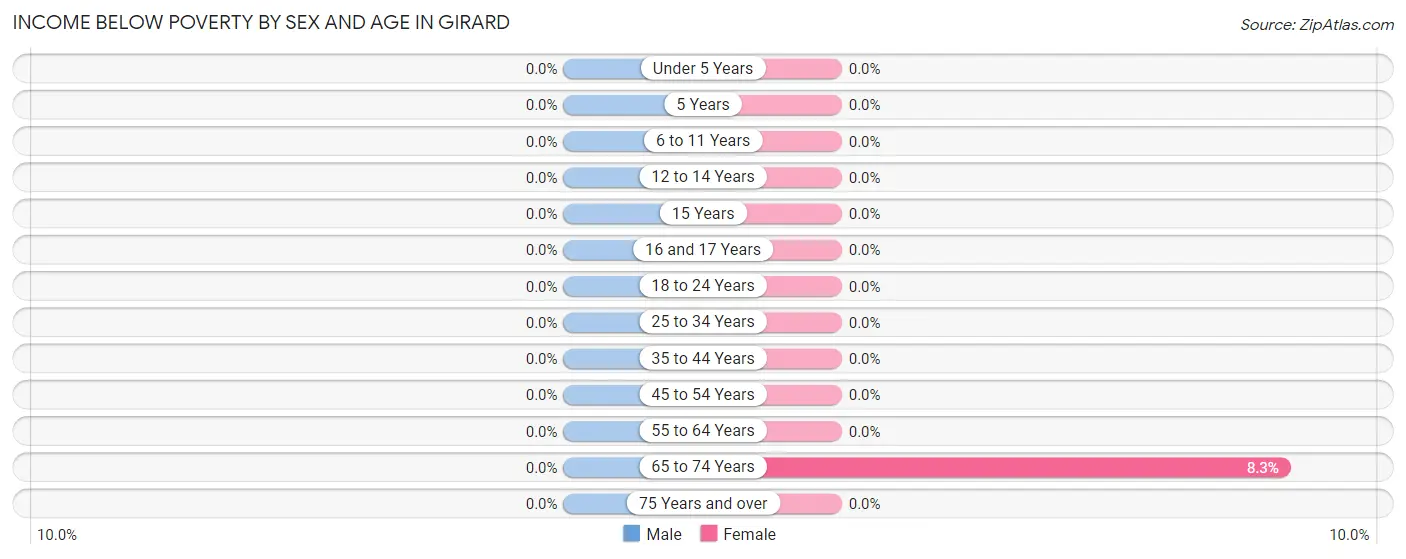
| Age Bracket | Male | Female |
| Under 5 Years | 0 (0.0%) | 0 (0.0%) |
| 5 Years | 0 (0.0%) | 0 (0.0%) |
| 6 to 11 Years | 0 (0.0%) | 0 (0.0%) |
| 12 to 14 Years | 0 (0.0%) | 0 (0.0%) |
| 15 Years | 0 (0.0%) | 0 (0.0%) |
| 16 and 17 Years | 0 (0.0%) | 0 (0.0%) |
| 18 to 24 Years | 0 (0.0%) | 0 (0.0%) |
| 25 to 34 Years | 0 (0.0%) | 0 (0.0%) |
| 35 to 44 Years | 0 (0.0%) | 0 (0.0%) |
| 45 to 54 Years | 0 (0.0%) | 0 (0.0%) |
| 55 to 64 Years | 0 (0.0%) | 0 (0.0%) |
| 65 to 74 Years | 0 (0.0%) | 1 (8.3%) |
| 75 Years and over | 0 (0.0%) | 0 (0.0%) |
| Total | 0 (0.0%) | 1 (0.9%) |
Income Above Poverty by Sex and Age in Girard
According to the poverty statistics in Girard, males aged under 5 years and females aged 5 years are the age groups that are most secure financially, with 100.0% of males and 100.0% of females in these age groups living above the poverty line.
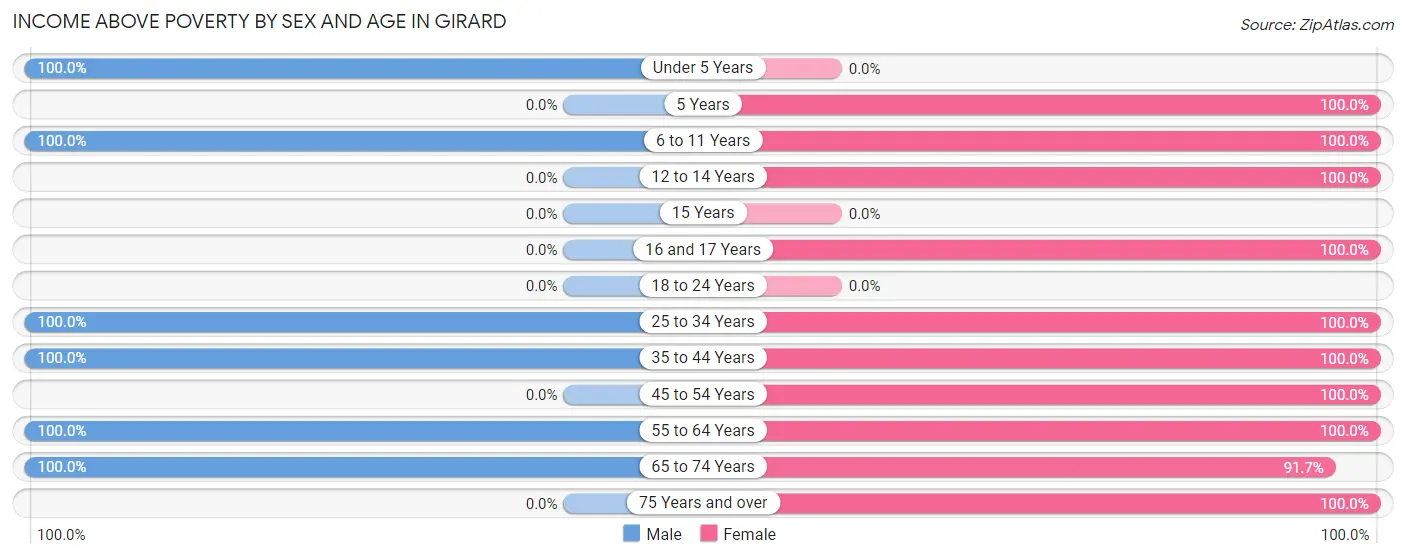
| Age Bracket | Male | Female |
| Under 5 Years | 3 (100.0%) | 0 (0.0%) |
| 5 Years | 0 (0.0%) | 27 (100.0%) |
| 6 to 11 Years | 27 (100.0%) | 6 (100.0%) |
| 12 to 14 Years | 0 (0.0%) | 2 (100.0%) |
| 15 Years | 0 (0.0%) | 0 (0.0%) |
| 16 and 17 Years | 0 (0.0%) | 3 (100.0%) |
| 18 to 24 Years | 0 (0.0%) | 0 (0.0%) |
| 25 to 34 Years | 6 (100.0%) | 15 (100.0%) |
| 35 to 44 Years | 32 (100.0%) | 16 (100.0%) |
| 45 to 54 Years | 0 (0.0%) | 1 (100.0%) |
| 55 to 64 Years | 6 (100.0%) | 12 (100.0%) |
| 65 to 74 Years | 15 (100.0%) | 11 (91.7%) |
| 75 Years and over | 0 (0.0%) | 19 (100.0%) |
| Total | 89 (100.0%) | 112 (99.1%) |
Income Below Poverty Among Married-Couple Families in Girard
| Children | Above Poverty | Below Poverty |
| No Children | 12 (100.0%) | 0 (0.0%) |
| 1 or 2 Children | 12 (100.0%) | 0 (0.0%) |
| 3 or 4 Children | 0 (0.0%) | 0 (0.0%) |
| 5 or more Children | 0 (0.0%) | 0 (0.0%) |
| Total | 24 (100.0%) | 0 (0.0%) |
Income Below Poverty Among Single-Parent Households in Girard
| Children | Single Father | Single Mother |
| No Children | 0 (0.0%) | 0 (0.0%) |
| 1 or 2 Children | 0 (0.0%) | 0 (0.0%) |
| 3 or 4 Children | 0 (0.0%) | 0 (0.0%) |
| 5 or more Children | 0 (0.0%) | 0 (0.0%) |
| Total | 0 (0.0%) | 0 (0.0%) |
Income Below Poverty Among Married-Couple vs Single-Parent Households in Girard
| Children | Married-Couple Families | Single-Parent Households |
| No Children | 0 (0.0%) | 0 (0.0%) |
| 1 or 2 Children | 0 (0.0%) | 0 (0.0%) |
| 3 or 4 Children | 0 (0.0%) | 0 (0.0%) |
| 5 or more Children | 0 (0.0%) | 0 (0.0%) |
| Total | 0 (0.0%) | 0 (0.0%) |
Race in Girard
The most populous races in Girard are White / Caucasian (116 | 57.4%), Black / African American (80 | 39.6%), and Two or more Races (6 | 3.0%).
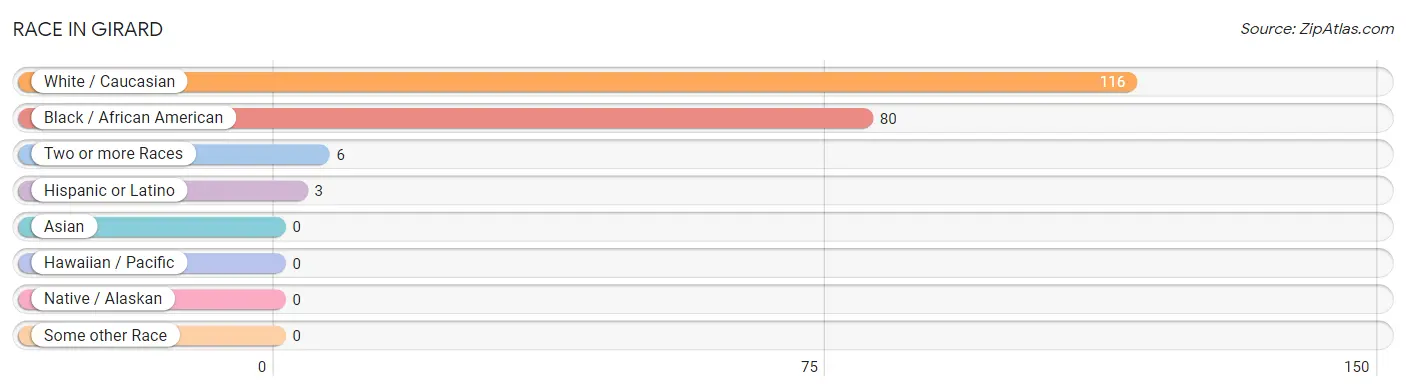
| Race | # Population | % Population |
| Asian | 0 | 0.0% |
| Black / African American | 80 | 39.6% |
| Hawaiian / Pacific | 0 | 0.0% |
| Hispanic or Latino | 3 | 1.5% |
| Native / Alaskan | 0 | 0.0% |
| White / Caucasian | 116 | 57.4% |
| Two or more Races | 6 | 3.0% |
| Some other Race | 0 | 0.0% |
| Total | 202 | 100.0% |
Ancestry in Girard
The most populous ancestries reported in Girard are American (24 | 11.9%), Irish (18 | 8.9%), French (7 | 3.5%), English (6 | 3.0%), and German (6 | 3.0%), together accounting for 30.2% of all Girard residents.
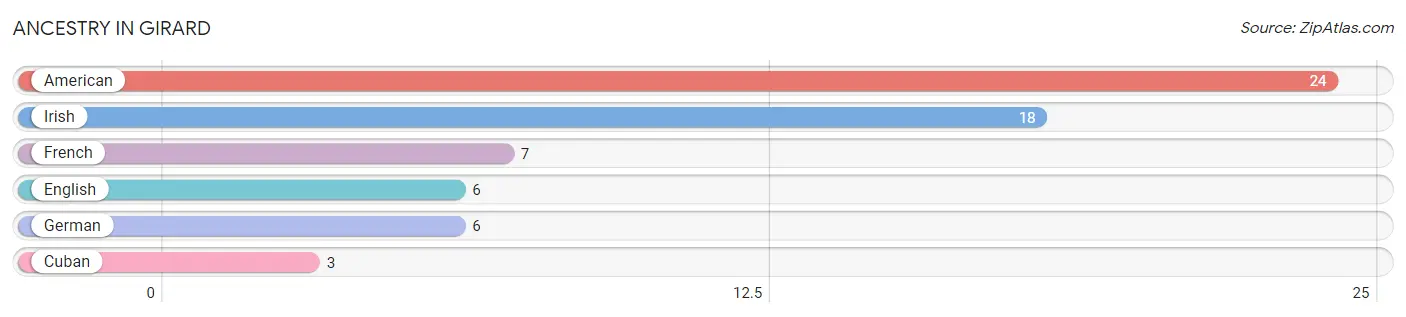
| Ancestry | # Population | % Population |
| American | 24 | 11.9% |
| Cuban | 3 | 1.5% |
| English | 6 | 3.0% |
| French | 7 | 3.5% |
| German | 6 | 3.0% |
| Irish | 18 | 8.9% | View All 6 Rows |
Immigrants in Girard
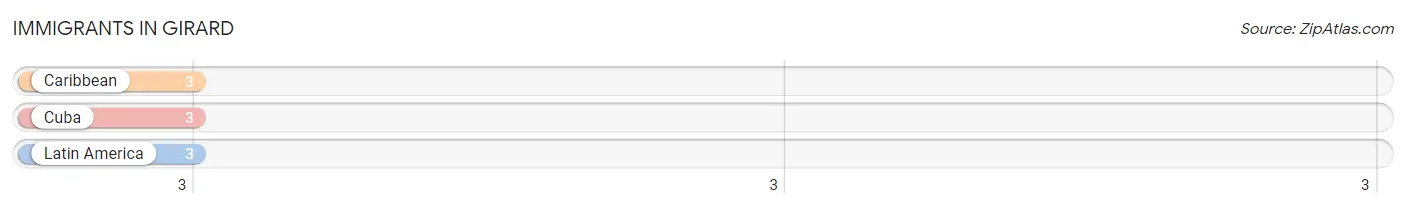
The most numerous immigrant groups reported in Girard came from Caribbean (3 | 1.5%), Cuba (3 | 1.5%), and Latin America (3 | 1.5%), together accounting for 4.5% of all Girard residents.
| Immigration Origin | # Population | % Population |
| Caribbean | 3 | 1.5% |
| Cuba | 3 | 1.5% |
| Latin America | 3 | 1.5% | View All 3 Rows |
Sex and Age in Girard
Sex and Age in Girard
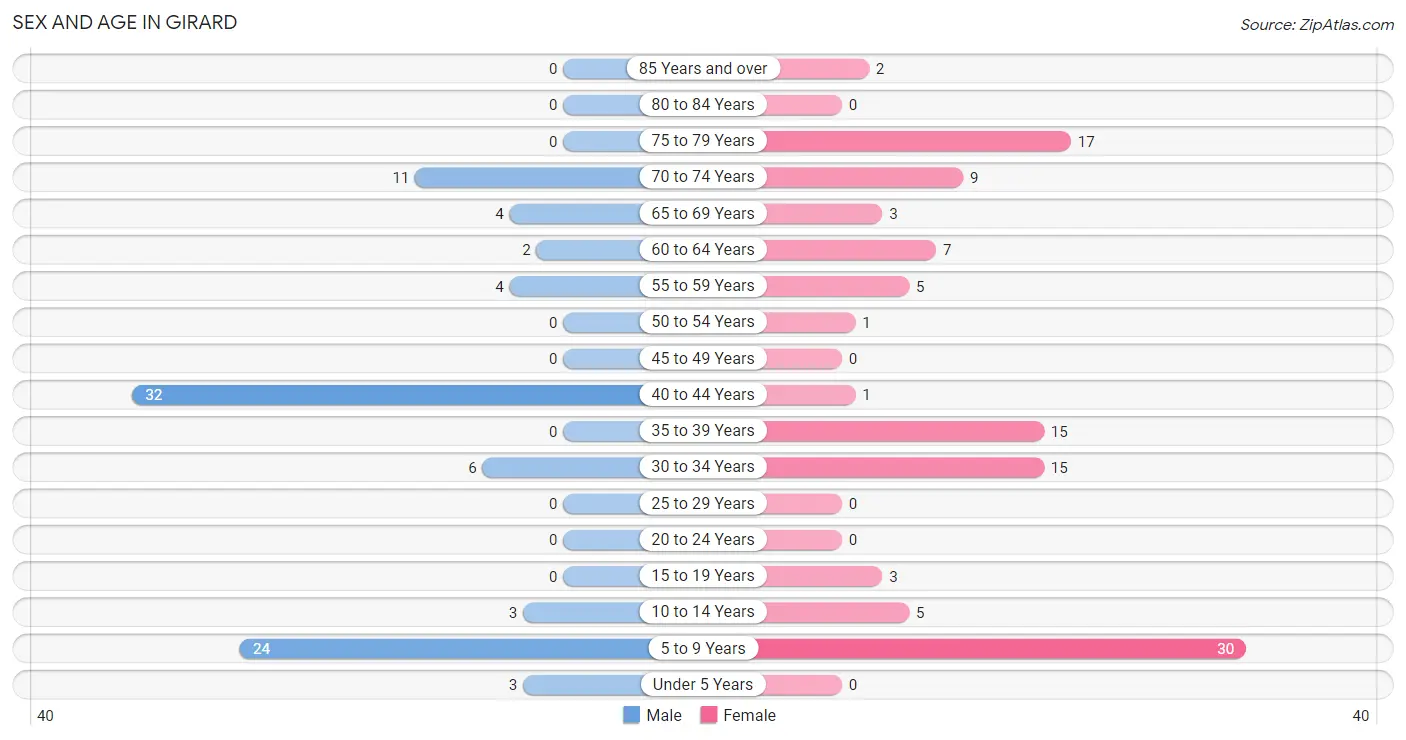
The most populous age groups in Girard are 40 to 44 Years (32 | 36.0%) for men and 5 to 9 Years (30 | 26.6%) for women.
| Age Bracket | Male | Female |
| Under 5 Years | 3 (3.4%) | 0 (0.0%) |
| 5 to 9 Years | 24 (27.0%) | 30 (26.6%) |
| 10 to 14 Years | 3 (3.4%) | 5 (4.4%) |
| 15 to 19 Years | 0 (0.0%) | 3 (2.6%) |
| 20 to 24 Years | 0 (0.0%) | 0 (0.0%) |
| 25 to 29 Years | 0 (0.0%) | 0 (0.0%) |
| 30 to 34 Years | 6 (6.7%) | 15 (13.3%) |
| 35 to 39 Years | 0 (0.0%) | 15 (13.3%) |
| 40 to 44 Years | 32 (36.0%) | 1 (0.9%) |
| 45 to 49 Years | 0 (0.0%) | 0 (0.0%) |
| 50 to 54 Years | 0 (0.0%) | 1 (0.9%) |
| 55 to 59 Years | 4 (4.5%) | 5 (4.4%) |
| 60 to 64 Years | 2 (2.2%) | 7 (6.2%) |
| 65 to 69 Years | 4 (4.5%) | 3 (2.6%) |
| 70 to 74 Years | 11 (12.4%) | 9 (8.0%) |
| 75 to 79 Years | 0 (0.0%) | 17 (15.0%) |
| 80 to 84 Years | 0 (0.0%) | 0 (0.0%) |
| 85 Years and over | 0 (0.0%) | 2 (1.8%) |
| Total | 89 (100.0%) | 113 (100.0%) |
Families and Households in Girard
Median Family Size in Girard
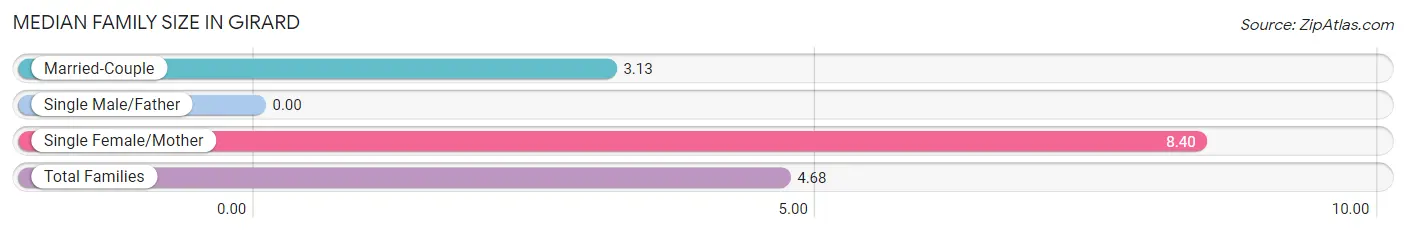
| Family Type | # Families | Family Size |
| Married-Couple | 24 (70.6%) | 3.13 |
| Single Male/Father | 0 (0.0%) | - |
| Single Female/Mother | 10 (29.4%) | 8.40 |
| Total Families | 34 (100.0%) | 4.68 |
Median Household Size in Girard
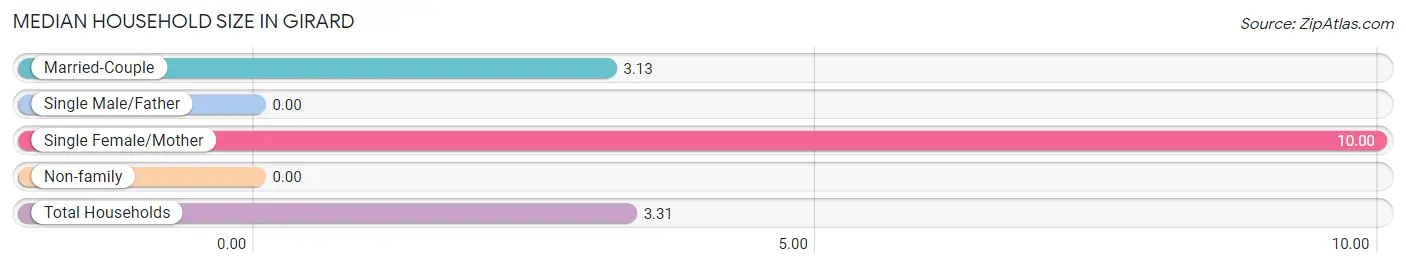
| Household Type | # Households | Household Size |
| Married-Couple | 24 (39.3%) | 3.13 |
| Single Male/Father | 0 (0.0%) | - |
| Single Female/Mother | 10 (16.4%) | 10.00 |
| Non-family | 27 (44.3%) | - |
| Total Households | 61 (100.0%) | 3.31 |
Household Size by Marriage Status in Girard
Out of a total of 61 households in Girard, 34 (55.7%) are family households, while 27 (44.3%) are nonfamily households. The most numerous type of family households are 2-person households, comprising 15, and the most common type of nonfamily households are 1-person households, comprising 27.
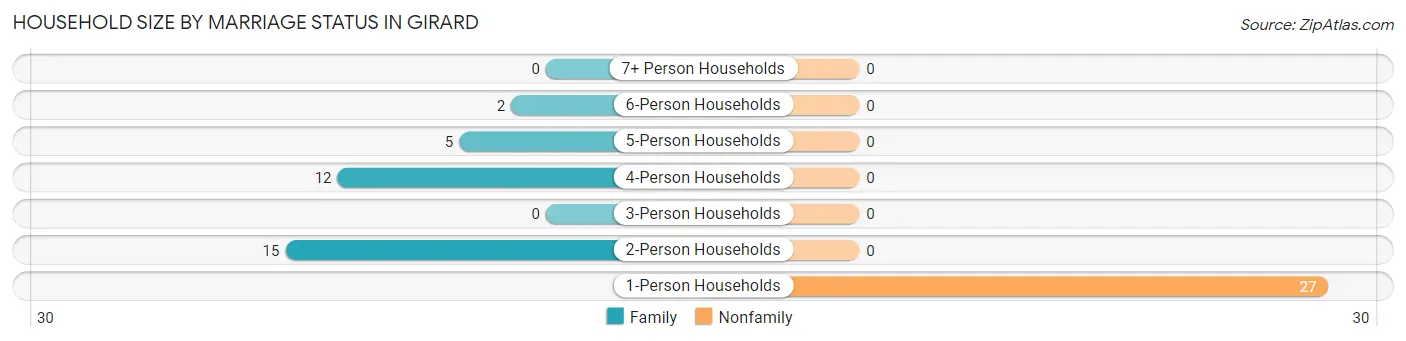
| Household Size | Family Households | Nonfamily Households |
| 1-Person Households | - | 27 (44.3%) |
| 2-Person Households | 15 (24.6%) | 0 (0.0%) |
| 3-Person Households | 0 (0.0%) | 0 (0.0%) |
| 4-Person Households | 12 (19.7%) | 0 (0.0%) |
| 5-Person Households | 5 (8.2%) | 0 (0.0%) |
| 6-Person Households | 2 (3.3%) | 0 (0.0%) |
| 7+ Person Households | 0 (0.0%) | 0 (0.0%) |
| Total | 34 (55.7%) | 27 (44.3%) |
Female Fertility in Girard
Fertility by Age in Girard
| Age Bracket | Women with Births | Births / 1,000 Women |
| 15 to 19 years | 0 (0.0%) | 0.0 |
| 20 to 34 years | 0 (0.0%) | 0.0 |
| 35 to 50 years | 0 (0.0%) | 0.0 |
| Total | 0 (0.0%) | 0.0 |
Fertility by Age by Marriage Status in Girard
| Age Bracket | Married | Unmarried |
| 15 to 19 years | 0 (0.0%) | 0 (0.0%) |
| 20 to 34 years | 0 (0.0%) | 0 (0.0%) |
| 35 to 50 years | 0 (0.0%) | 0 (0.0%) |
| Total | 0 (0.0%) | 0 (0.0%) |
Fertility by Education in Girard
| Educational Attainment | Women with Births | Births / 1,000 Women |
| Less than High School | 0 (0.0%) | 0.0 |
| High School Diploma | 0 (0.0%) | 0.0 |
| College or Associate's Degree | 0 (0.0%) | 0.0 |
| Bachelor's Degree | 0 (0.0%) | 0.0 |
| Graduate Degree | 0 (0.0%) | 0.0 |
| Total | 0 (0.0%) | 0.0 |
Fertility by Education by Marriage Status in Girard
| Educational Attainment | Married | Unmarried |
| Less than High School | 0 (0.0%) | 0 (0.0%) |
| High School Diploma | 0 (0.0%) | 0 (0.0%) |
| College or Associate's Degree | 0 (0.0%) | 0 (0.0%) |
| Bachelor's Degree | 0 (0.0%) | 0 (0.0%) |
| Graduate Degree | 0 (0.0%) | 0 (0.0%) |
| Total | 0 (0.0%) | 0 (0.0%) |
Employment Characteristics in Girard
Employment by Class of Employer in Girard
Among the 46 employed individuals in Girard, private company employees (43 | 93.5%), local government employees (2 | 4.3%), and not-for-profit organizations (1 | 2.2%) make up the most common classes of employment.
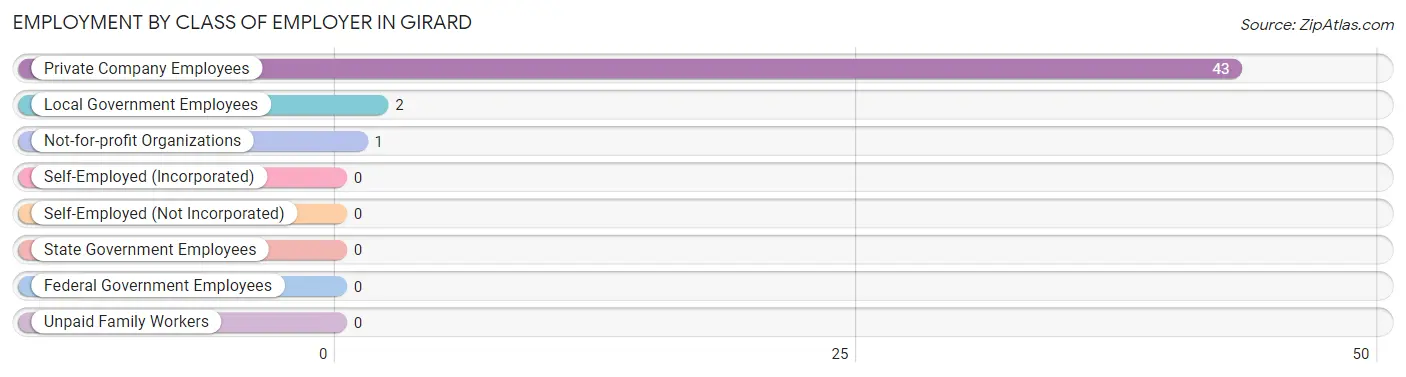
| Employer Class | # Employees | % Employees |
| Private Company Employees | 43 | 93.5% |
| Self-Employed (Incorporated) | 0 | 0.0% |
| Self-Employed (Not Incorporated) | 0 | 0.0% |
| Not-for-profit Organizations | 1 | 2.2% |
| Local Government Employees | 2 | 4.3% |
| State Government Employees | 0 | 0.0% |
| Federal Government Employees | 0 | 0.0% |
| Unpaid Family Workers | 0 | 0.0% |
| Total | 46 | 100.0% |
Employment Status by Age in Girard
According to the labor force statistics for Girard, out of the total population over 16 years of age (137), 34.3% or 47 individuals are in the labor force, with 2.1% or 1 of them unemployed. The age group with the highest labor force participation rate is 45 to 54 years, with 100.0% or 1 individuals in the labor force. Within the labor force, the 65 to 74 years age range has the highest percentage of unemployed individuals, with 33.3% or 1 of them being unemployed.
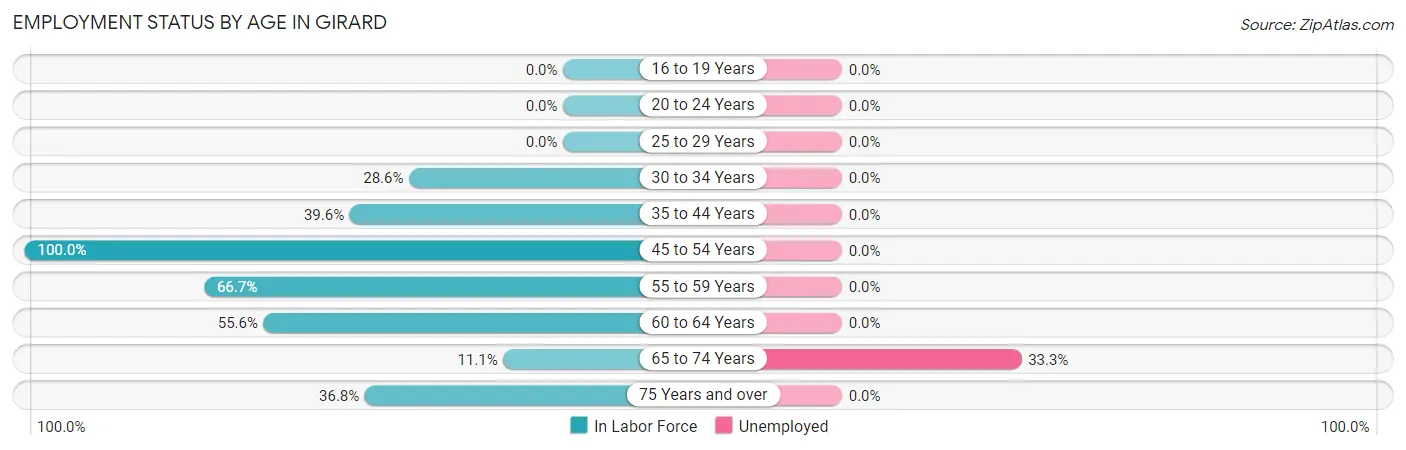
| Age Bracket | In Labor Force | Unemployed |
| 16 to 19 Years | 0 (0.0%) | 0 (0.0%) |
| 20 to 24 Years | 0 (0.0%) | 0 (0.0%) |
| 25 to 29 Years | 0 (0.0%) | 0 (0.0%) |
| 30 to 34 Years | 6 (28.6%) | 0 (0.0%) |
| 35 to 44 Years | 19 (39.6%) | 0 (0.0%) |
| 45 to 54 Years | 1 (100.0%) | 0 (0.0%) |
| 55 to 59 Years | 6 (66.7%) | 0 (0.0%) |
| 60 to 64 Years | 5 (55.6%) | 0 (0.0%) |
| 65 to 74 Years | 3 (11.1%) | 1 (33.3%) |
| 75 Years and over | 7 (36.8%) | 0 (0.0%) |
| Total | 47 (34.3%) | 1 (2.1%) |
Employment Status by Educational Attainment in Girard
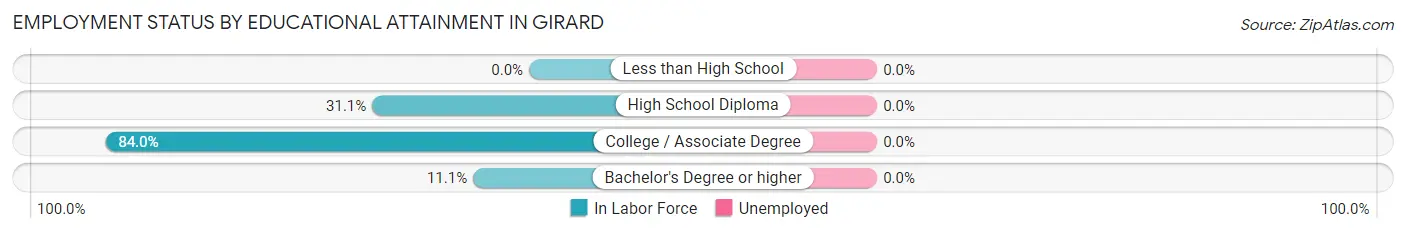
| Educational Attainment | In Labor Force | Unemployed |
| Less than High School | 0 (0.0%) | 0 (0.0%) |
| High School Diploma | 14 (31.1%) | 0 (0.0%) |
| College / Associate Degree | 21 (84.0%) | 0 (0.0%) |
| Bachelor's Degree or higher | 2 (11.1%) | 0 (0.0%) |
| Total | 37 (42.0%) | 0 (0.0%) |
Employment Occupations by Sex in Girard
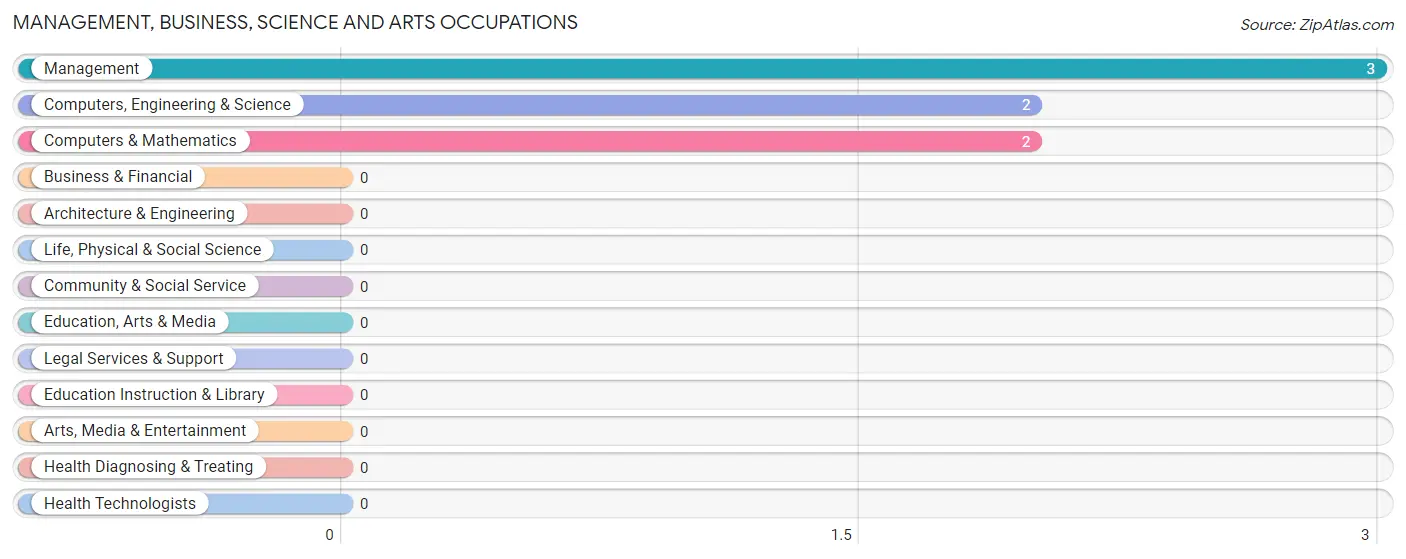
Management, Business, Science and Arts Occupations
The most common Management, Business, Science and Arts occupations in Girard are Management (3 | 6.5%), Computers, Engineering & Science (2 | 4.3%), and Computers & Mathematics (2 | 4.3%).
Management, Business, Science and Arts Occupations by Sex
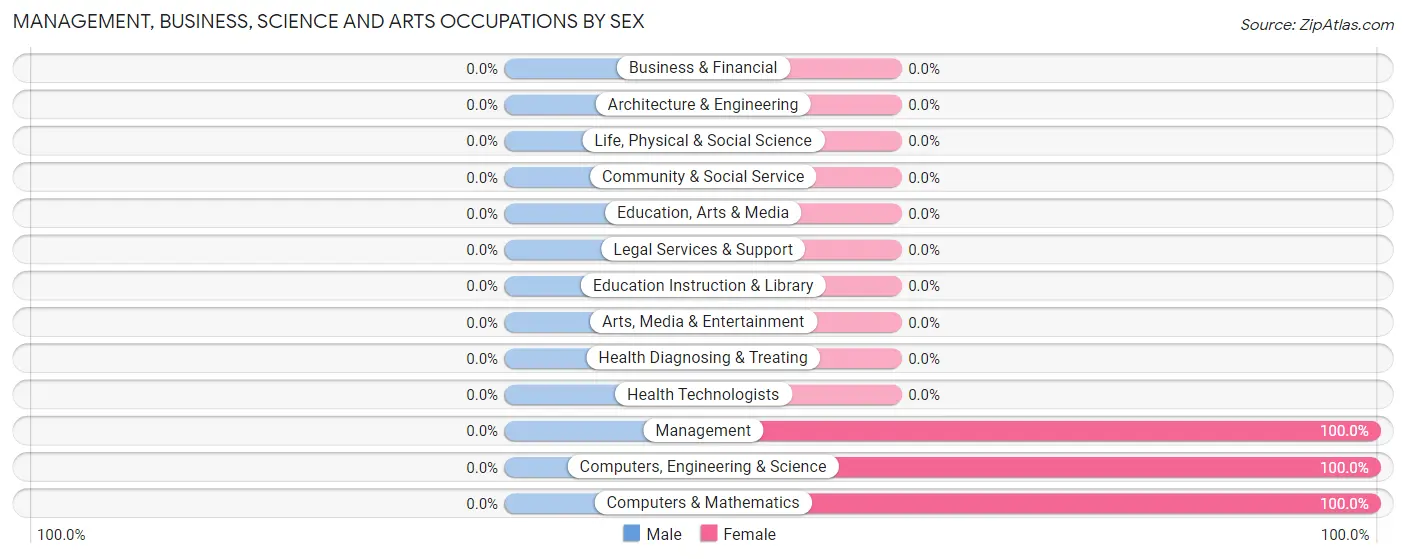
| Occupation | Male | Female |
| Management | 0 (0.0%) | 3 (100.0%) |
| Business & Financial | 0 (0.0%) | 0 (0.0%) |
| Computers, Engineering & Science | 0 (0.0%) | 2 (100.0%) |
| Computers & Mathematics | 0 (0.0%) | 2 (100.0%) |
| Architecture & Engineering | 0 (0.0%) | 0 (0.0%) |
| Life, Physical & Social Science | 0 (0.0%) | 0 (0.0%) |
| Community & Social Service | 0 (0.0%) | 0 (0.0%) |
| Education, Arts & Media | 0 (0.0%) | 0 (0.0%) |
| Legal Services & Support | 0 (0.0%) | 0 (0.0%) |
| Education Instruction & Library | 0 (0.0%) | 0 (0.0%) |
| Arts, Media & Entertainment | 0 (0.0%) | 0 (0.0%) |
| Health Diagnosing & Treating | 0 (0.0%) | 0 (0.0%) |
| Health Technologists | 0 (0.0%) | 0 (0.0%) |
| Total (Category) | 0 (0.0%) | 5 (100.0%) |
| Total (Overall) | 13 (28.3%) | 33 (71.7%) |
Services Occupations
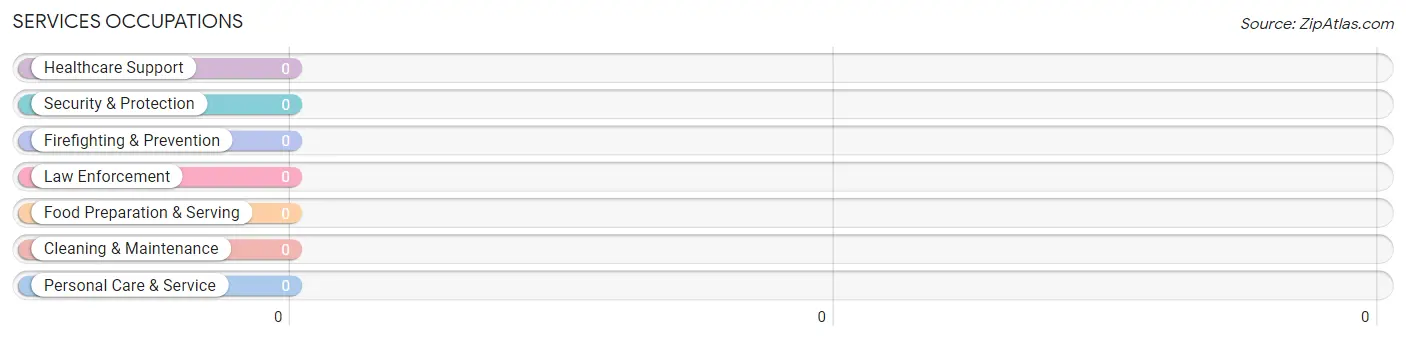
Services Occupations by Sex
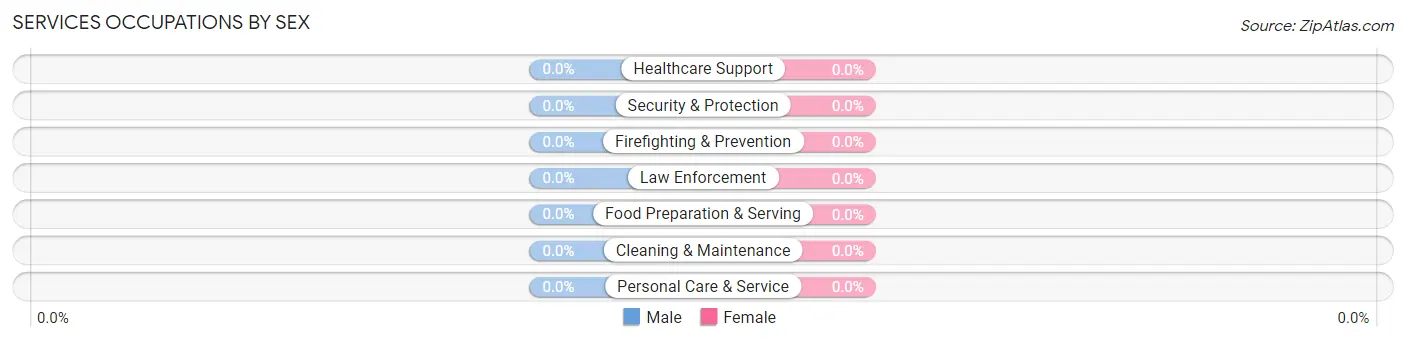
| Occupation | Male | Female |
| Healthcare Support | 0 (0.0%) | 0 (0.0%) |
| Security & Protection | 0 (0.0%) | 0 (0.0%) |
| Firefighting & Prevention | 0 (0.0%) | 0 (0.0%) |
| Law Enforcement | 0 (0.0%) | 0 (0.0%) |
| Food Preparation & Serving | 0 (0.0%) | 0 (0.0%) |
| Cleaning & Maintenance | 0 (0.0%) | 0 (0.0%) |
| Personal Care & Service | 0 (0.0%) | 0 (0.0%) |
| Total (Category) | 0 (0.0%) | 0 (0.0%) |
| Total (Overall) | 13 (28.3%) | 33 (71.7%) |
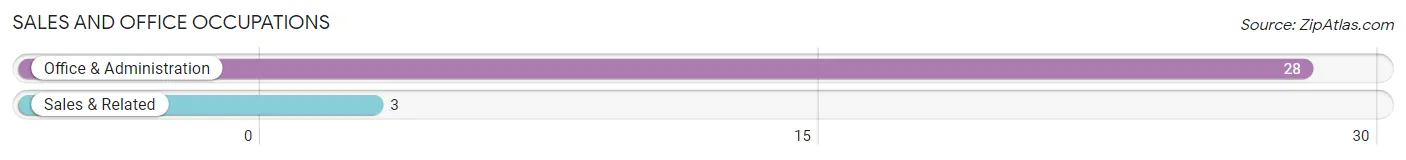
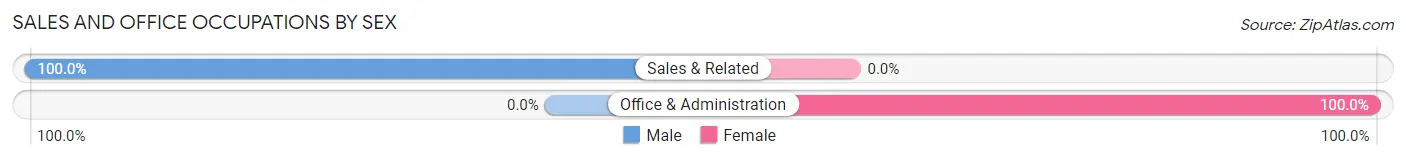
Sales and Office Occupations
The most common Sales and Office occupations in Girard are Office & Administration (28 | 60.9%), and Sales & Related (3 | 6.5%).
Sales and Office Occupations by Sex
| Occupation | Male | Female |
| Sales & Related | 3 (100.0%) | 0 (0.0%) |
| Office & Administration | 0 (0.0%) | 28 (100.0%) |
| Total (Category) | 3 (9.7%) | 28 (90.3%) |
| Total (Overall) | 13 (28.3%) | 33 (71.7%) |
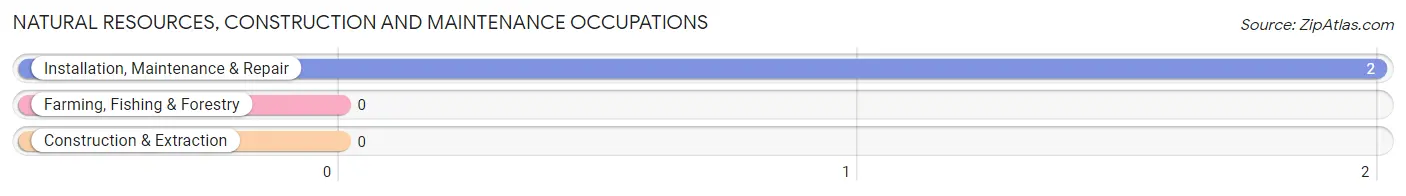
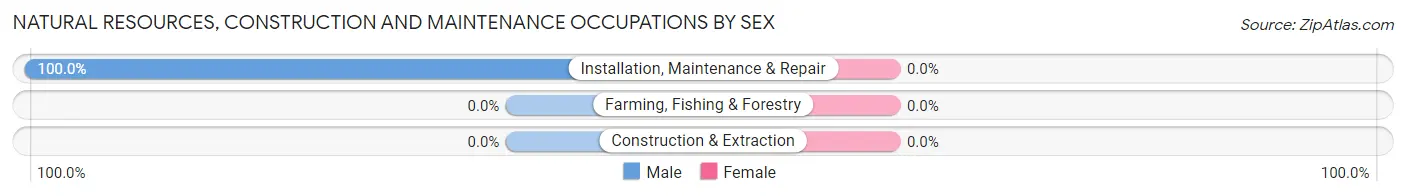
Natural Resources, Construction and Maintenance Occupations
The most common Natural Resources, Construction and Maintenance occupations in Girard are , and Installation, Maintenance & Repair (2 | 4.3%).
Natural Resources, Construction and Maintenance Occupations by Sex
| Occupation | Male | Female |
| Farming, Fishing & Forestry | 0 (0.0%) | 0 (0.0%) |
| Construction & Extraction | 0 (0.0%) | 0 (0.0%) |
| Installation, Maintenance & Repair | 2 (100.0%) | 0 (0.0%) |
| Total (Category) | 2 (100.0%) | 0 (0.0%) |
| Total (Overall) | 13 (28.3%) | 33 (71.7%) |
Production, Transportation and Moving Occupations
The most common Production, Transportation and Moving occupations in Girard are , and Production (8 | 17.4%).
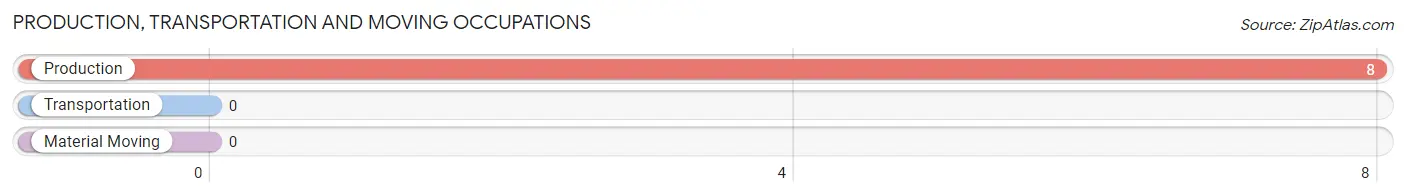
Production, Transportation and Moving Occupations by Sex
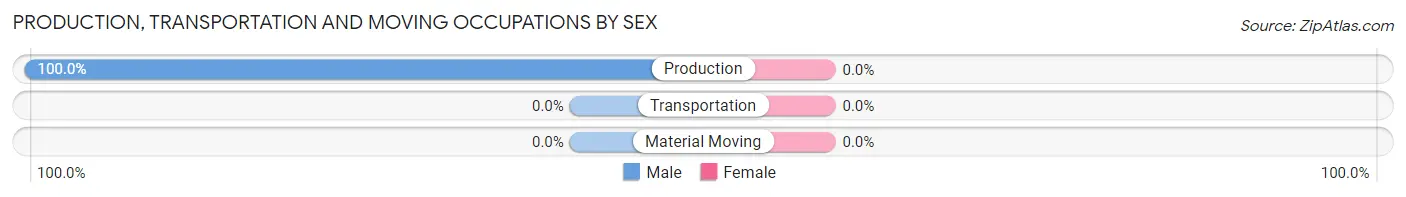
| Occupation | Male | Female |
| Production | 8 (100.0%) | 0 (0.0%) |
| Transportation | 0 (0.0%) | 0 (0.0%) |
| Material Moving | 0 (0.0%) | 0 (0.0%) |
| Total (Category) | 8 (100.0%) | 0 (0.0%) |
| Total (Overall) | 13 (28.3%) | 33 (71.7%) |
Employment Industries by Sex in Girard
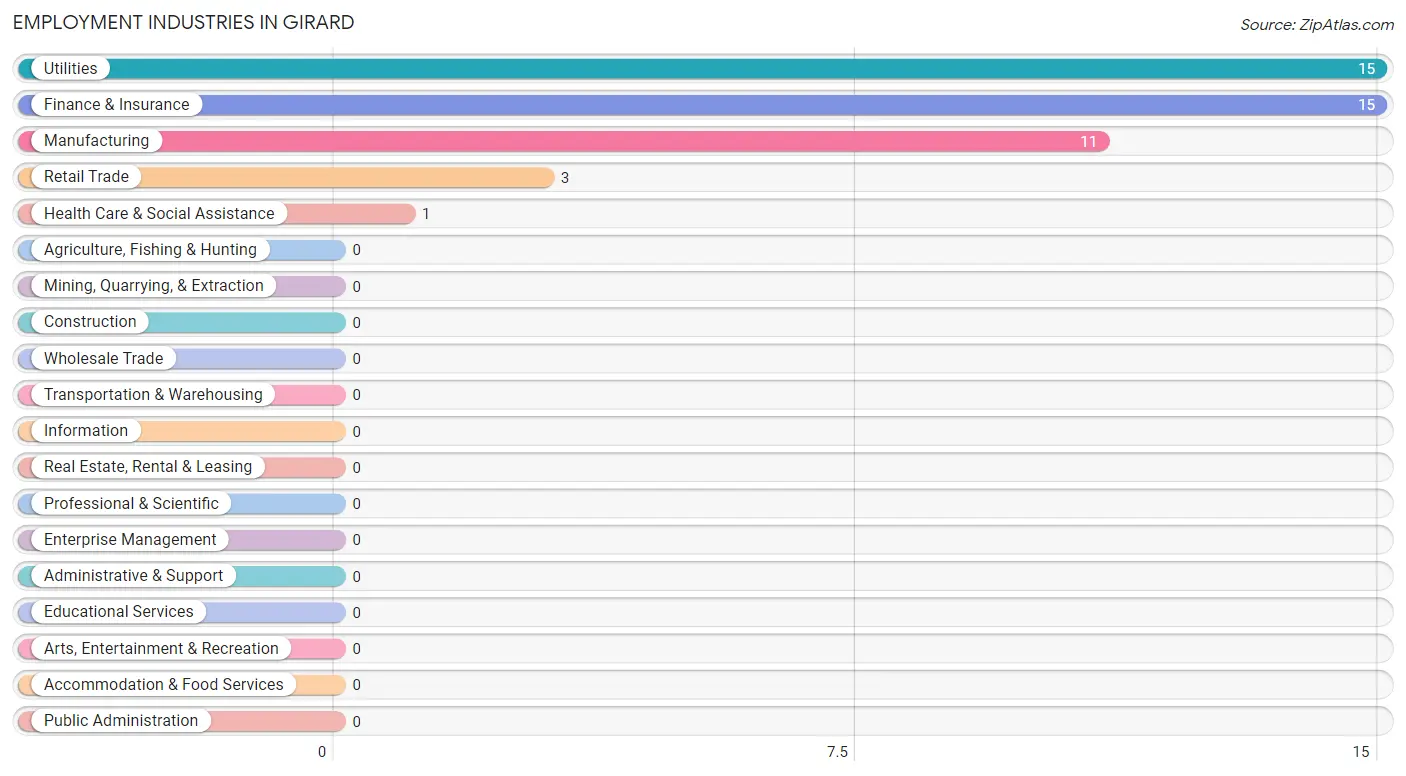
Employment Industries in Girard
The major employment industries in Girard include Utilities (15 | 32.6%), Finance & Insurance (15 | 32.6%), Manufacturing (11 | 23.9%), Retail Trade (3 | 6.5%), and Health Care & Social Assistance (1 | 2.2%).
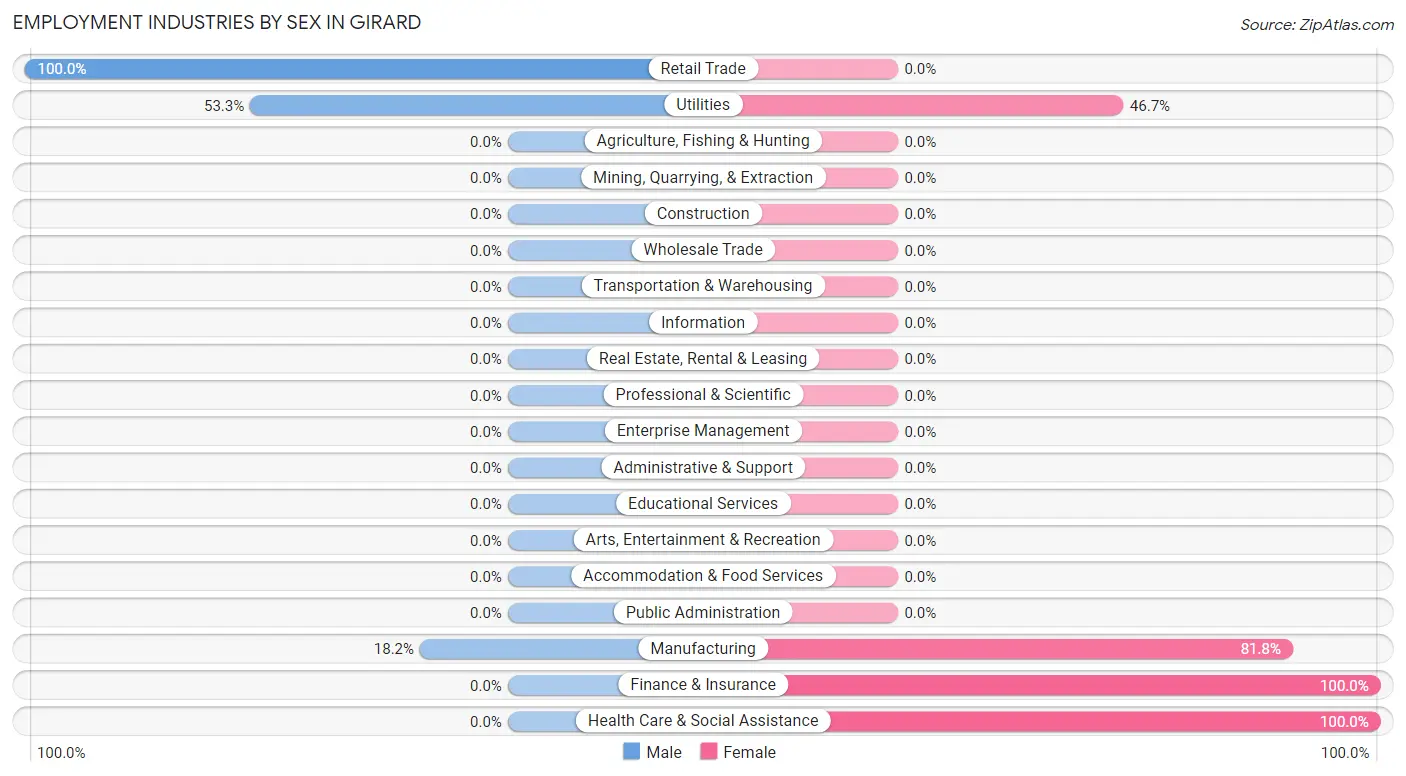
Employment Industries by Sex in Girard
The Girard industries that see more men than women are Retail Trade (100.0%), Utilities (53.3%), and Manufacturing (18.2%), whereas the industries that tend to have a higher number of women are Finance & Insurance (100.0%), Health Care & Social Assistance (100.0%), and Manufacturing (81.8%).
| Industry | Male | Female |
| Agriculture, Fishing & Hunting | 0 (0.0%) | 0 (0.0%) |
| Mining, Quarrying, & Extraction | 0 (0.0%) | 0 (0.0%) |
| Construction | 0 (0.0%) | 0 (0.0%) |
| Manufacturing | 2 (18.2%) | 9 (81.8%) |
| Wholesale Trade | 0 (0.0%) | 0 (0.0%) |
| Retail Trade | 3 (100.0%) | 0 (0.0%) |
| Transportation & Warehousing | 0 (0.0%) | 0 (0.0%) |
| Utilities | 8 (53.3%) | 7 (46.7%) |
| Information | 0 (0.0%) | 0 (0.0%) |
| Finance & Insurance | 0 (0.0%) | 15 (100.0%) |
| Real Estate, Rental & Leasing | 0 (0.0%) | 0 (0.0%) |
| Professional & Scientific | 0 (0.0%) | 0 (0.0%) |
| Enterprise Management | 0 (0.0%) | 0 (0.0%) |
| Administrative & Support | 0 (0.0%) | 0 (0.0%) |
| Educational Services | 0 (0.0%) | 0 (0.0%) |
| Health Care & Social Assistance | 0 (0.0%) | 1 (100.0%) |
| Arts, Entertainment & Recreation | 0 (0.0%) | 0 (0.0%) |
| Accommodation & Food Services | 0 (0.0%) | 0 (0.0%) |
| Public Administration | 0 (0.0%) | 0 (0.0%) |
| Total | 13 (28.3%) | 33 (71.7%) |
Education in Girard
School Enrollment in Girard
The most common levels of schooling among the 84 students in Girard are nursery / preschool (30 | 35.7%), elementary school (27 | 32.1%), and graduate / professional (16 | 19.1%).
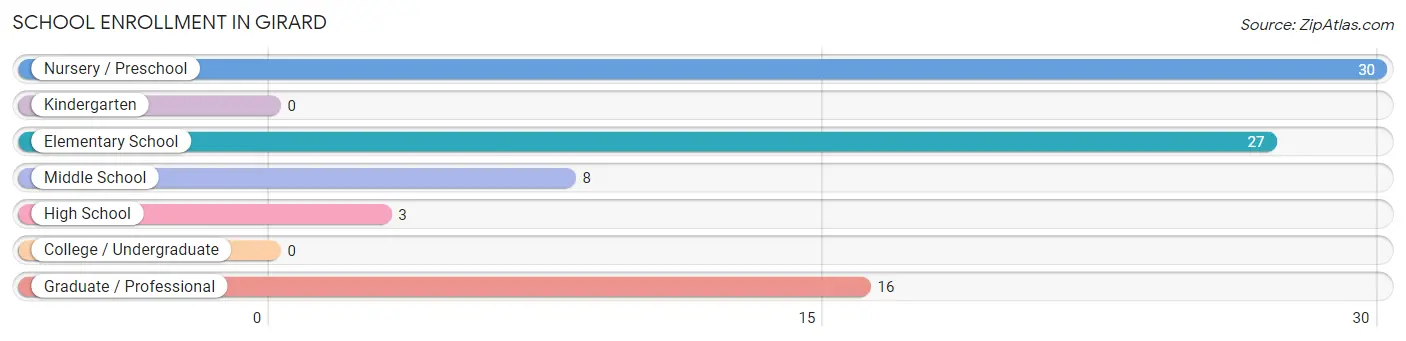
| School Level | # Students | % Students |
| Nursery / Preschool | 30 | 35.7% |
| Kindergarten | 0 | 0.0% |
| Elementary School | 27 | 32.1% |
| Middle School | 8 | 9.5% |
| High School | 3 | 3.6% |
| College / Undergraduate | 0 | 0.0% |
| Graduate / Professional | 16 | 19.1% |
| Total | 84 | 100.0% |
School Enrollment by Age by Funding Source in Girard
Out of a total of 84 students who are enrolled in schools in Girard, 19 (22.6%) attend a private institution, while the remaining 65 (77.4%) are enrolled in public schools. The age group of 15 to 17 year olds has the highest likelihood of being enrolled in private schools, with 3 (100.0% in the age bracket) enrolled. Conversely, the age group of 3 to 4 year olds has the lowest likelihood of being enrolled in a private school, with 3 (100.0% in the age bracket) attending a public institution.
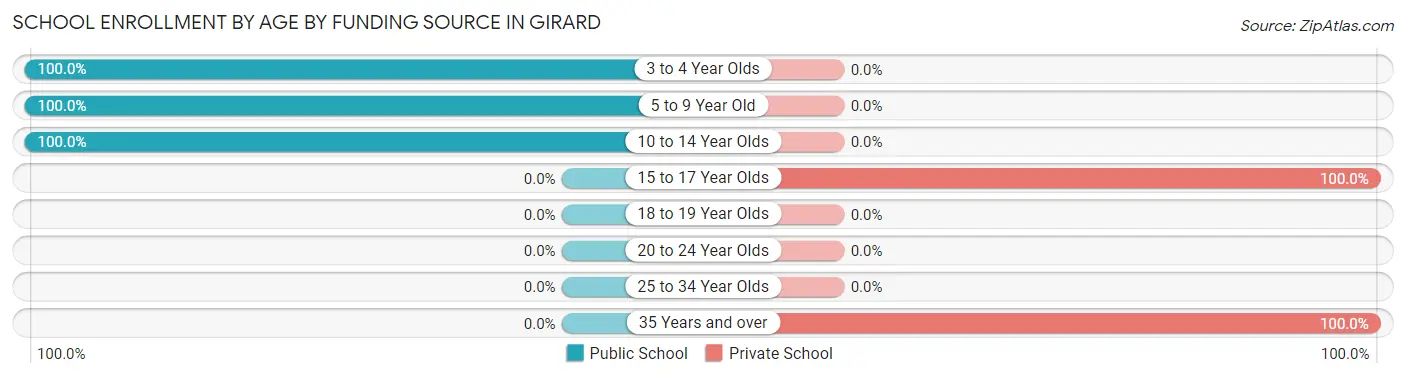
| Age Bracket | Public School | Private School |
| 3 to 4 Year Olds | 3 (100.0%) | 0 (0.0%) |
| 5 to 9 Year Old | 54 (100.0%) | 0 (0.0%) |
| 10 to 14 Year Olds | 8 (100.0%) | 0 (0.0%) |
| 15 to 17 Year Olds | 0 (0.0%) | 3 (100.0%) |
| 18 to 19 Year Olds | 0 (0.0%) | 0 (0.0%) |
| 20 to 24 Year Olds | 0 (0.0%) | 0 (0.0%) |
| 25 to 34 Year Olds | 0 (0.0%) | 0 (0.0%) |
| 35 Years and over | 0 (0.0%) | 16 (100.0%) |
| Total | 65 (77.4%) | 19 (22.6%) |
Educational Attainment by Field of Study in Girard
Business (20 | 76.9%), and education (6 | 23.1%) are the most common fields of study among 26 individuals in Girard who have obtained a bachelor's degree or higher.
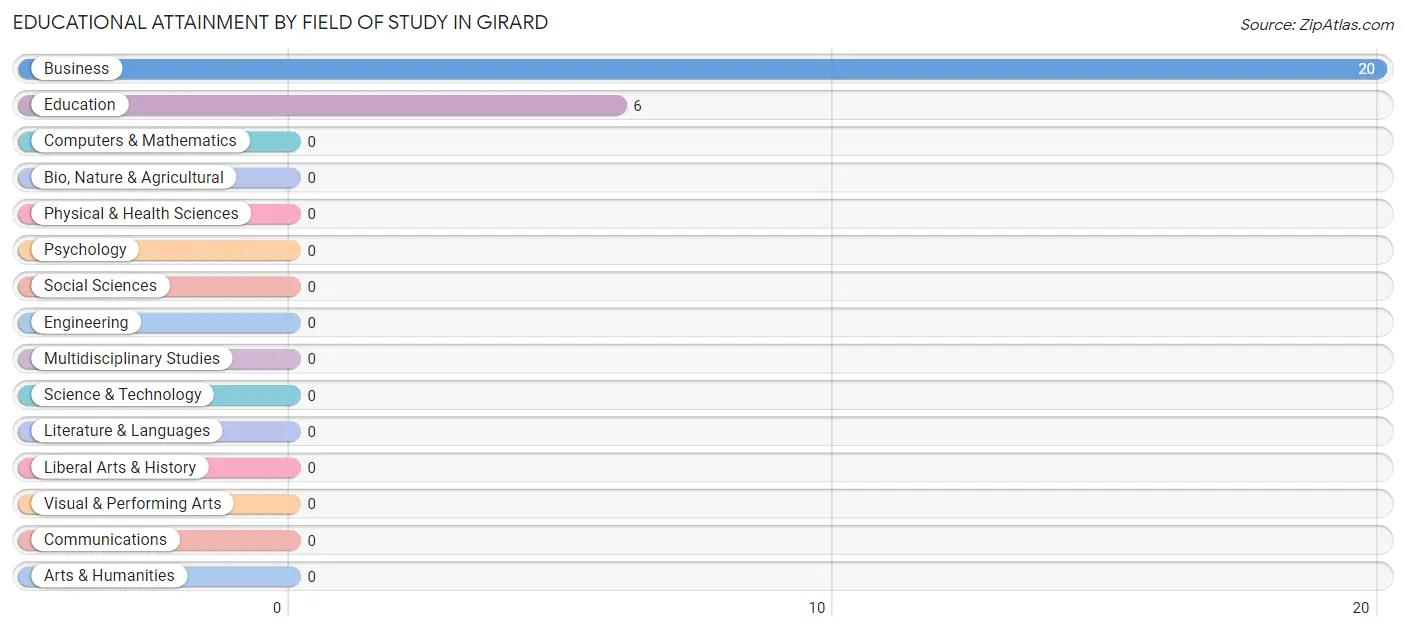
| Field of Study | # Graduates | % Graduates |
| Computers & Mathematics | 0 | 0.0% |
| Bio, Nature & Agricultural | 0 | 0.0% |
| Physical & Health Sciences | 0 | 0.0% |
| Psychology | 0 | 0.0% |
| Social Sciences | 0 | 0.0% |
| Engineering | 0 | 0.0% |
| Multidisciplinary Studies | 0 | 0.0% |
| Science & Technology | 0 | 0.0% |
| Business | 20 | 76.9% |
| Education | 6 | 23.1% |
| Literature & Languages | 0 | 0.0% |
| Liberal Arts & History | 0 | 0.0% |
| Visual & Performing Arts | 0 | 0.0% |
| Communications | 0 | 0.0% |
| Arts & Humanities | 0 | 0.0% |
| Total | 26 | 100.0% |
Transportation & Commute in Girard
Vehicle Availability by Sex in Girard
The most prevalent vehicle ownership categories in Girard are males with 2 vehicles (8, accounting for 61.5%) and females with 2 vehicles (4, making up 24.2%).
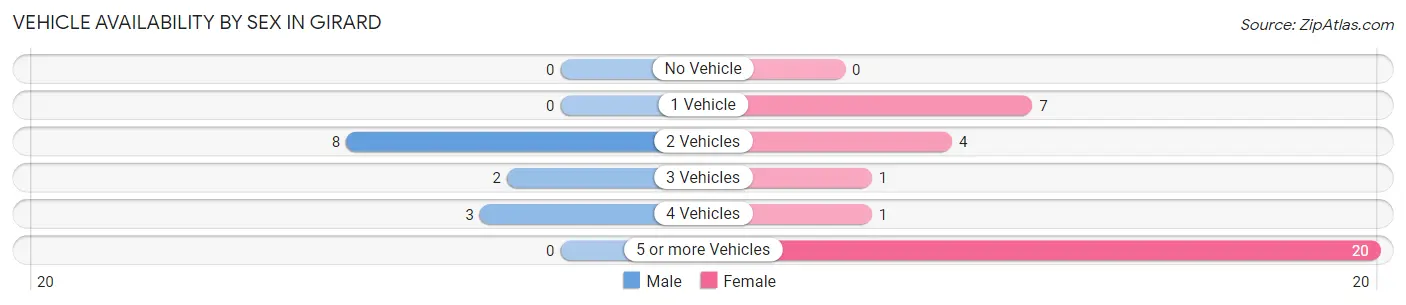
| Vehicles Available | Male | Female |
| No Vehicle | 0 (0.0%) | 0 (0.0%) |
| 1 Vehicle | 0 (0.0%) | 7 (21.2%) |
| 2 Vehicles | 8 (61.5%) | 4 (12.1%) |
| 3 Vehicles | 2 (15.4%) | 1 (3.0%) |
| 4 Vehicles | 3 (23.1%) | 1 (3.0%) |
| 5 or more Vehicles | 0 (0.0%) | 20 (60.6%) |
| Total | 13 (100.0%) | 33 (100.0%) |
Commute Time in Girard
The most frequently occuring commute durations in Girard are 60 to 89 minutes (18 commuters, 39.1%), 20 to 24 minutes (12 commuters, 26.1%), and 30 to 34 minutes (7 commuters, 15.2%).
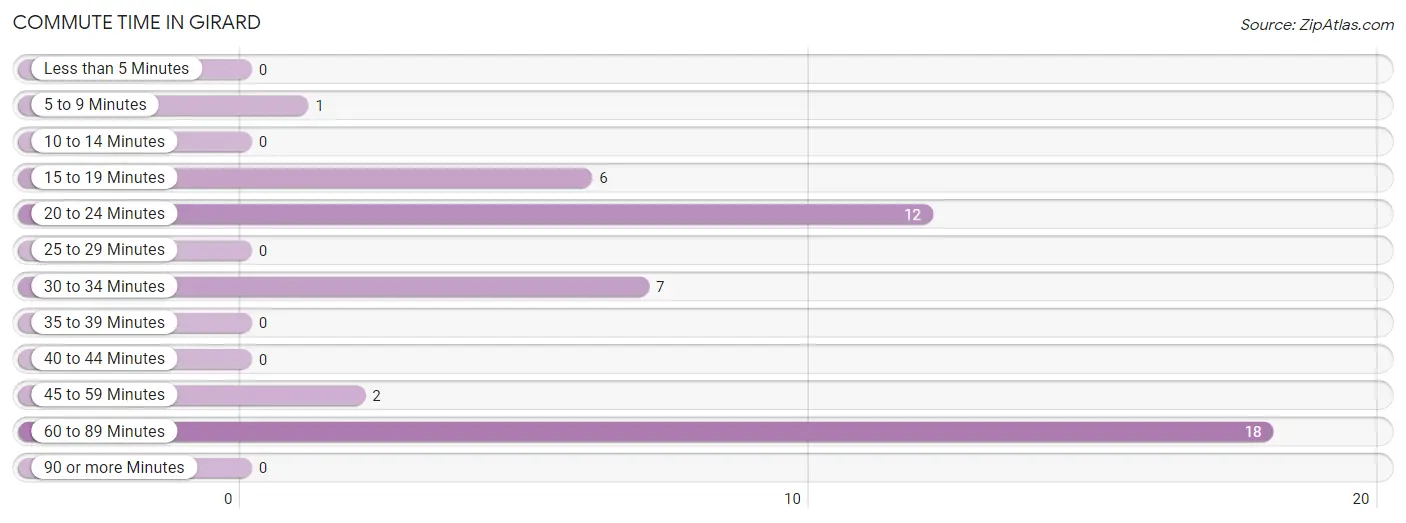
| Commute Time | # Commuters | % Commuters |
| Less than 5 Minutes | 0 | 0.0% |
| 5 to 9 Minutes | 1 | 2.2% |
| 10 to 14 Minutes | 0 | 0.0% |
| 15 to 19 Minutes | 6 | 13.0% |
| 20 to 24 Minutes | 12 | 26.1% |
| 25 to 29 Minutes | 0 | 0.0% |
| 30 to 34 Minutes | 7 | 15.2% |
| 35 to 39 Minutes | 0 | 0.0% |
| 40 to 44 Minutes | 0 | 0.0% |
| 45 to 59 Minutes | 2 | 4.3% |
| 60 to 89 Minutes | 18 | 39.1% |
| 90 or more Minutes | 0 | 0.0% |
Commute Time by Sex in Girard
The most common commute times in Girard are 15 to 19 minutes (6 commuters, 46.2%) for males and 60 to 89 minutes (18 commuters, 54.5%) for females.
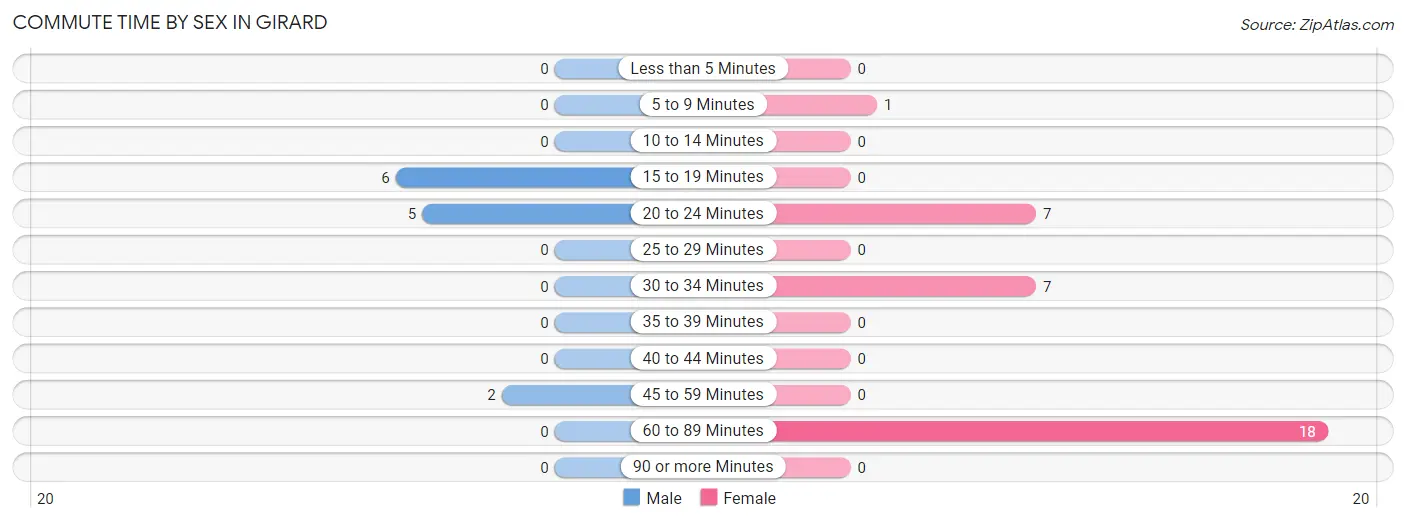
| Commute Time | Male | Female |
| Less than 5 Minutes | 0 (0.0%) | 0 (0.0%) |
| 5 to 9 Minutes | 0 (0.0%) | 1 (3.0%) |
| 10 to 14 Minutes | 0 (0.0%) | 0 (0.0%) |
| 15 to 19 Minutes | 6 (46.2%) | 0 (0.0%) |
| 20 to 24 Minutes | 5 (38.5%) | 7 (21.2%) |
| 25 to 29 Minutes | 0 (0.0%) | 0 (0.0%) |
| 30 to 34 Minutes | 0 (0.0%) | 7 (21.2%) |
| 35 to 39 Minutes | 0 (0.0%) | 0 (0.0%) |
| 40 to 44 Minutes | 0 (0.0%) | 0 (0.0%) |
| 45 to 59 Minutes | 2 (15.4%) | 0 (0.0%) |
| 60 to 89 Minutes | 0 (0.0%) | 18 (54.5%) |
| 90 or more Minutes | 0 (0.0%) | 0 (0.0%) |
Time of Departure to Work by Sex in Girard
The most frequent times of departure to work in Girard are 5:00 AM to 5:29 AM (6, 46.2%) for males and 7:00 AM to 7:29 AM (16, 48.5%) for females.
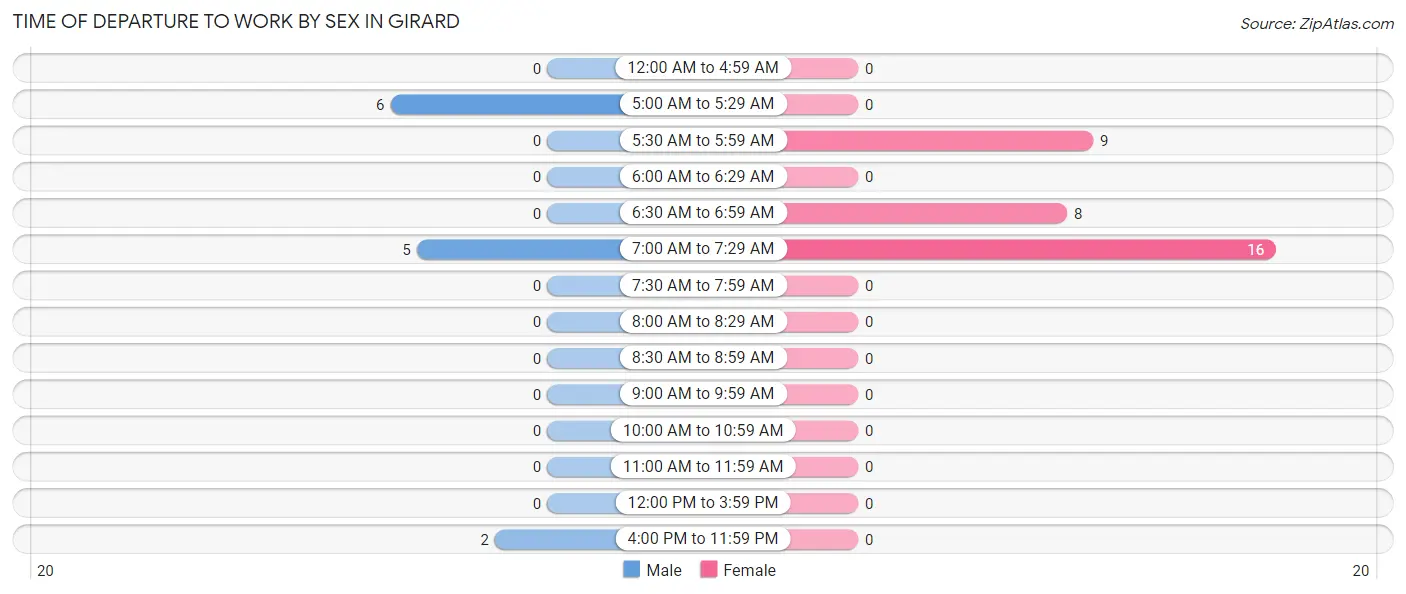
| Time of Departure | Male | Female |
| 12:00 AM to 4:59 AM | 0 (0.0%) | 0 (0.0%) |
| 5:00 AM to 5:29 AM | 6 (46.2%) | 0 (0.0%) |
| 5:30 AM to 5:59 AM | 0 (0.0%) | 9 (27.3%) |
| 6:00 AM to 6:29 AM | 0 (0.0%) | 0 (0.0%) |
| 6:30 AM to 6:59 AM | 0 (0.0%) | 8 (24.2%) |
| 7:00 AM to 7:29 AM | 5 (38.5%) | 16 (48.5%) |
| 7:30 AM to 7:59 AM | 0 (0.0%) | 0 (0.0%) |
| 8:00 AM to 8:29 AM | 0 (0.0%) | 0 (0.0%) |
| 8:30 AM to 8:59 AM | 0 (0.0%) | 0 (0.0%) |
| 9:00 AM to 9:59 AM | 0 (0.0%) | 0 (0.0%) |
| 10:00 AM to 10:59 AM | 0 (0.0%) | 0 (0.0%) |
| 11:00 AM to 11:59 AM | 0 (0.0%) | 0 (0.0%) |
| 12:00 PM to 3:59 PM | 0 (0.0%) | 0 (0.0%) |
| 4:00 PM to 11:59 PM | 2 (15.4%) | 0 (0.0%) |
| Total | 13 (100.0%) | 33 (100.0%) |
Housing Occupancy in Girard
Occupancy by Ownership in Girard
Of the total 61 dwellings in Girard, owner-occupied units account for 56 (91.8%), while renter-occupied units make up 5 (8.2%).
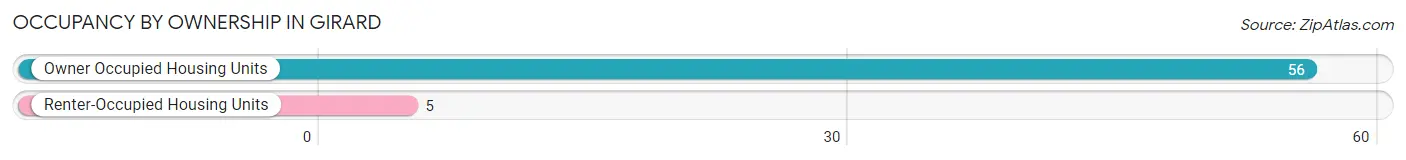
| Occupancy | # Housing Units | % Housing Units |
| Owner Occupied Housing Units | 56 | 91.8% |
| Renter-Occupied Housing Units | 5 | 8.2% |
| Total Occupied Housing Units | 61 | 100.0% |
Occupancy by Household Size in Girard
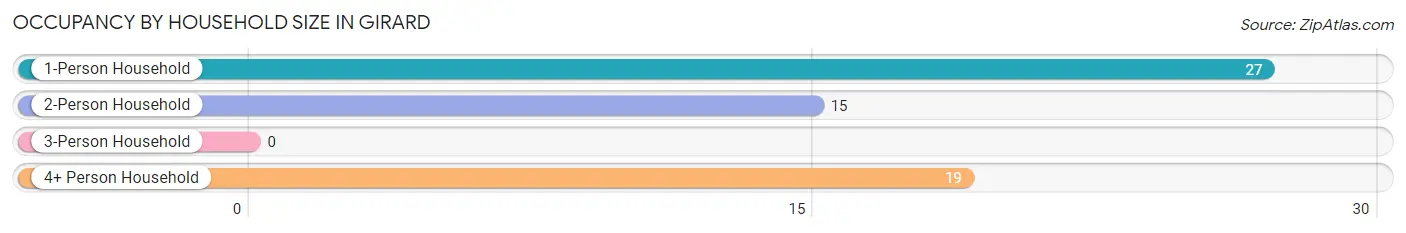
| Household Size | # Housing Units | % Housing Units |
| 1-Person Household | 27 | 44.3% |
| 2-Person Household | 15 | 24.6% |
| 3-Person Household | 0 | 0.0% |
| 4+ Person Household | 19 | 31.1% |
| Total Housing Units | 61 | 100.0% |
Occupancy by Ownership by Household Size in Girard
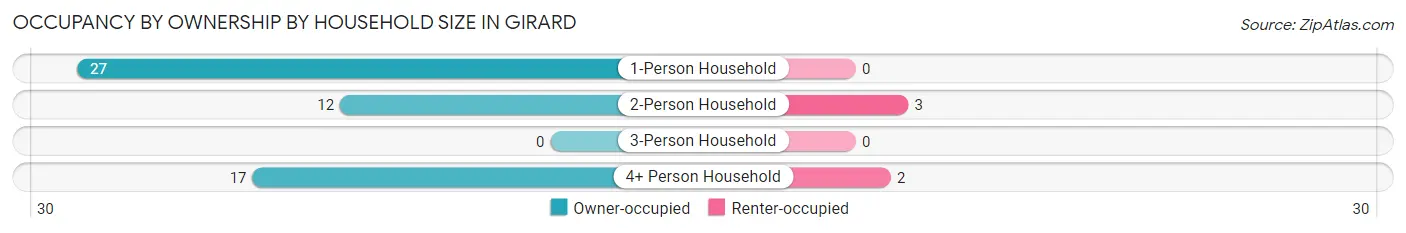
| Household Size | Owner-occupied | Renter-occupied |
| 1-Person Household | 27 (100.0%) | 0 (0.0%) |
| 2-Person Household | 12 (80.0%) | 3 (20.0%) |
| 3-Person Household | 0 (0.0%) | 0 (0.0%) |
| 4+ Person Household | 17 (89.5%) | 2 (10.5%) |
| Total Housing Units | 56 (91.8%) | 5 (8.2%) |
Occupancy by Educational Attainment in Girard
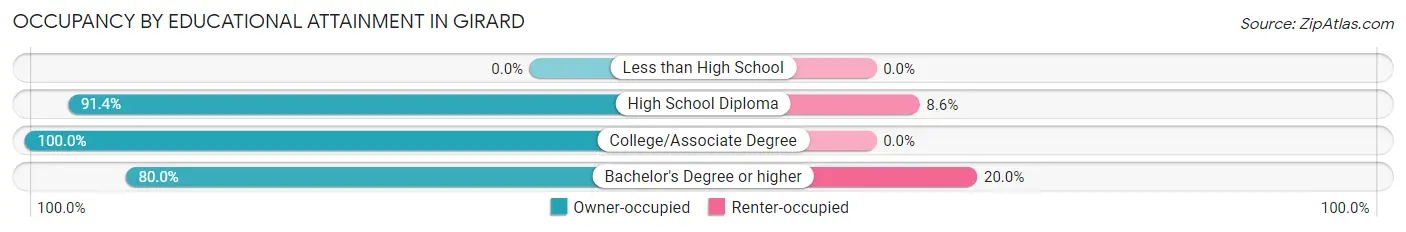
| Household Size | Owner-occupied | Renter-occupied |
| Less than High School | 0 (0.0%) | 0 (0.0%) |
| High School Diploma | 32 (91.4%) | 3 (8.6%) |
| College/Associate Degree | 16 (100.0%) | 0 (0.0%) |
| Bachelor's Degree or higher | 8 (80.0%) | 2 (20.0%) |
Occupancy by Age of Householder in Girard
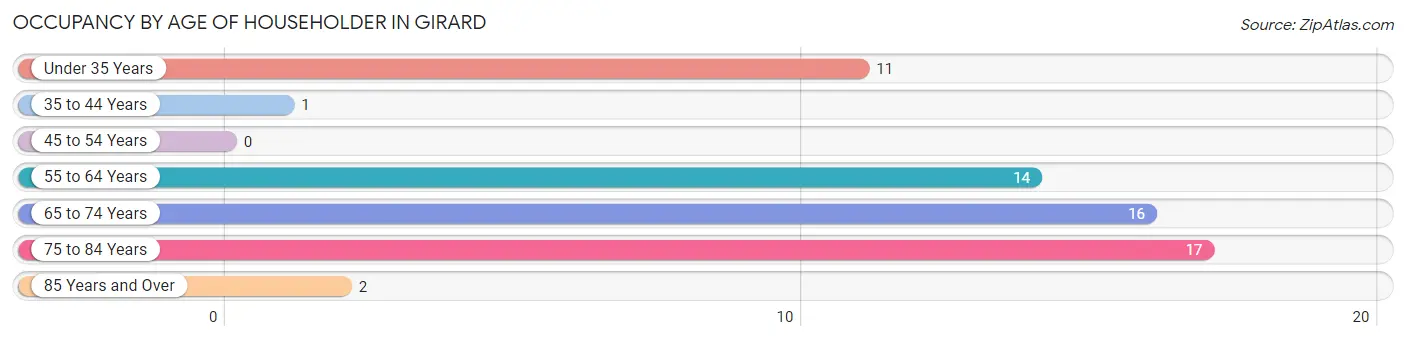
| Age Bracket | # Households | % Households |
| Under 35 Years | 11 | 18.0% |
| 35 to 44 Years | 1 | 1.6% |
| 45 to 54 Years | 0 | 0.0% |
| 55 to 64 Years | 14 | 23.0% |
| 65 to 74 Years | 16 | 26.2% |
| 75 to 84 Years | 17 | 27.9% |
| 85 Years and Over | 2 | 3.3% |
| Total | 61 | 100.0% |
Housing Finances in Girard
Median Income by Occupancy in Girard
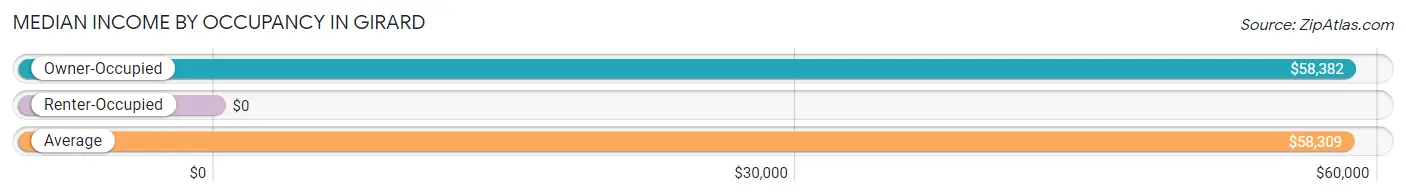
| Occupancy Type | # Households | Median Income |
| Owner-Occupied | 56 (91.8%) | $58,382 |
| Renter-Occupied | 5 (8.2%) | $0 |
| Average | 61 (100.0%) | $58,309 |
Occupancy by Householder Income Bracket in Girard
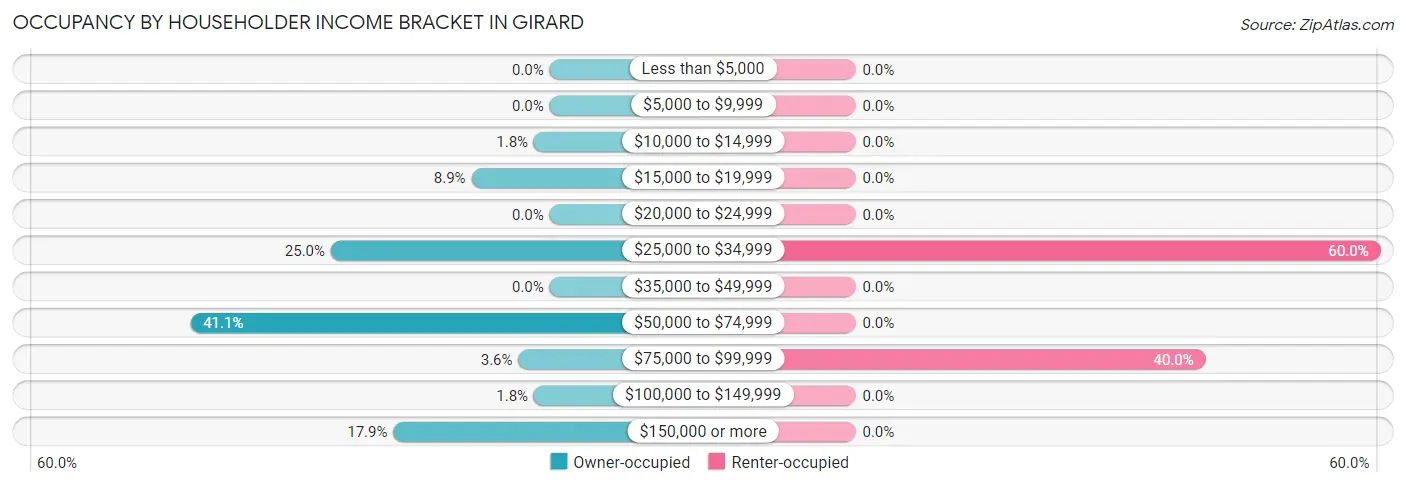
| Income Bracket | Owner-occupied | Renter-occupied |
| Less than $5,000 | 0 (0.0%) | 0 (0.0%) |
| $5,000 to $9,999 | 0 (0.0%) | 0 (0.0%) |
| $10,000 to $14,999 | 1 (1.8%) | 0 (0.0%) |
| $15,000 to $19,999 | 5 (8.9%) | 0 (0.0%) |
| $20,000 to $24,999 | 0 (0.0%) | 0 (0.0%) |
| $25,000 to $34,999 | 14 (25.0%) | 3 (60.0%) |
| $35,000 to $49,999 | 0 (0.0%) | 0 (0.0%) |
| $50,000 to $74,999 | 23 (41.1%) | 0 (0.0%) |
| $75,000 to $99,999 | 2 (3.6%) | 2 (40.0%) |
| $100,000 to $149,999 | 1 (1.8%) | 0 (0.0%) |
| $150,000 or more | 10 (17.9%) | 0 (0.0%) |
| Total | 56 (100.0%) | 5 (100.0%) |
Monthly Housing Cost Tiers in Girard
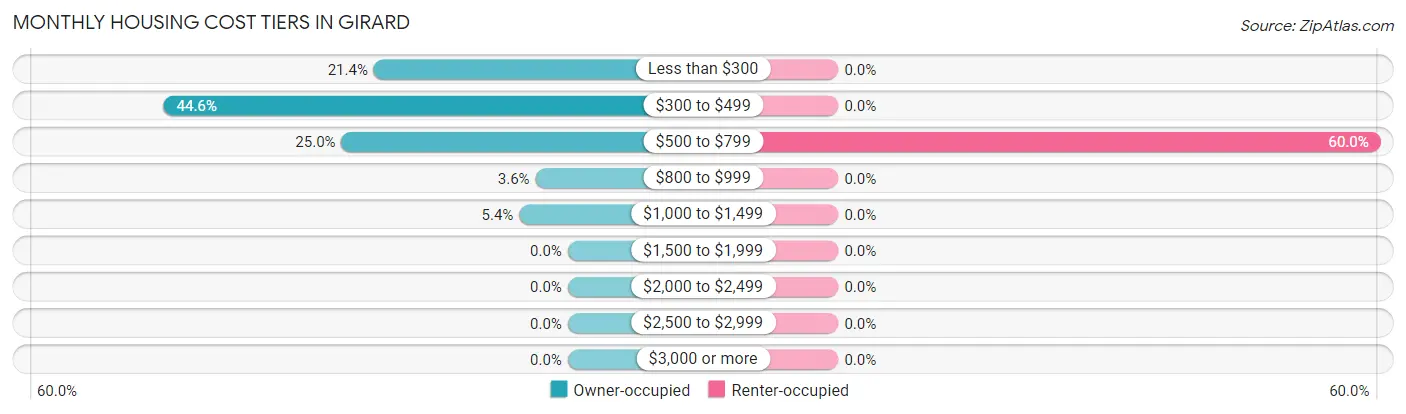
| Monthly Cost | Owner-occupied | Renter-occupied |
| Less than $300 | 12 (21.4%) | 0 (0.0%) |
| $300 to $499 | 25 (44.6%) | 0 (0.0%) |
| $500 to $799 | 14 (25.0%) | 3 (60.0%) |
| $800 to $999 | 2 (3.6%) | 0 (0.0%) |
| $1,000 to $1,499 | 3 (5.4%) | 0 (0.0%) |
| $1,500 to $1,999 | 0 (0.0%) | 0 (0.0%) |
| $2,000 to $2,499 | 0 (0.0%) | 0 (0.0%) |
| $2,500 to $2,999 | 0 (0.0%) | 0 (0.0%) |
| $3,000 or more | 0 (0.0%) | 0 (0.0%) |
| Total | 56 (100.0%) | 5 (100.0%) |
Physical Housing Characteristics in Girard
Housing Structures in Girard
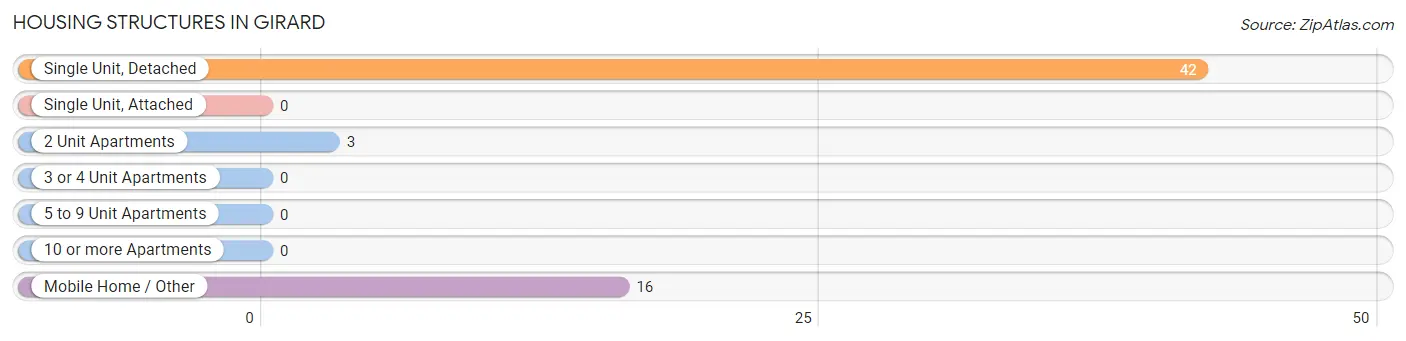
| Structure Type | # Housing Units | % Housing Units |
| Single Unit, Detached | 42 | 68.9% |
| Single Unit, Attached | 0 | 0.0% |
| 2 Unit Apartments | 3 | 4.9% |
| 3 or 4 Unit Apartments | 0 | 0.0% |
| 5 to 9 Unit Apartments | 0 | 0.0% |
| 10 or more Apartments | 0 | 0.0% |
| Mobile Home / Other | 16 | 26.2% |
| Total | 61 | 100.0% |
Housing Structures by Occupancy in Girard
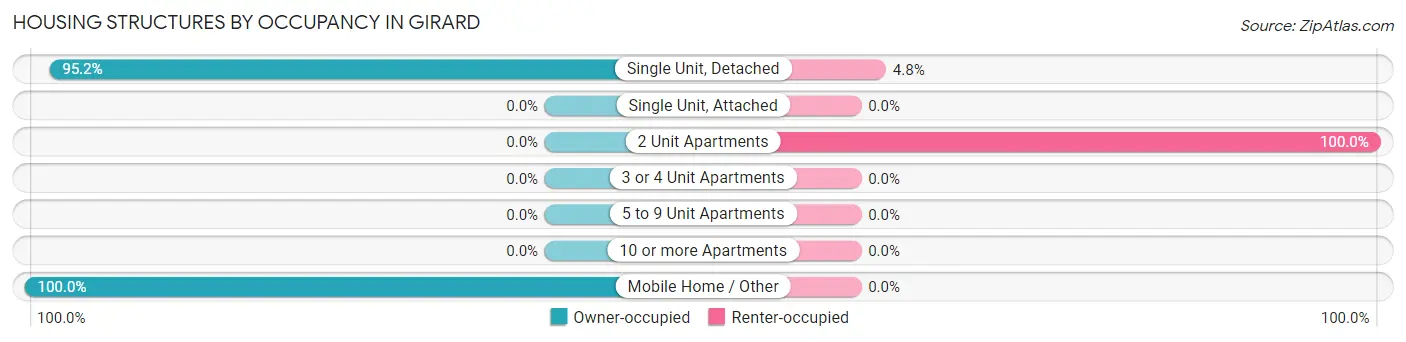
| Structure Type | Owner-occupied | Renter-occupied |
| Single Unit, Detached | 40 (95.2%) | 2 (4.8%) |
| Single Unit, Attached | 0 (0.0%) | 0 (0.0%) |
| 2 Unit Apartments | 0 (0.0%) | 3 (100.0%) |
| 3 or 4 Unit Apartments | 0 (0.0%) | 0 (0.0%) |
| 5 to 9 Unit Apartments | 0 (0.0%) | 0 (0.0%) |
| 10 or more Apartments | 0 (0.0%) | 0 (0.0%) |
| Mobile Home / Other | 16 (100.0%) | 0 (0.0%) |
| Total | 56 (91.8%) | 5 (8.2%) |
Housing Structures by Number of Rooms in Girard
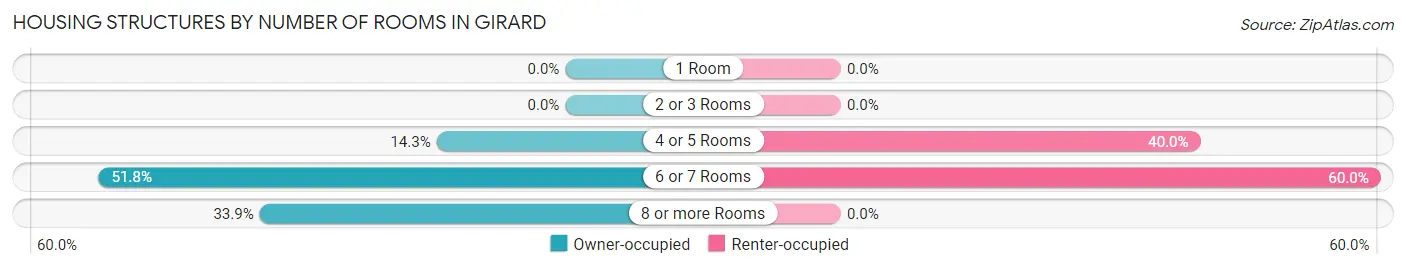
| Number of Rooms | Owner-occupied | Renter-occupied |
| 1 Room | 0 (0.0%) | 0 (0.0%) |
| 2 or 3 Rooms | 0 (0.0%) | 0 (0.0%) |
| 4 or 5 Rooms | 8 (14.3%) | 2 (40.0%) |
| 6 or 7 Rooms | 29 (51.8%) | 3 (60.0%) |
| 8 or more Rooms | 19 (33.9%) | 0 (0.0%) |
| Total | 56 (100.0%) | 5 (100.0%) |
Housing Structure by Heating Type in Girard
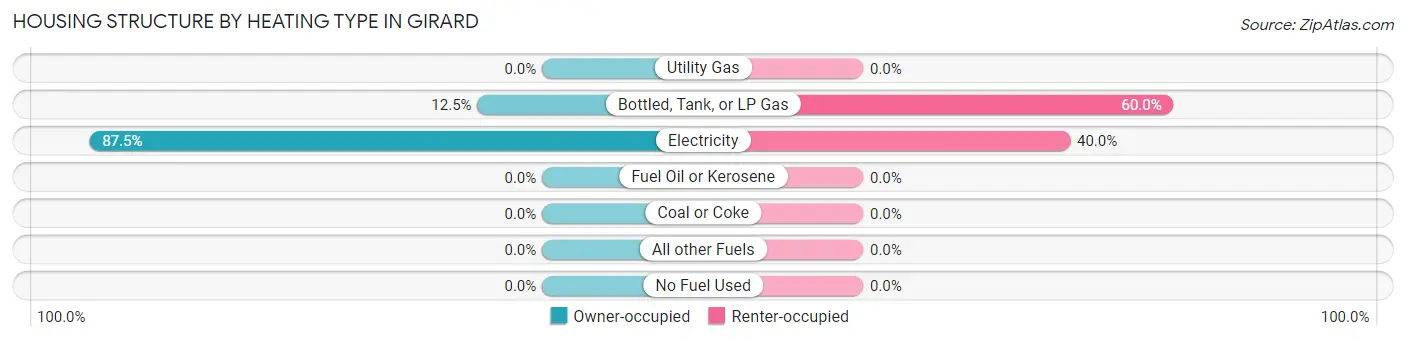
| Heating Type | Owner-occupied | Renter-occupied |
| Utility Gas | 0 (0.0%) | 0 (0.0%) |
| Bottled, Tank, or LP Gas | 7 (12.5%) | 3 (60.0%) |
| Electricity | 49 (87.5%) | 2 (40.0%) |
| Fuel Oil or Kerosene | 0 (0.0%) | 0 (0.0%) |
| Coal or Coke | 0 (0.0%) | 0 (0.0%) |
| All other Fuels | 0 (0.0%) | 0 (0.0%) |
| No Fuel Used | 0 (0.0%) | 0 (0.0%) |
| Total | 56 (100.0%) | 5 (100.0%) |
Household Vehicle Usage in Girard
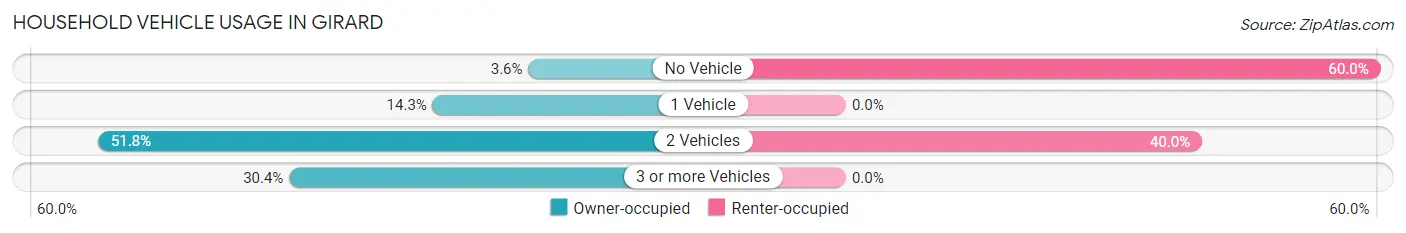
| Vehicles per Household | Owner-occupied | Renter-occupied |
| No Vehicle | 2 (3.6%) | 3 (60.0%) |
| 1 Vehicle | 8 (14.3%) | 0 (0.0%) |
| 2 Vehicles | 29 (51.8%) | 2 (40.0%) |
| 3 or more Vehicles | 17 (30.4%) | 0 (0.0%) |
| Total | 56 (100.0%) | 5 (100.0%) |
Real Estate & Mortgages in Girard
Real Estate and Mortgage Overview in Girard
| Characteristic | Without Mortgage | With Mortgage |
| Housing Units | 51 | 5 |
| Median Property Value | $71,400 | $106,300 |
| Median Household Income | $58,309 | $2 |
| Monthly Housing Costs | $443 | $0 |
| Real Estate Taxes | $555 | $0 |
Property Value by Mortgage Status in Girard
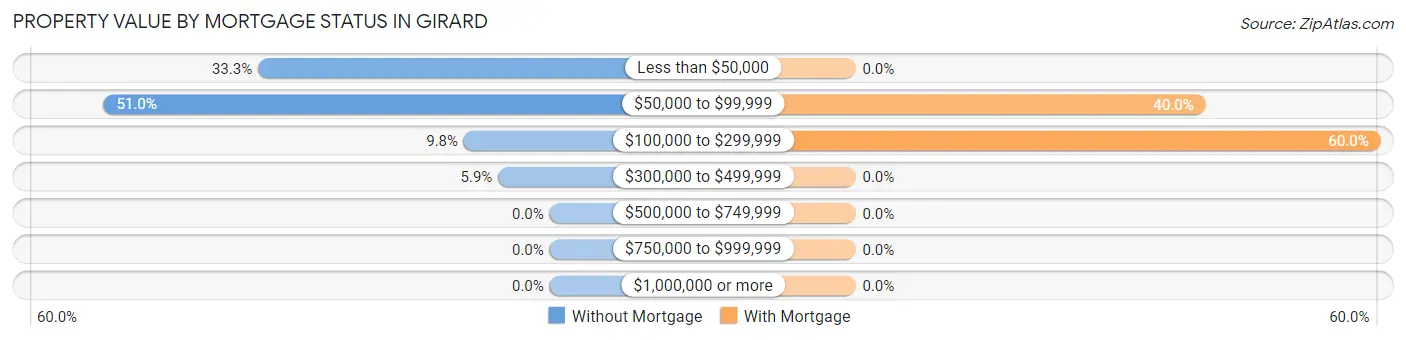
| Property Value | Without Mortgage | With Mortgage |
| Less than $50,000 | 17 (33.3%) | 0 (0.0%) |
| $50,000 to $99,999 | 26 (51.0%) | 2 (40.0%) |
| $100,000 to $299,999 | 5 (9.8%) | 3 (60.0%) |
| $300,000 to $499,999 | 3 (5.9%) | 0 (0.0%) |
| $500,000 to $749,999 | 0 (0.0%) | 0 (0.0%) |
| $750,000 to $999,999 | 0 (0.0%) | 0 (0.0%) |
| $1,000,000 or more | 0 (0.0%) | 0 (0.0%) |
| Total | 51 (100.0%) | 5 (100.0%) |
Household Income by Mortgage Status in Girard
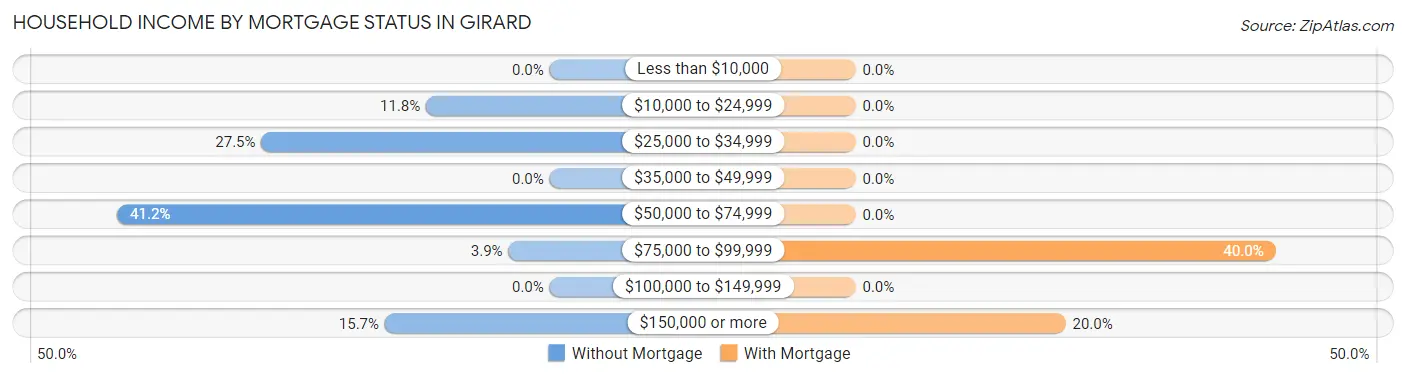
| Household Income | Without Mortgage | With Mortgage |
| Less than $10,000 | 0 (0.0%) | 0 (0.0%) |
| $10,000 to $24,999 | 6 (11.8%) | 0 (0.0%) |
| $25,000 to $34,999 | 14 (27.5%) | 0 (0.0%) |
| $35,000 to $49,999 | 0 (0.0%) | 0 (0.0%) |
| $50,000 to $74,999 | 21 (41.2%) | 0 (0.0%) |
| $75,000 to $99,999 | 2 (3.9%) | 2 (40.0%) |
| $100,000 to $149,999 | 0 (0.0%) | 0 (0.0%) |
| $150,000 or more | 8 (15.7%) | 1 (20.0%) |
| Total | 51 (100.0%) | 5 (100.0%) |
Property Value to Household Income Ratio in Girard
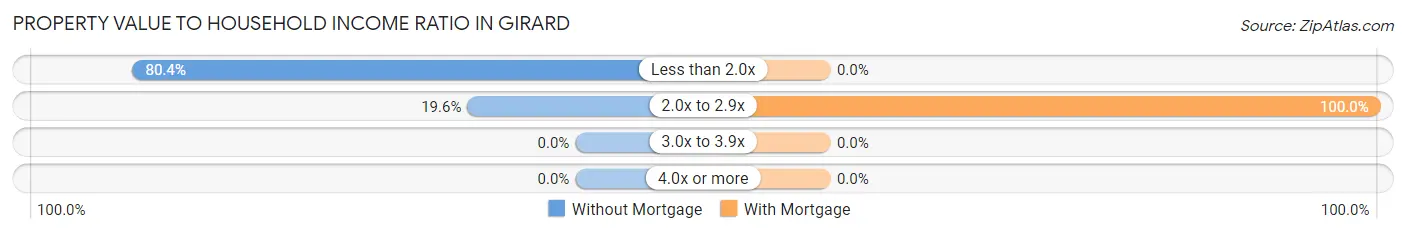
| Value-to-Income Ratio | Without Mortgage | With Mortgage |
| Less than 2.0x | 41 (80.4%) | 0 (0.0%) |
| 2.0x to 2.9x | 10 (19.6%) | 5 (100.0%) |
| 3.0x to 3.9x | 0 (0.0%) | 0 (0.0%) |
| 4.0x or more | 0 (0.0%) | 0 (0.0%) |
| Total | 51 (100.0%) | 5 (100.0%) |
Real Estate Taxes by Mortgage Status in Girard
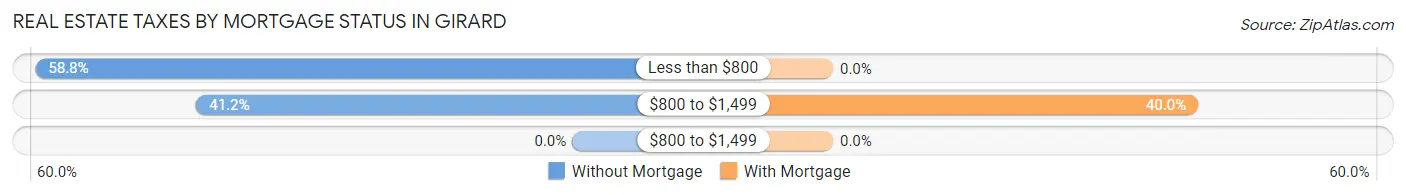
| Property Taxes | Without Mortgage | With Mortgage |
| Less than $800 | 30 (58.8%) | 0 (0.0%) |
| $800 to $1,499 | 21 (41.2%) | 2 (40.0%) |
| $800 to $1,499 | 0 (0.0%) | 0 (0.0%) |
| Total | 51 (100.0%) | 5 (100.0%) |
Health & Disability in Girard
Health Insurance Coverage by Age in Girard
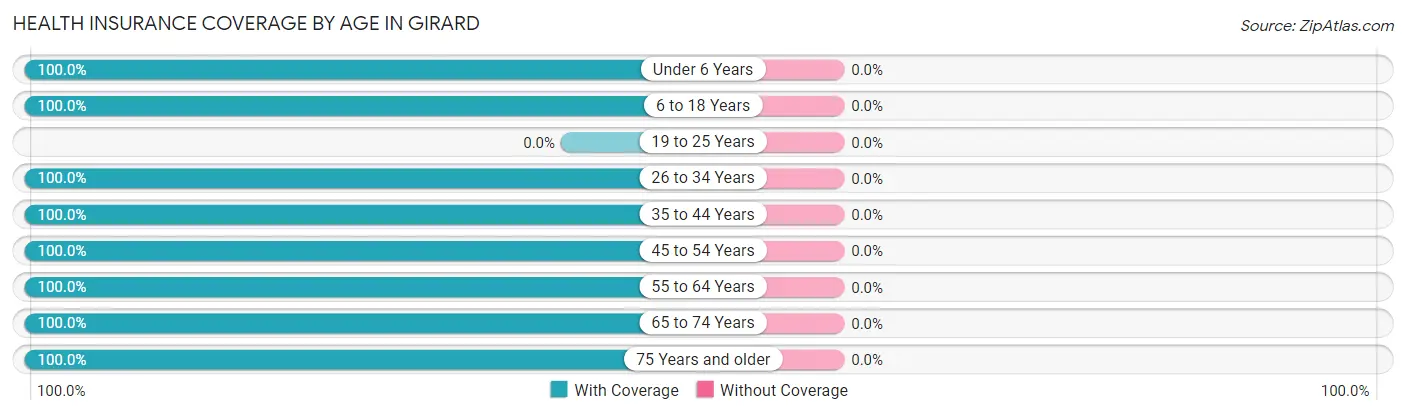
| Age Bracket | With Coverage | Without Coverage |
| Under 6 Years | 30 (100.0%) | 0 (0.0%) |
| 6 to 18 Years | 38 (100.0%) | 0 (0.0%) |
| 19 to 25 Years | 0 (0.0%) | 0 (0.0%) |
| 26 to 34 Years | 21 (100.0%) | 0 (0.0%) |
| 35 to 44 Years | 48 (100.0%) | 0 (0.0%) |
| 45 to 54 Years | 1 (100.0%) | 0 (0.0%) |
| 55 to 64 Years | 18 (100.0%) | 0 (0.0%) |
| 65 to 74 Years | 27 (100.0%) | 0 (0.0%) |
| 75 Years and older | 19 (100.0%) | 0 (0.0%) |
| Total | 202 (100.0%) | 0 (0.0%) |
Health Insurance Coverage by Citizenship Status in Girard
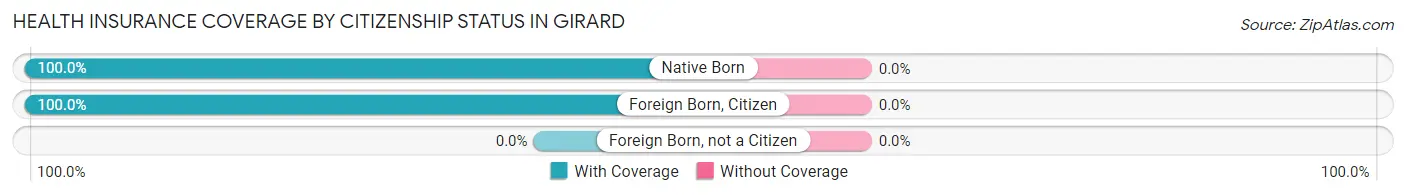
| Citizenship Status | With Coverage | Without Coverage |
| Native Born | 30 (100.0%) | 0 (0.0%) |
| Foreign Born, Citizen | 38 (100.0%) | 0 (0.0%) |
| Foreign Born, not a Citizen | 0 (0.0%) | 0 (0.0%) |
Health Insurance Coverage by Household Income in Girard
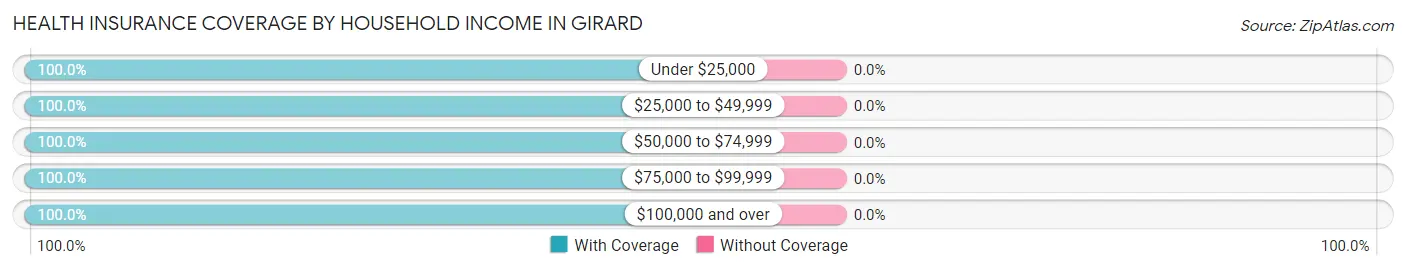
| Household Income | With Coverage | Without Coverage |
| Under $25,000 | 6 (100.0%) | 0 (0.0%) |
| $25,000 to $49,999 | 20 (100.0%) | 0 (0.0%) |
| $50,000 to $74,999 | 63 (100.0%) | 0 (0.0%) |
| $75,000 to $99,999 | 21 (100.0%) | 0 (0.0%) |
| $100,000 and over | 92 (100.0%) | 0 (0.0%) |
Public vs Private Health Insurance Coverage by Age in Girard
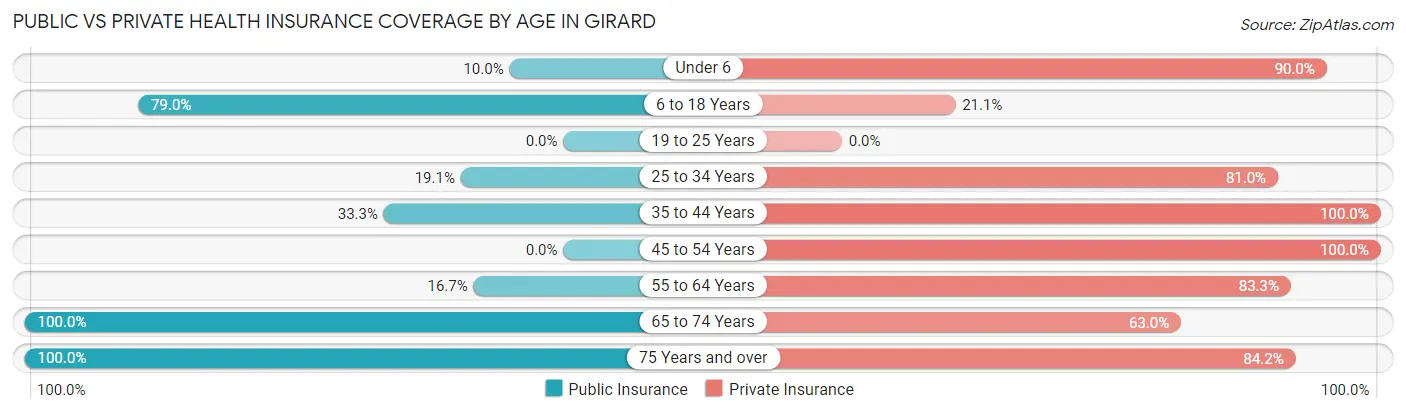
| Age Bracket | Public Insurance | Private Insurance |
| Under 6 | 3 (10.0%) | 27 (90.0%) |
| 6 to 18 Years | 30 (78.9%) | 8 (21.0%) |
| 19 to 25 Years | 0 (0.0%) | 0 (0.0%) |
| 25 to 34 Years | 4 (19.1%) | 17 (80.9%) |
| 35 to 44 Years | 16 (33.3%) | 48 (100.0%) |
| 45 to 54 Years | 0 (0.0%) | 1 (100.0%) |
| 55 to 64 Years | 3 (16.7%) | 15 (83.3%) |
| 65 to 74 Years | 27 (100.0%) | 17 (63.0%) |
| 75 Years and over | 19 (100.0%) | 16 (84.2%) |
| Total | 102 (50.5%) | 149 (73.8%) |
Disability Status by Sex by Age in Girard
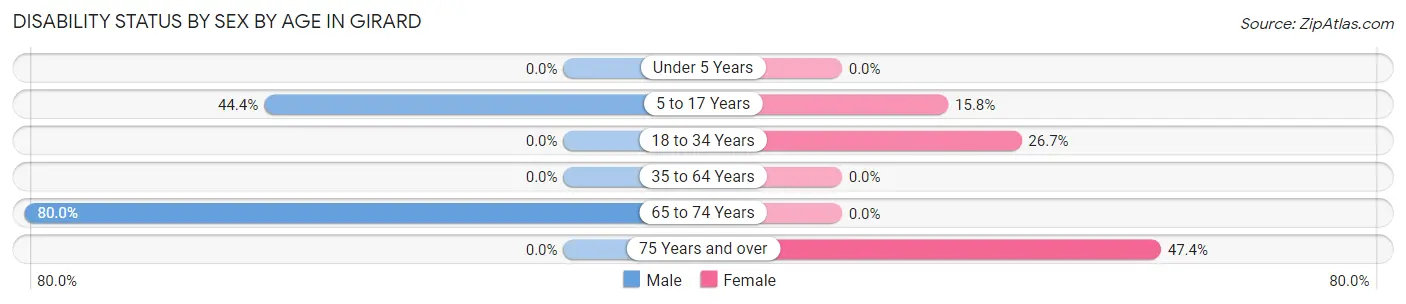
| Age Bracket | Male | Female |
| Under 5 Years | 0 (0.0%) | 0 (0.0%) |
| 5 to 17 Years | 12 (44.4%) | 6 (15.8%) |
| 18 to 34 Years | 0 (0.0%) | 4 (26.7%) |
| 35 to 64 Years | 0 (0.0%) | 0 (0.0%) |
| 65 to 74 Years | 12 (80.0%) | 0 (0.0%) |
| 75 Years and over | 0 (0.0%) | 9 (47.4%) |
Disability Class by Sex by Age in Girard
Disability Class: Hearing Difficulty
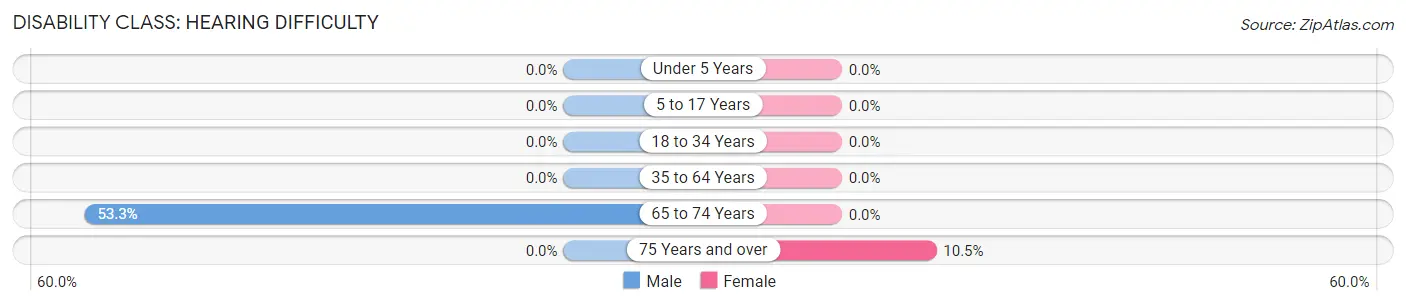
| Age Bracket | Male | Female |
| Under 5 Years | 0 (0.0%) | 0 (0.0%) |
| 5 to 17 Years | 0 (0.0%) | 0 (0.0%) |
| 18 to 34 Years | 0 (0.0%) | 0 (0.0%) |
| 35 to 64 Years | 0 (0.0%) | 0 (0.0%) |
| 65 to 74 Years | 8 (53.3%) | 0 (0.0%) |
| 75 Years and over | 0 (0.0%) | 2 (10.5%) |
Disability Class: Vision Difficulty
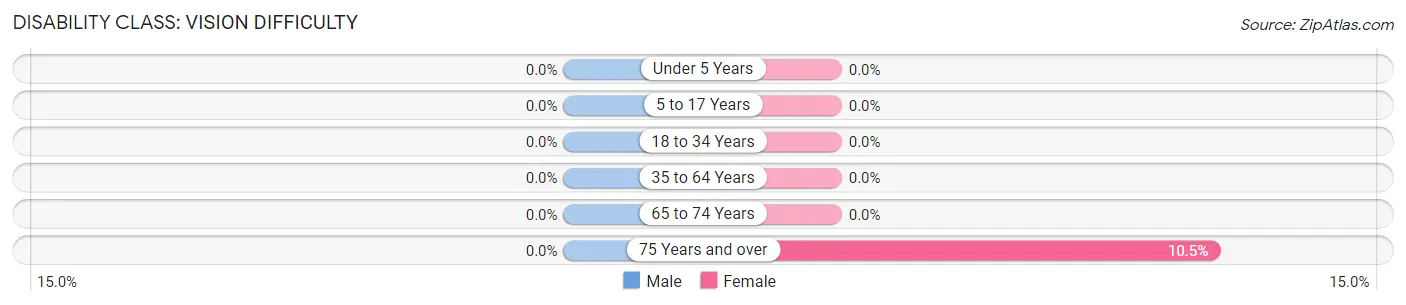
| Age Bracket | Male | Female |
| Under 5 Years | 0 (0.0%) | 0 (0.0%) |
| 5 to 17 Years | 0 (0.0%) | 0 (0.0%) |
| 18 to 34 Years | 0 (0.0%) | 0 (0.0%) |
| 35 to 64 Years | 0 (0.0%) | 0 (0.0%) |
| 65 to 74 Years | 0 (0.0%) | 0 (0.0%) |
| 75 Years and over | 0 (0.0%) | 2 (10.5%) |
Disability Class: Cognitive Difficulty
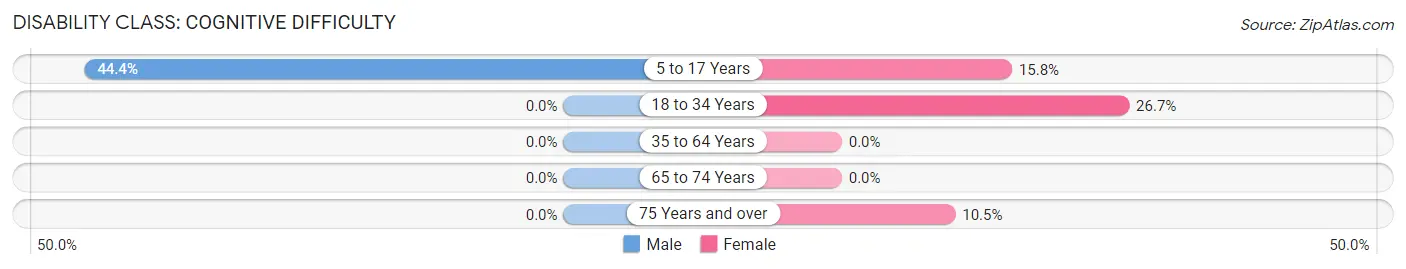
| Age Bracket | Male | Female |
| 5 to 17 Years | 12 (44.4%) | 6 (15.8%) |
| 18 to 34 Years | 0 (0.0%) | 4 (26.7%) |
| 35 to 64 Years | 0 (0.0%) | 0 (0.0%) |
| 65 to 74 Years | 0 (0.0%) | 0 (0.0%) |
| 75 Years and over | 0 (0.0%) | 2 (10.5%) |
Disability Class: Ambulatory Difficulty
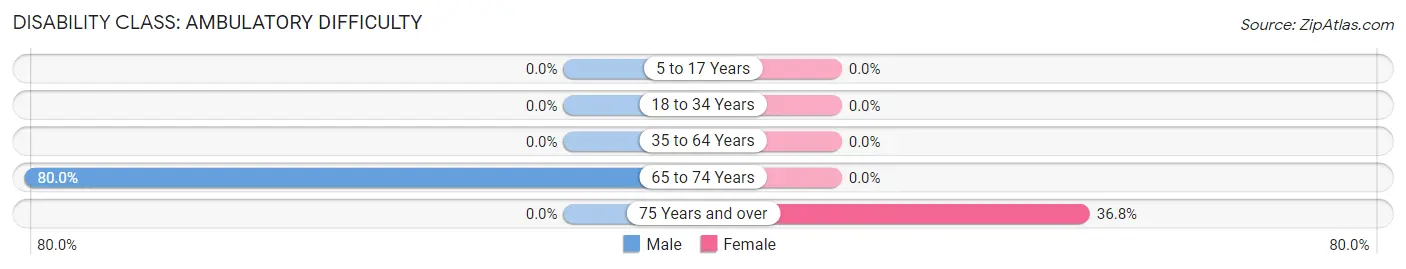
| Age Bracket | Male | Female |
| 5 to 17 Years | 0 (0.0%) | 0 (0.0%) |
| 18 to 34 Years | 0 (0.0%) | 0 (0.0%) |
| 35 to 64 Years | 0 (0.0%) | 0 (0.0%) |
| 65 to 74 Years | 12 (80.0%) | 0 (0.0%) |
| 75 Years and over | 0 (0.0%) | 7 (36.8%) |
Disability Class: Self-Care Difficulty
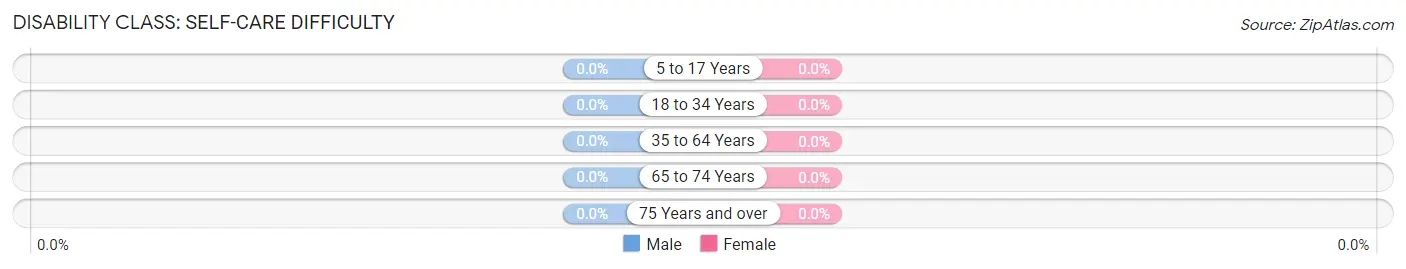
| Age Bracket | Male | Female |
| 5 to 17 Years | 0 (0.0%) | 0 (0.0%) |
| 18 to 34 Years | 0 (0.0%) | 0 (0.0%) |
| 35 to 64 Years | 0 (0.0%) | 0 (0.0%) |
| 65 to 74 Years | 0 (0.0%) | 0 (0.0%) |
| 75 Years and over | 0 (0.0%) | 0 (0.0%) |
Technology Access in Girard
Computing Device Access in Girard
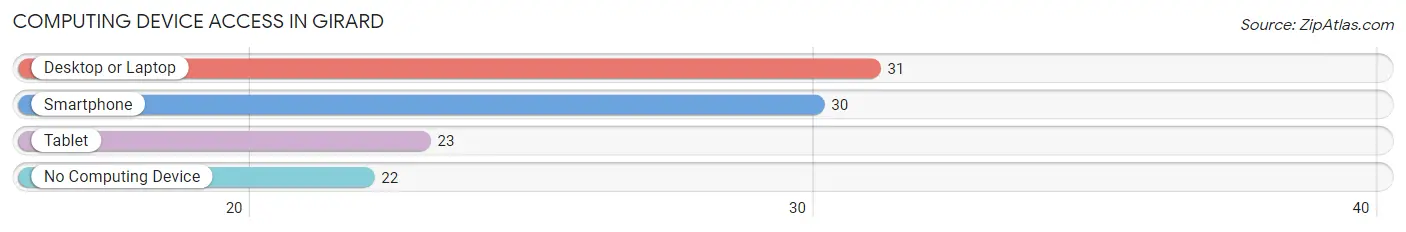
| Device Type | # Households | % Households |
| Desktop or Laptop | 31 | 50.8% |
| Smartphone | 30 | 49.2% |
| Tablet | 23 | 37.7% |
| No Computing Device | 22 | 36.1% |
| Total | 61 | 100.0% |
Internet Access in Girard
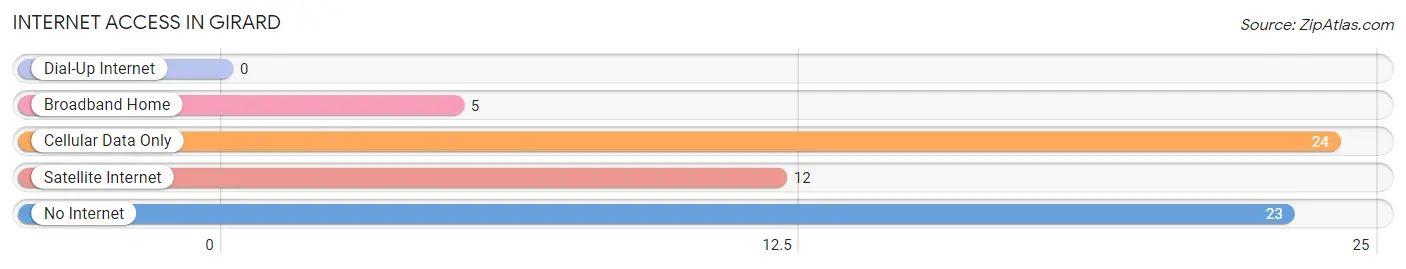
| Internet Type | # Households | % Households |
| Dial-Up Internet | 0 | 0.0% |
| Broadband Home | 5 | 8.2% |
| Cellular Data Only | 24 | 39.3% |
| Satellite Internet | 12 | 19.7% |
| No Internet | 23 | 37.7% |
| Total | 61 | 100.0% |
Girard Summary
Girard is a small city located in southwest Georgia, in the county of Calhoun. It is situated on the banks of the Chattahoochee River, and is part of the Columbus, Georgia metropolitan area. The city has a population of approximately 1,500 people, and is known for its rural charm and small-town atmosphere.
Geography
Girard is located in the southwestern corner of Georgia, in Calhoun County. It is situated on the banks of the Chattahoochee River, and is part of the Columbus, Georgia metropolitan area. The city is located approximately 30 miles south of Columbus, and is bordered by the cities of Fort Benning and Phenix City, Alabama. The city is situated in a rural area, and is surrounded by farmland and wooded areas.
The climate in Girard is humid subtropical, with hot, humid summers and mild winters. The average annual temperature is around 70 degrees Fahrenheit, with temperatures reaching as high as 95 degrees in the summer months. The average annual precipitation is around 50 inches, with most of the rain falling in the spring and summer months.
History
Girard was founded in 1854 by a group of settlers from Georgia and Alabama. The city was named after the Girard family, who were among the first settlers in the area. The city was originally a small farming community, and the main industry was cotton production.
In the late 19th century, the city began to grow and develop, and by the early 20th century, it had become a thriving small town. The city was home to several businesses, including a cotton gin, a sawmill, and a gristmill. The city also had a railroad station, which connected it to the larger cities of Columbus and Phenix City.
In the mid-20th century, the city began to decline, as the cotton industry began to decline and the railroad station was closed. The city was also affected by the Great Depression, and many of the businesses in the city closed. In the late 20th century, the city began to experience a resurgence, as new businesses began to open and the city began to attract new residents.
Economy
Girard’s economy is largely based on agriculture and tourism. The city is home to several farms, which produce a variety of crops, including cotton, corn, soybeans, and peanuts. The city is also home to several tourist attractions, including the Chattahoochee River, which is popular for fishing and boating.
The city is also home to several small businesses, including restaurants, retail stores, and service providers. The city is also home to several manufacturing companies, which produce a variety of products, including furniture, clothing, and automotive parts.
Demographics
Girard has a population of approximately 1,500 people, and is predominantly white. The city has a median household income of around $35,000, and the median age is around 40 years old. The city is home to a variety of religious denominations, including Baptist, Methodist, and Catholic.
Conclusion
Girard is a small city located in southwest Georgia, in the county of Calhoun. It is situated on the banks of the Chattahoochee River, and is part of the Columbus, Georgia metropolitan area. The city has a population of approximately 1,500 people, and is known for its rural charm and small-town atmosphere. The city’s economy is largely based on agriculture and tourism, and it is home to several small businesses, manufacturing companies, and tourist attractions. The city is predominantly white, with a median household income of around $35,000, and a median age of around 40 years old.
Common Questions
What is Per Capita Income in Girard?
Per Capita income in Girard is $27,449.
What is the Median Family Income in Girard?
Median Family Income in Girard is $59,265.
What is the Median Household income in Girard?
Median Household Income in Girard is $58,309.
What is Income or Wage Gap in Girard?
Income or Wage Gap in Girard is 33.7%.
Women in Girard earn 66.3 cents for every dollar earned by a man.
What is Inequality or Gini Index in Girard?
Inequality or Gini Index in Girard is 0.44.
What is the Total Population of Girard?
Total Population of Girard is 202.
What is the Total Male Population of Girard?
Total Male Population of Girard is 89.
What is the Total Female Population of Girard?
Total Female Population of Girard is 113.
What is the Ratio of Males per 100 Females in Girard?
There are 78.76 Males per 100 Females in Girard.
What is the Ratio of Females per 100 Males in Girard?
There are 126.97 Females per 100 Males in Girard.
What is the Median Population Age in Girard?
Median Population Age in Girard is 36.8 Years.
What is the Average Family Size in Girard
Average Family Size in Girard is 4.7 People.
What is the Average Household Size in Girard
Average Household Size in Girard is 3.3 People.
How Large is the Labor Force in Girard?
There are 47 People in the Labor Forcein in Girard.
What is the Percentage of People in the Labor Force in Girard?
34.3% of People are in the Labor Force in Girard.
What is the Unemployment Rate in Girard?
Unemployment Rate in Girard is 2.1%.