Fitzgerald, GA Map & Demographics
Fitzgerald Map
Fitzgerald Overview
$20,293
PER CAPITA INCOME
$37,024
AVG FAMILY INCOME
$32,500
AVG HOUSEHOLD INCOME
13.7%
WAGE / INCOME GAP [ % ]
86.3¢/ $1
WAGE / INCOME GAP [ $ ]
0.45
INEQUALITY / GINI INDEX
8,972
TOTAL POPULATION
3,977
MALE POPULATION
4,995
FEMALE POPULATION
79.62
MALES / 100 FEMALES
125.60
FEMALES / 100 MALES
35.3
MEDIAN AGE
3.1
AVG FAMILY SIZE
2.3
AVG HOUSEHOLD SIZE
4,017
LABOR FORCE [ PEOPLE ]
58.3%
PERCENT IN LABOR FORCE
6.1%
UNEMPLOYMENT RATE
Fitzgerald Zip Codes
Fitzgerald Area Codes
Income in Fitzgerald
Income Overview in Fitzgerald
Per Capita Income in Fitzgerald is $20,293, while median incomes of families and households are $37,024 and $32,500 respectively.
| Characteristic | Number | Measure |
| Per Capita Income | 8,972 | $20,293 |
| Median Family Income | 2,240 | $37,024 |
| Mean Family Income | 2,240 | $56,228 |
| Median Household Income | 3,778 | $32,500 |
| Mean Household Income | 3,778 | $47,590 |
| Income Deficit | 2,240 | $0 |
| Wage / Income Gap (%) | 8,972 | 13.72% |
| Wage / Income Gap ($) | 8,972 | 86.28¢ per $1 |
| Gini / Inequality Index | 8,972 | 0.45 |
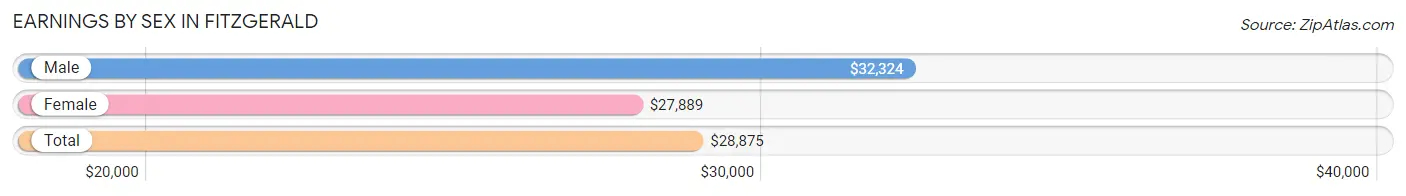
Earnings by Sex in Fitzgerald
Average Earnings in Fitzgerald are $28,875, $32,324 for men and $27,889 for women, a difference of 13.7%.
| Sex | Number | Average Earnings |
| Male | 2,004 (48.6%) | $32,324 |
| Female | 2,123 (51.4%) | $27,889 |
| Total | 4,127 (100.0%) | $28,875 |
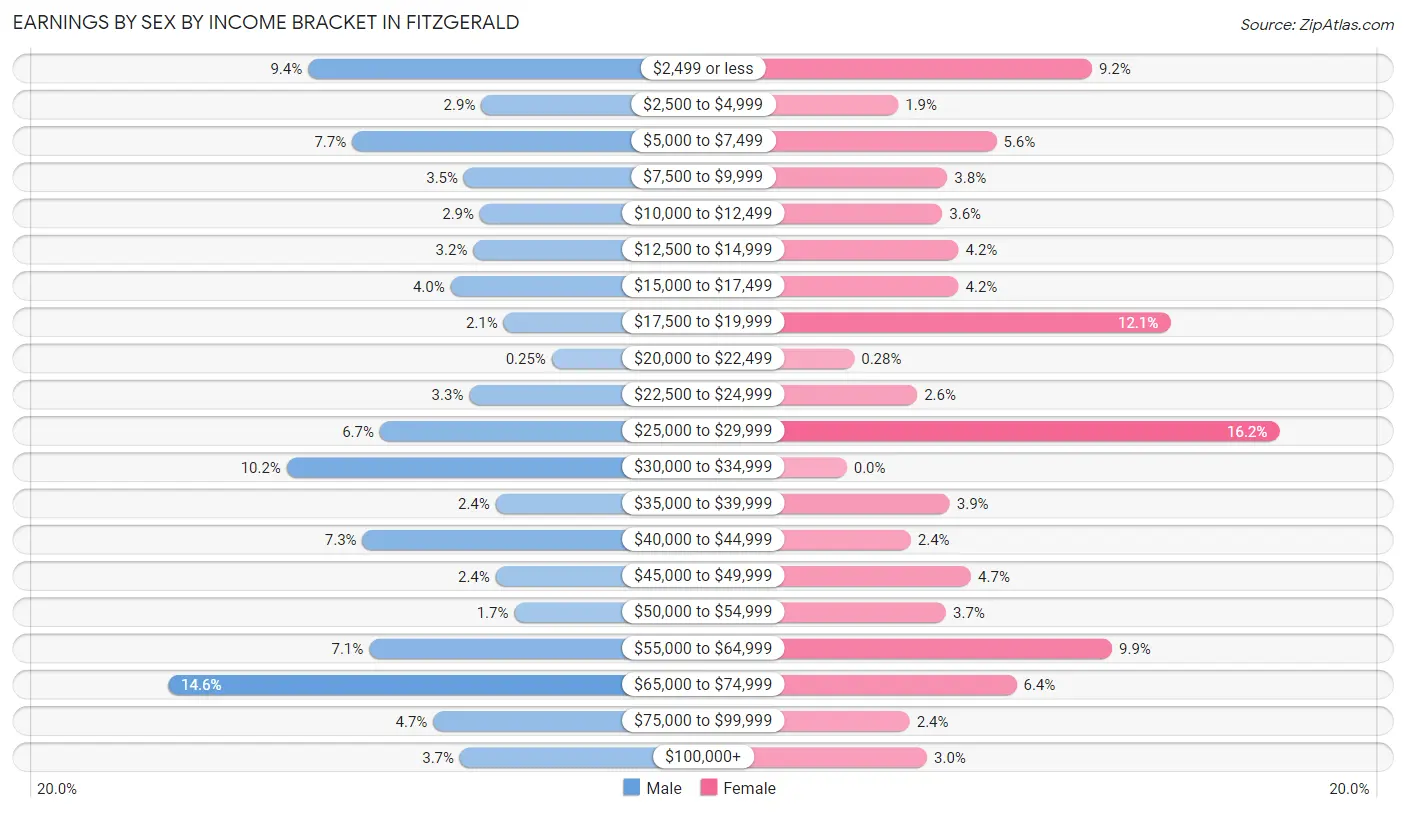
Earnings by Sex by Income Bracket in Fitzgerald
The most common earnings brackets in Fitzgerald are $65,000 to $74,999 for men (293 | 14.6%) and $25,000 to $29,999 for women (344 | 16.2%).
| Income | Male | Female |
| $2,499 or less | 188 (9.4%) | 195 (9.2%) |
| $2,500 to $4,999 | 58 (2.9%) | 41 (1.9%) |
| $5,000 to $7,499 | 155 (7.7%) | 119 (5.6%) |
| $7,500 to $9,999 | 71 (3.5%) | 80 (3.8%) |
| $10,000 to $12,499 | 59 (2.9%) | 76 (3.6%) |
| $12,500 to $14,999 | 64 (3.2%) | 89 (4.2%) |
| $15,000 to $17,499 | 81 (4.0%) | 89 (4.2%) |
| $17,500 to $19,999 | 41 (2.1%) | 257 (12.1%) |
| $20,000 to $22,499 | 5 (0.3%) | 6 (0.3%) |
| $22,500 to $24,999 | 67 (3.3%) | 56 (2.6%) |
| $25,000 to $29,999 | 134 (6.7%) | 344 (16.2%) |
| $30,000 to $34,999 | 204 (10.2%) | 0 (0.0%) |
| $35,000 to $39,999 | 47 (2.4%) | 82 (3.9%) |
| $40,000 to $44,999 | 147 (7.3%) | 51 (2.4%) |
| $45,000 to $49,999 | 47 (2.4%) | 99 (4.7%) |
| $50,000 to $54,999 | 33 (1.7%) | 79 (3.7%) |
| $55,000 to $64,999 | 142 (7.1%) | 211 (9.9%) |
| $65,000 to $74,999 | 293 (14.6%) | 135 (6.4%) |
| $75,000 to $99,999 | 94 (4.7%) | 50 (2.4%) |
| $100,000+ | 74 (3.7%) | 64 (3.0%) |
| Total | 2,004 (100.0%) | 2,123 (100.0%) |
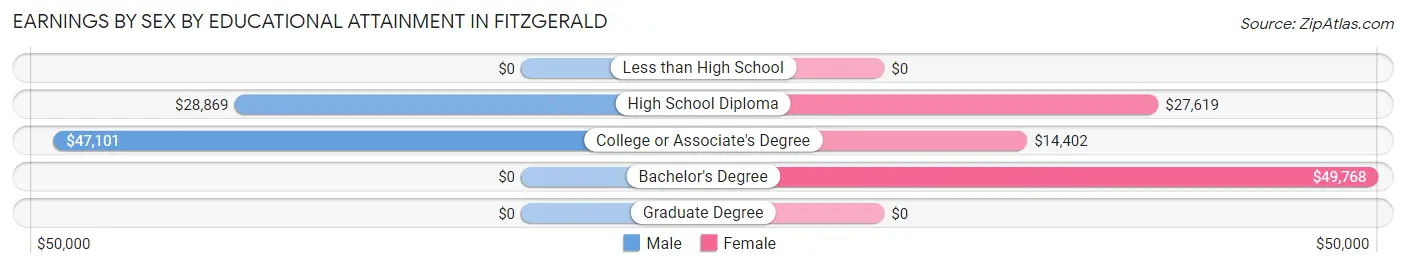
Earnings by Sex by Educational Attainment in Fitzgerald
Average earnings in Fitzgerald are $32,819 for men and $27,846 for women, a difference of 15.1%. Men with an educational attainment of college or associate's degree enjoy the highest average annual earnings of $47,101, while those with high school diploma education earn the least with $28,869. Women with an educational attainment of bachelor's degree earn the most with the average annual earnings of $49,768, while those with college or associate's degree education have the smallest earnings of $14,402.
| Educational Attainment | Male Income | Female Income |
| Less than High School | - | - |
| High School Diploma | $28,869 | $27,619 |
| College or Associate's Degree | $47,101 | $14,402 |
| Bachelor's Degree | - | - |
| Graduate Degree | - | - |
| Total | $32,819 | $27,846 |
Family Income in Fitzgerald
Family Income Brackets in Fitzgerald
According to the Fitzgerald family income data, there are 439 families falling into the $25,000 to $34,999 income range, which is the most common income bracket and makes up 19.6% of all families. Conversely, the $200,000+ income bracket is the least frequent group with only 40 families (1.8%) belonging to this category.
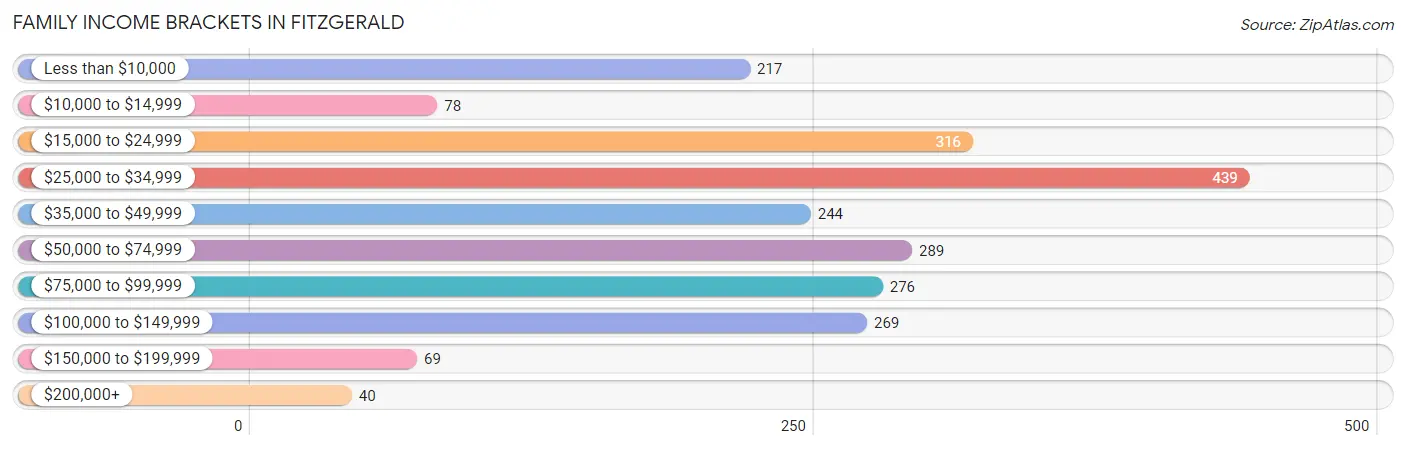
| Income Bracket | # Families | % Families |
| Less than $10,000 | 217 | 9.7% |
| $10,000 to $14,999 | 78 | 3.5% |
| $15,000 to $24,999 | 316 | 14.1% |
| $25,000 to $34,999 | 439 | 19.6% |
| $35,000 to $49,999 | 244 | 10.9% |
| $50,000 to $74,999 | 289 | 12.9% |
| $75,000 to $99,999 | 276 | 12.3% |
| $100,000 to $149,999 | 269 | 12.0% |
| $150,000 to $199,999 | 69 | 3.1% |
| $200,000+ | 40 | 1.8% |
Family Income by Famaliy Size in Fitzgerald
5-person families (162 | 7.2%) account for the highest median family income in Fitzgerald with $113,859 per family, while 5-person families (162 | 7.2%) have the highest median income of $22,772 per family member.
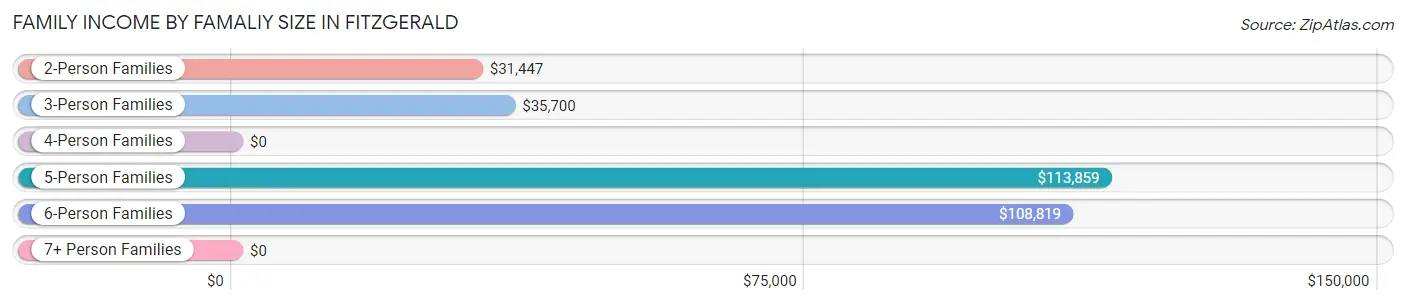
| Income Bracket | # Families | Median Income |
| 2-Person Families | 1,264 (56.4%) | $31,447 |
| 3-Person Families | 504 (22.5%) | $35,700 |
| 4-Person Families | 236 (10.5%) | $0 |
| 5-Person Families | 162 (7.2%) | $113,859 |
| 6-Person Families | 41 (1.8%) | $108,819 |
| 7+ Person Families | 33 (1.5%) | $0 |
| Total | 2,240 (100.0%) | $37,024 |
Family Income by Number of Earners in Fitzgerald
The median family income in Fitzgerald is $37,024, with families comprising 3+ earners (212) having the highest median family income of $114,007, while families with no earners (525) have the lowest median family income of $24,707, accounting for 9.5% and 23.4% of families, respectively.
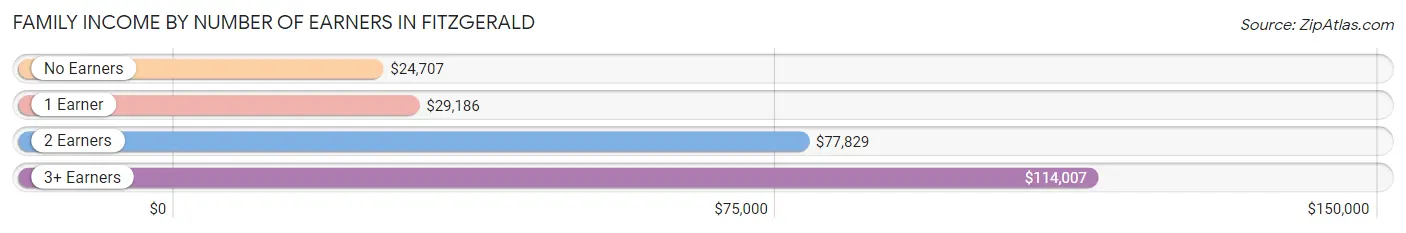
| Number of Earners | # Families | Median Income |
| No Earners | 525 (23.4%) | $24,707 |
| 1 Earner | 810 (36.2%) | $29,186 |
| 2 Earners | 693 (30.9%) | $77,829 |
| 3+ Earners | 212 (9.5%) | $114,007 |
| Total | 2,240 (100.0%) | $37,024 |
Household Income in Fitzgerald
Household Income Brackets in Fitzgerald
With 763 households falling in the category, the $25,000 to $34,999 income range is the most frequent in Fitzgerald, accounting for 20.2% of all households. In contrast, only 42 households (1.1%) fall into the $200,000+ income bracket, making it the least populous group.
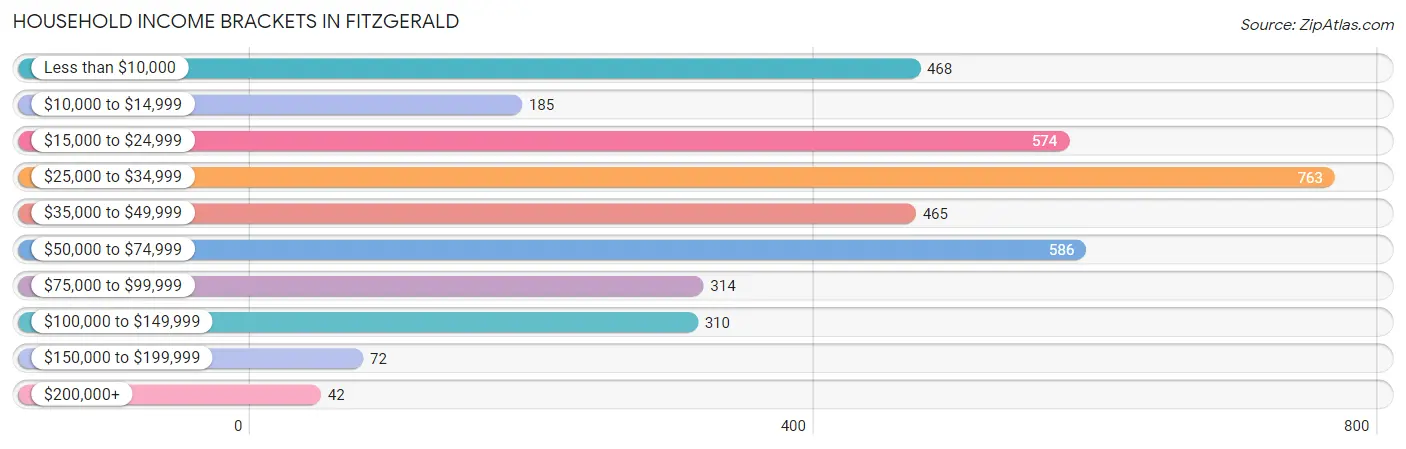
| Income Bracket | # Households | % Households |
| Less than $10,000 | 468 | 12.4% |
| $10,000 to $14,999 | 185 | 4.9% |
| $15,000 to $24,999 | 574 | 15.2% |
| $25,000 to $34,999 | 763 | 20.2% |
| $35,000 to $49,999 | 465 | 12.3% |
| $50,000 to $74,999 | 586 | 15.5% |
| $75,000 to $99,999 | 314 | 8.3% |
| $100,000 to $149,999 | 310 | 8.2% |
| $150,000 to $199,999 | 72 | 1.9% |
| $200,000+ | 42 | 1.1% |
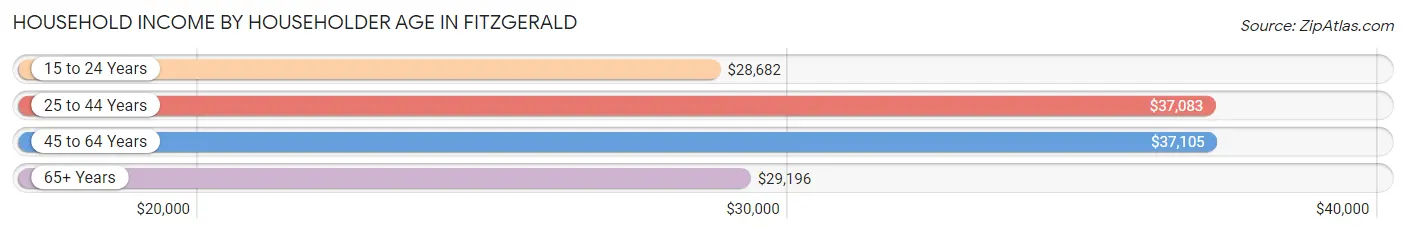
Household Income by Householder Age in Fitzgerald
The median household income in Fitzgerald is $32,500, with the highest median household income of $37,105 found in the 45 to 64 years age bracket for the primary householder. A total of 1,412 households (37.4%) fall into this category. Meanwhile, the 15 to 24 years age bracket for the primary householder has the lowest median household income of $28,682, with 390 households (10.3%) in this group.
| Income Bracket | # Households | Median Income |
| 15 to 24 Years | 390 (10.3%) | $28,682 |
| 25 to 44 Years | 1,153 (30.5%) | $37,083 |
| 45 to 64 Years | 1,412 (37.4%) | $37,105 |
| 65+ Years | 823 (21.8%) | $29,196 |
| Total | 3,778 (100.0%) | $32,500 |
Poverty in Fitzgerald
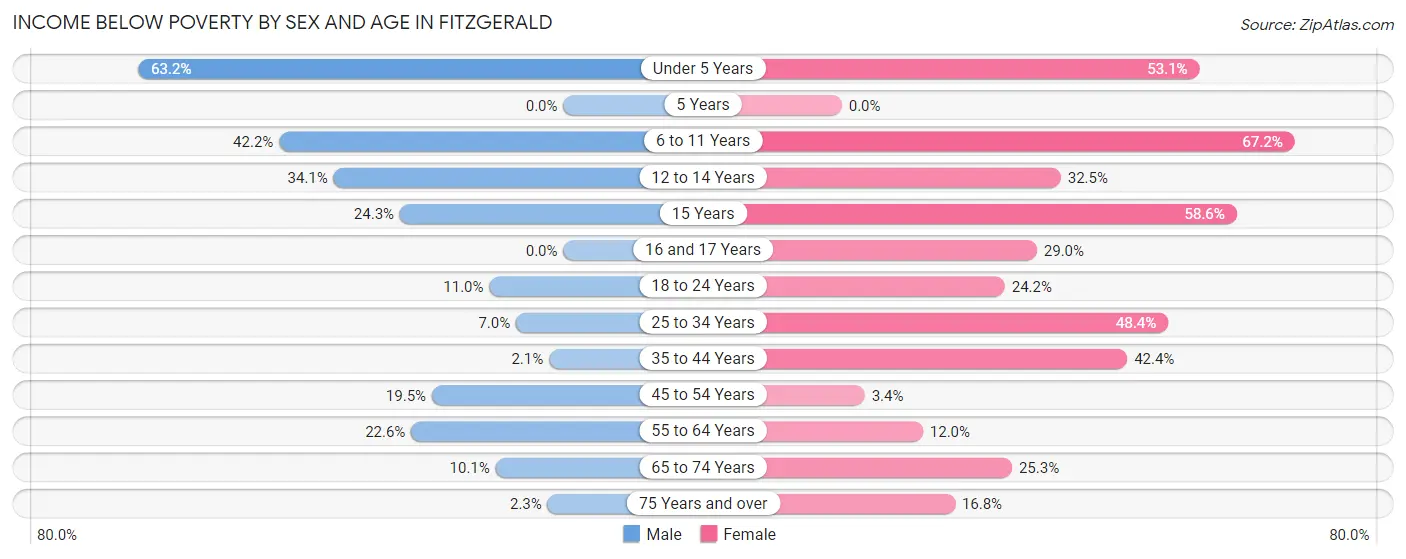
Income Below Poverty by Sex and Age in Fitzgerald
With 19.8% poverty level for males and 33.0% for females among the residents of Fitzgerald, under 5 year old males and 6 to 11 year old females are the most vulnerable to poverty, with 144 males (63.2%) and 275 females (67.2%) in their respective age groups living below the poverty level.
| Age Bracket | Male | Female |
| Under 5 Years | 144 (63.2%) | 214 (53.1%) |
| 5 Years | 0 (0.0%) | 0 (0.0%) |
| 6 to 11 Years | 146 (42.2%) | 275 (67.2%) |
| 12 to 14 Years | 102 (34.1%) | 67 (32.5%) |
| 15 Years | 25 (24.3%) | 17 (58.6%) |
| 16 and 17 Years | 0 (0.0%) | 31 (29.0%) |
| 18 to 24 Years | 49 (11.0%) | 100 (24.2%) |
| 25 to 34 Years | 37 (7.0%) | 372 (48.4%) |
| 35 to 44 Years | 6 (2.1%) | 242 (42.4%) |
| 45 to 54 Years | 90 (19.5%) | 14 (3.4%) |
| 55 to 64 Years | 136 (22.6%) | 79 (12.0%) |
| 65 to 74 Years | 18 (10.1%) | 117 (25.3%) |
| 75 Years and over | 6 (2.3%) | 65 (16.8%) |
| Total | 759 (19.8%) | 1,593 (33.0%) |
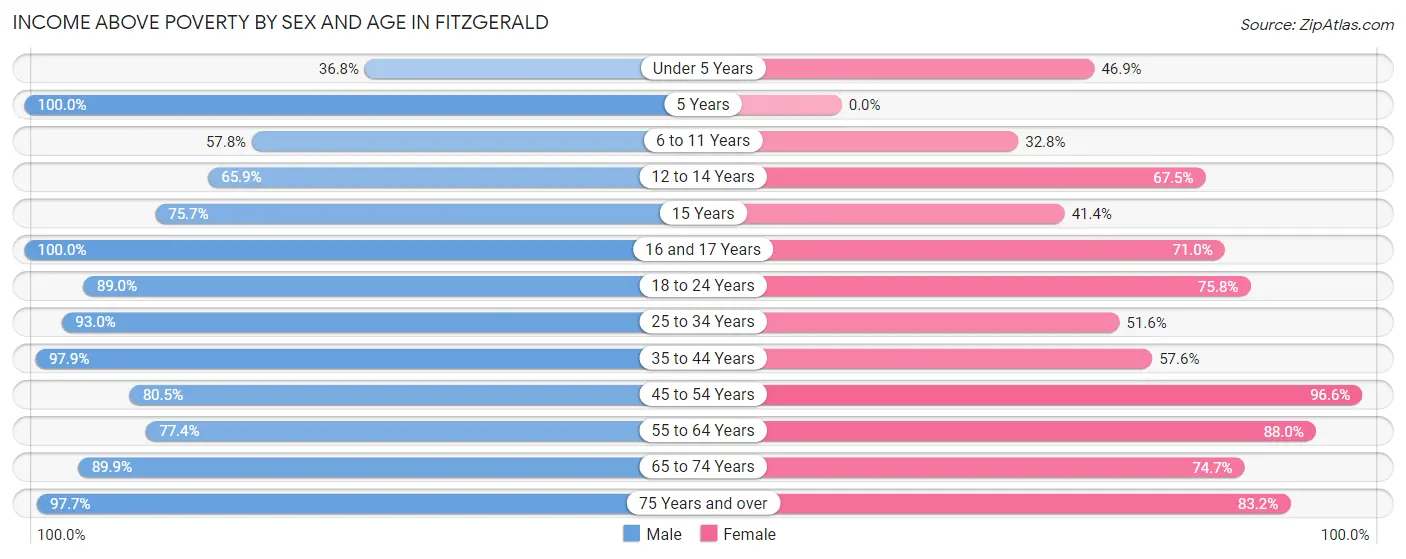
Income Above Poverty by Sex and Age in Fitzgerald
According to the poverty statistics in Fitzgerald, males aged 5 years and females aged 45 to 54 years are the age groups that are most secure financially, with 100.0% of males and 96.6% of females in these age groups living above the poverty line.
| Age Bracket | Male | Female |
| Under 5 Years | 84 (36.8%) | 189 (46.9%) |
| 5 Years | 59 (100.0%) | 0 (0.0%) |
| 6 to 11 Years | 200 (57.8%) | 134 (32.8%) |
| 12 to 14 Years | 197 (65.9%) | 139 (67.5%) |
| 15 Years | 78 (75.7%) | 12 (41.4%) |
| 16 and 17 Years | 44 (100.0%) | 76 (71.0%) |
| 18 to 24 Years | 397 (89.0%) | 313 (75.8%) |
| 25 to 34 Years | 490 (93.0%) | 396 (51.6%) |
| 35 to 44 Years | 277 (97.9%) | 329 (57.6%) |
| 45 to 54 Years | 371 (80.5%) | 397 (96.6%) |
| 55 to 64 Years | 466 (77.4%) | 577 (88.0%) |
| 65 to 74 Years | 161 (89.9%) | 346 (74.7%) |
| 75 Years and over | 250 (97.7%) | 322 (83.2%) |
| Total | 3,074 (80.2%) | 3,230 (67.0%) |
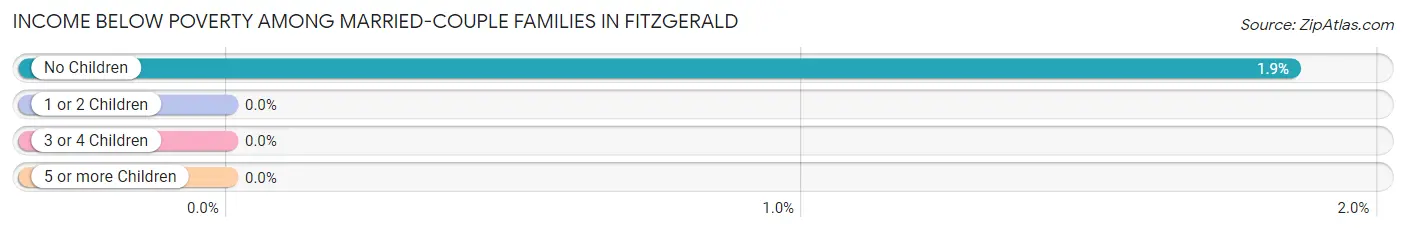
Income Below Poverty Among Married-Couple Families in Fitzgerald
The poverty statistics for married-couple families in Fitzgerald show that 1.3% or 14 of the total 1,090 families live below the poverty line. Families with no children have the highest poverty rate of 1.8%, comprising of 14 families. On the other hand, families with 1 or 2 children have the lowest poverty rate of 0.0%, which includes 0 families.
| Children | Above Poverty | Below Poverty |
| No Children | 741 (98.2%) | 14 (1.8%) |
| 1 or 2 Children | 273 (100.0%) | 0 (0.0%) |
| 3 or 4 Children | 62 (100.0%) | 0 (0.0%) |
| 5 or more Children | 0 (0.0%) | 0 (0.0%) |
| Total | 1,076 (98.7%) | 14 (1.3%) |
Income Below Poverty Among Single-Parent Households in Fitzgerald
According to the poverty data in Fitzgerald, 31.7% or 53 single-father households and 47.2% or 464 single-mother households are living below the poverty line. Among single-father households, those with no children have the highest poverty rate, with 53 households (77.9%) experiencing poverty. Likewise, among single-mother households, those with 5 or more children have the highest poverty rate, with 33 households (100.0%) falling below the poverty line.
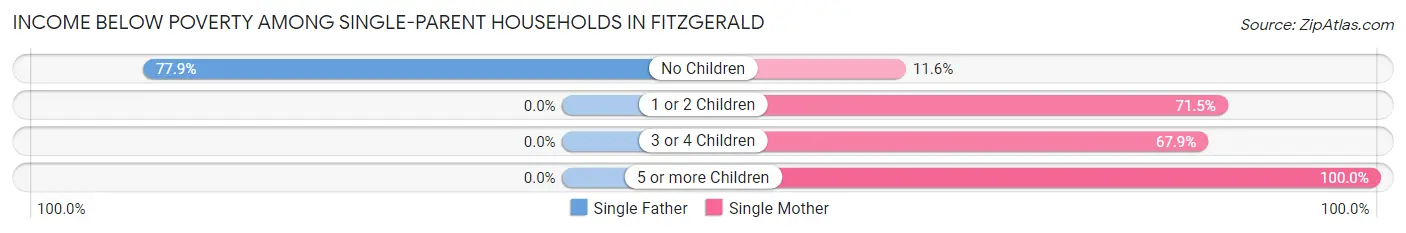
| Children | Single Father | Single Mother |
| No Children | 53 (77.9%) | 48 (11.6%) |
| 1 or 2 Children | 0 (0.0%) | 364 (71.5%) |
| 3 or 4 Children | 0 (0.0%) | 19 (67.9%) |
| 5 or more Children | 0 (0.0%) | 33 (100.0%) |
| Total | 53 (31.7%) | 464 (47.2%) |
Income Below Poverty Among Married-Couple vs Single-Parent Households in Fitzgerald
The poverty data for Fitzgerald shows that 14 of the married-couple family households (1.3%) and 517 of the single-parent households (45.0%) are living below the poverty level. Within the married-couple family households, those with no children have the highest poverty rate, with 14 households (1.8%) falling below the poverty line. Among the single-parent households, those with 5 or more children have the highest poverty rate, with 33 household (100.0%) living below poverty.
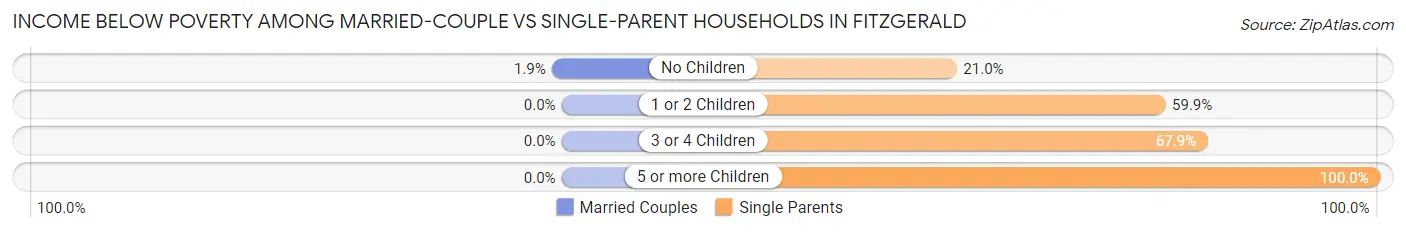
| Children | Married-Couple Families | Single-Parent Households |
| No Children | 14 (1.8%) | 101 (21.0%) |
| 1 or 2 Children | 0 (0.0%) | 364 (59.9%) |
| 3 or 4 Children | 0 (0.0%) | 19 (67.9%) |
| 5 or more Children | 0 (0.0%) | 33 (100.0%) |
| Total | 14 (1.3%) | 517 (45.0%) |
Race in Fitzgerald
The most populous races in Fitzgerald are Black / African American (4,851 | 54.1%), White / Caucasian (3,913 | 43.6%), and Two or more Races (121 | 1.3%).
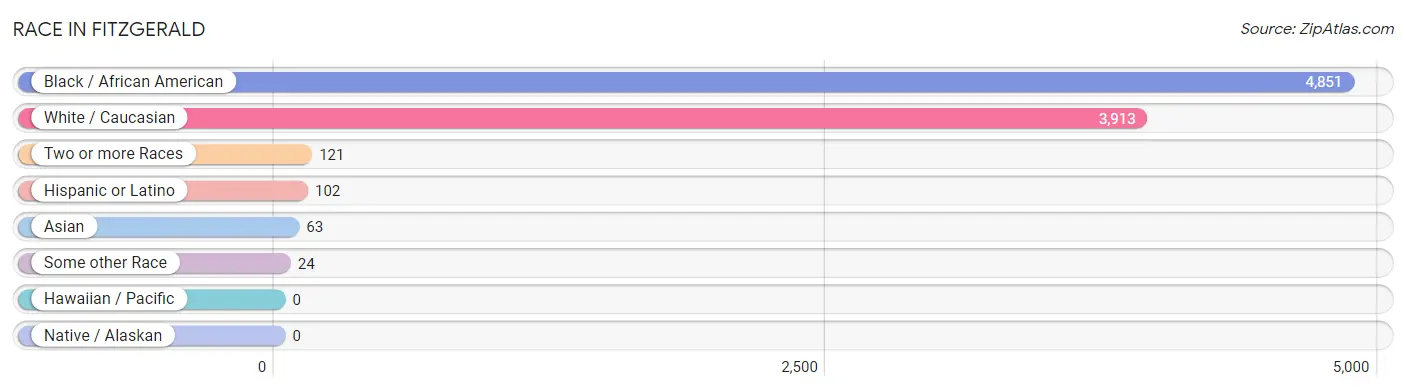
| Race | # Population | % Population |
| Asian | 63 | 0.7% |
| Black / African American | 4,851 | 54.1% |
| Hawaiian / Pacific | 0 | 0.0% |
| Hispanic or Latino | 102 | 1.1% |
| Native / Alaskan | 0 | 0.0% |
| White / Caucasian | 3,913 | 43.6% |
| Two or more Races | 121 | 1.3% |
| Some other Race | 24 | 0.3% |
| Total | 8,972 | 100.0% |
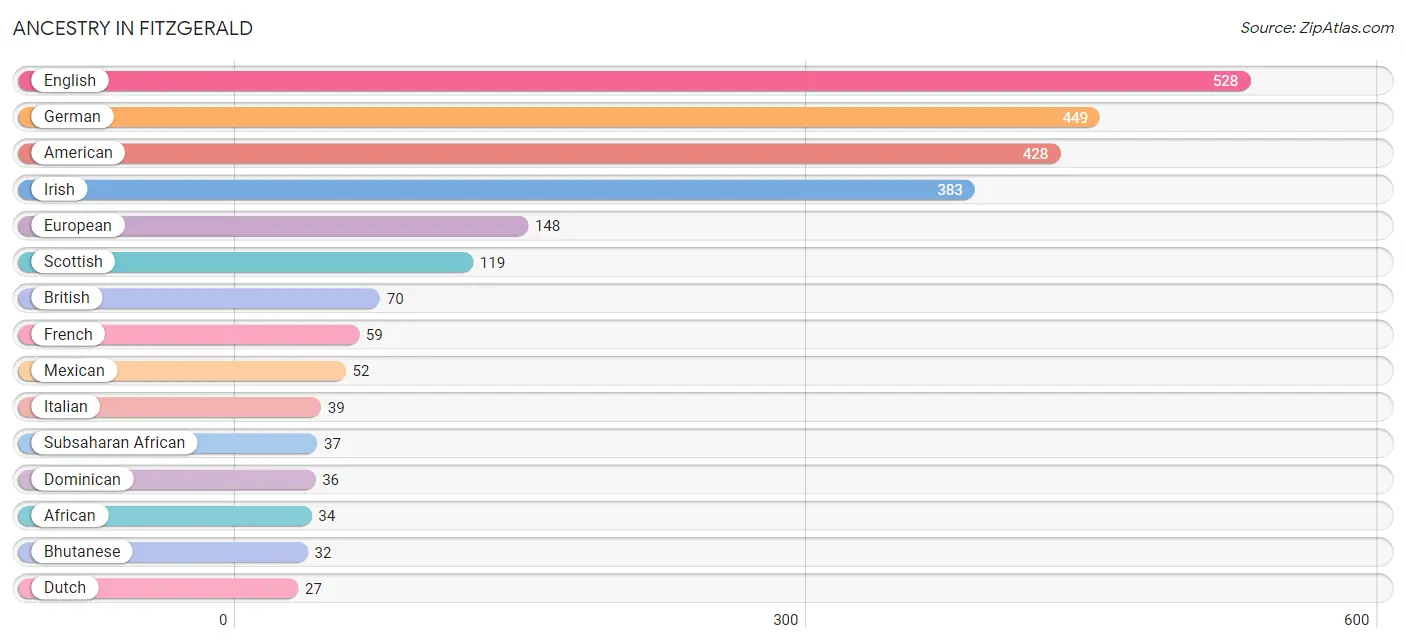
Ancestry in Fitzgerald
The most populous ancestries reported in Fitzgerald are English (528 | 5.9%), German (449 | 5.0%), American (428 | 4.8%), Irish (383 | 4.3%), and European (148 | 1.7%), together accounting for 21.6% of all Fitzgerald residents.
| Ancestry | # Population | % Population |
| African | 34 | 0.4% |
| American | 428 | 4.8% |
| Bhutanese | 32 | 0.4% |
| British | 70 | 0.8% |
| Burmese | 9 | 0.1% |
| Cherokee | 10 | 0.1% |
| Colombian | 14 | 0.2% |
| Croatian | 20 | 0.2% |
| Dominican | 36 | 0.4% |
| Dutch | 27 | 0.3% |
| Eastern European | 10 | 0.1% |
| English | 528 | 5.9% |
| European | 148 | 1.7% |
| French | 59 | 0.7% |
| German | 449 | 5.0% |
| Hungarian | 13 | 0.1% |
| Indian (Asian) | 14 | 0.2% |
| Irish | 383 | 4.3% |
| Italian | 39 | 0.4% |
| Jamaican | 12 | 0.1% |
| Korean | 14 | 0.2% |
| Mexican | 52 | 0.6% |
| Scotch-Irish | 19 | 0.2% |
| Scottish | 119 | 1.3% |
| South American | 14 | 0.2% |
| Subsaharan African | 37 | 0.4% |
| Welsh | 10 | 0.1% | View All 27 Rows |
Immigrants in Fitzgerald
The most numerous immigrant groups reported in Fitzgerald came from Latin America (81 | 0.9%), Central America (42 | 0.5%), Asia (31 | 0.4%), Caribbean (25 | 0.3%), and Eastern Asia (23 | 0.3%), together accounting for 2.3% of all Fitzgerald residents.
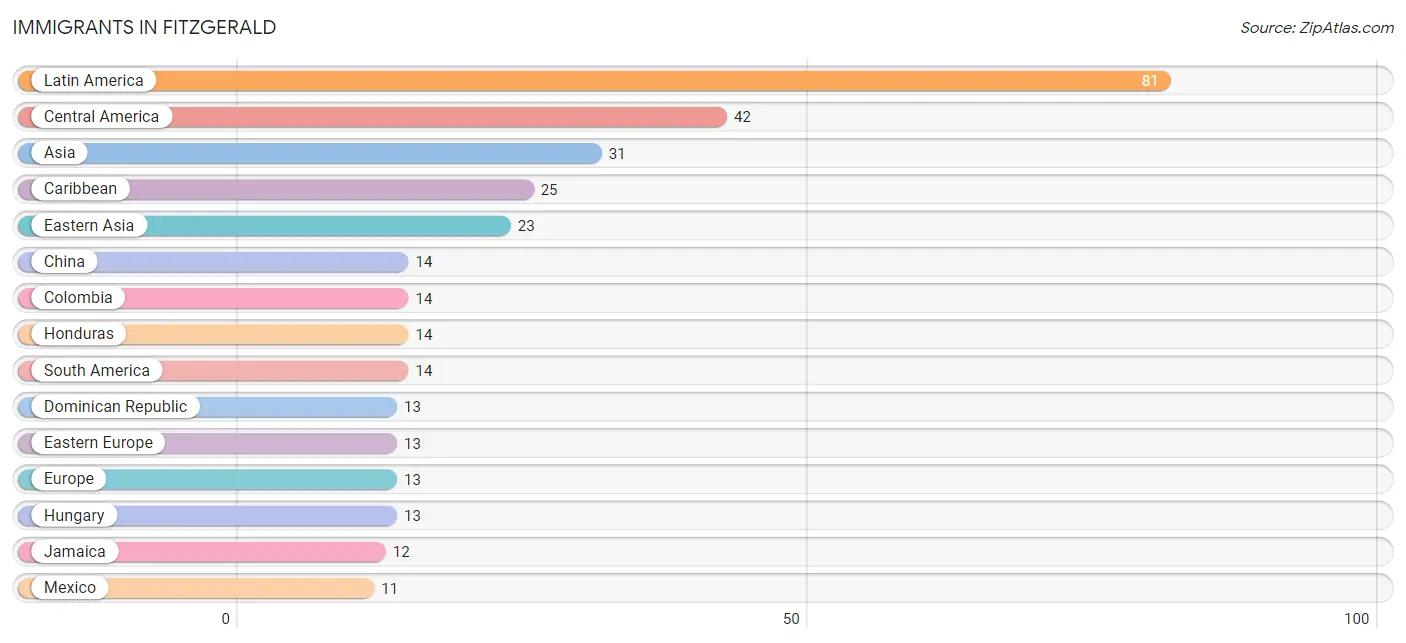
| Immigration Origin | # Population | % Population |
| Asia | 31 | 0.4% |
| Caribbean | 25 | 0.3% |
| Central America | 42 | 0.5% |
| China | 14 | 0.2% |
| Colombia | 14 | 0.2% |
| Dominican Republic | 13 | 0.1% |
| Eastern Asia | 23 | 0.3% |
| Eastern Europe | 13 | 0.1% |
| Europe | 13 | 0.1% |
| Honduras | 14 | 0.2% |
| Hungary | 13 | 0.1% |
| Jamaica | 12 | 0.1% |
| Korea | 9 | 0.1% |
| Latin America | 81 | 0.9% |
| Mexico | 11 | 0.1% |
| Pakistan | 8 | 0.1% |
| South America | 14 | 0.2% |
| South Central Asia | 8 | 0.1% | View All 18 Rows |
Sex and Age in Fitzgerald
Sex and Age in Fitzgerald
The most populous age groups in Fitzgerald are 10 to 14 Years (529 | 13.3%) for men and 60 to 64 Years (460 | 9.2%) for women.
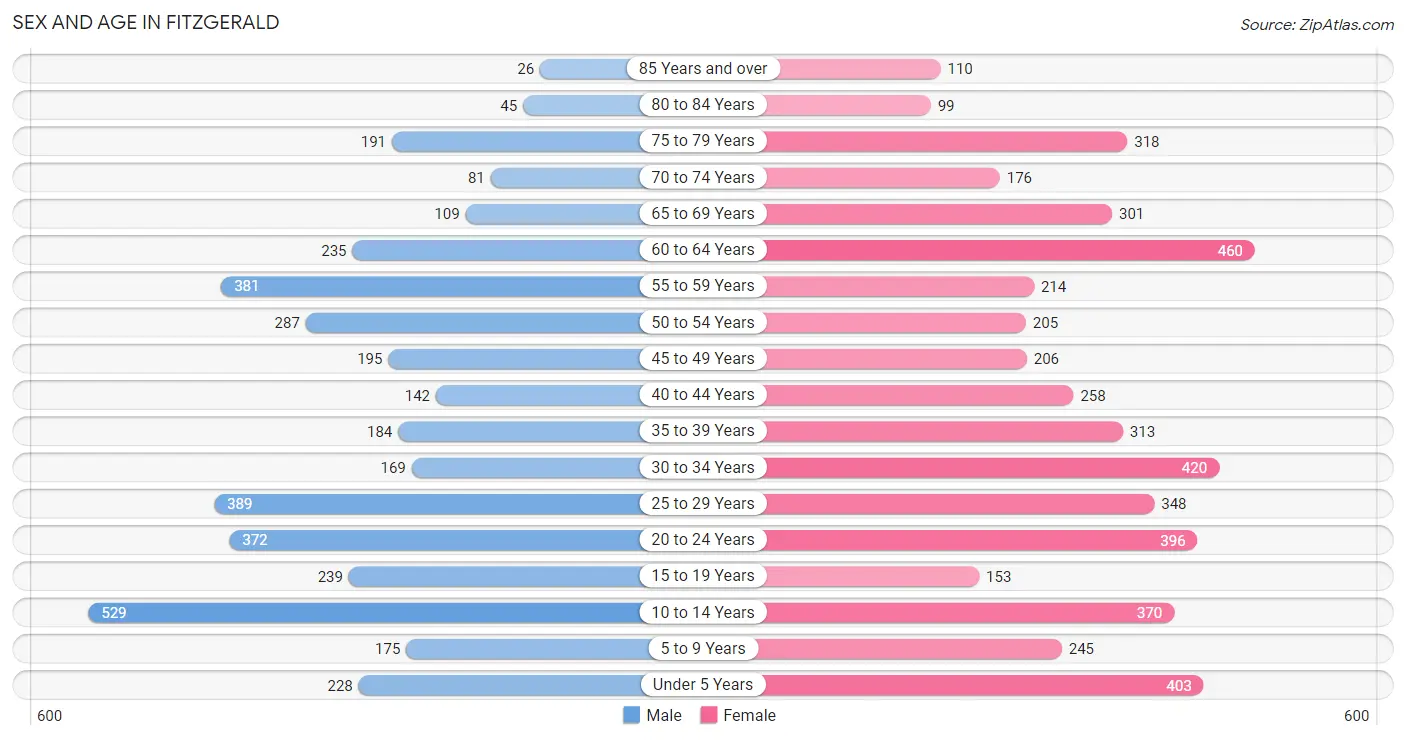
| Age Bracket | Male | Female |
| Under 5 Years | 228 (5.7%) | 403 (8.1%) |
| 5 to 9 Years | 175 (4.4%) | 245 (4.9%) |
| 10 to 14 Years | 529 (13.3%) | 370 (7.4%) |
| 15 to 19 Years | 239 (6.0%) | 153 (3.1%) |
| 20 to 24 Years | 372 (9.3%) | 396 (7.9%) |
| 25 to 29 Years | 389 (9.8%) | 348 (7.0%) |
| 30 to 34 Years | 169 (4.3%) | 420 (8.4%) |
| 35 to 39 Years | 184 (4.6%) | 313 (6.3%) |
| 40 to 44 Years | 142 (3.6%) | 258 (5.2%) |
| 45 to 49 Years | 195 (4.9%) | 206 (4.1%) |
| 50 to 54 Years | 287 (7.2%) | 205 (4.1%) |
| 55 to 59 Years | 381 (9.6%) | 214 (4.3%) |
| 60 to 64 Years | 235 (5.9%) | 460 (9.2%) |
| 65 to 69 Years | 109 (2.7%) | 301 (6.0%) |
| 70 to 74 Years | 81 (2.0%) | 176 (3.5%) |
| 75 to 79 Years | 191 (4.8%) | 318 (6.4%) |
| 80 to 84 Years | 45 (1.1%) | 99 (2.0%) |
| 85 Years and over | 26 (0.6%) | 110 (2.2%) |
| Total | 3,977 (100.0%) | 4,995 (100.0%) |
Families and Households in Fitzgerald
Median Family Size in Fitzgerald
The median family size in Fitzgerald is 3.07 persons per family, with married-couple families (1,090 | 48.7%) accounting for the largest median family size of 3.25 persons per family. On the other hand, single male/father families (167 | 7.5%) represent the smallest median family size with 2.44 persons per family.
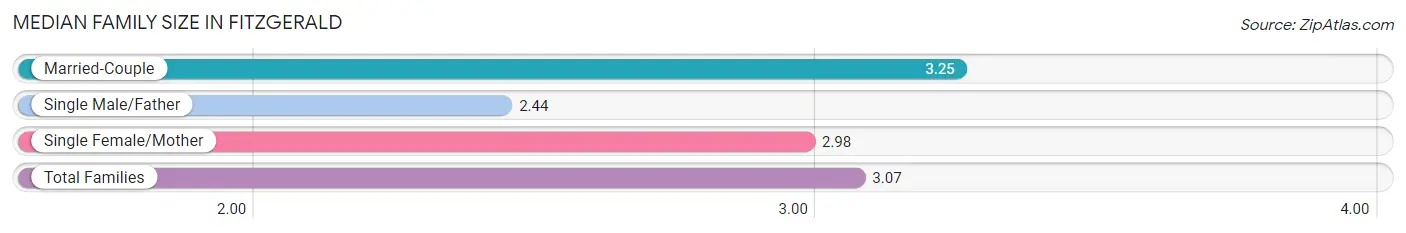
| Family Type | # Families | Family Size |
| Married-Couple | 1,090 (48.7%) | 3.25 |
| Single Male/Father | 167 (7.5%) | 2.44 |
| Single Female/Mother | 983 (43.9%) | 2.98 |
| Total Families | 2,240 (100.0%) | 3.07 |
Median Household Size in Fitzgerald
The median household size in Fitzgerald is 2.29 persons per household, with married-couple households (1,090 | 28.8%) accounting for the largest median household size of 3.26 persons per household. non-family households (1,538 | 40.7%) represent the smallest median household size with 1.11 persons per household.
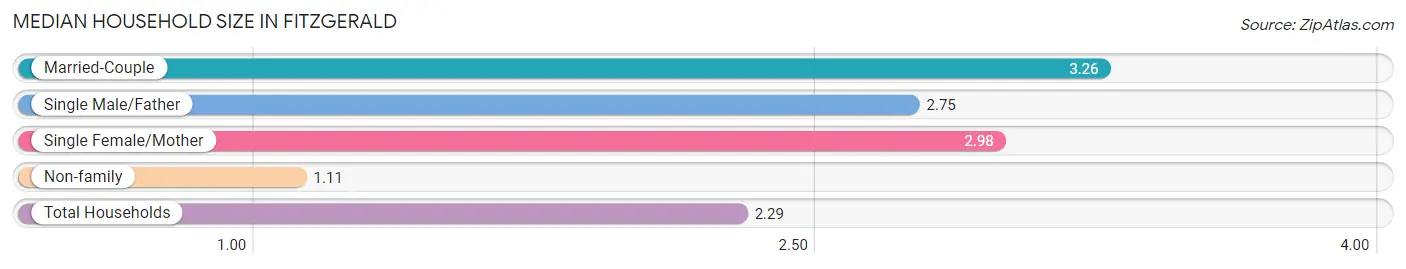
| Household Type | # Households | Household Size |
| Married-Couple | 1,090 (28.8%) | 3.26 |
| Single Male/Father | 167 (4.4%) | 2.75 |
| Single Female/Mother | 983 (26.0%) | 2.98 |
| Non-family | 1,538 (40.7%) | 1.11 |
| Total Households | 3,778 (100.0%) | 2.29 |
Household Size by Marriage Status in Fitzgerald
Out of a total of 3,778 households in Fitzgerald, 2,240 (59.3%) are family households, while 1,538 (40.7%) are nonfamily households. The most numerous type of family households are 2-person households, comprising 1,253, and the most common type of nonfamily households are 1-person households, comprising 1,407.
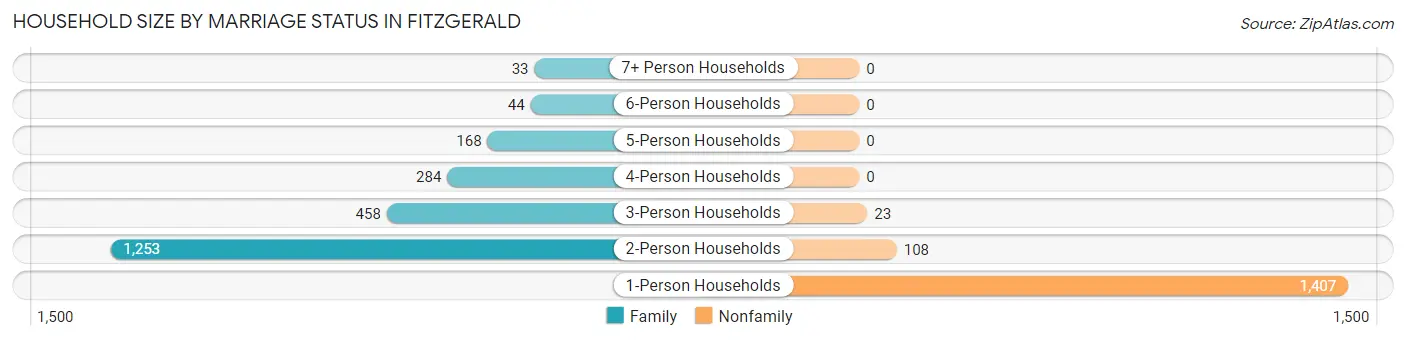
| Household Size | Family Households | Nonfamily Households |
| 1-Person Households | - | 1,407 (37.2%) |
| 2-Person Households | 1,253 (33.2%) | 108 (2.9%) |
| 3-Person Households | 458 (12.1%) | 23 (0.6%) |
| 4-Person Households | 284 (7.5%) | 0 (0.0%) |
| 5-Person Households | 168 (4.4%) | 0 (0.0%) |
| 6-Person Households | 44 (1.2%) | 0 (0.0%) |
| 7+ Person Households | 33 (0.9%) | 0 (0.0%) |
| Total | 2,240 (59.3%) | 1,538 (40.7%) |
Female Fertility in Fitzgerald
Fertility by Age in Fitzgerald
Average fertility rate in Fitzgerald is 66.0 births per 1,000 women. Women in the age bracket of 20 to 34 years have the highest fertility rate with 119.0 births per 1,000 women. Women in the age bracket of 20 to 34 years acount for 100.0% of all women with births.
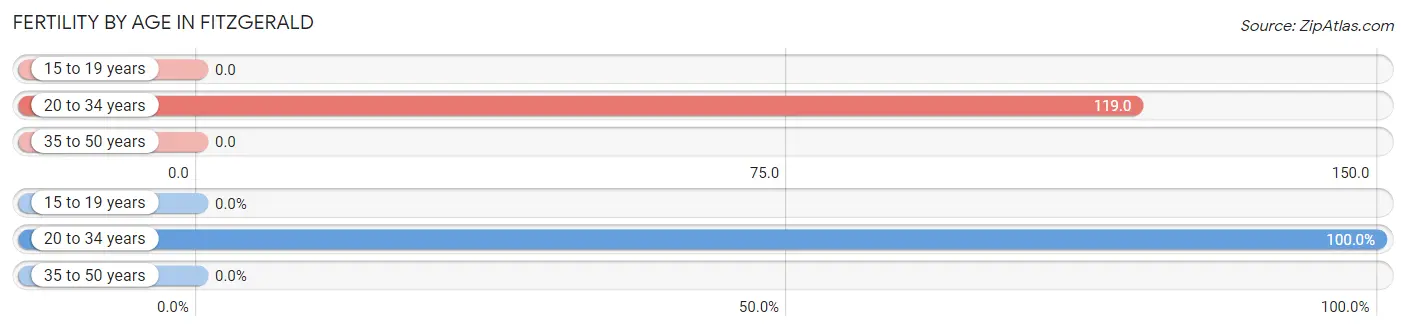
| Age Bracket | Women with Births | Births / 1,000 Women |
| 15 to 19 years | 0 (0.0%) | 0.0 |
| 20 to 34 years | 139 (100.0%) | 119.0 |
| 35 to 50 years | 0 (0.0%) | 0.0 |
| Total | 139 (100.0%) | 66.0 |
Fertility by Age by Marriage Status in Fitzgerald
46.0% of women with births (139) in Fitzgerald are married. The highest percentage of unmarried women with births falls into 20 to 34 years age bracket with 54.0% of them unmarried at the time of birth, while the lowest percentage of unmarried women with births belong to 20 to 34 years age bracket with 54.0% of them unmarried.
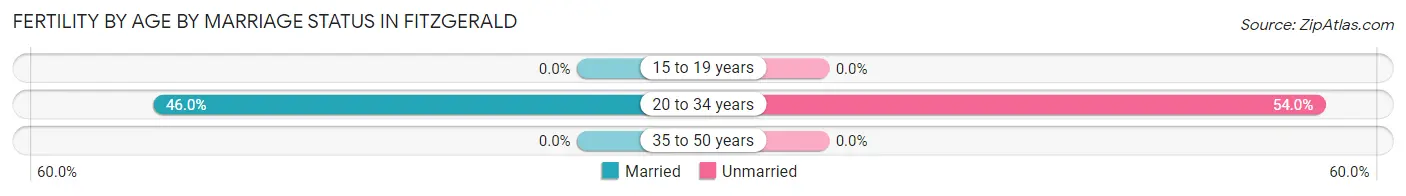
| Age Bracket | Married | Unmarried |
| 15 to 19 years | 0 (0.0%) | 0 (0.0%) |
| 20 to 34 years | 64 (46.0%) | 75 (54.0%) |
| 35 to 50 years | 0 (0.0%) | 0 (0.0%) |
| Total | 64 (46.0%) | 75 (54.0%) |
Fertility by Education in Fitzgerald
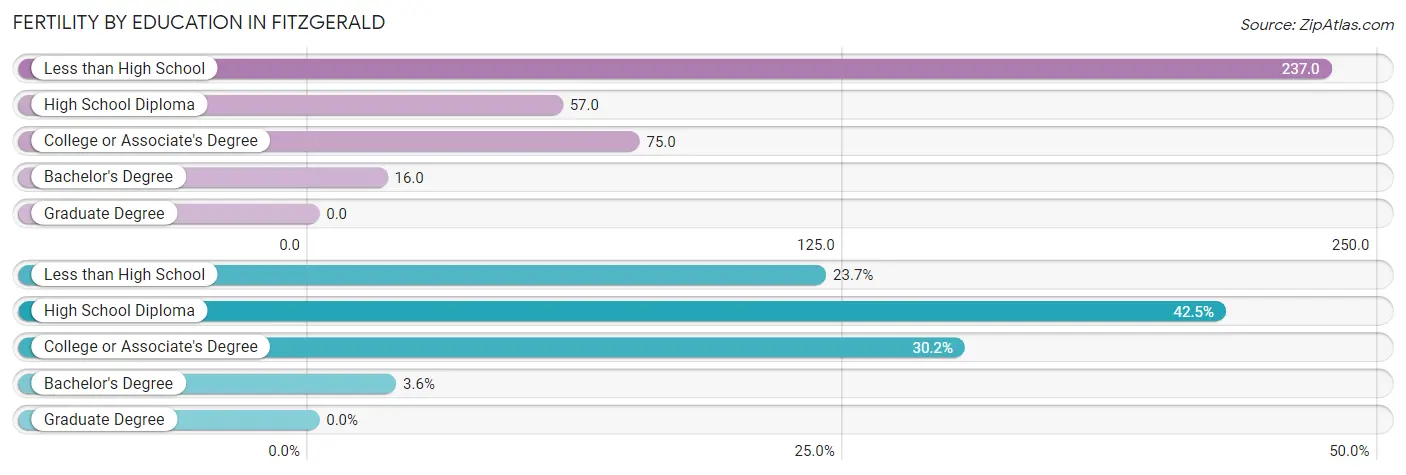
| Educational Attainment | Women with Births | Births / 1,000 Women |
| Less than High School | 33 (23.7%) | 237.0 |
| High School Diploma | 59 (42.4%) | 57.0 |
| College or Associate's Degree | 42 (30.2%) | 75.0 |
| Bachelor's Degree | 5 (3.6%) | 16.0 |
| Graduate Degree | 0 (0.0%) | 0.0 |
| Total | 139 (100.0%) | 66.0 |
Fertility by Education by Marriage Status in Fitzgerald
54.0% of women with births in Fitzgerald are unmarried. Women with the educational attainment of high school diploma are most likely to be married with 100.0% of them married at childbirth, while women with the educational attainment of less than high school are least likely to be married with 100.0% of them unmarried at childbirth.
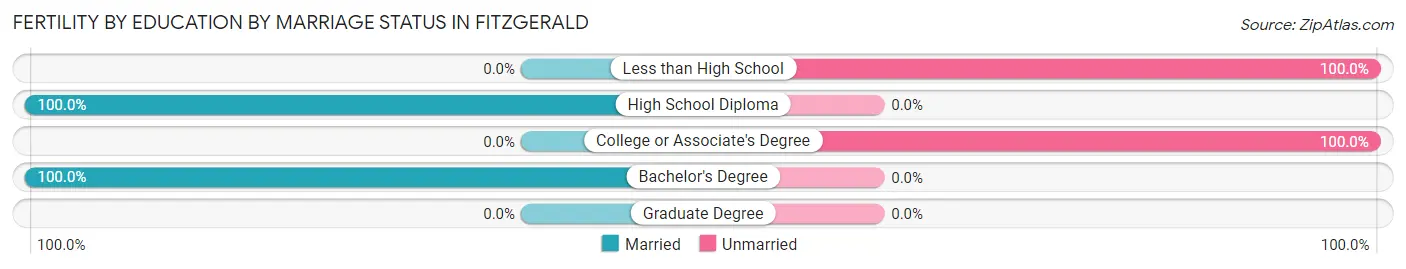
| Educational Attainment | Married | Unmarried |
| Less than High School | 0 (0.0%) | 33 (100.0%) |
| High School Diploma | 59 (100.0%) | 0 (0.0%) |
| College or Associate's Degree | 0 (0.0%) | 42 (100.0%) |
| Bachelor's Degree | 5 (100.0%) | 0 (0.0%) |
| Graduate Degree | 0 (0.0%) | 0 (0.0%) |
| Total | 64 (46.0%) | 75 (54.0%) |
Employment Characteristics in Fitzgerald
Employment by Class of Employer in Fitzgerald
Among the 3,766 employed individuals in Fitzgerald, private company employees (2,510 | 66.6%), local government employees (433 | 11.5%), and not-for-profit organizations (218 | 5.8%) make up the most common classes of employment.
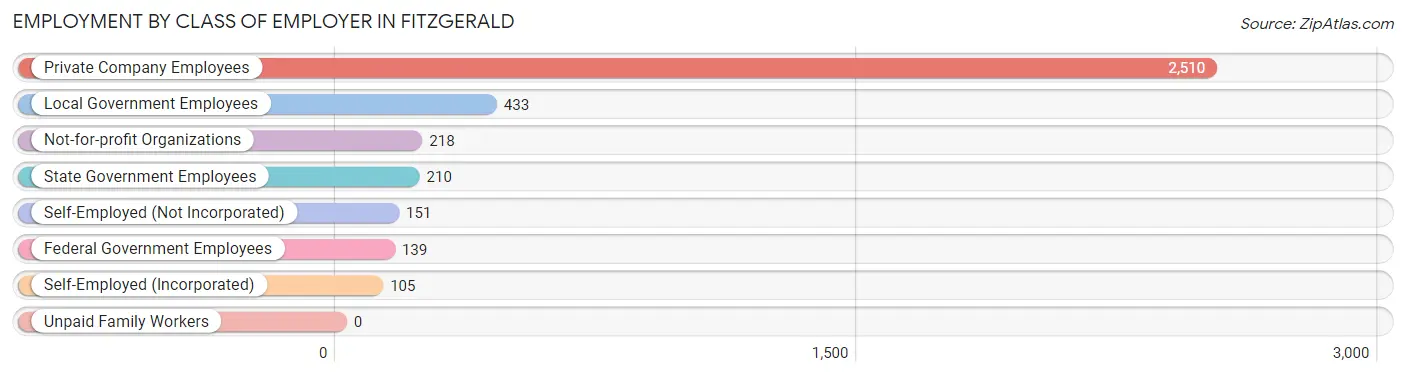
| Employer Class | # Employees | % Employees |
| Private Company Employees | 2,510 | 66.6% |
| Self-Employed (Incorporated) | 105 | 2.8% |
| Self-Employed (Not Incorporated) | 151 | 4.0% |
| Not-for-profit Organizations | 218 | 5.8% |
| Local Government Employees | 433 | 11.5% |
| State Government Employees | 210 | 5.6% |
| Federal Government Employees | 139 | 3.7% |
| Unpaid Family Workers | 0 | 0.0% |
| Total | 3,766 | 100.0% |
Employment Status by Age in Fitzgerald
According to the labor force statistics for Fitzgerald, out of the total population over 16 years of age (6,890), 58.3% or 4,017 individuals are in the labor force, with 6.1% or 245 of them unemployed. The age group with the highest labor force participation rate is 35 to 44 years, with 82.8% or 743 individuals in the labor force. Within the labor force, the 16 to 19 years age range has the highest percentage of unemployed individuals, with 30.9% or 46 of them being unemployed.
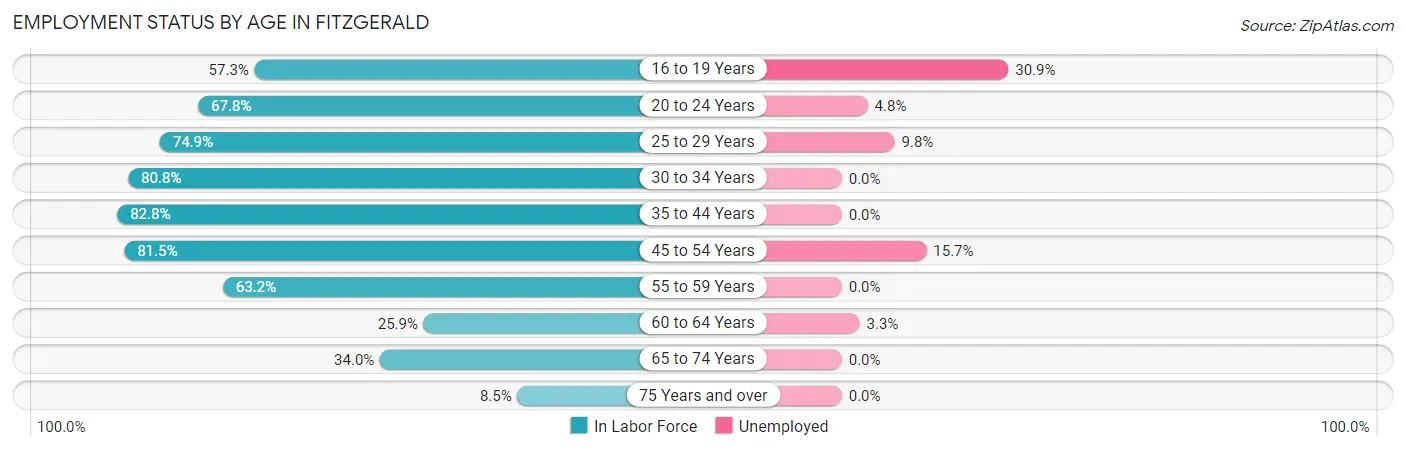
| Age Bracket | In Labor Force | Unemployed |
| 16 to 19 Years | 149 (57.3%) | 46 (30.9%) |
| 20 to 24 Years | 521 (67.8%) | 25 (4.8%) |
| 25 to 29 Years | 552 (74.9%) | 54 (9.8%) |
| 30 to 34 Years | 476 (80.8%) | 0 (0.0%) |
| 35 to 44 Years | 743 (82.8%) | 0 (0.0%) |
| 45 to 54 Years | 728 (81.5%) | 114 (15.7%) |
| 55 to 59 Years | 376 (63.2%) | 0 (0.0%) |
| 60 to 64 Years | 180 (25.9%) | 6 (3.3%) |
| 65 to 74 Years | 227 (34.0%) | 0 (0.0%) |
| 75 Years and over | 67 (8.5%) | 0 (0.0%) |
| Total | 4,017 (58.3%) | 245 (6.1%) |
Employment Status by Educational Attainment in Fitzgerald
According to labor force statistics for Fitzgerald, 69.3% of individuals (3,053) out of the total population between 25 and 64 years of age (4,406) are in the labor force, with 5.7% or 174 of them being unemployed. The group with the highest labor force participation rate are those with the educational attainment of bachelor's degree or higher, with 84.3% or 565 individuals in the labor force. Within the labor force, individuals with college / associate degree education have the highest percentage of unemployment, with 7.0% or 49 of them being unemployed.
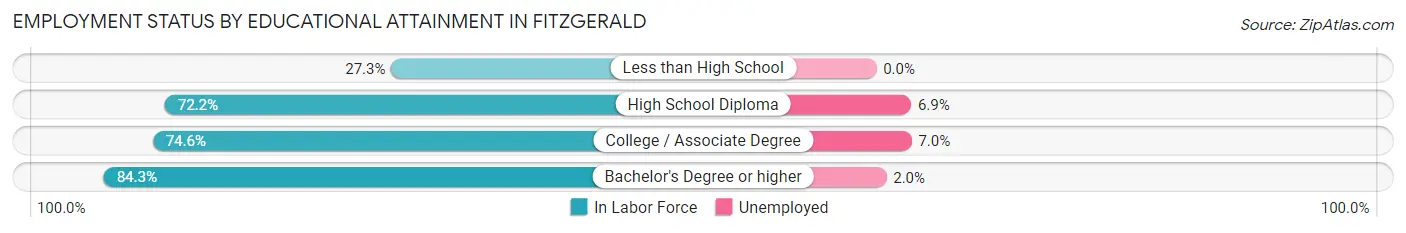
| Educational Attainment | In Labor Force | Unemployed |
| Less than High School | 140 (27.3%) | 0 (0.0%) |
| High School Diploma | 1,654 (72.2%) | 158 (6.9%) |
| College / Associate Degree | 696 (74.6%) | 65 (7.0%) |
| Bachelor's Degree or higher | 565 (84.3%) | 13 (2.0%) |
| Total | 3,053 (69.3%) | 251 (5.7%) |
Employment Occupations by Sex in Fitzgerald
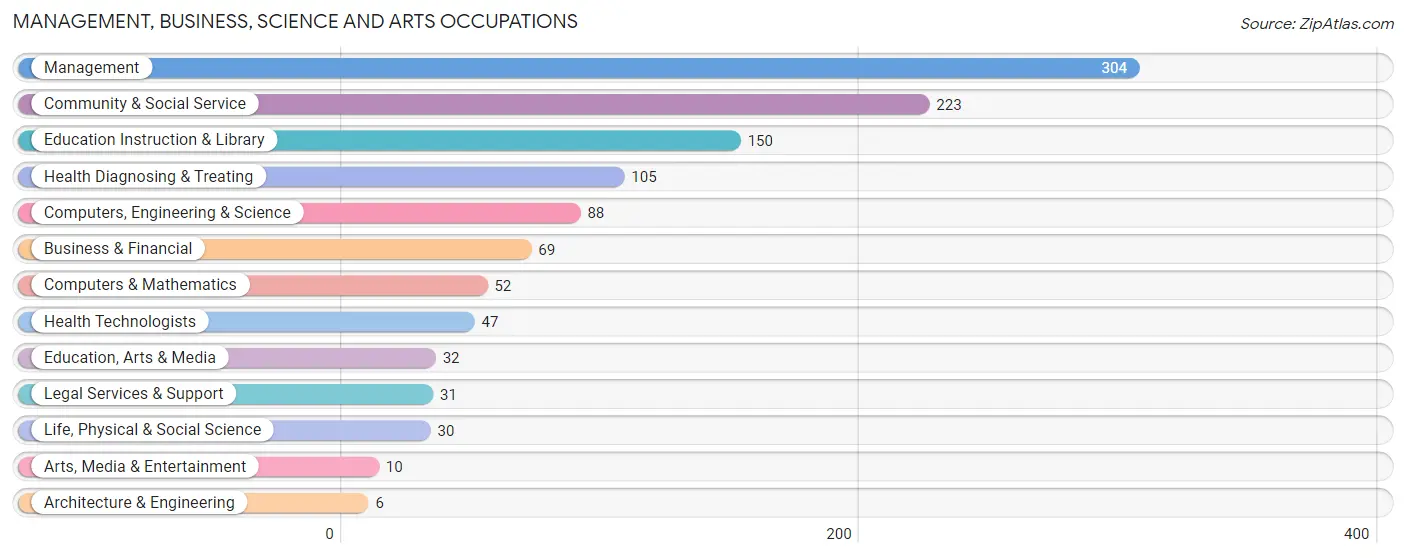
Management, Business, Science and Arts Occupations
The most common Management, Business, Science and Arts occupations in Fitzgerald are Management (304 | 8.1%), Community & Social Service (223 | 5.9%), Education Instruction & Library (150 | 4.0%), Health Diagnosing & Treating (105 | 2.8%), and Computers, Engineering & Science (88 | 2.4%).
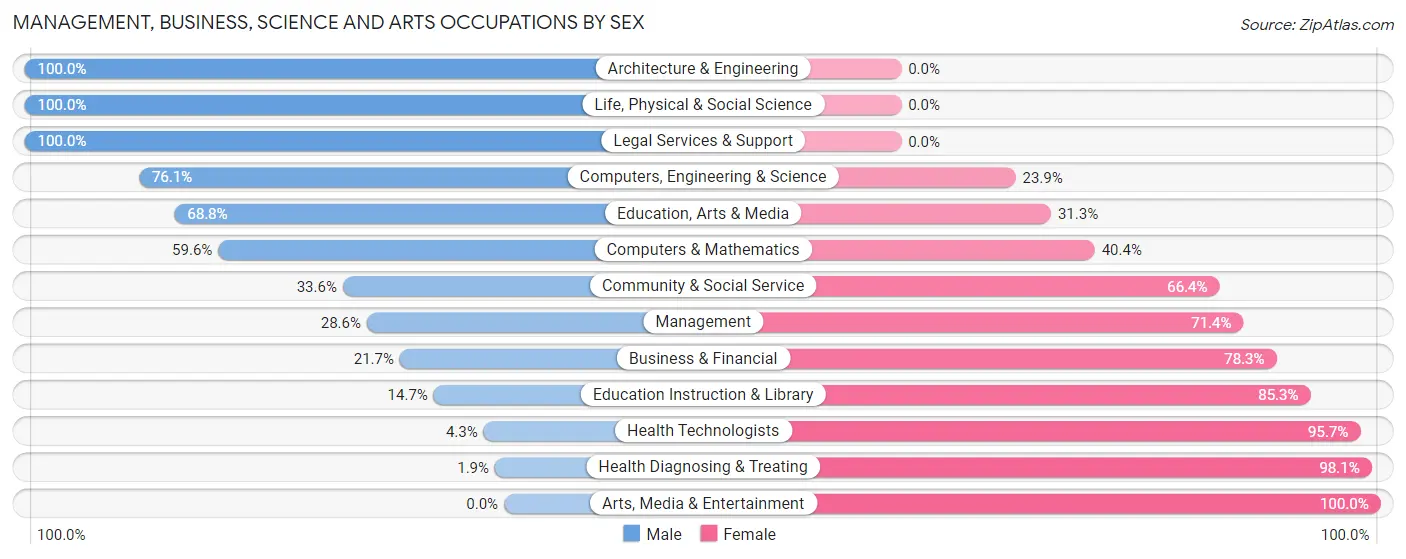
Management, Business, Science and Arts Occupations by Sex
Within the Management, Business, Science and Arts occupations in Fitzgerald, the most male-oriented occupations are Architecture & Engineering (100.0%), Life, Physical & Social Science (100.0%), and Legal Services & Support (100.0%), while the most female-oriented occupations are Arts, Media & Entertainment (100.0%), Health Diagnosing & Treating (98.1%), and Health Technologists (95.7%).
| Occupation | Male | Female |
| Management | 87 (28.6%) | 217 (71.4%) |
| Business & Financial | 15 (21.7%) | 54 (78.3%) |
| Computers, Engineering & Science | 67 (76.1%) | 21 (23.9%) |
| Computers & Mathematics | 31 (59.6%) | 21 (40.4%) |
| Architecture & Engineering | 6 (100.0%) | 0 (0.0%) |
| Life, Physical & Social Science | 30 (100.0%) | 0 (0.0%) |
| Community & Social Service | 75 (33.6%) | 148 (66.4%) |
| Education, Arts & Media | 22 (68.8%) | 10 (31.2%) |
| Legal Services & Support | 31 (100.0%) | 0 (0.0%) |
| Education Instruction & Library | 22 (14.7%) | 128 (85.3%) |
| Arts, Media & Entertainment | 0 (0.0%) | 10 (100.0%) |
| Health Diagnosing & Treating | 2 (1.9%) | 103 (98.1%) |
| Health Technologists | 2 (4.3%) | 45 (95.7%) |
| Total (Category) | 246 (31.2%) | 543 (68.8%) |
| Total (Overall) | 1,709 (45.6%) | 2,038 (54.4%) |
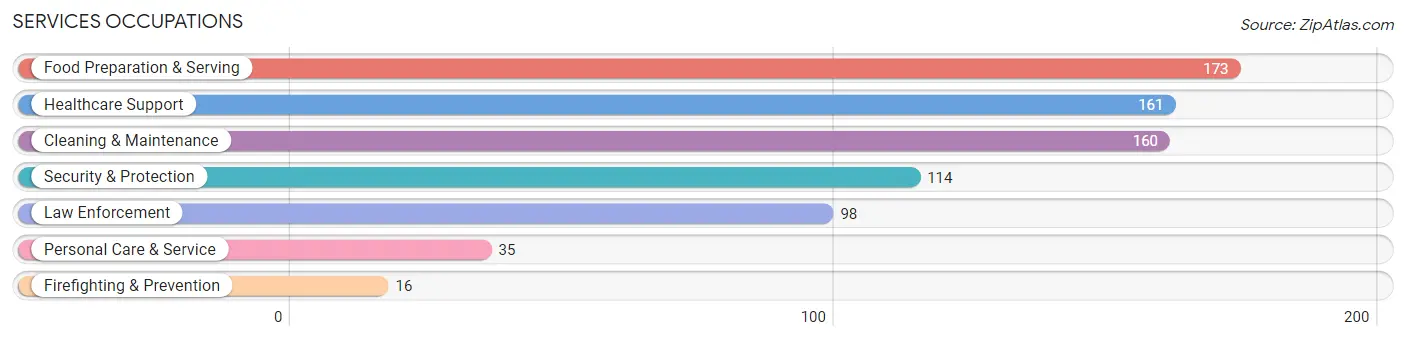
Services Occupations
The most common Services occupations in Fitzgerald are Food Preparation & Serving (173 | 4.6%), Healthcare Support (161 | 4.3%), Cleaning & Maintenance (160 | 4.3%), Security & Protection (114 | 3.0%), and Law Enforcement (98 | 2.6%).
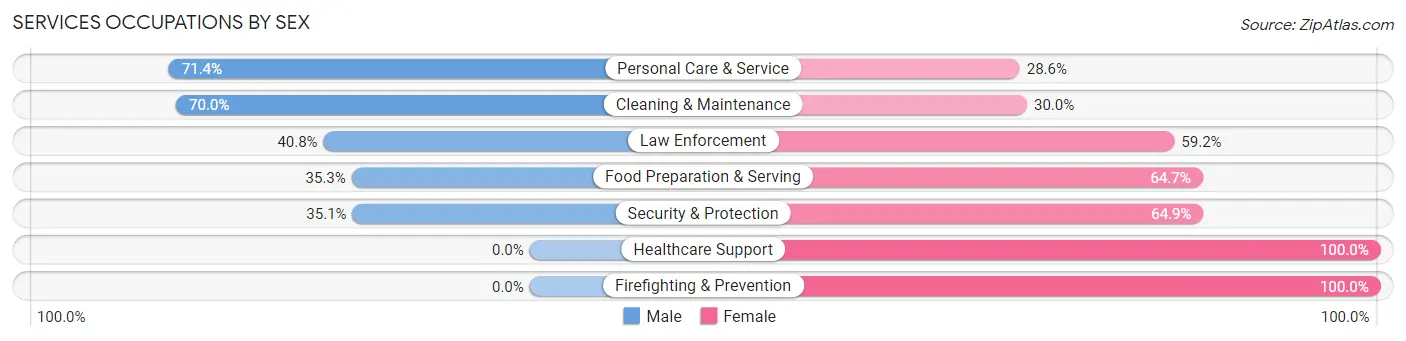
Services Occupations by Sex
Within the Services occupations in Fitzgerald, the most male-oriented occupations are Personal Care & Service (71.4%), Cleaning & Maintenance (70.0%), and Law Enforcement (40.8%), while the most female-oriented occupations are Healthcare Support (100.0%), Firefighting & Prevention (100.0%), and Security & Protection (64.9%).
| Occupation | Male | Female |
| Healthcare Support | 0 (0.0%) | 161 (100.0%) |
| Security & Protection | 40 (35.1%) | 74 (64.9%) |
| Firefighting & Prevention | 0 (0.0%) | 16 (100.0%) |
| Law Enforcement | 40 (40.8%) | 58 (59.2%) |
| Food Preparation & Serving | 61 (35.3%) | 112 (64.7%) |
| Cleaning & Maintenance | 112 (70.0%) | 48 (30.0%) |
| Personal Care & Service | 25 (71.4%) | 10 (28.6%) |
| Total (Category) | 238 (37.0%) | 405 (63.0%) |
| Total (Overall) | 1,709 (45.6%) | 2,038 (54.4%) |
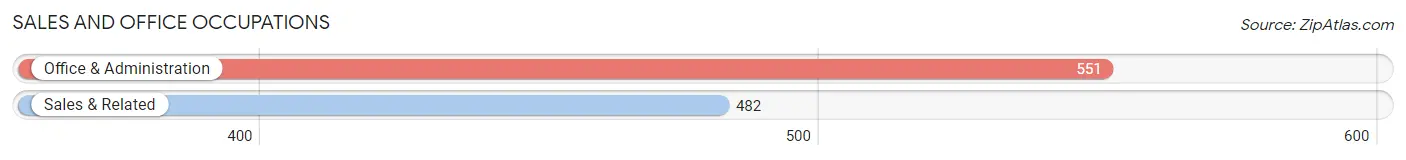
Sales and Office Occupations
The most common Sales and Office occupations in Fitzgerald are Office & Administration (551 | 14.7%), and Sales & Related (482 | 12.9%).
Sales and Office Occupations by Sex
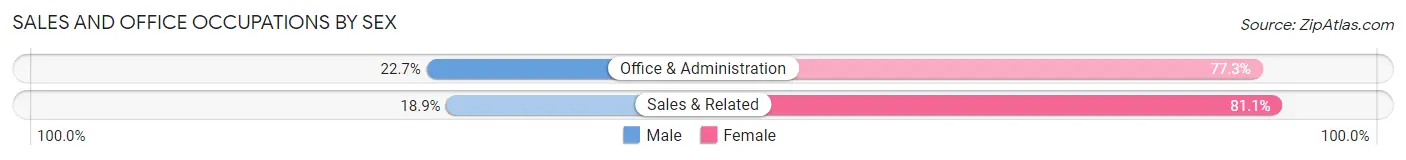
| Occupation | Male | Female |
| Sales & Related | 91 (18.9%) | 391 (81.1%) |
| Office & Administration | 125 (22.7%) | 426 (77.3%) |
| Total (Category) | 216 (20.9%) | 817 (79.1%) |
| Total (Overall) | 1,709 (45.6%) | 2,038 (54.4%) |
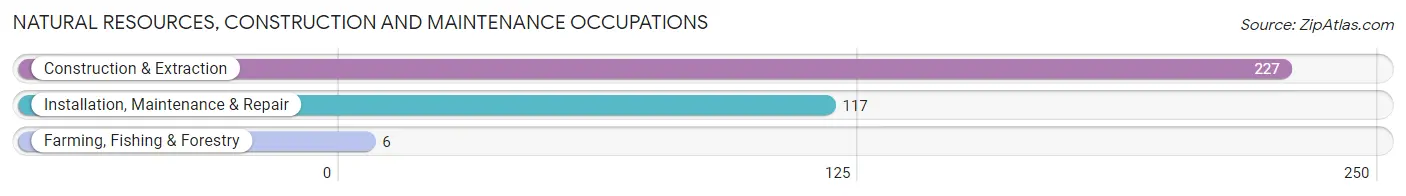
Natural Resources, Construction and Maintenance Occupations
The most common Natural Resources, Construction and Maintenance occupations in Fitzgerald are Construction & Extraction (227 | 6.1%), Installation, Maintenance & Repair (117 | 3.1%), and Farming, Fishing & Forestry (6 | 0.2%).
Natural Resources, Construction and Maintenance Occupations by Sex
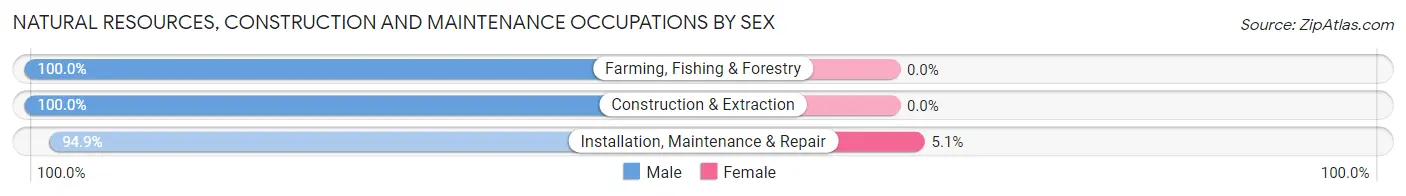
| Occupation | Male | Female |
| Farming, Fishing & Forestry | 6 (100.0%) | 0 (0.0%) |
| Construction & Extraction | 227 (100.0%) | 0 (0.0%) |
| Installation, Maintenance & Repair | 111 (94.9%) | 6 (5.1%) |
| Total (Category) | 344 (98.3%) | 6 (1.7%) |
| Total (Overall) | 1,709 (45.6%) | 2,038 (54.4%) |
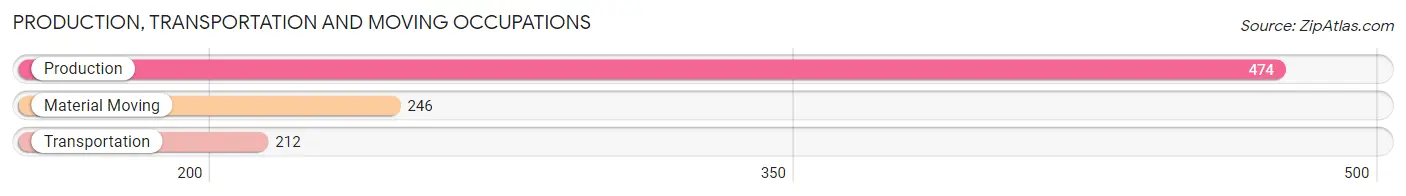
Production, Transportation and Moving Occupations
The most common Production, Transportation and Moving occupations in Fitzgerald are Production (474 | 12.7%), Material Moving (246 | 6.6%), and Transportation (212 | 5.7%).
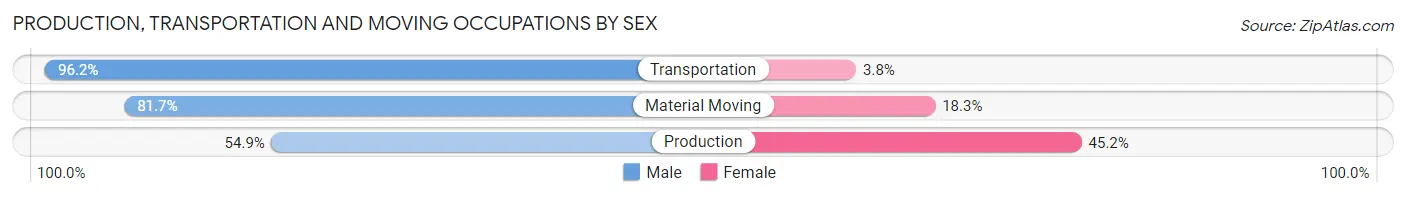
Production, Transportation and Moving Occupations by Sex
| Occupation | Male | Female |
| Production | 260 (54.8%) | 214 (45.2%) |
| Transportation | 204 (96.2%) | 8 (3.8%) |
| Material Moving | 201 (81.7%) | 45 (18.3%) |
| Total (Category) | 665 (71.4%) | 267 (28.6%) |
| Total (Overall) | 1,709 (45.6%) | 2,038 (54.4%) |
Employment Industries by Sex in Fitzgerald
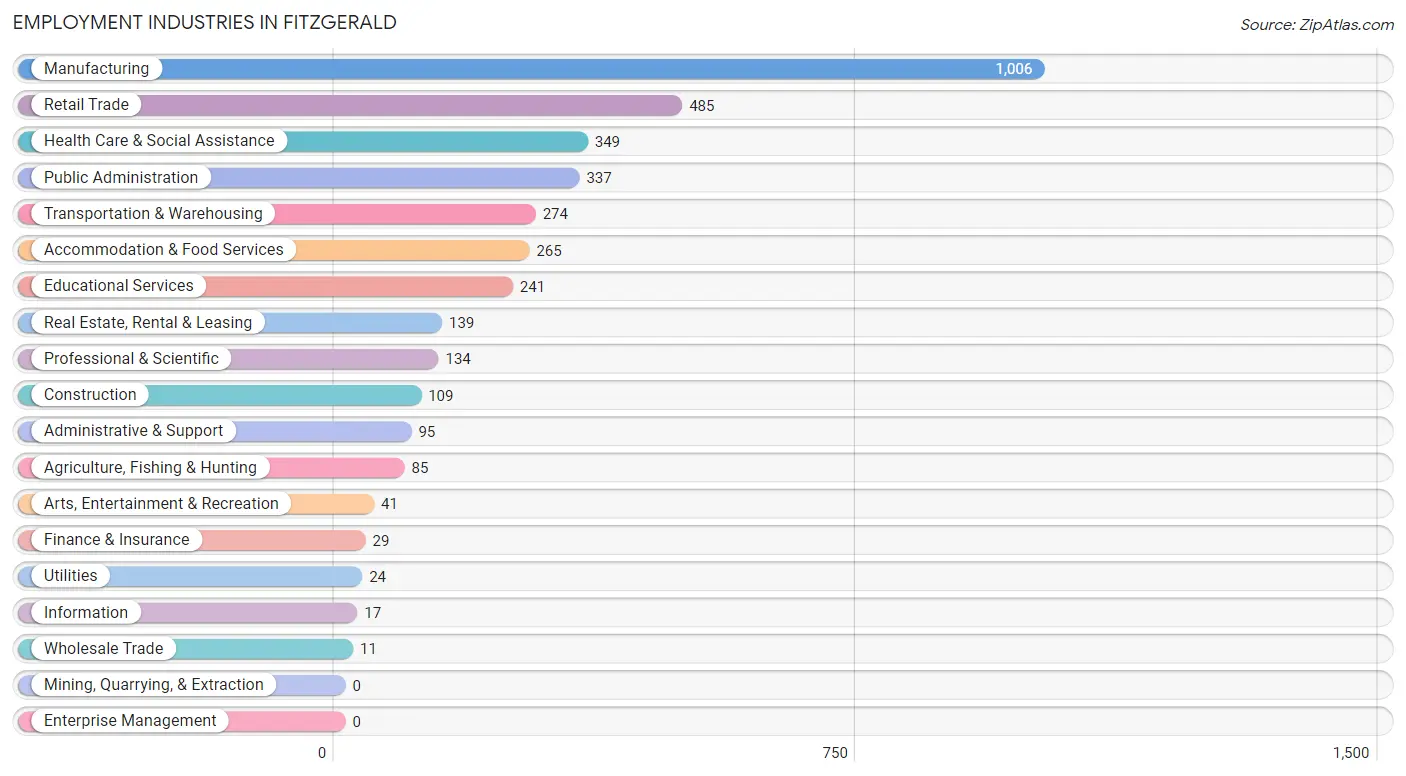
Employment Industries in Fitzgerald
The major employment industries in Fitzgerald include Manufacturing (1,006 | 26.9%), Retail Trade (485 | 12.9%), Health Care & Social Assistance (349 | 9.3%), Public Administration (337 | 9.0%), and Transportation & Warehousing (274 | 7.3%).
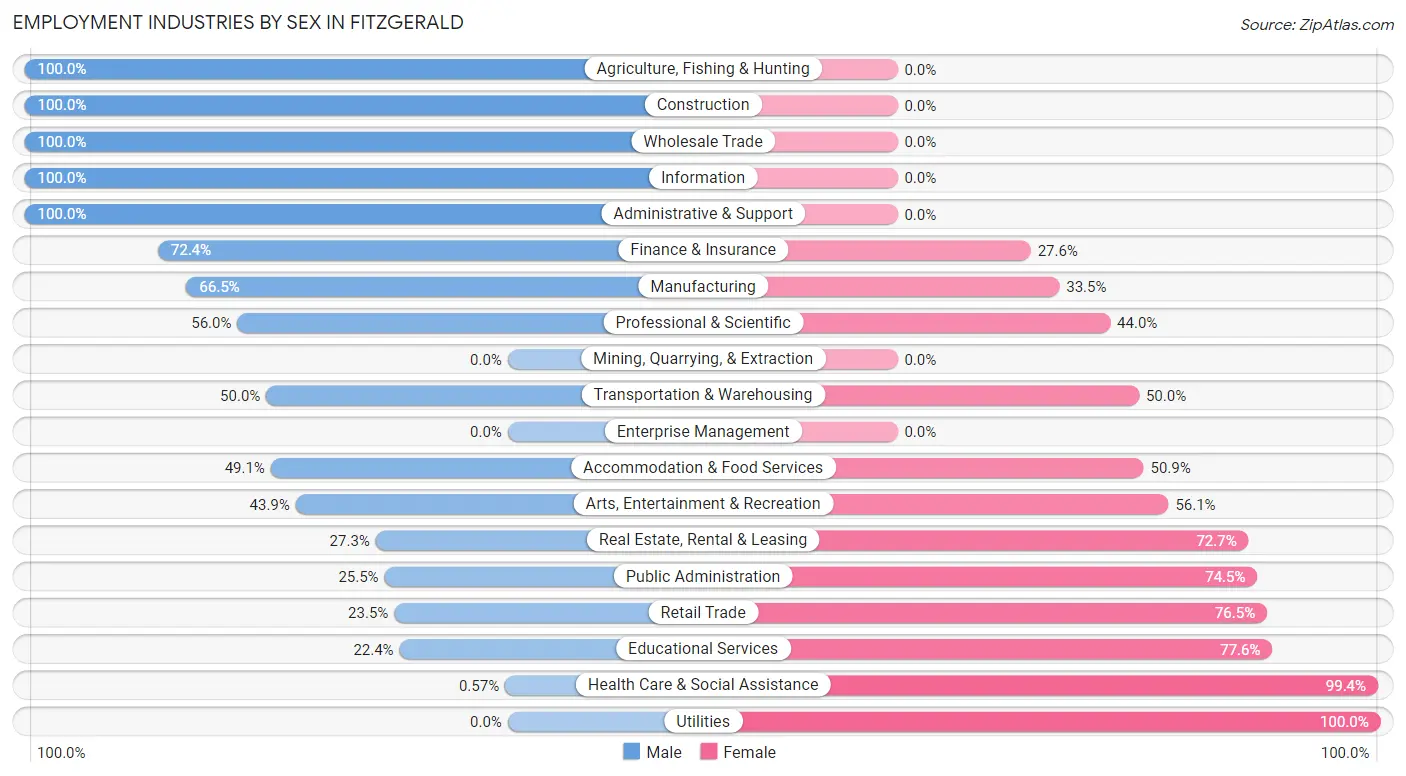
Employment Industries by Sex in Fitzgerald
The Fitzgerald industries that see more men than women are Agriculture, Fishing & Hunting (100.0%), Construction (100.0%), and Wholesale Trade (100.0%), whereas the industries that tend to have a higher number of women are Utilities (100.0%), Health Care & Social Assistance (99.4%), and Educational Services (77.6%).
| Industry | Male | Female |
| Agriculture, Fishing & Hunting | 85 (100.0%) | 0 (0.0%) |
| Mining, Quarrying, & Extraction | 0 (0.0%) | 0 (0.0%) |
| Construction | 109 (100.0%) | 0 (0.0%) |
| Manufacturing | 669 (66.5%) | 337 (33.5%) |
| Wholesale Trade | 11 (100.0%) | 0 (0.0%) |
| Retail Trade | 114 (23.5%) | 371 (76.5%) |
| Transportation & Warehousing | 137 (50.0%) | 137 (50.0%) |
| Utilities | 0 (0.0%) | 24 (100.0%) |
| Information | 17 (100.0%) | 0 (0.0%) |
| Finance & Insurance | 21 (72.4%) | 8 (27.6%) |
| Real Estate, Rental & Leasing | 38 (27.3%) | 101 (72.7%) |
| Professional & Scientific | 75 (56.0%) | 59 (44.0%) |
| Enterprise Management | 0 (0.0%) | 0 (0.0%) |
| Administrative & Support | 95 (100.0%) | 0 (0.0%) |
| Educational Services | 54 (22.4%) | 187 (77.6%) |
| Health Care & Social Assistance | 2 (0.6%) | 347 (99.4%) |
| Arts, Entertainment & Recreation | 18 (43.9%) | 23 (56.1%) |
| Accommodation & Food Services | 130 (49.1%) | 135 (50.9%) |
| Public Administration | 86 (25.5%) | 251 (74.5%) |
| Total | 1,709 (45.6%) | 2,038 (54.4%) |
Education in Fitzgerald
School Enrollment in Fitzgerald
The most common levels of schooling among the 1,791 students in Fitzgerald are middle school (593 | 33.1%), elementary school (540 | 30.1%), and high school (328 | 18.3%).
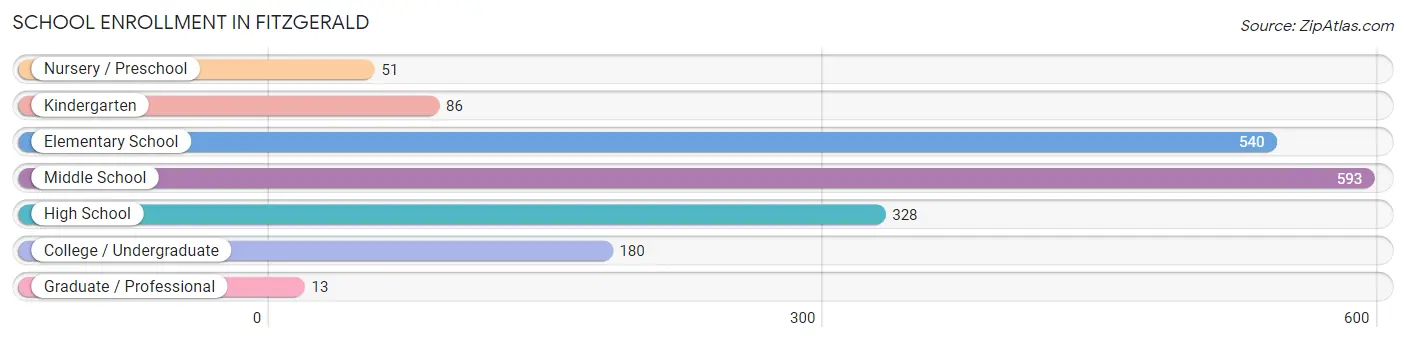
| School Level | # Students | % Students |
| Nursery / Preschool | 51 | 2.9% |
| Kindergarten | 86 | 4.8% |
| Elementary School | 540 | 30.1% |
| Middle School | 593 | 33.1% |
| High School | 328 | 18.3% |
| College / Undergraduate | 180 | 10.1% |
| Graduate / Professional | 13 | 0.7% |
| Total | 1,791 | 100.0% |
School Enrollment by Age by Funding Source in Fitzgerald
Out of a total of 1,791 students who are enrolled in schools in Fitzgerald, 226 (12.6%) attend a private institution, while the remaining 1,565 (87.4%) are enrolled in public schools. The age group of 25 to 34 year olds has the highest likelihood of being enrolled in private schools, with 45 (46.9% in the age bracket) enrolled. Conversely, the age group of 3 to 4 year olds has the lowest likelihood of being enrolled in a private school, with 51 (100.0% in the age bracket) attending a public institution.
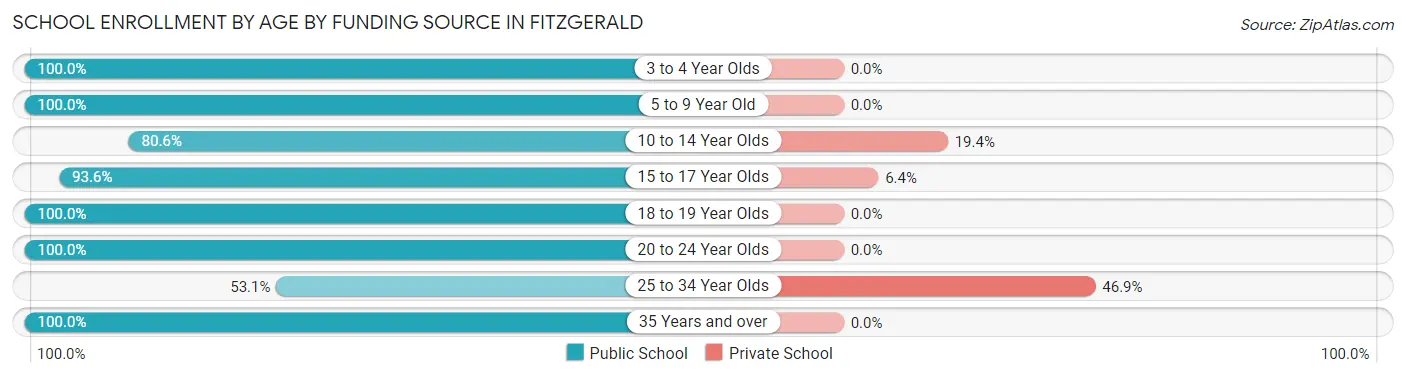
| Age Bracket | Public School | Private School |
| 3 to 4 Year Olds | 51 (100.0%) | 0 (0.0%) |
| 5 to 9 Year Old | 420 (100.0%) | 0 (0.0%) |
| 10 to 14 Year Olds | 678 (80.6%) | 163 (19.4%) |
| 15 to 17 Year Olds | 262 (93.6%) | 18 (6.4%) |
| 18 to 19 Year Olds | 39 (100.0%) | 0 (0.0%) |
| 20 to 24 Year Olds | 56 (100.0%) | 0 (0.0%) |
| 25 to 34 Year Olds | 51 (53.1%) | 45 (46.9%) |
| 35 Years and over | 8 (100.0%) | 0 (0.0%) |
| Total | 1,565 (87.4%) | 226 (12.6%) |
Educational Attainment by Field of Study in Fitzgerald
Business (279 | 29.7%), science & technology (118 | 12.6%), bio, nature & agricultural (115 | 12.2%), arts & humanities (84 | 8.9%), and education (77 | 8.2%) are the most common fields of study among 939 individuals in Fitzgerald who have obtained a bachelor's degree or higher.
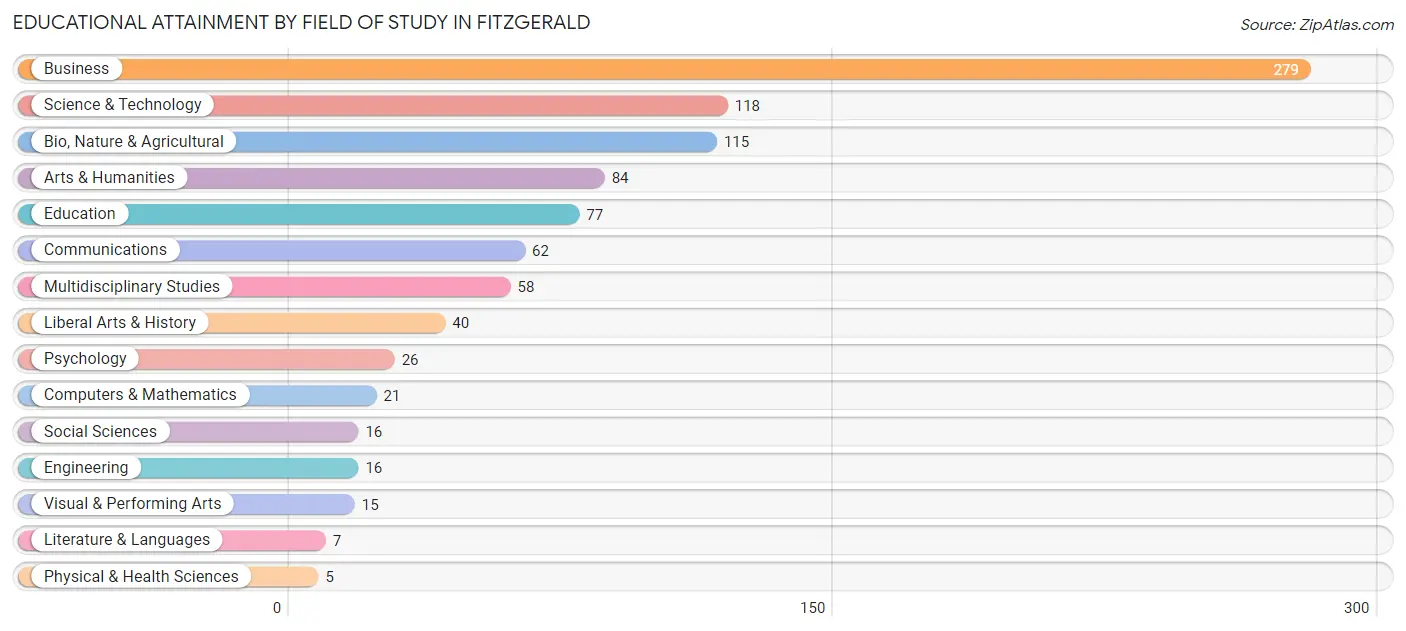
| Field of Study | # Graduates | % Graduates |
| Computers & Mathematics | 21 | 2.2% |
| Bio, Nature & Agricultural | 115 | 12.2% |
| Physical & Health Sciences | 5 | 0.5% |
| Psychology | 26 | 2.8% |
| Social Sciences | 16 | 1.7% |
| Engineering | 16 | 1.7% |
| Multidisciplinary Studies | 58 | 6.2% |
| Science & Technology | 118 | 12.6% |
| Business | 279 | 29.7% |
| Education | 77 | 8.2% |
| Literature & Languages | 7 | 0.7% |
| Liberal Arts & History | 40 | 4.3% |
| Visual & Performing Arts | 15 | 1.6% |
| Communications | 62 | 6.6% |
| Arts & Humanities | 84 | 8.9% |
| Total | 939 | 100.0% |
Transportation & Commute in Fitzgerald
Vehicle Availability by Sex in Fitzgerald
The most prevalent vehicle ownership categories in Fitzgerald are males with 1 vehicle (687, accounting for 39.8%) and females with 1 vehicle (924, making up 33.7%).
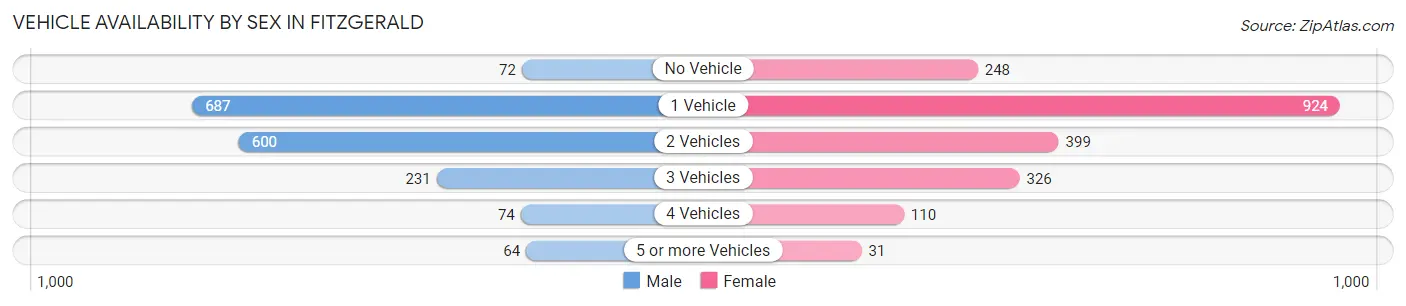
| Vehicles Available | Male | Female |
| No Vehicle | 72 (4.2%) | 248 (12.2%) |
| 1 Vehicle | 687 (39.8%) | 924 (45.3%) |
| 2 Vehicles | 600 (34.7%) | 399 (19.6%) |
| 3 Vehicles | 231 (13.4%) | 326 (16.0%) |
| 4 Vehicles | 74 (4.3%) | 110 (5.4%) |
| 5 or more Vehicles | 64 (3.7%) | 31 (1.5%) |
| Total | 1,728 (100.0%) | 2,038 (100.0%) |
Commute Time in Fitzgerald
The most frequently occuring commute durations in Fitzgerald are 5 to 9 minutes (1,256 commuters, 33.9%), 10 to 14 minutes (906 commuters, 24.4%), and 15 to 19 minutes (380 commuters, 10.2%).
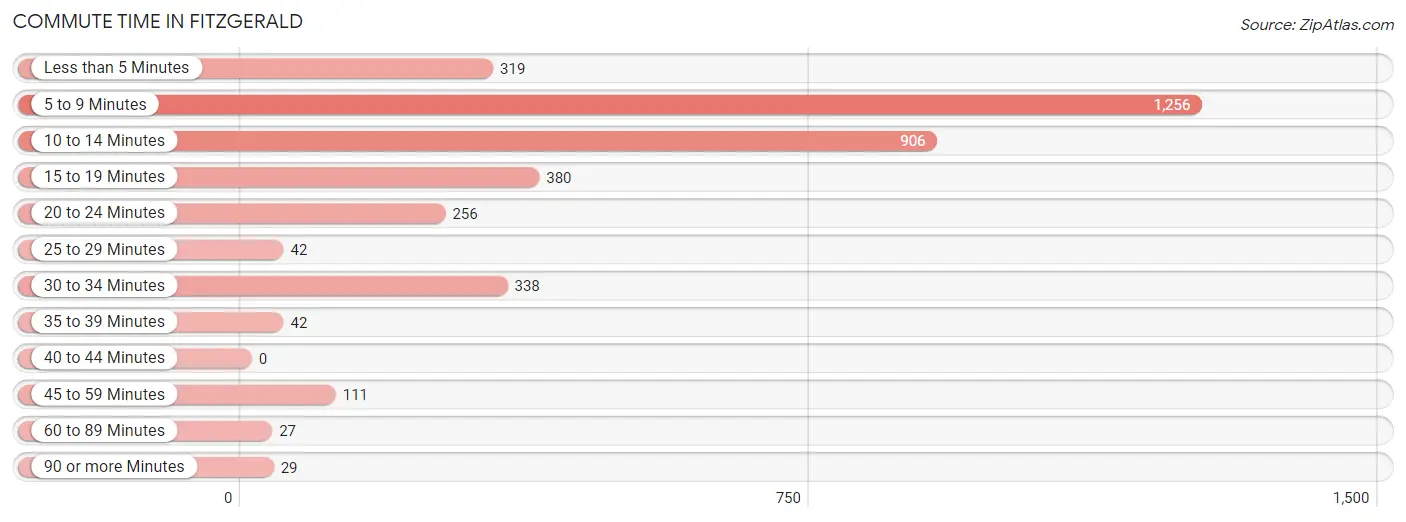
| Commute Time | # Commuters | % Commuters |
| Less than 5 Minutes | 319 | 8.6% |
| 5 to 9 Minutes | 1,256 | 33.9% |
| 10 to 14 Minutes | 906 | 24.4% |
| 15 to 19 Minutes | 380 | 10.2% |
| 20 to 24 Minutes | 256 | 6.9% |
| 25 to 29 Minutes | 42 | 1.1% |
| 30 to 34 Minutes | 338 | 9.1% |
| 35 to 39 Minutes | 42 | 1.1% |
| 40 to 44 Minutes | 0 | 0.0% |
| 45 to 59 Minutes | 111 | 3.0% |
| 60 to 89 Minutes | 27 | 0.7% |
| 90 or more Minutes | 29 | 0.8% |
Commute Time by Sex in Fitzgerald
The most common commute times in Fitzgerald are 5 to 9 minutes (668 commuters, 39.1%) for males and 5 to 9 minutes (588 commuters, 29.4%) for females.
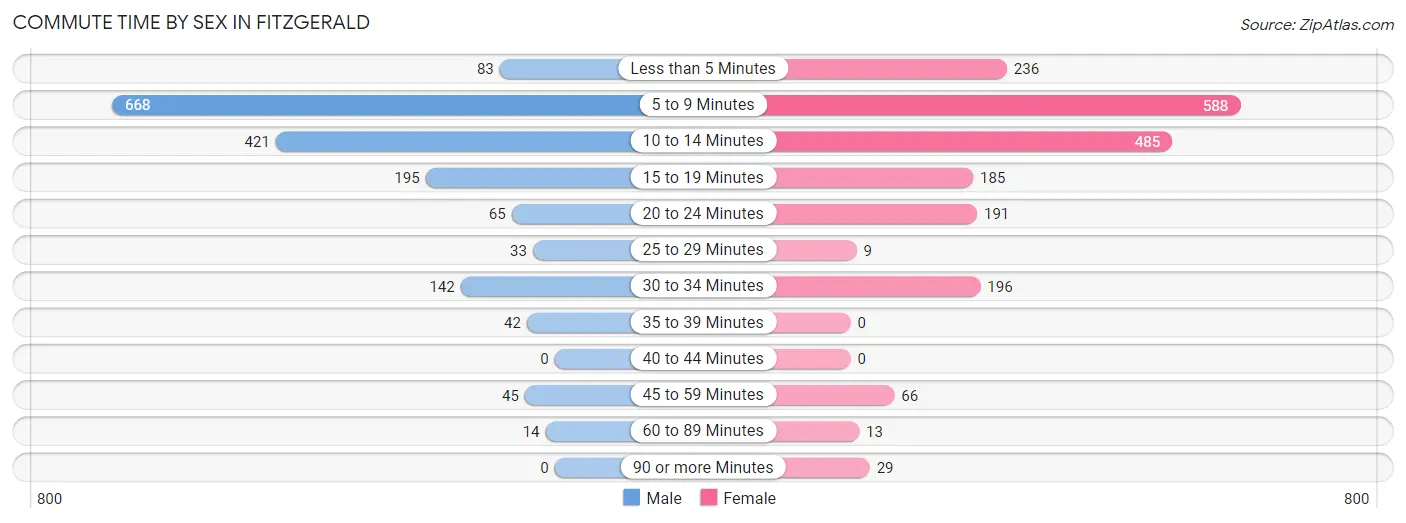
| Commute Time | Male | Female |
| Less than 5 Minutes | 83 (4.9%) | 236 (11.8%) |
| 5 to 9 Minutes | 668 (39.1%) | 588 (29.4%) |
| 10 to 14 Minutes | 421 (24.6%) | 485 (24.3%) |
| 15 to 19 Minutes | 195 (11.4%) | 185 (9.3%) |
| 20 to 24 Minutes | 65 (3.8%) | 191 (9.6%) |
| 25 to 29 Minutes | 33 (1.9%) | 9 (0.4%) |
| 30 to 34 Minutes | 142 (8.3%) | 196 (9.8%) |
| 35 to 39 Minutes | 42 (2.5%) | 0 (0.0%) |
| 40 to 44 Minutes | 0 (0.0%) | 0 (0.0%) |
| 45 to 59 Minutes | 45 (2.6%) | 66 (3.3%) |
| 60 to 89 Minutes | 14 (0.8%) | 13 (0.6%) |
| 90 or more Minutes | 0 (0.0%) | 29 (1.5%) |
Time of Departure to Work by Sex in Fitzgerald
The most frequent times of departure to work in Fitzgerald are 7:00 AM to 7:29 AM (371, 21.7%) for males and 6:30 AM to 6:59 AM (369, 18.5%) for females.
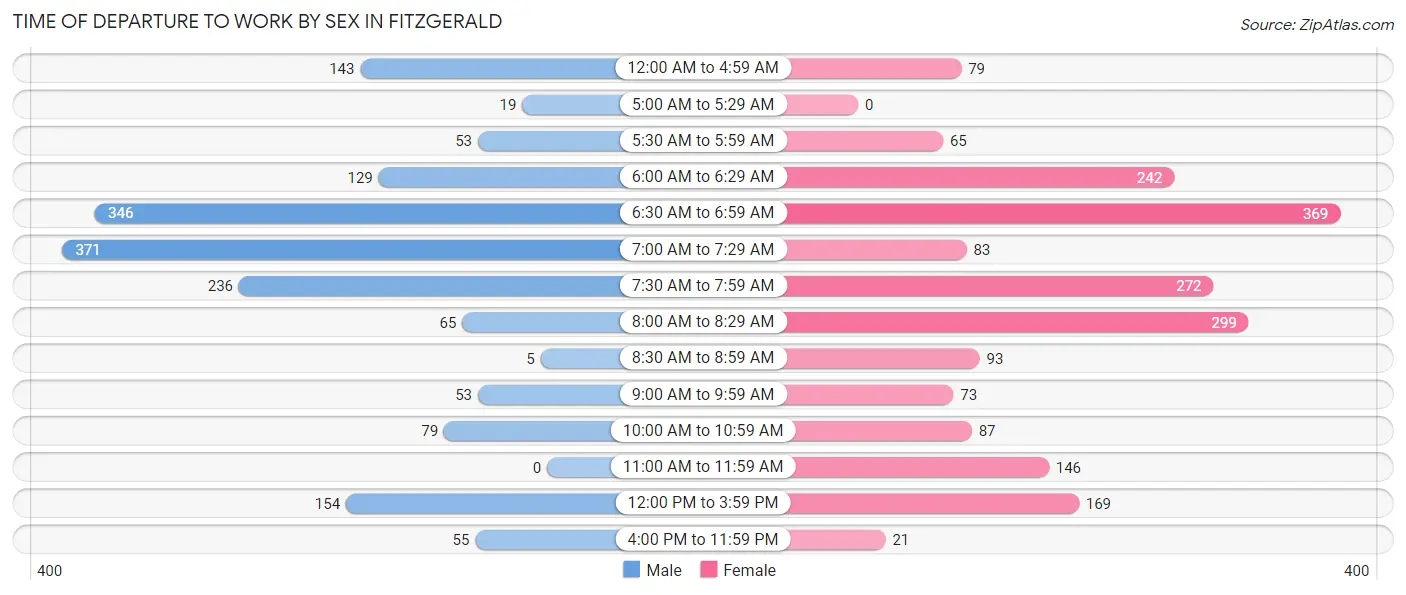
| Time of Departure | Male | Female |
| 12:00 AM to 4:59 AM | 143 (8.4%) | 79 (4.0%) |
| 5:00 AM to 5:29 AM | 19 (1.1%) | 0 (0.0%) |
| 5:30 AM to 5:59 AM | 53 (3.1%) | 65 (3.3%) |
| 6:00 AM to 6:29 AM | 129 (7.5%) | 242 (12.1%) |
| 6:30 AM to 6:59 AM | 346 (20.3%) | 369 (18.5%) |
| 7:00 AM to 7:29 AM | 371 (21.7%) | 83 (4.2%) |
| 7:30 AM to 7:59 AM | 236 (13.8%) | 272 (13.6%) |
| 8:00 AM to 8:29 AM | 65 (3.8%) | 299 (15.0%) |
| 8:30 AM to 8:59 AM | 5 (0.3%) | 93 (4.6%) |
| 9:00 AM to 9:59 AM | 53 (3.1%) | 73 (3.6%) |
| 10:00 AM to 10:59 AM | 79 (4.6%) | 87 (4.3%) |
| 11:00 AM to 11:59 AM | 0 (0.0%) | 146 (7.3%) |
| 12:00 PM to 3:59 PM | 154 (9.0%) | 169 (8.5%) |
| 4:00 PM to 11:59 PM | 55 (3.2%) | 21 (1.1%) |
| Total | 1,708 (100.0%) | 1,998 (100.0%) |
Housing Occupancy in Fitzgerald
Occupancy by Ownership in Fitzgerald
Of the total 3,778 dwellings in Fitzgerald, owner-occupied units account for 1,769 (46.8%), while renter-occupied units make up 2,009 (53.2%).
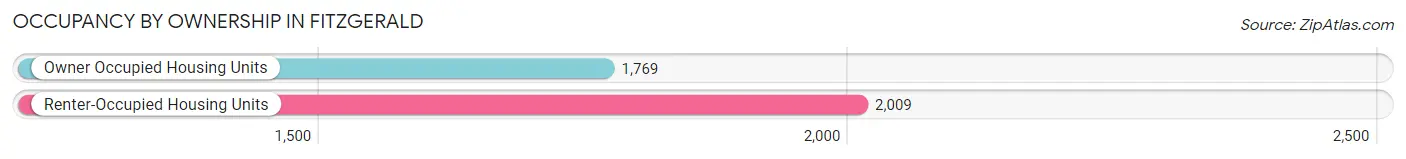
| Occupancy | # Housing Units | % Housing Units |
| Owner Occupied Housing Units | 1,769 | 46.8% |
| Renter-Occupied Housing Units | 2,009 | 53.2% |
| Total Occupied Housing Units | 3,778 | 100.0% |
Occupancy by Household Size in Fitzgerald
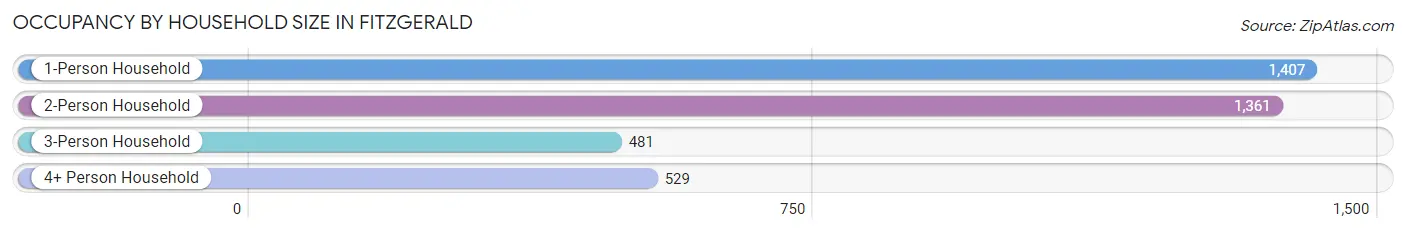
| Household Size | # Housing Units | % Housing Units |
| 1-Person Household | 1,407 | 37.2% |
| 2-Person Household | 1,361 | 36.0% |
| 3-Person Household | 481 | 12.7% |
| 4+ Person Household | 529 | 14.0% |
| Total Housing Units | 3,778 | 100.0% |
Occupancy by Ownership by Household Size in Fitzgerald
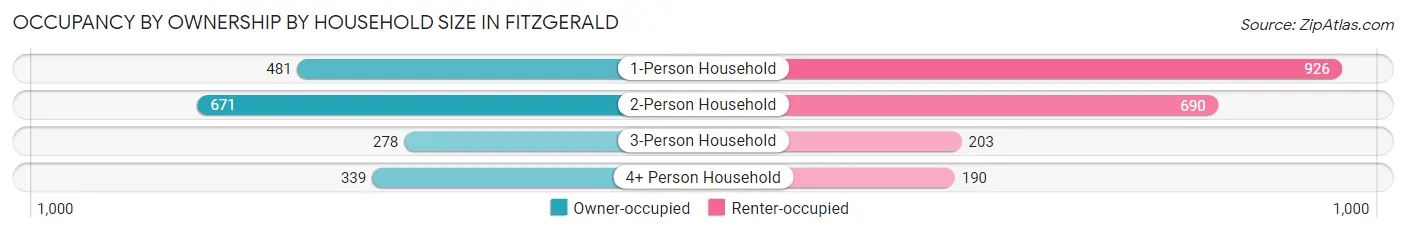
| Household Size | Owner-occupied | Renter-occupied |
| 1-Person Household | 481 (34.2%) | 926 (65.8%) |
| 2-Person Household | 671 (49.3%) | 690 (50.7%) |
| 3-Person Household | 278 (57.8%) | 203 (42.2%) |
| 4+ Person Household | 339 (64.1%) | 190 (35.9%) |
| Total Housing Units | 1,769 (46.8%) | 2,009 (53.2%) |
Occupancy by Educational Attainment in Fitzgerald
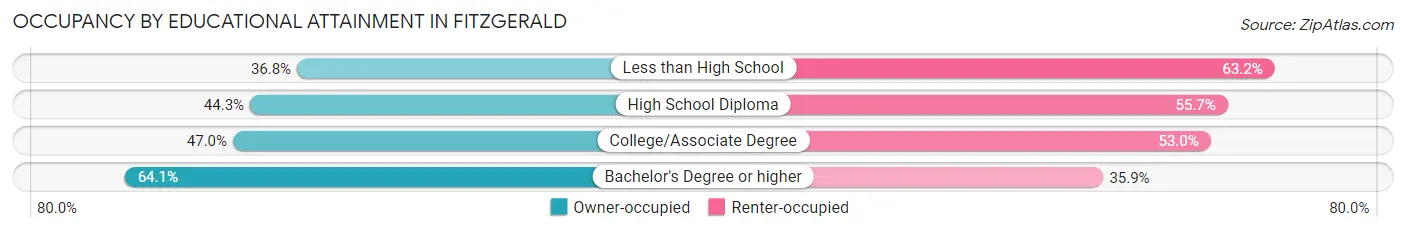
| Household Size | Owner-occupied | Renter-occupied |
| Less than High School | 138 (36.8%) | 237 (63.2%) |
| High School Diploma | 963 (44.3%) | 1,213 (55.7%) |
| College/Associate Degree | 325 (47.0%) | 367 (53.0%) |
| Bachelor's Degree or higher | 343 (64.1%) | 192 (35.9%) |
Occupancy by Age of Householder in Fitzgerald
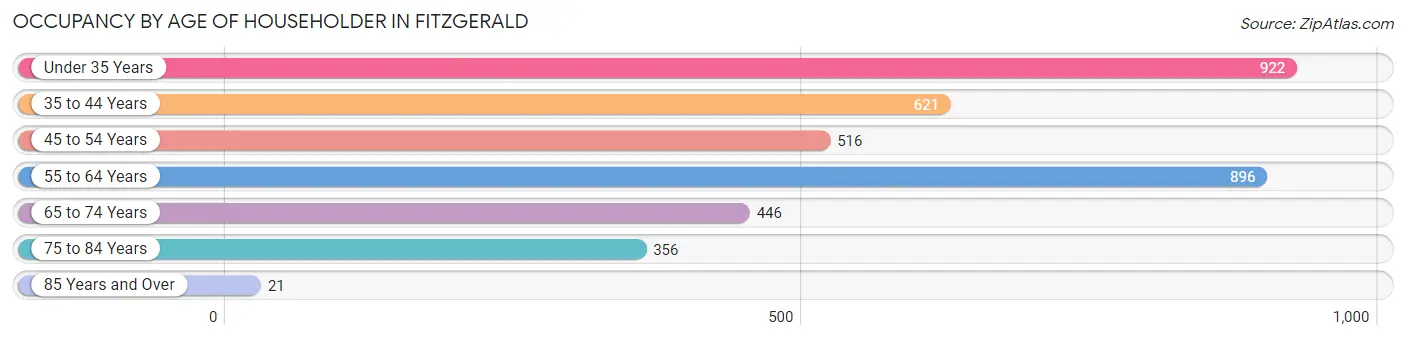
| Age Bracket | # Households | % Households |
| Under 35 Years | 922 | 24.4% |
| 35 to 44 Years | 621 | 16.4% |
| 45 to 54 Years | 516 | 13.7% |
| 55 to 64 Years | 896 | 23.7% |
| 65 to 74 Years | 446 | 11.8% |
| 75 to 84 Years | 356 | 9.4% |
| 85 Years and Over | 21 | 0.6% |
| Total | 3,778 | 100.0% |
Housing Finances in Fitzgerald
Median Income by Occupancy in Fitzgerald
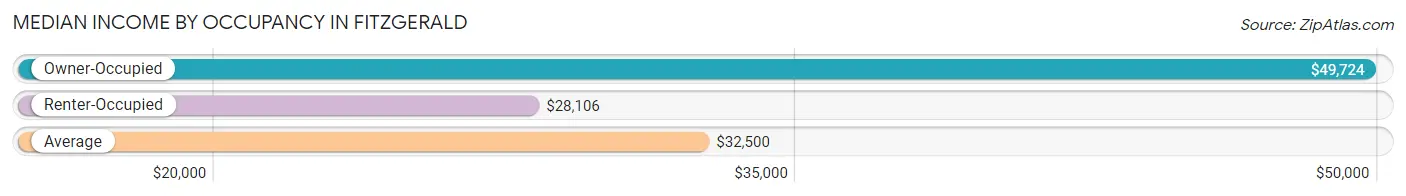
| Occupancy Type | # Households | Median Income |
| Owner-Occupied | 1,769 (46.8%) | $49,724 |
| Renter-Occupied | 2,009 (53.2%) | $28,106 |
| Average | 3,778 (100.0%) | $32,500 |
Occupancy by Householder Income Bracket in Fitzgerald
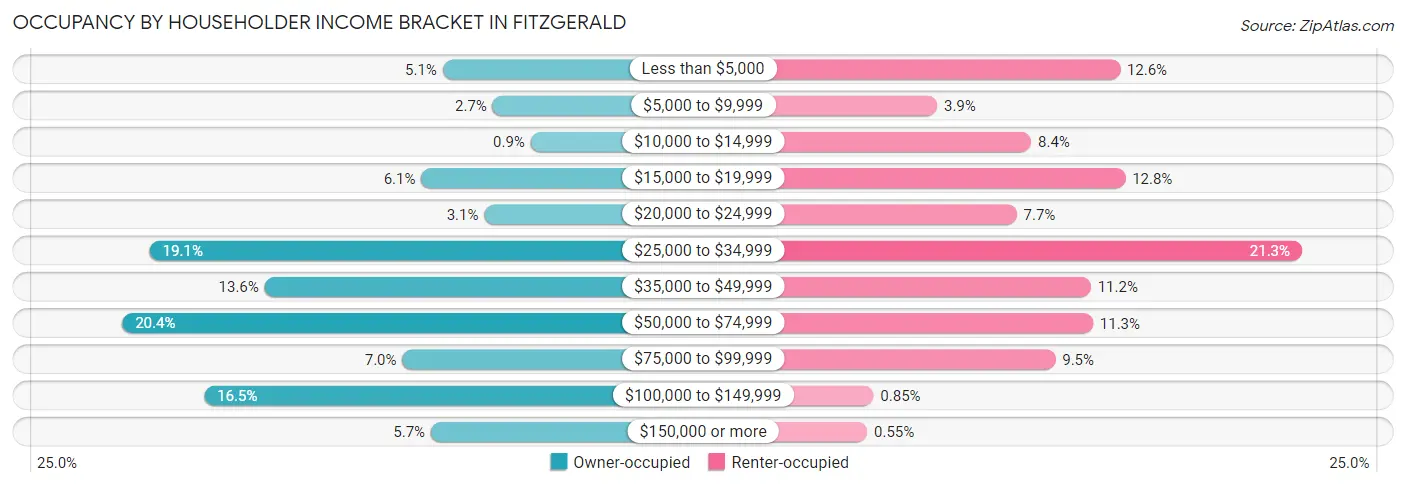
| Income Bracket | Owner-occupied | Renter-occupied |
| Less than $5,000 | 90 (5.1%) | 253 (12.6%) |
| $5,000 to $9,999 | 48 (2.7%) | 78 (3.9%) |
| $10,000 to $14,999 | 16 (0.9%) | 168 (8.4%) |
| $15,000 to $19,999 | 108 (6.1%) | 258 (12.8%) |
| $20,000 to $24,999 | 55 (3.1%) | 154 (7.7%) |
| $25,000 to $34,999 | 337 (19.1%) | 427 (21.2%) |
| $35,000 to $49,999 | 240 (13.6%) | 225 (11.2%) |
| $50,000 to $74,999 | 360 (20.3%) | 227 (11.3%) |
| $75,000 to $99,999 | 124 (7.0%) | 191 (9.5%) |
| $100,000 to $149,999 | 291 (16.5%) | 17 (0.9%) |
| $150,000 or more | 100 (5.7%) | 11 (0.5%) |
| Total | 1,769 (100.0%) | 2,009 (100.0%) |
Monthly Housing Cost Tiers in Fitzgerald
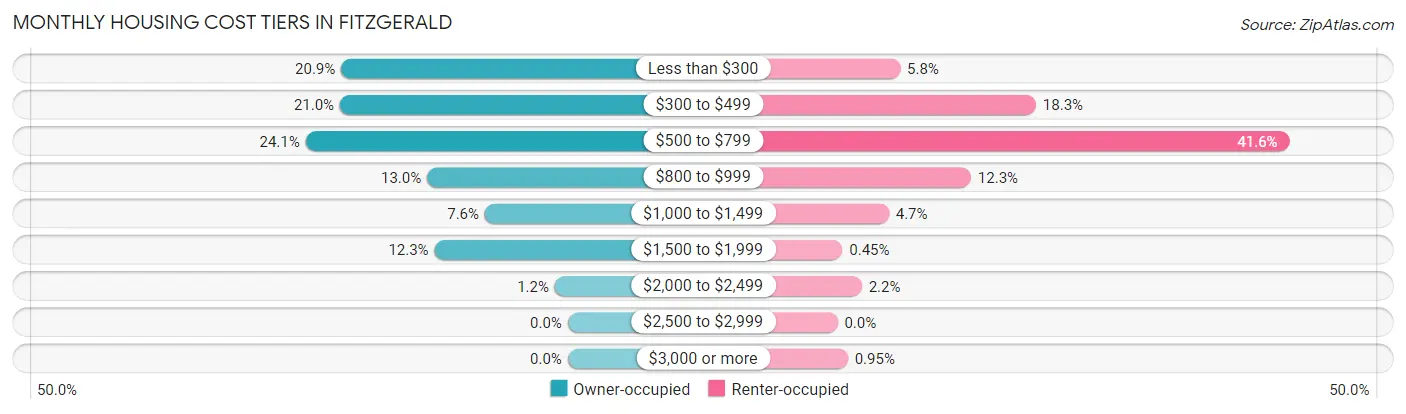
| Monthly Cost | Owner-occupied | Renter-occupied |
| Less than $300 | 369 (20.9%) | 116 (5.8%) |
| $300 to $499 | 371 (21.0%) | 367 (18.3%) |
| $500 to $799 | 427 (24.1%) | 836 (41.6%) |
| $800 to $999 | 229 (13.0%) | 247 (12.3%) |
| $1,000 to $1,499 | 135 (7.6%) | 95 (4.7%) |
| $1,500 to $1,999 | 217 (12.3%) | 9 (0.4%) |
| $2,000 to $2,499 | 21 (1.2%) | 45 (2.2%) |
| $2,500 to $2,999 | 0 (0.0%) | 0 (0.0%) |
| $3,000 or more | 0 (0.0%) | 19 (0.9%) |
| Total | 1,769 (100.0%) | 2,009 (100.0%) |
Physical Housing Characteristics in Fitzgerald
Housing Structures in Fitzgerald
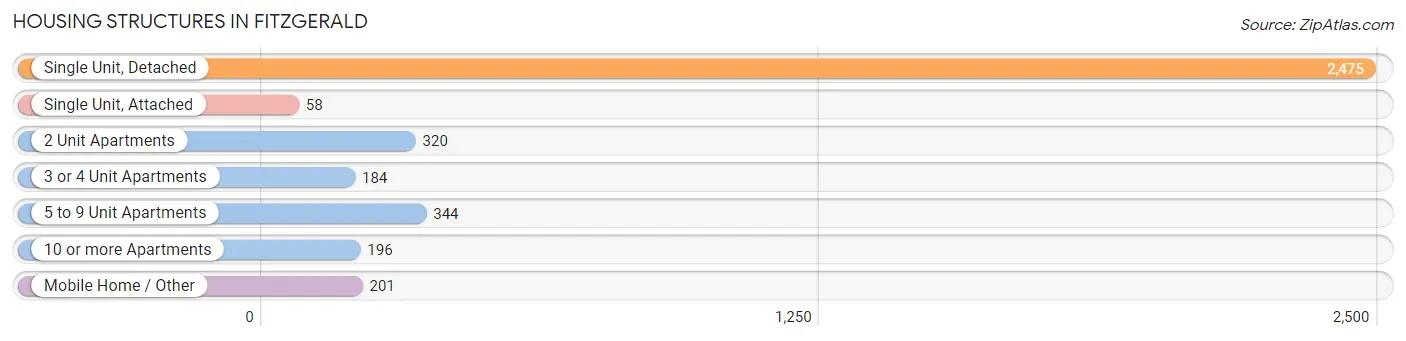
| Structure Type | # Housing Units | % Housing Units |
| Single Unit, Detached | 2,475 | 65.5% |
| Single Unit, Attached | 58 | 1.5% |
| 2 Unit Apartments | 320 | 8.5% |
| 3 or 4 Unit Apartments | 184 | 4.9% |
| 5 to 9 Unit Apartments | 344 | 9.1% |
| 10 or more Apartments | 196 | 5.2% |
| Mobile Home / Other | 201 | 5.3% |
| Total | 3,778 | 100.0% |
Housing Structures by Occupancy in Fitzgerald
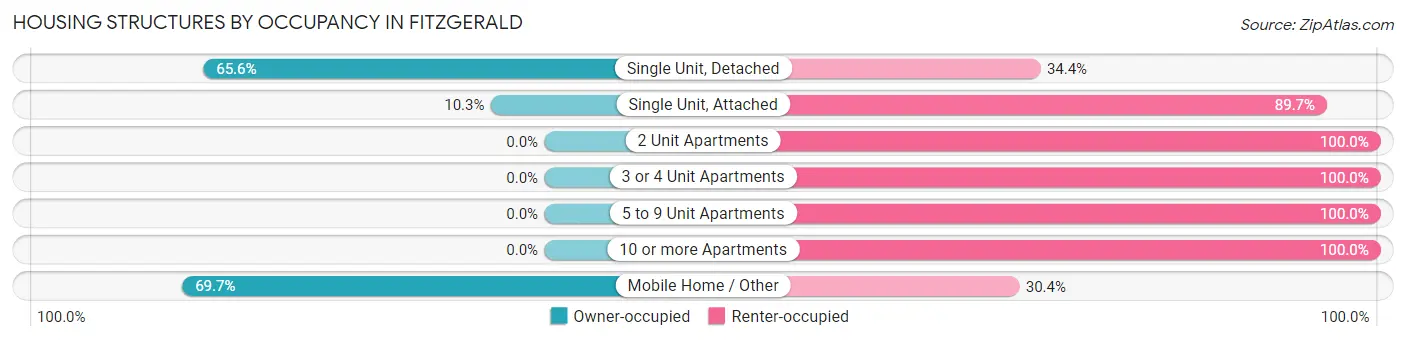
| Structure Type | Owner-occupied | Renter-occupied |
| Single Unit, Detached | 1,623 (65.6%) | 852 (34.4%) |
| Single Unit, Attached | 6 (10.3%) | 52 (89.7%) |
| 2 Unit Apartments | 0 (0.0%) | 320 (100.0%) |
| 3 or 4 Unit Apartments | 0 (0.0%) | 184 (100.0%) |
| 5 to 9 Unit Apartments | 0 (0.0%) | 344 (100.0%) |
| 10 or more Apartments | 0 (0.0%) | 196 (100.0%) |
| Mobile Home / Other | 140 (69.7%) | 61 (30.3%) |
| Total | 1,769 (46.8%) | 2,009 (53.2%) |
Housing Structures by Number of Rooms in Fitzgerald
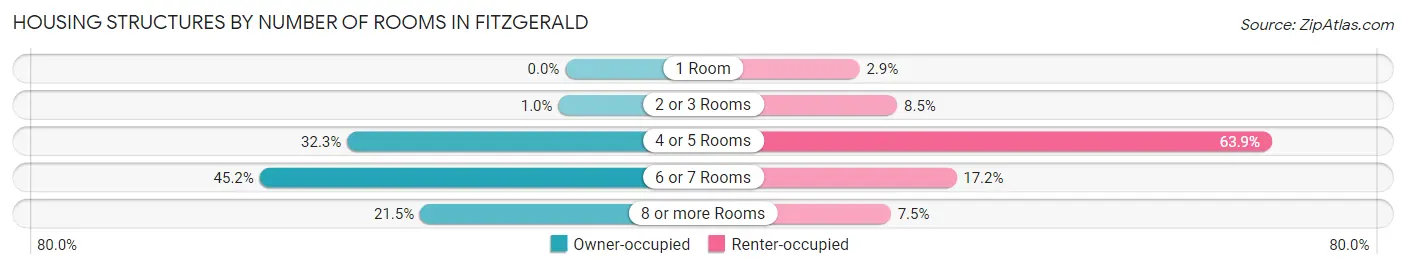
| Number of Rooms | Owner-occupied | Renter-occupied |
| 1 Room | 0 (0.0%) | 58 (2.9%) |
| 2 or 3 Rooms | 18 (1.0%) | 170 (8.5%) |
| 4 or 5 Rooms | 571 (32.3%) | 1,284 (63.9%) |
| 6 or 7 Rooms | 800 (45.2%) | 346 (17.2%) |
| 8 or more Rooms | 380 (21.5%) | 151 (7.5%) |
| Total | 1,769 (100.0%) | 2,009 (100.0%) |
Housing Structure by Heating Type in Fitzgerald
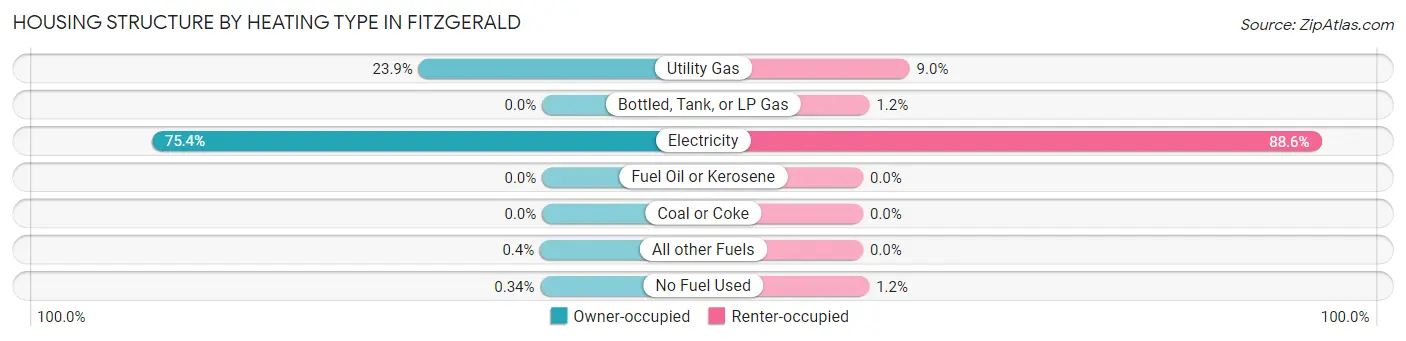
| Heating Type | Owner-occupied | Renter-occupied |
| Utility Gas | 422 (23.9%) | 181 (9.0%) |
| Bottled, Tank, or LP Gas | 0 (0.0%) | 25 (1.2%) |
| Electricity | 1,334 (75.4%) | 1,779 (88.5%) |
| Fuel Oil or Kerosene | 0 (0.0%) | 0 (0.0%) |
| Coal or Coke | 0 (0.0%) | 0 (0.0%) |
| All other Fuels | 7 (0.4%) | 0 (0.0%) |
| No Fuel Used | 6 (0.3%) | 24 (1.2%) |
| Total | 1,769 (100.0%) | 2,009 (100.0%) |
Household Vehicle Usage in Fitzgerald
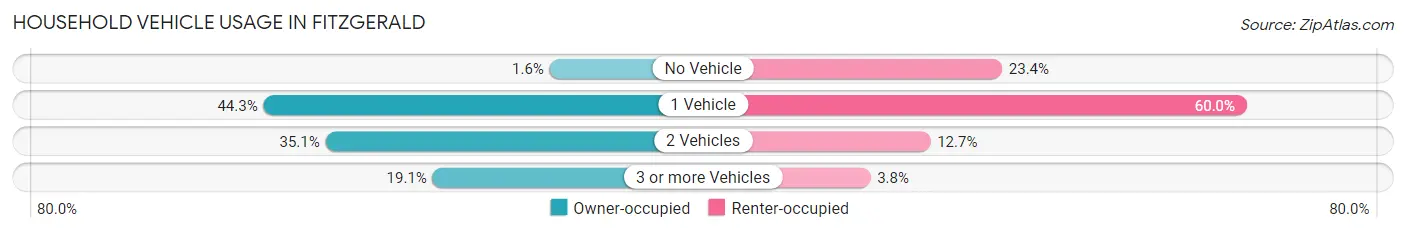
| Vehicles per Household | Owner-occupied | Renter-occupied |
| No Vehicle | 28 (1.6%) | 471 (23.4%) |
| 1 Vehicle | 784 (44.3%) | 1,206 (60.0%) |
| 2 Vehicles | 620 (35.0%) | 256 (12.7%) |
| 3 or more Vehicles | 337 (19.1%) | 76 (3.8%) |
| Total | 1,769 (100.0%) | 2,009 (100.0%) |
Real Estate & Mortgages in Fitzgerald
Real Estate and Mortgage Overview in Fitzgerald
| Characteristic | Without Mortgage | With Mortgage |
| Housing Units | 1,020 | 749 |
| Median Property Value | $89,300 | $105,200 |
| Median Household Income | $31,971 | $67 |
| Monthly Housing Costs | $404 | $0 |
| Real Estate Taxes | $746 | $24 |
Property Value by Mortgage Status in Fitzgerald
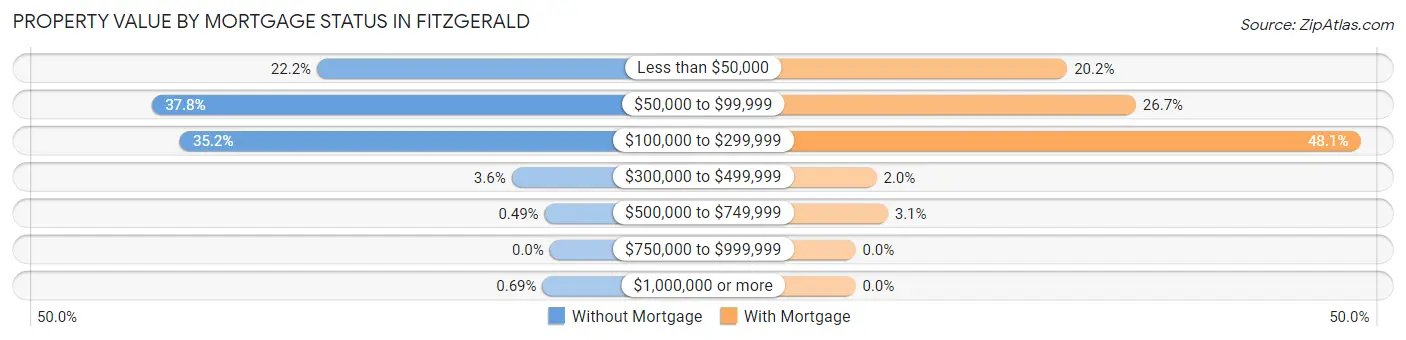
| Property Value | Without Mortgage | With Mortgage |
| Less than $50,000 | 226 (22.2%) | 151 (20.2%) |
| $50,000 to $99,999 | 386 (37.8%) | 200 (26.7%) |
| $100,000 to $299,999 | 359 (35.2%) | 360 (48.1%) |
| $300,000 to $499,999 | 37 (3.6%) | 15 (2.0%) |
| $500,000 to $749,999 | 5 (0.5%) | 23 (3.1%) |
| $750,000 to $999,999 | 0 (0.0%) | 0 (0.0%) |
| $1,000,000 or more | 7 (0.7%) | 0 (0.0%) |
| Total | 1,020 (100.0%) | 749 (100.0%) |
Household Income by Mortgage Status in Fitzgerald
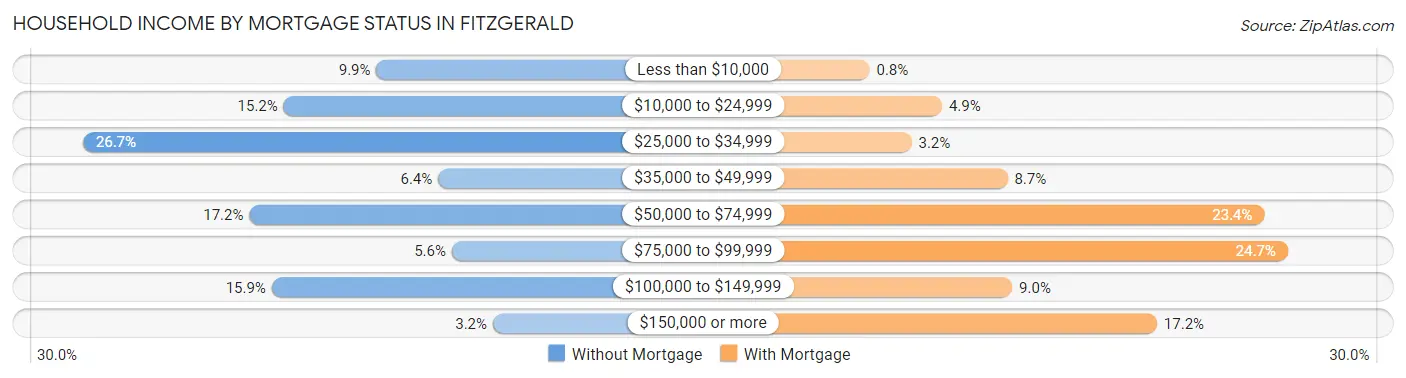
| Household Income | Without Mortgage | With Mortgage |
| Less than $10,000 | 101 (9.9%) | 6 (0.8%) |
| $10,000 to $24,999 | 155 (15.2%) | 37 (4.9%) |
| $25,000 to $34,999 | 272 (26.7%) | 24 (3.2%) |
| $35,000 to $49,999 | 65 (6.4%) | 65 (8.7%) |
| $50,000 to $74,999 | 175 (17.2%) | 175 (23.4%) |
| $75,000 to $99,999 | 57 (5.6%) | 185 (24.7%) |
| $100,000 to $149,999 | 162 (15.9%) | 67 (8.9%) |
| $150,000 or more | 33 (3.2%) | 129 (17.2%) |
| Total | 1,020 (100.0%) | 749 (100.0%) |
Property Value to Household Income Ratio in Fitzgerald
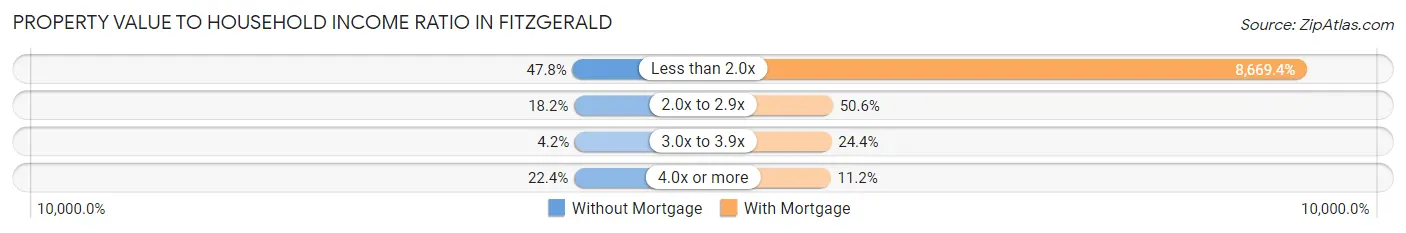
| Value-to-Income Ratio | Without Mortgage | With Mortgage |
| Less than 2.0x | 488 (47.8%) | 64,934 (8,669.4%) |
| 2.0x to 2.9x | 186 (18.2%) | 379 (50.6%) |
| 3.0x to 3.9x | 43 (4.2%) | 183 (24.4%) |
| 4.0x or more | 228 (22.4%) | 84 (11.2%) |
| Total | 1,020 (100.0%) | 749 (100.0%) |
Real Estate Taxes by Mortgage Status in Fitzgerald
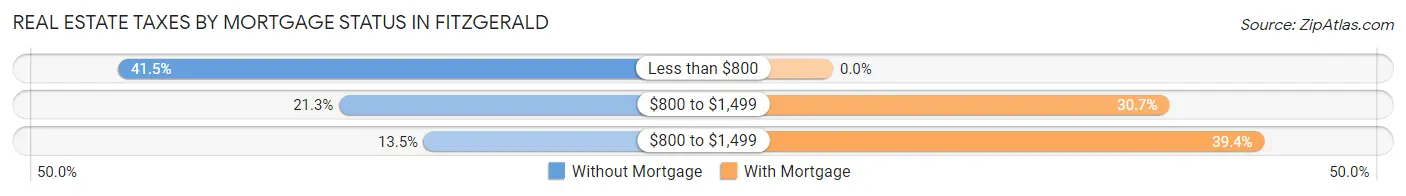
| Property Taxes | Without Mortgage | With Mortgage |
| Less than $800 | 423 (41.5%) | 0 (0.0%) |
| $800 to $1,499 | 217 (21.3%) | 230 (30.7%) |
| $800 to $1,499 | 138 (13.5%) | 295 (39.4%) |
| Total | 1,020 (100.0%) | 749 (100.0%) |
Health & Disability in Fitzgerald
Health Insurance Coverage by Age in Fitzgerald
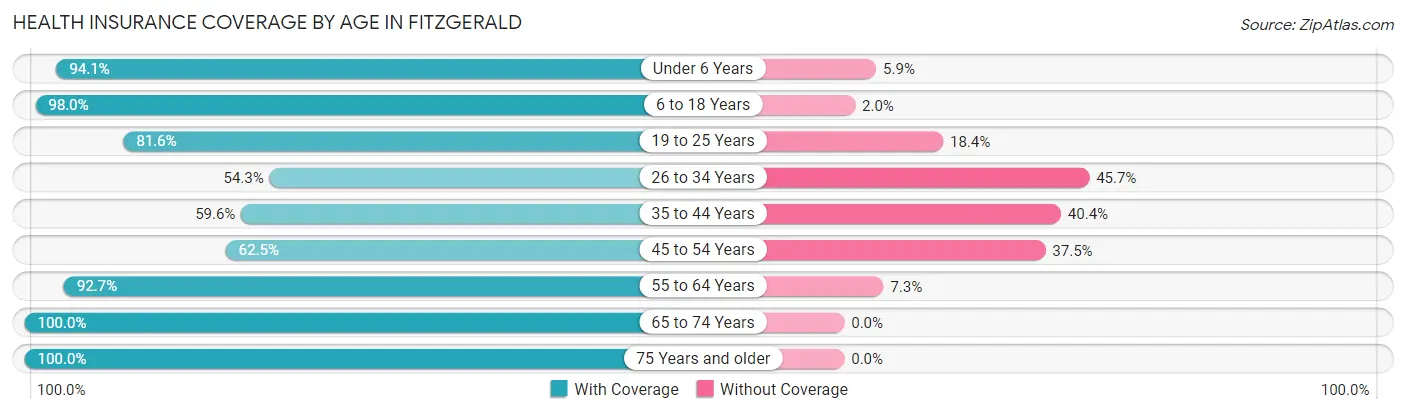
| Age Bracket | With Coverage | Without Coverage |
| Under 6 Years | 649 (94.1%) | 41 (5.9%) |
| 6 to 18 Years | 1,558 (98.0%) | 32 (2.0%) |
| 19 to 25 Years | 758 (81.6%) | 171 (18.4%) |
| 26 to 34 Years | 640 (54.3%) | 538 (45.7%) |
| 35 to 44 Years | 493 (59.6%) | 334 (40.4%) |
| 45 to 54 Years | 545 (62.5%) | 327 (37.5%) |
| 55 to 64 Years | 1,166 (92.7%) | 92 (7.3%) |
| 65 to 74 Years | 642 (100.0%) | 0 (0.0%) |
| 75 Years and older | 643 (100.0%) | 0 (0.0%) |
| Total | 7,094 (82.2%) | 1,535 (17.8%) |
Health Insurance Coverage by Citizenship Status in Fitzgerald
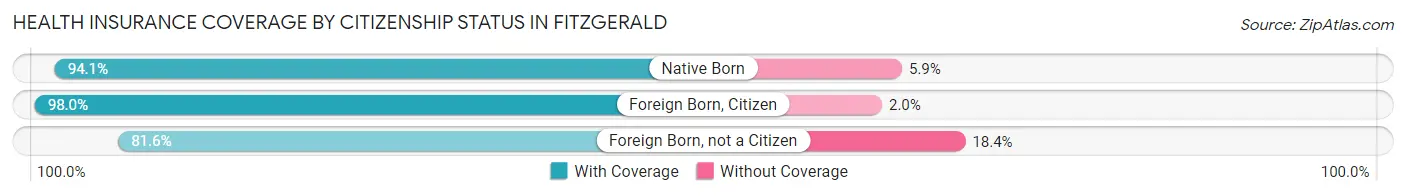
| Citizenship Status | With Coverage | Without Coverage |
| Native Born | 649 (94.1%) | 41 (5.9%) |
| Foreign Born, Citizen | 1,558 (98.0%) | 32 (2.0%) |
| Foreign Born, not a Citizen | 758 (81.6%) | 171 (18.4%) |
Health Insurance Coverage by Household Income in Fitzgerald
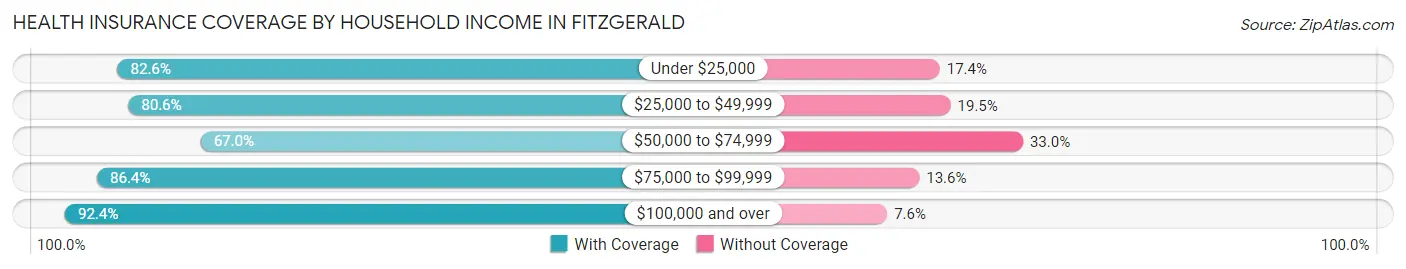
| Household Income | With Coverage | Without Coverage |
| Under $25,000 | 2,146 (82.6%) | 453 (17.4%) |
| $25,000 to $49,999 | 1,947 (80.5%) | 470 (19.5%) |
| $50,000 to $74,999 | 755 (67.0%) | 372 (33.0%) |
| $75,000 to $99,999 | 725 (86.4%) | 114 (13.6%) |
| $100,000 and over | 1,511 (92.4%) | 124 (7.6%) |
Public vs Private Health Insurance Coverage by Age in Fitzgerald
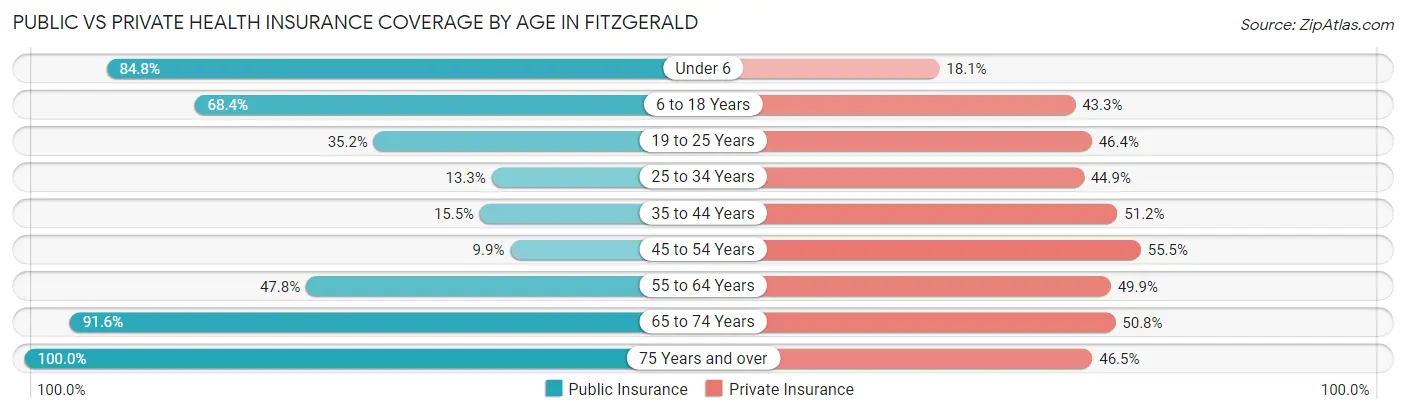
| Age Bracket | Public Insurance | Private Insurance |
| Under 6 | 585 (84.8%) | 125 (18.1%) |
| 6 to 18 Years | 1,088 (68.4%) | 689 (43.3%) |
| 19 to 25 Years | 327 (35.2%) | 431 (46.4%) |
| 25 to 34 Years | 157 (13.3%) | 529 (44.9%) |
| 35 to 44 Years | 128 (15.5%) | 423 (51.1%) |
| 45 to 54 Years | 86 (9.9%) | 484 (55.5%) |
| 55 to 64 Years | 601 (47.8%) | 628 (49.9%) |
| 65 to 74 Years | 588 (91.6%) | 326 (50.8%) |
| 75 Years and over | 643 (100.0%) | 299 (46.5%) |
| Total | 4,203 (48.7%) | 3,934 (45.6%) |
Disability Status by Sex by Age in Fitzgerald
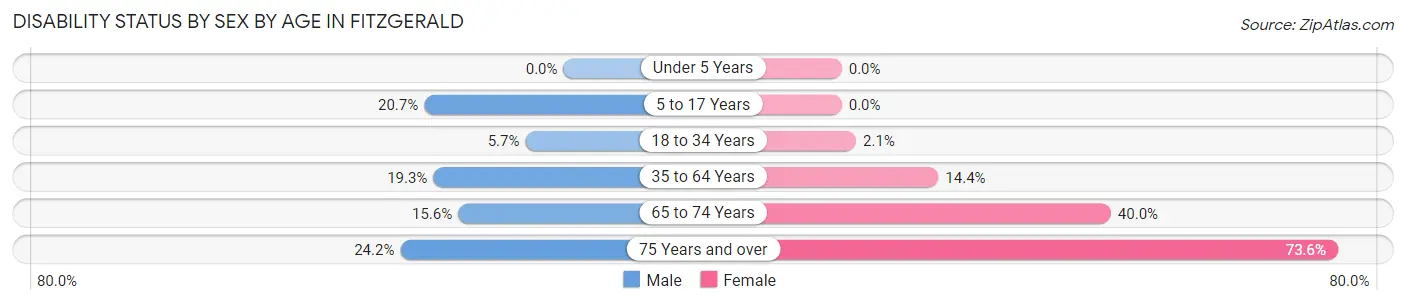
| Age Bracket | Male | Female |
| Under 5 Years | 0 (0.0%) | 0 (0.0%) |
| 5 to 17 Years | 176 (20.7%) | 0 (0.0%) |
| 18 to 34 Years | 55 (5.7%) | 25 (2.1%) |
| 35 to 64 Years | 255 (19.3%) | 235 (14.3%) |
| 65 to 74 Years | 28 (15.6%) | 185 (40.0%) |
| 75 Years and over | 62 (24.2%) | 285 (73.6%) |
Disability Class by Sex by Age in Fitzgerald
Disability Class: Hearing Difficulty
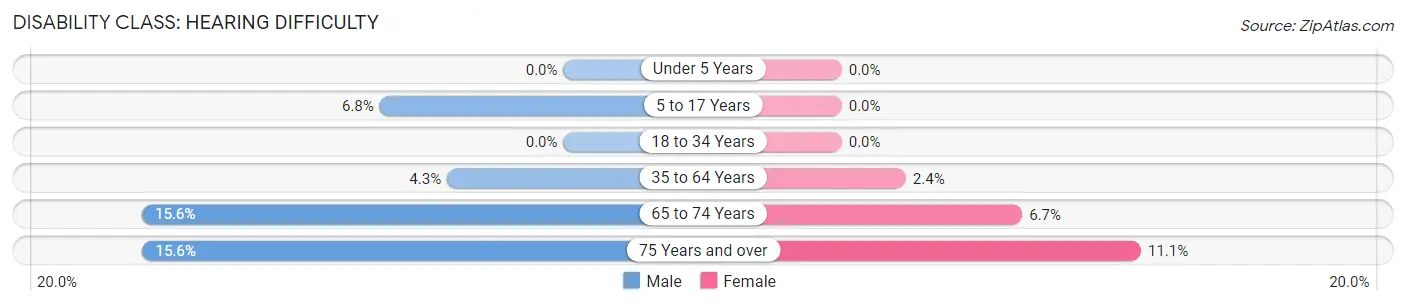
| Age Bracket | Male | Female |
| Under 5 Years | 0 (0.0%) | 0 (0.0%) |
| 5 to 17 Years | 58 (6.8%) | 0 (0.0%) |
| 18 to 34 Years | 0 (0.0%) | 0 (0.0%) |
| 35 to 64 Years | 57 (4.3%) | 39 (2.4%) |
| 65 to 74 Years | 28 (15.6%) | 31 (6.7%) |
| 75 Years and over | 40 (15.6%) | 43 (11.1%) |
Disability Class: Vision Difficulty
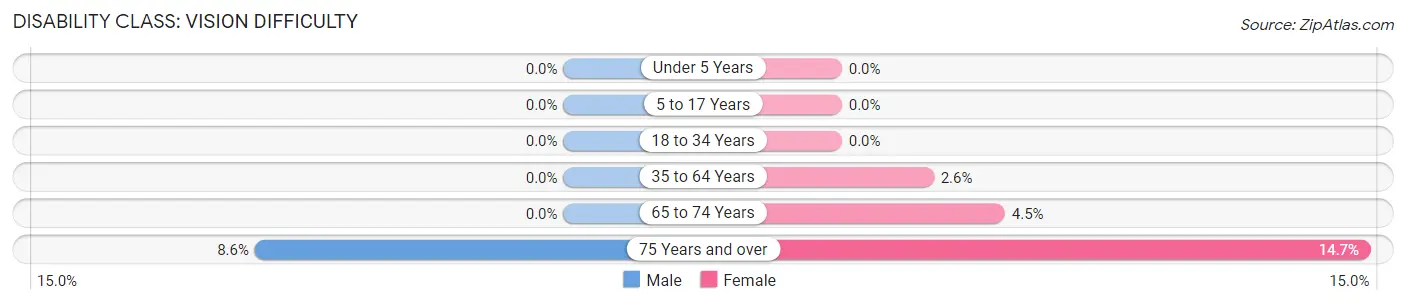
| Age Bracket | Male | Female |
| Under 5 Years | 0 (0.0%) | 0 (0.0%) |
| 5 to 17 Years | 0 (0.0%) | 0 (0.0%) |
| 18 to 34 Years | 0 (0.0%) | 0 (0.0%) |
| 35 to 64 Years | 0 (0.0%) | 42 (2.6%) |
| 65 to 74 Years | 0 (0.0%) | 21 (4.5%) |
| 75 Years and over | 22 (8.6%) | 57 (14.7%) |
Disability Class: Cognitive Difficulty
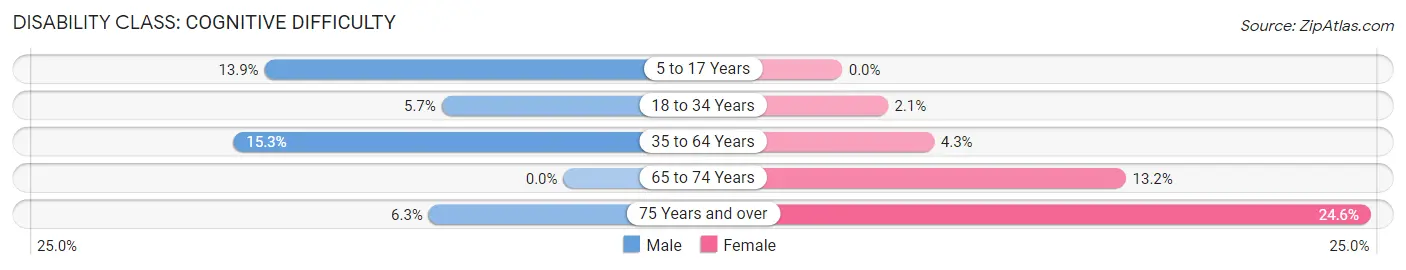
| Age Bracket | Male | Female |
| 5 to 17 Years | 118 (13.9%) | 0 (0.0%) |
| 18 to 34 Years | 55 (5.7%) | 25 (2.1%) |
| 35 to 64 Years | 202 (15.3%) | 70 (4.3%) |
| 65 to 74 Years | 0 (0.0%) | 61 (13.2%) |
| 75 Years and over | 16 (6.2%) | 95 (24.5%) |
Disability Class: Ambulatory Difficulty
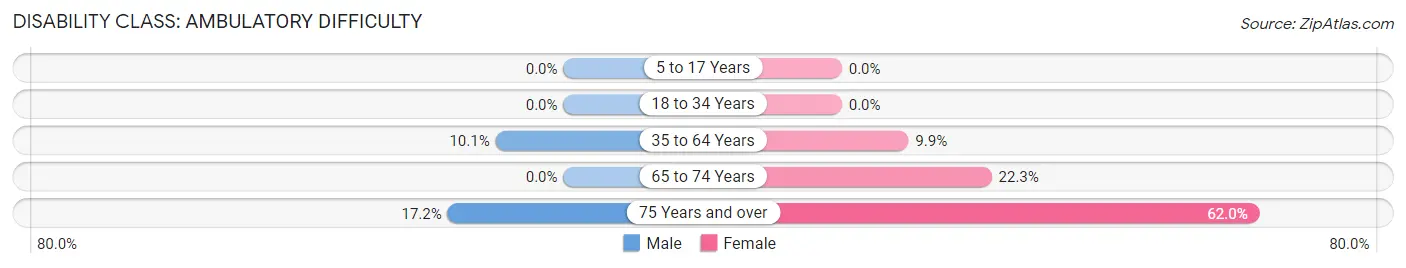
| Age Bracket | Male | Female |
| 5 to 17 Years | 0 (0.0%) | 0 (0.0%) |
| 18 to 34 Years | 0 (0.0%) | 0 (0.0%) |
| 35 to 64 Years | 133 (10.1%) | 162 (9.9%) |
| 65 to 74 Years | 0 (0.0%) | 103 (22.3%) |
| 75 Years and over | 44 (17.2%) | 240 (62.0%) |
Disability Class: Self-Care Difficulty
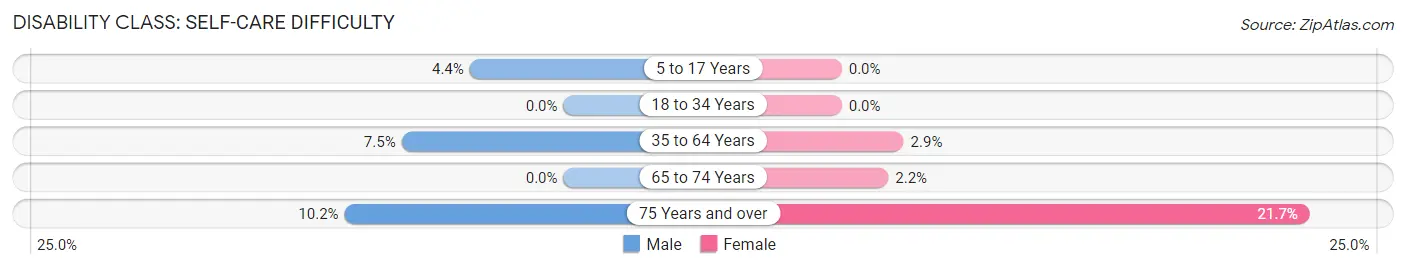
| Age Bracket | Male | Female |
| 5 to 17 Years | 37 (4.3%) | 0 (0.0%) |
| 18 to 34 Years | 0 (0.0%) | 0 (0.0%) |
| 35 to 64 Years | 99 (7.5%) | 47 (2.9%) |
| 65 to 74 Years | 0 (0.0%) | 10 (2.2%) |
| 75 Years and over | 26 (10.2%) | 84 (21.7%) |
Technology Access in Fitzgerald
Computing Device Access in Fitzgerald
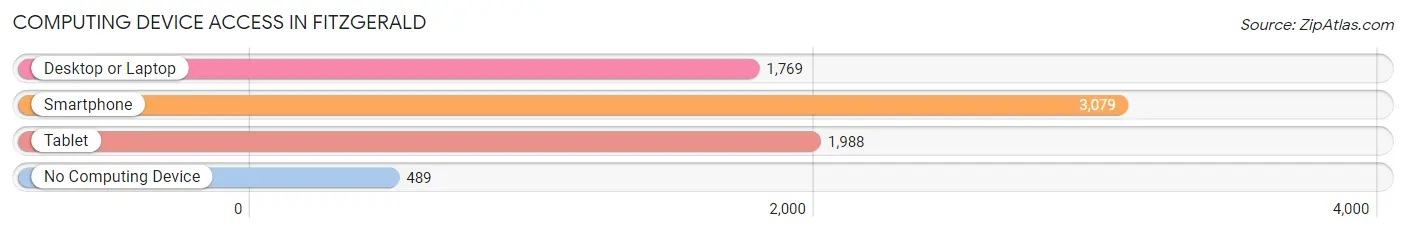
| Device Type | # Households | % Households |
| Desktop or Laptop | 1,769 | 46.8% |
| Smartphone | 3,079 | 81.5% |
| Tablet | 1,988 | 52.6% |
| No Computing Device | 489 | 12.9% |
| Total | 3,778 | 100.0% |
Internet Access in Fitzgerald
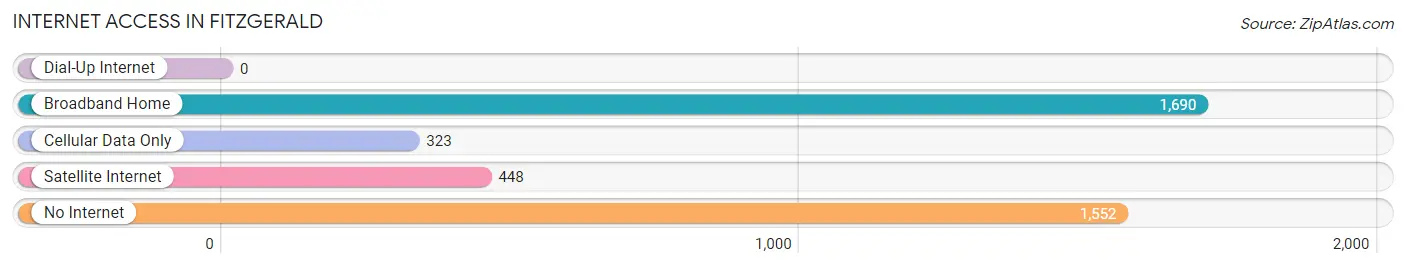
| Internet Type | # Households | % Households |
| Dial-Up Internet | 0 | 0.0% |
| Broadband Home | 1,690 | 44.7% |
| Cellular Data Only | 323 | 8.6% |
| Satellite Internet | 448 | 11.9% |
| No Internet | 1,552 | 41.1% |
| Total | 3,778 | 100.0% |
Fitzgerald Summary
Fitzgerald, Georgia is a city located in Ben Hill County in the south-central part of the state. It is the county seat and the largest city in the county. The city was founded in 1895 and named after the former Governor of Georgia, Nathan E. Fitzgerald. The population of Fitzgerald was 8,945 at the 2010 census, an increase of 8.3% since 2000.
Geography
Fitzgerald is located at 31°45'25" North, 83°14'45" West (31.756944, -83.245833). The city is situated in the Ocmulgee River Valley, about halfway between Macon and Valdosta. The city is located in the heart of the Georgia Piedmont, a region of rolling hills and flat plains. The city is surrounded by farmland and is located near the Ocmulgee National Wildlife Refuge.
Climate
Fitzgerald has a humid subtropical climate, with hot, humid summers and mild winters. The average annual temperature is 64.3°F (17.9°C). The average annual precipitation is 48.3 inches (1227 mm).
Economy
Fitzgerald is a small city with a diverse economy. The city is home to several manufacturing companies, including a paper mill, a furniture factory, and a plastics plant. The city also has a strong agricultural sector, with a large number of farms in the surrounding area. The city is also home to several retail stores, restaurants, and other businesses.
Demographics
As of the 2010 census, there were 8,945 people, 3,541 households, and 2,092 families residing in the city. The population density was 1,092.3 people per square mile (421.7/km2). The racial makeup of the city was 54.2% White, 39.7% African American, 0.3% Native American, 0.7% Asian, 0.1% Pacific Islander, 3.7% from other races, and 1.2% from two or more races. Hispanic or Latino of any race were 6.2% of the population.
The median income for a household in the city was $25,945, and the median income for a family was $32,917. Males had a median income of $27,917 versus $20,945 for females. The per capita income for the city was $14,945. About 18.2% of families and 22.2% of the population were below the poverty line, including 33.3% of those under age 18 and 16.2% of those age 65 or over.
Conclusion
Fitzgerald, Georgia is a small city located in Ben Hill County in the south-central part of the state. It is the county seat and the largest city in the county. The city was founded in 1895 and named after the former Governor of Georgia, Nathan E. Fitzgerald. The city has a diverse economy, with a strong manufacturing and agricultural sector. The population of Fitzgerald was 8,945 at the 2010 census, an increase of 8.3% since 2000. The city has a humid subtropical climate, with hot, humid summers and mild winters. The median income for a household in the city was $25,945, and the median income for a family was $32,917. About 18.2% of families and 22.2% of the population were below the poverty line.
Common Questions
What is Per Capita Income in Fitzgerald?
Per Capita income in Fitzgerald is $20,293.
What is the Median Family Income in Fitzgerald?
Median Family Income in Fitzgerald is $37,024.
What is the Median Household income in Fitzgerald?
Median Household Income in Fitzgerald is $32,500.
What is Income or Wage Gap in Fitzgerald?
Income or Wage Gap in Fitzgerald is 13.7%.
Women in Fitzgerald earn 86.3 cents for every dollar earned by a man.
What is Inequality or Gini Index in Fitzgerald?
Inequality or Gini Index in Fitzgerald is 0.45.
What is the Total Population of Fitzgerald?
Total Population of Fitzgerald is 8,972.
What is the Total Male Population of Fitzgerald?
Total Male Population of Fitzgerald is 3,977.
What is the Total Female Population of Fitzgerald?
Total Female Population of Fitzgerald is 4,995.
What is the Ratio of Males per 100 Females in Fitzgerald?
There are 79.62 Males per 100 Females in Fitzgerald.
What is the Ratio of Females per 100 Males in Fitzgerald?
There are 125.60 Females per 100 Males in Fitzgerald.
What is the Median Population Age in Fitzgerald?
Median Population Age in Fitzgerald is 35.3 Years.
What is the Average Family Size in Fitzgerald
Average Family Size in Fitzgerald is 3.1 People.
What is the Average Household Size in Fitzgerald
Average Household Size in Fitzgerald is 2.3 People.
How Large is the Labor Force in Fitzgerald?
There are 4,017 People in the Labor Forcein in Fitzgerald.
What is the Percentage of People in the Labor Force in Fitzgerald?
58.3% of People are in the Labor Force in Fitzgerald.
What is the Unemployment Rate in Fitzgerald?
Unemployment Rate in Fitzgerald is 6.1%.