Elberton, GA Map & Demographics
Elberton Map
Elberton Overview
$24,891
PER CAPITA INCOME
$49,621
AVG FAMILY INCOME
$38,562
AVG HOUSEHOLD INCOME
40.9%
WAGE / INCOME GAP [ % ]
59.1¢/ $1
WAGE / INCOME GAP [ $ ]
0.49
INEQUALITY / GINI INDEX
4,627
TOTAL POPULATION
2,214
MALE POPULATION
2,413
FEMALE POPULATION
91.75
MALES / 100 FEMALES
108.99
FEMALES / 100 MALES
34.6
MEDIAN AGE
3.4
AVG FAMILY SIZE
2.4
AVG HOUSEHOLD SIZE
1,977
LABOR FORCE [ PEOPLE ]
58.6%
PERCENT IN LABOR FORCE
8.4%
UNEMPLOYMENT RATE
Elberton Zip Codes
Elberton Area Codes
Income in Elberton
Income Overview in Elberton
Per Capita Income in Elberton is $24,891, while median incomes of families and households are $49,621 and $38,562 respectively.
| Characteristic | Number | Measure |
| Per Capita Income | 4,627 | $24,891 |
| Median Family Income | 1,017 | $49,621 |
| Mean Family Income | 1,017 | $74,418 |
| Median Household Income | 1,838 | $38,562 |
| Mean Household Income | 1,838 | $57,909 |
| Income Deficit | 1,017 | $0 |
| Wage / Income Gap (%) | 4,627 | 40.87% |
| Wage / Income Gap ($) | 4,627 | 59.13¢ per $1 |
| Gini / Inequality Index | 4,627 | 0.49 |
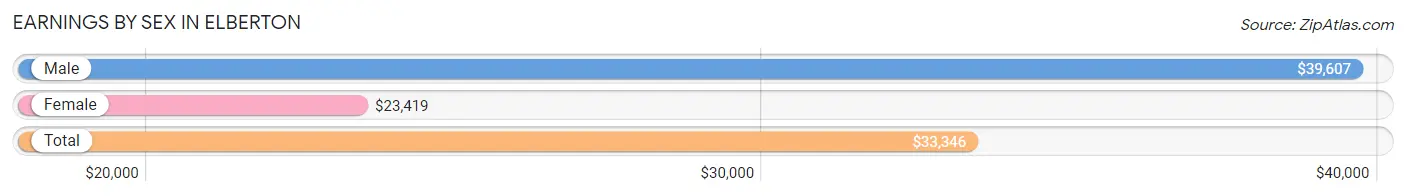
Earnings by Sex in Elberton
Average Earnings in Elberton are $33,346, $39,607 for men and $23,419 for women, a difference of 40.9%.
| Sex | Number | Average Earnings |
| Male | 1,131 (54.8%) | $39,607 |
| Female | 931 (45.2%) | $23,419 |
| Total | 2,062 (100.0%) | $33,346 |
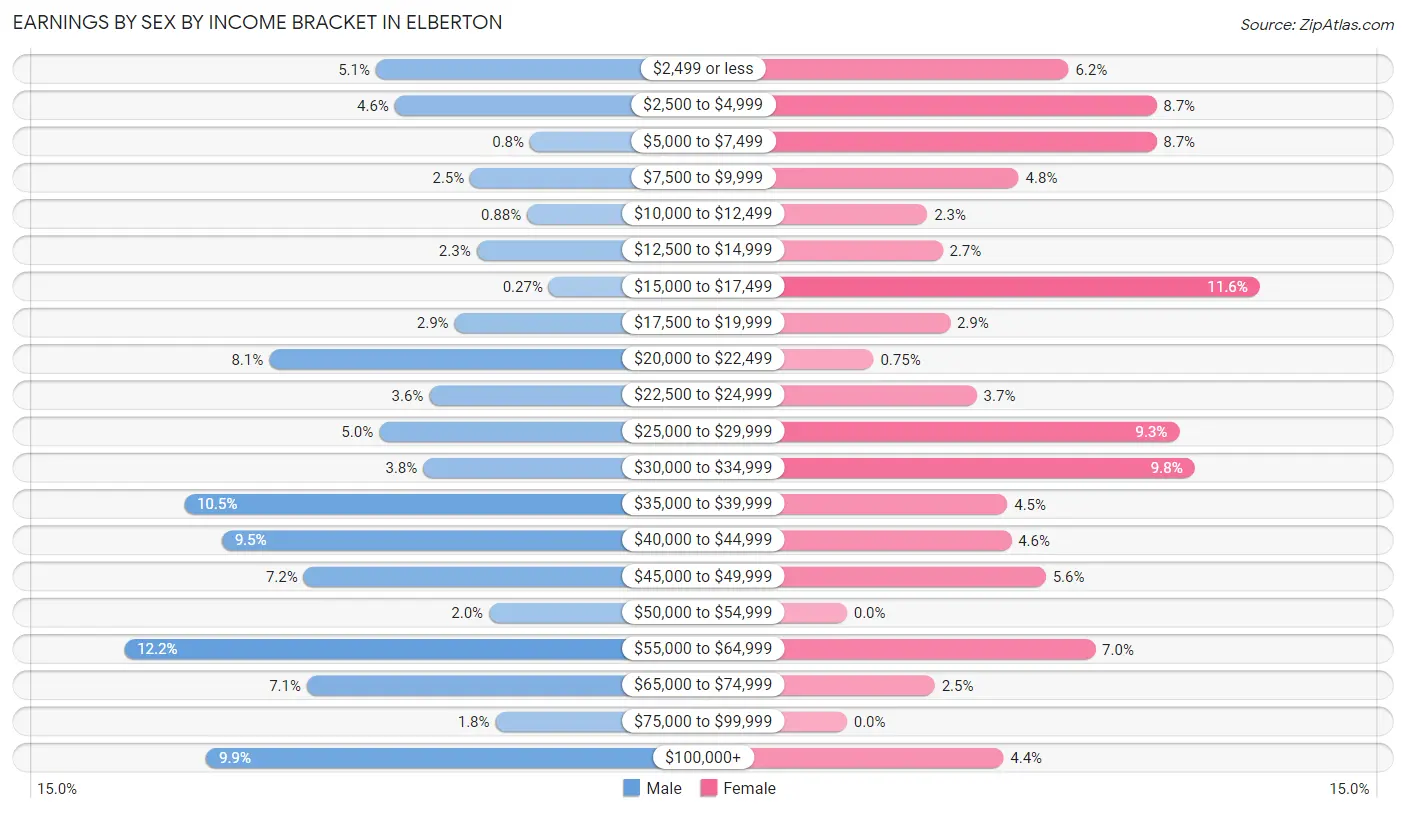
Earnings by Sex by Income Bracket in Elberton
The most common earnings brackets in Elberton are $55,000 to $64,999 for men (138 | 12.2%) and $15,000 to $17,499 for women (108 | 11.6%).
| Income | Male | Female |
| $2,499 or less | 58 (5.1%) | 58 (6.2%) |
| $2,500 to $4,999 | 52 (4.6%) | 81 (8.7%) |
| $5,000 to $7,499 | 9 (0.8%) | 81 (8.7%) |
| $7,500 to $9,999 | 28 (2.5%) | 45 (4.8%) |
| $10,000 to $12,499 | 10 (0.9%) | 21 (2.3%) |
| $12,500 to $14,999 | 26 (2.3%) | 25 (2.7%) |
| $15,000 to $17,499 | 3 (0.3%) | 108 (11.6%) |
| $17,500 to $19,999 | 33 (2.9%) | 27 (2.9%) |
| $20,000 to $22,499 | 92 (8.1%) | 7 (0.7%) |
| $22,500 to $24,999 | 41 (3.6%) | 34 (3.6%) |
| $25,000 to $29,999 | 57 (5.0%) | 87 (9.3%) |
| $30,000 to $34,999 | 43 (3.8%) | 91 (9.8%) |
| $35,000 to $39,999 | 119 (10.5%) | 42 (4.5%) |
| $40,000 to $44,999 | 107 (9.5%) | 43 (4.6%) |
| $45,000 to $49,999 | 81 (7.2%) | 52 (5.6%) |
| $50,000 to $54,999 | 22 (1.9%) | 0 (0.0%) |
| $55,000 to $64,999 | 138 (12.2%) | 65 (7.0%) |
| $65,000 to $74,999 | 80 (7.1%) | 23 (2.5%) |
| $75,000 to $99,999 | 20 (1.8%) | 0 (0.0%) |
| $100,000+ | 112 (9.9%) | 41 (4.4%) |
| Total | 1,131 (100.0%) | 931 (100.0%) |
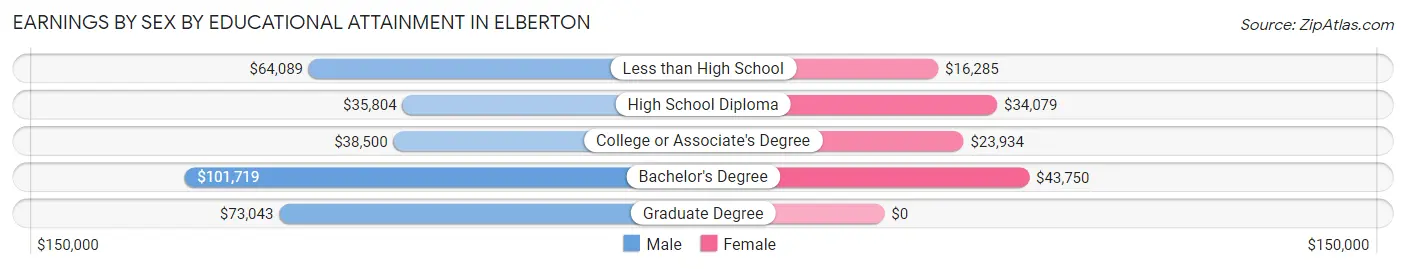
Earnings by Sex by Educational Attainment in Elberton
Average earnings in Elberton are $43,310 for men and $26,809 for women, a difference of 38.1%. Men with an educational attainment of bachelor's degree enjoy the highest average annual earnings of $101,719, while those with high school diploma education earn the least with $35,804. Women with an educational attainment of bachelor's degree earn the most with the average annual earnings of $43,750, while those with less than high school education have the smallest earnings of $16,285.
| Educational Attainment | Male Income | Female Income |
| Less than High School | $64,089 | $16,285 |
| High School Diploma | $35,804 | $34,079 |
| College or Associate's Degree | $38,500 | $23,934 |
| Bachelor's Degree | $101,719 | $43,750 |
| Graduate Degree | $73,043 | $0 |
| Total | $43,310 | $26,809 |
Family Income in Elberton
Family Income Brackets in Elberton
According to the Elberton family income data, there are 232 families falling into the $35,000 to $49,999 income range, which is the most common income bracket and makes up 22.8% of all families.
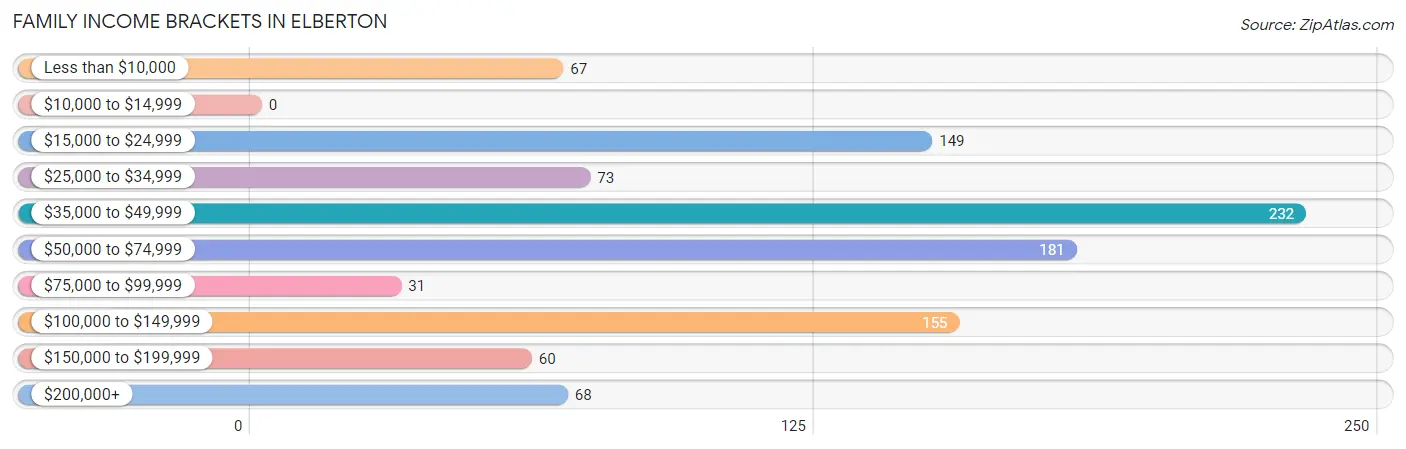
| Income Bracket | # Families | % Families |
| Less than $10,000 | 67 | 6.6% |
| $10,000 to $14,999 | 0 | 0.0% |
| $15,000 to $24,999 | 149 | 14.7% |
| $25,000 to $34,999 | 73 | 7.2% |
| $35,000 to $49,999 | 232 | 22.8% |
| $50,000 to $74,999 | 181 | 17.8% |
| $75,000 to $99,999 | 31 | 3.0% |
| $100,000 to $149,999 | 155 | 15.2% |
| $150,000 to $199,999 | 60 | 5.9% |
| $200,000+ | 68 | 6.7% |
Family Income by Famaliy Size in Elberton
3-person families (243 | 23.9%) account for the highest median family income in Elberton with $67,989 per family, while 2-person families (424 | 41.7%) have the highest median income of $25,625 per family member.
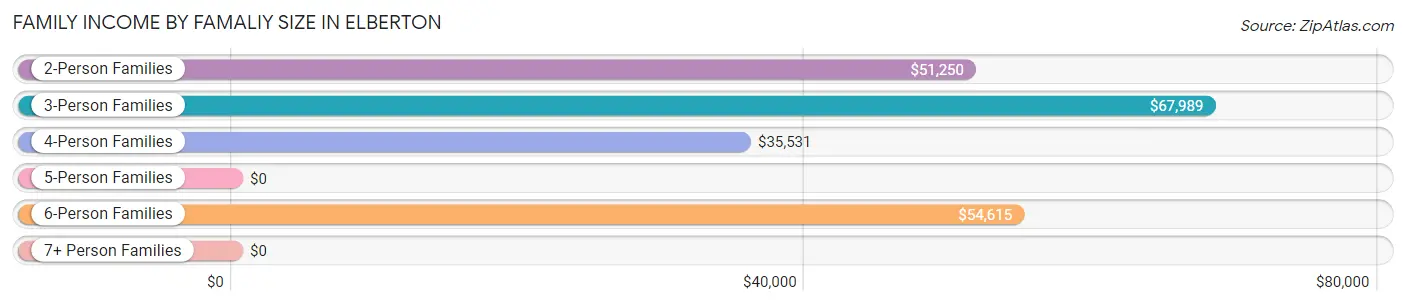
| Income Bracket | # Families | Median Income |
| 2-Person Families | 424 (41.7%) | $51,250 |
| 3-Person Families | 243 (23.9%) | $67,989 |
| 4-Person Families | 170 (16.7%) | $35,531 |
| 5-Person Families | 54 (5.3%) | $0 |
| 6-Person Families | 50 (4.9%) | $54,615 |
| 7+ Person Families | 76 (7.5%) | $0 |
| Total | 1,017 (100.0%) | $49,621 |
Family Income by Number of Earners in Elberton
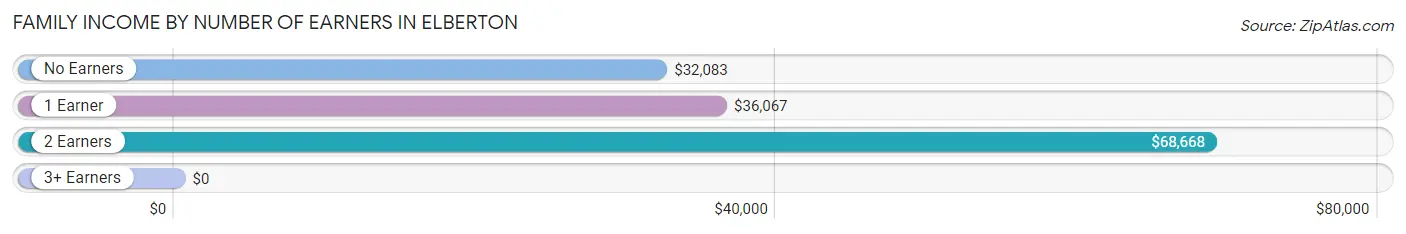
| Number of Earners | # Families | Median Income |
| No Earners | 155 (15.2%) | $32,083 |
| 1 Earner | 386 (38.0%) | $36,067 |
| 2 Earners | 391 (38.5%) | $68,668 |
| 3+ Earners | 85 (8.4%) | $0 |
| Total | 1,017 (100.0%) | $49,621 |
Household Income in Elberton
Household Income Brackets in Elberton
With 421 households falling in the category, the $35,000 to $49,999 income range is the most frequent in Elberton, accounting for 22.9% of all households. In contrast, only 68 households (3.7%) fall into the $200,000+ income bracket, making it the least populous group.
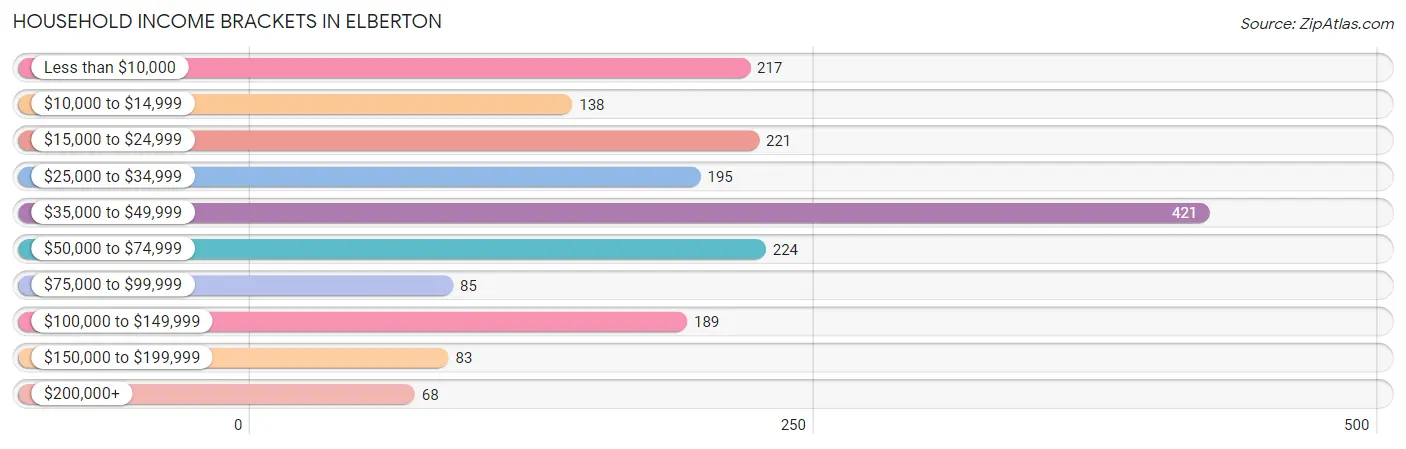
| Income Bracket | # Households | % Households |
| Less than $10,000 | 217 | 11.8% |
| $10,000 to $14,999 | 138 | 7.5% |
| $15,000 to $24,999 | 221 | 12.0% |
| $25,000 to $34,999 | 195 | 10.6% |
| $35,000 to $49,999 | 421 | 22.9% |
| $50,000 to $74,999 | 224 | 12.2% |
| $75,000 to $99,999 | 85 | 4.6% |
| $100,000 to $149,999 | 189 | 10.3% |
| $150,000 to $199,999 | 83 | 4.5% |
| $200,000+ | 68 | 3.7% |
Household Income by Householder Age in Elberton
The median household income in Elberton is $38,562, with the highest median household income of $49,281 found in the 65+ years age bracket for the primary householder. A total of 487 households (26.5%) fall into this category. Meanwhile, the 15 to 24 years age bracket for the primary householder has the lowest median household income of $0, with 94 households (5.1%) in this group.
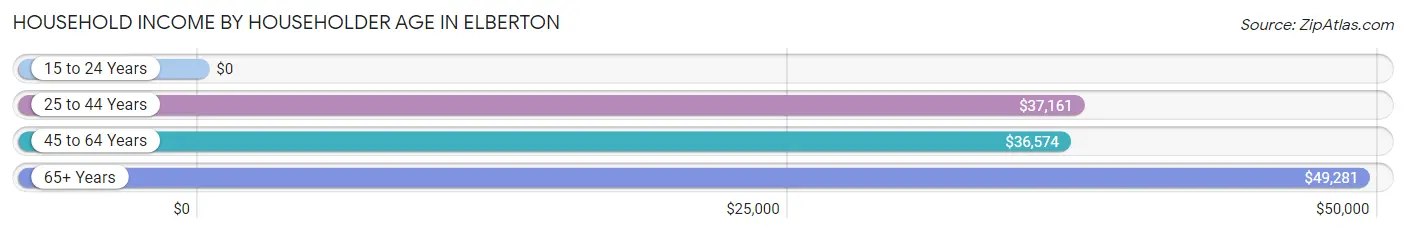
| Income Bracket | # Households | Median Income |
| 15 to 24 Years | 94 (5.1%) | $0 |
| 25 to 44 Years | 639 (34.8%) | $37,161 |
| 45 to 64 Years | 618 (33.6%) | $36,574 |
| 65+ Years | 487 (26.5%) | $49,281 |
| Total | 1,838 (100.0%) | $38,562 |
Poverty in Elberton
Income Below Poverty by Sex and Age in Elberton
With 21.8% poverty level for males and 37.3% for females among the residents of Elberton, 5 year old males and under 5 year old females are the most vulnerable to poverty, with 38 males (100.0%) and 79 females (90.8%) in their respective age groups living below the poverty level.
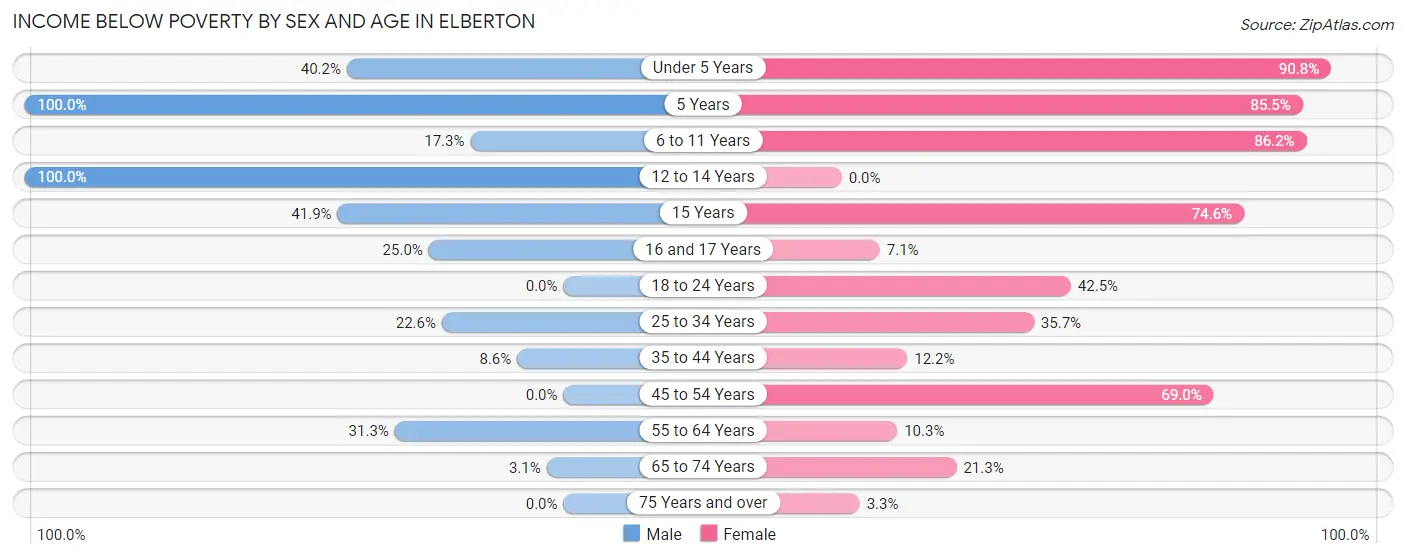
| Age Bracket | Male | Female |
| Under 5 Years | 121 (40.2%) | 79 (90.8%) |
| 5 Years | 38 (100.0%) | 59 (85.5%) |
| 6 to 11 Years | 38 (17.3%) | 257 (86.2%) |
| 12 to 14 Years | 57 (100.0%) | 0 (0.0%) |
| 15 Years | 13 (41.9%) | 50 (74.6%) |
| 16 and 17 Years | 14 (25.0%) | 6 (7.1%) |
| 18 to 24 Years | 0 (0.0%) | 74 (42.5%) |
| 25 to 34 Years | 58 (22.6%) | 133 (35.7%) |
| 35 to 44 Years | 23 (8.6%) | 36 (12.2%) |
| 45 to 54 Years | 0 (0.0%) | 98 (69.0%) |
| 55 to 64 Years | 93 (31.3%) | 28 (10.3%) |
| 65 to 74 Years | 8 (3.1%) | 56 (21.3%) |
| 75 Years and over | 0 (0.0%) | 5 (3.3%) |
| Total | 463 (21.8%) | 881 (37.3%) |
Income Above Poverty by Sex and Age in Elberton
According to the poverty statistics in Elberton, males aged 18 to 24 years and females aged 12 to 14 years are the age groups that are most secure financially, with 100.0% of males and 100.0% of females in these age groups living above the poverty line.
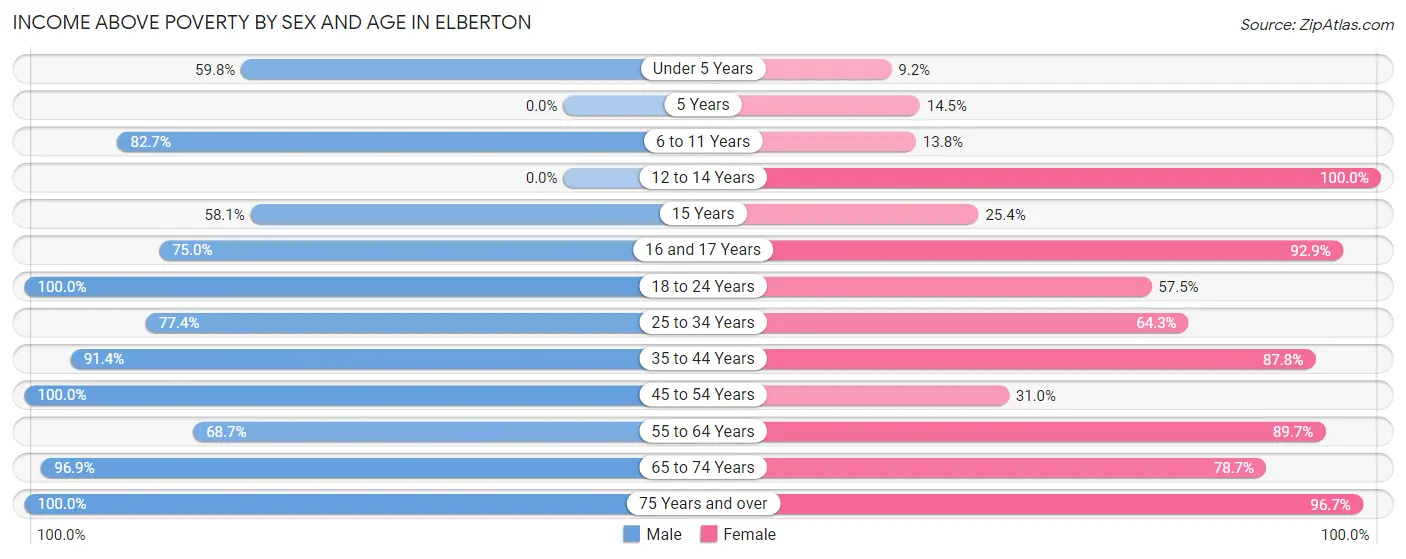
| Age Bracket | Male | Female |
| Under 5 Years | 180 (59.8%) | 8 (9.2%) |
| 5 Years | 0 (0.0%) | 10 (14.5%) |
| 6 to 11 Years | 182 (82.7%) | 41 (13.8%) |
| 12 to 14 Years | 0 (0.0%) | 85 (100.0%) |
| 15 Years | 18 (58.1%) | 17 (25.4%) |
| 16 and 17 Years | 42 (75.0%) | 79 (92.9%) |
| 18 to 24 Years | 109 (100.0%) | 100 (57.5%) |
| 25 to 34 Years | 199 (77.4%) | 240 (64.3%) |
| 35 to 44 Years | 245 (91.4%) | 260 (87.8%) |
| 45 to 54 Years | 173 (100.0%) | 44 (31.0%) |
| 55 to 64 Years | 204 (68.7%) | 244 (89.7%) |
| 65 to 74 Years | 249 (96.9%) | 207 (78.7%) |
| 75 Years and over | 64 (100.0%) | 145 (96.7%) |
| Total | 1,665 (78.2%) | 1,480 (62.7%) |
Income Below Poverty Among Married-Couple Families in Elberton
The poverty statistics for married-couple families in Elberton show that 5.1% or 33 of the total 647 families live below the poverty line. Families with 3 or 4 children have the highest poverty rate of 17.9%, comprising of 14 families. On the other hand, families with 1 or 2 children have the lowest poverty rate of 3.0%, which includes 8 families.
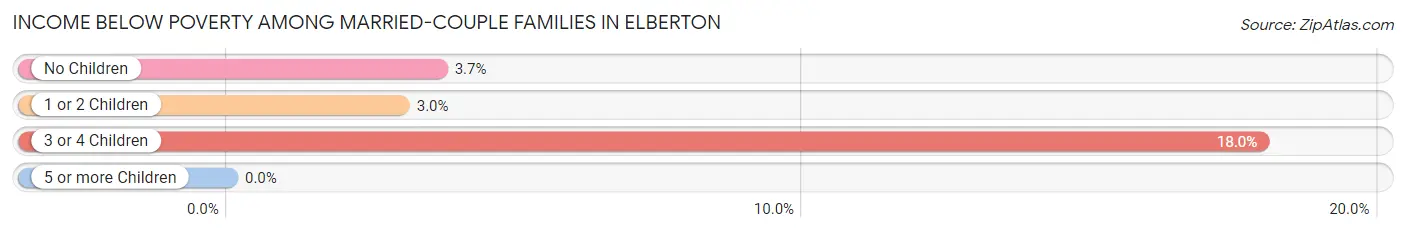
| Children | Above Poverty | Below Poverty |
| No Children | 290 (96.4%) | 11 (3.6%) |
| 1 or 2 Children | 260 (97.0%) | 8 (3.0%) |
| 3 or 4 Children | 64 (82.1%) | 14 (17.9%) |
| 5 or more Children | 0 (0.0%) | 0 (0.0%) |
| Total | 614 (94.9%) | 33 (5.1%) |
Income Below Poverty Among Single-Parent Households in Elberton
According to the poverty data in Elberton, 54.5% or 48 single-father households and 48.2% or 136 single-mother households are living below the poverty line. Among single-father households, those with 3 or 4 children have the highest poverty rate, with 48 households (100.0%) experiencing poverty. Likewise, among single-mother households, those with 5 or more children have the highest poverty rate, with 62 households (100.0%) falling below the poverty line.
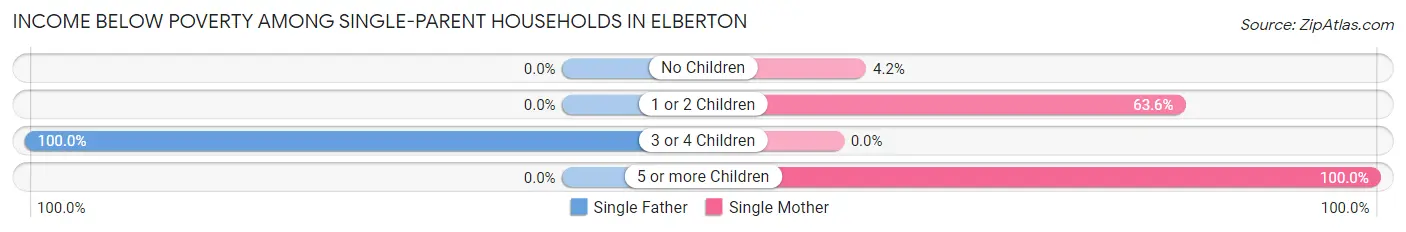
| Children | Single Father | Single Mother |
| No Children | 0 (0.0%) | 4 (4.2%) |
| 1 or 2 Children | 0 (0.0%) | 70 (63.6%) |
| 3 or 4 Children | 48 (100.0%) | 0 (0.0%) |
| 5 or more Children | 0 (0.0%) | 62 (100.0%) |
| Total | 48 (54.5%) | 136 (48.2%) |
Income Below Poverty Among Married-Couple vs Single-Parent Households in Elberton
The poverty data for Elberton shows that 33 of the married-couple family households (5.1%) and 184 of the single-parent households (49.7%) are living below the poverty level. Within the married-couple family households, those with 3 or 4 children have the highest poverty rate, with 14 households (17.9%) falling below the poverty line. Among the single-parent households, those with 5 or more children have the highest poverty rate, with 62 household (100.0%) living below poverty.
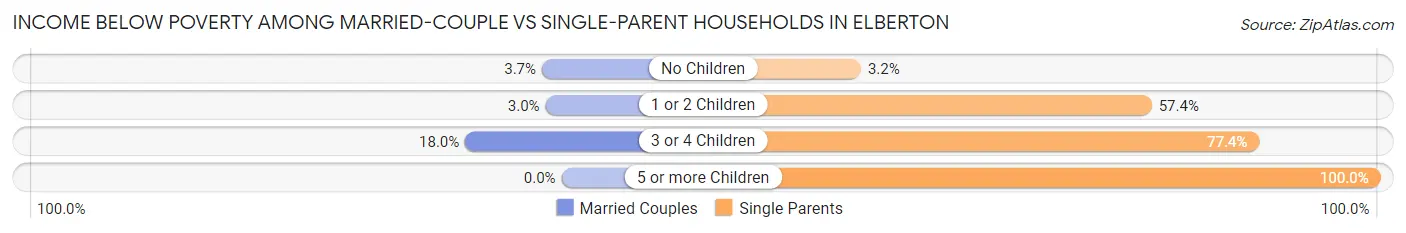
| Children | Married-Couple Families | Single-Parent Households |
| No Children | 11 (3.6%) | 4 (3.2%) |
| 1 or 2 Children | 8 (3.0%) | 70 (57.4%) |
| 3 or 4 Children | 14 (17.9%) | 48 (77.4%) |
| 5 or more Children | 0 (0.0%) | 62 (100.0%) |
| Total | 33 (5.1%) | 184 (49.7%) |
Race in Elberton
The most populous races in Elberton are White / Caucasian (2,162 | 46.7%), Black / African American (2,127 | 46.0%), and Hispanic or Latino (378 | 8.2%).
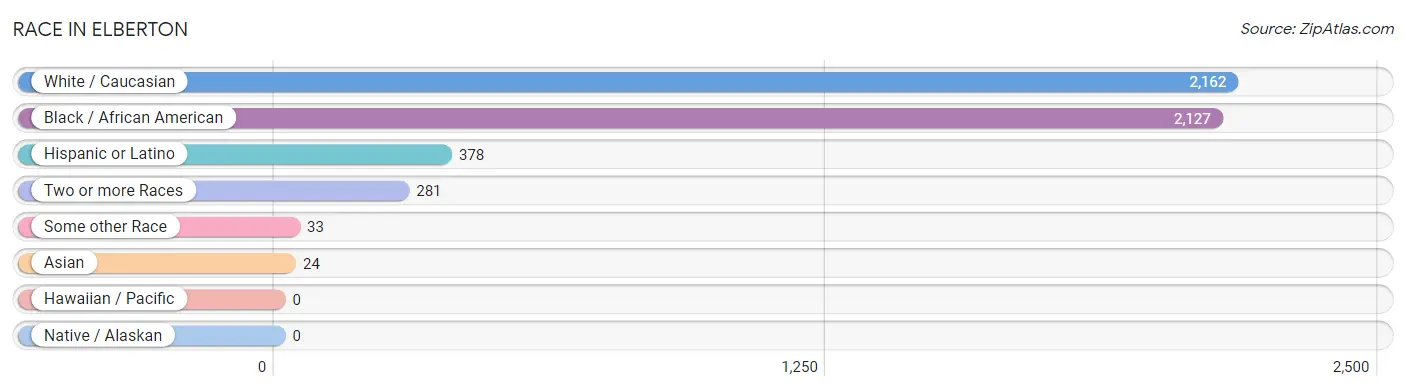
| Race | # Population | % Population |
| Asian | 24 | 0.5% |
| Black / African American | 2,127 | 46.0% |
| Hawaiian / Pacific | 0 | 0.0% |
| Hispanic or Latino | 378 | 8.2% |
| Native / Alaskan | 0 | 0.0% |
| White / Caucasian | 2,162 | 46.7% |
| Two or more Races | 281 | 6.1% |
| Some other Race | 33 | 0.7% |
| Total | 4,627 | 100.0% |
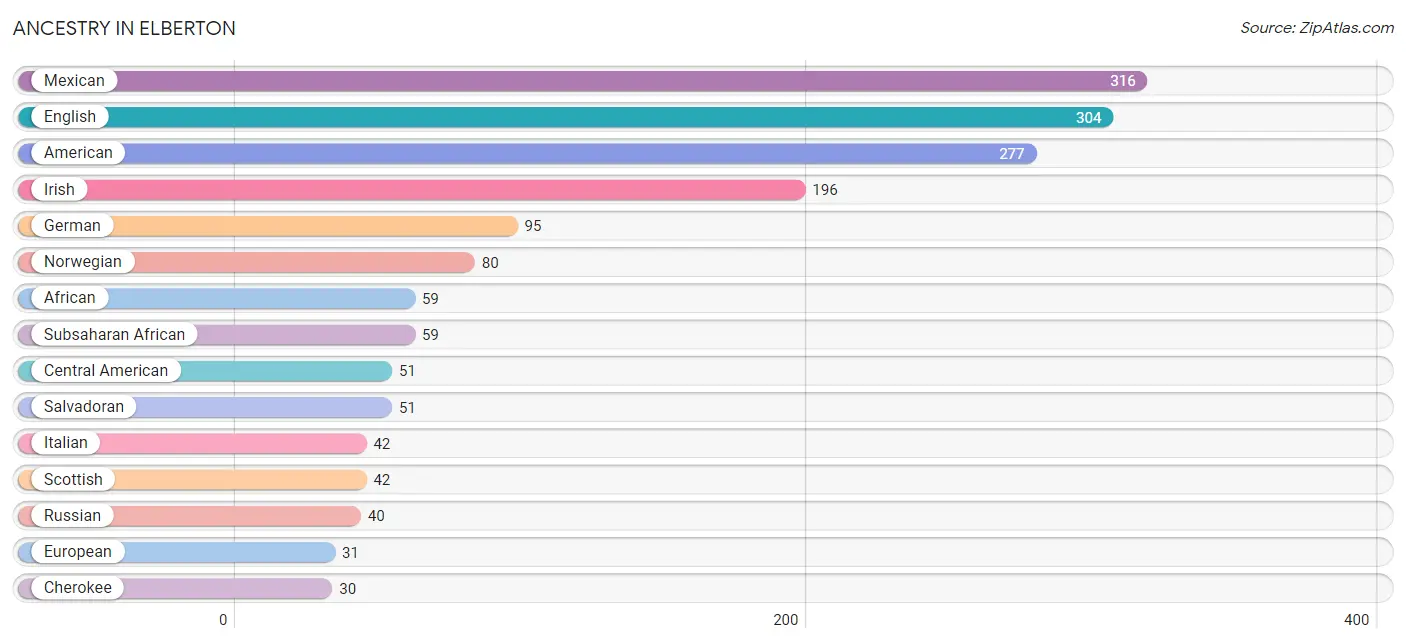
Ancestry in Elberton
The most populous ancestries reported in Elberton are Mexican (316 | 6.8%), English (304 | 6.6%), American (277 | 6.0%), Irish (196 | 4.2%), and German (95 | 2.1%), together accounting for 25.7% of all Elberton residents.
| Ancestry | # Population | % Population |
| African | 59 | 1.3% |
| American | 277 | 6.0% |
| British | 27 | 0.6% |
| Central American | 51 | 1.1% |
| Central American Indian | 11 | 0.2% |
| Cherokee | 30 | 0.6% |
| English | 304 | 6.6% |
| European | 31 | 0.7% |
| French | 12 | 0.3% |
| German | 95 | 2.1% |
| Hungarian | 15 | 0.3% |
| Iranian | 5 | 0.1% |
| Irish | 196 | 4.2% |
| Italian | 42 | 0.9% |
| Mexican | 316 | 6.8% |
| Norwegian | 80 | 1.7% |
| Polish | 20 | 0.4% |
| Puerto Rican | 11 | 0.2% |
| Russian | 40 | 0.9% |
| Salvadoran | 51 | 1.1% |
| Scotch-Irish | 20 | 0.4% |
| Scottish | 42 | 0.9% |
| Subsaharan African | 59 | 1.3% |
| Swedish | 21 | 0.4% |
| Thai | 24 | 0.5% |
| Welsh | 6 | 0.1% | View All 26 Rows |
Immigrants in Elberton
The most numerous immigrant groups reported in Elberton came from Central America (327 | 7.1%), Latin America (327 | 7.1%), Mexico (276 | 6.0%), El Salvador (51 | 1.1%), and Asia (21 | 0.4%), together accounting for 21.7% of all Elberton residents.
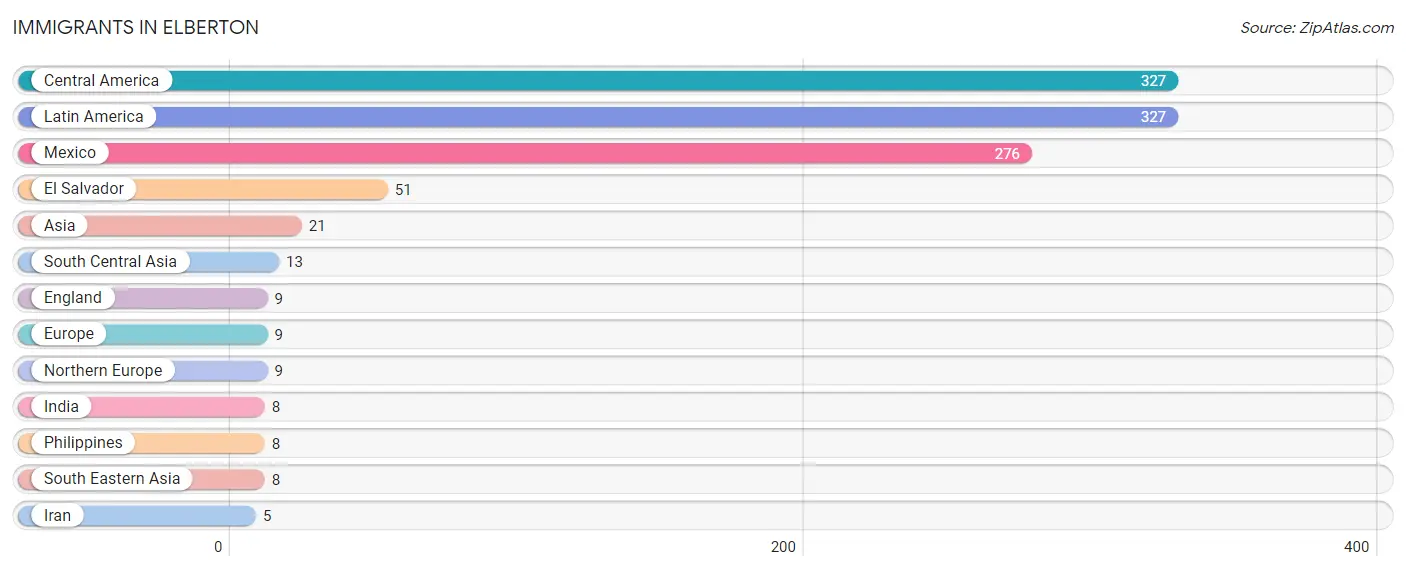
| Immigration Origin | # Population | % Population |
| Asia | 21 | 0.4% |
| Central America | 327 | 7.1% |
| El Salvador | 51 | 1.1% |
| England | 9 | 0.2% |
| Europe | 9 | 0.2% |
| India | 8 | 0.2% |
| Iran | 5 | 0.1% |
| Latin America | 327 | 7.1% |
| Mexico | 276 | 6.0% |
| Northern Europe | 9 | 0.2% |
| Philippines | 8 | 0.2% |
| South Central Asia | 13 | 0.3% |
| South Eastern Asia | 8 | 0.2% | View All 13 Rows |
Sex and Age in Elberton
Sex and Age in Elberton
The most populous age groups in Elberton are Under 5 Years (301 | 13.6%) for men and 30 to 34 Years (263 | 10.9%) for women.
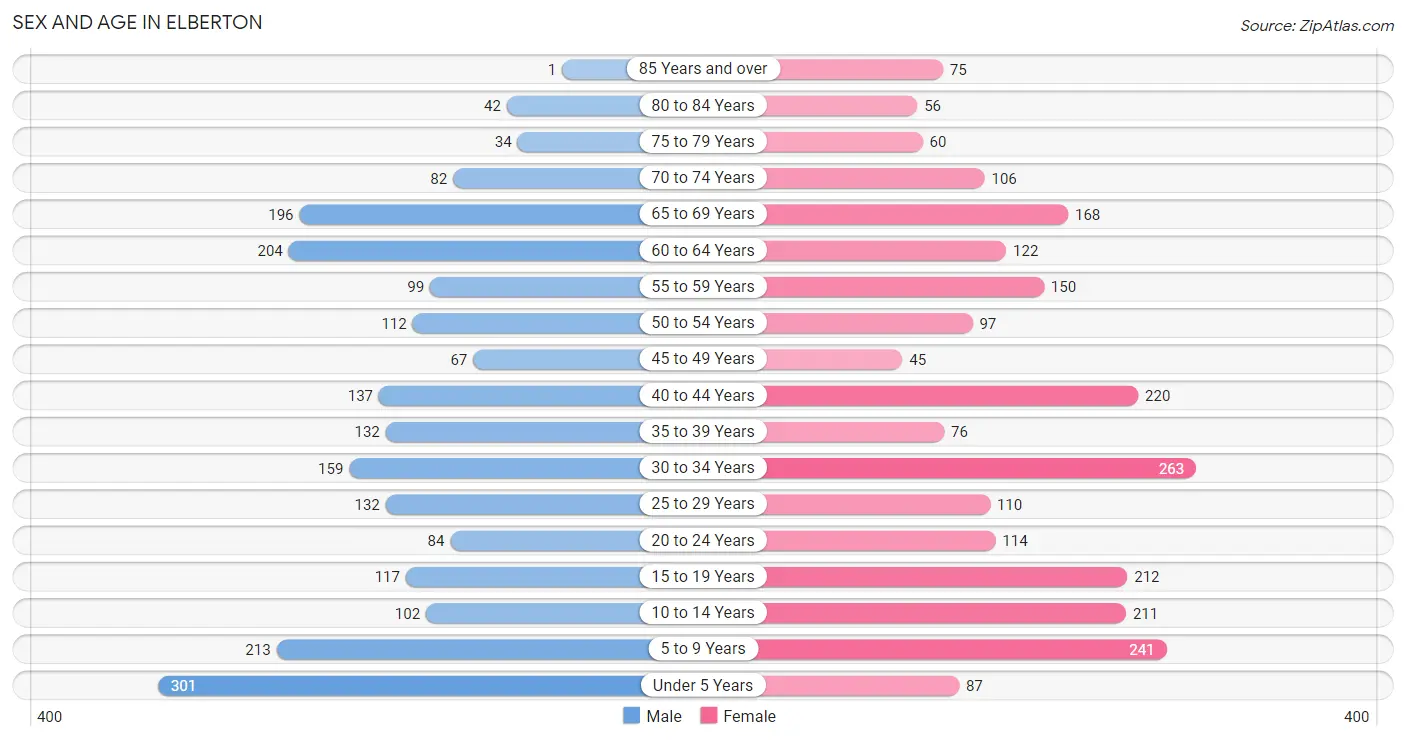
| Age Bracket | Male | Female |
| Under 5 Years | 301 (13.6%) | 87 (3.6%) |
| 5 to 9 Years | 213 (9.6%) | 241 (10.0%) |
| 10 to 14 Years | 102 (4.6%) | 211 (8.7%) |
| 15 to 19 Years | 117 (5.3%) | 212 (8.8%) |
| 20 to 24 Years | 84 (3.8%) | 114 (4.7%) |
| 25 to 29 Years | 132 (6.0%) | 110 (4.6%) |
| 30 to 34 Years | 159 (7.2%) | 263 (10.9%) |
| 35 to 39 Years | 132 (6.0%) | 76 (3.2%) |
| 40 to 44 Years | 137 (6.2%) | 220 (9.1%) |
| 45 to 49 Years | 67 (3.0%) | 45 (1.9%) |
| 50 to 54 Years | 112 (5.1%) | 97 (4.0%) |
| 55 to 59 Years | 99 (4.5%) | 150 (6.2%) |
| 60 to 64 Years | 204 (9.2%) | 122 (5.1%) |
| 65 to 69 Years | 196 (8.8%) | 168 (7.0%) |
| 70 to 74 Years | 82 (3.7%) | 106 (4.4%) |
| 75 to 79 Years | 34 (1.5%) | 60 (2.5%) |
| 80 to 84 Years | 42 (1.9%) | 56 (2.3%) |
| 85 Years and over | 1 (0.1%) | 75 (3.1%) |
| Total | 2,214 (100.0%) | 2,413 (100.0%) |
Families and Households in Elberton
Median Family Size in Elberton
The median family size in Elberton is 3.37 persons per family, with single female/mother families (282 | 27.7%) accounting for the largest median family size of 3.59 persons per family. On the other hand, married-couple families (647 | 63.6%) represent the smallest median family size with 3.26 persons per family.
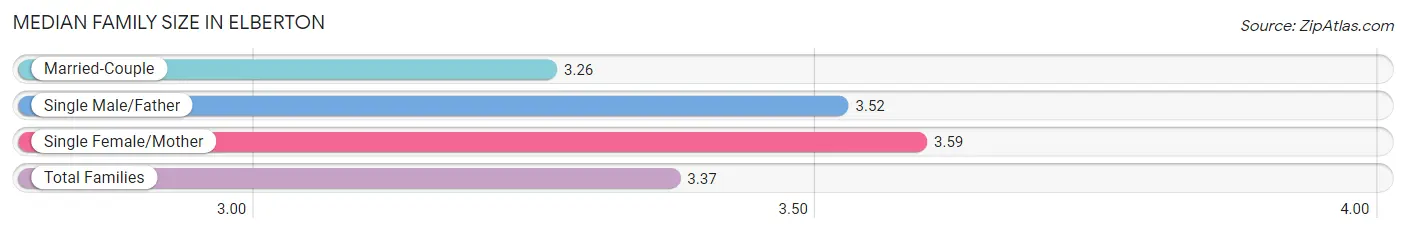
| Family Type | # Families | Family Size |
| Married-Couple | 647 (63.6%) | 3.26 |
| Single Male/Father | 88 (8.6%) | 3.52 |
| Single Female/Mother | 282 (27.7%) | 3.59 |
| Total Families | 1,017 (100.0%) | 3.37 |
Median Household Size in Elberton
The median household size in Elberton is 2.44 persons per household, with single male/father households (88 | 4.8%) accounting for the largest median household size of 4.51 persons per household. non-family households (821 | 44.7%) represent the smallest median household size with 1.11 persons per household.
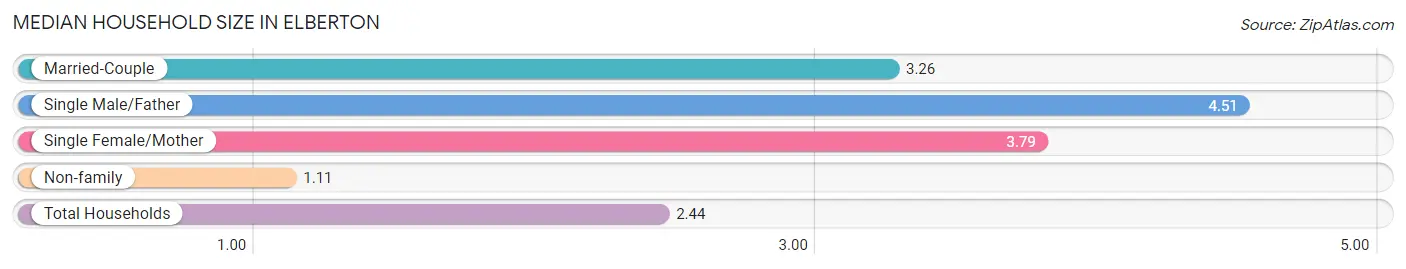
| Household Type | # Households | Household Size |
| Married-Couple | 647 (35.2%) | 3.26 |
| Single Male/Father | 88 (4.8%) | 4.51 |
| Single Female/Mother | 282 (15.3%) | 3.79 |
| Non-family | 821 (44.7%) | 1.11 |
| Total Households | 1,838 (100.0%) | 2.44 |
Household Size by Marriage Status in Elberton
Out of a total of 1,838 households in Elberton, 1,017 (55.3%) are family households, while 821 (44.7%) are nonfamily households. The most numerous type of family households are 2-person households, comprising 378, and the most common type of nonfamily households are 1-person households, comprising 738.
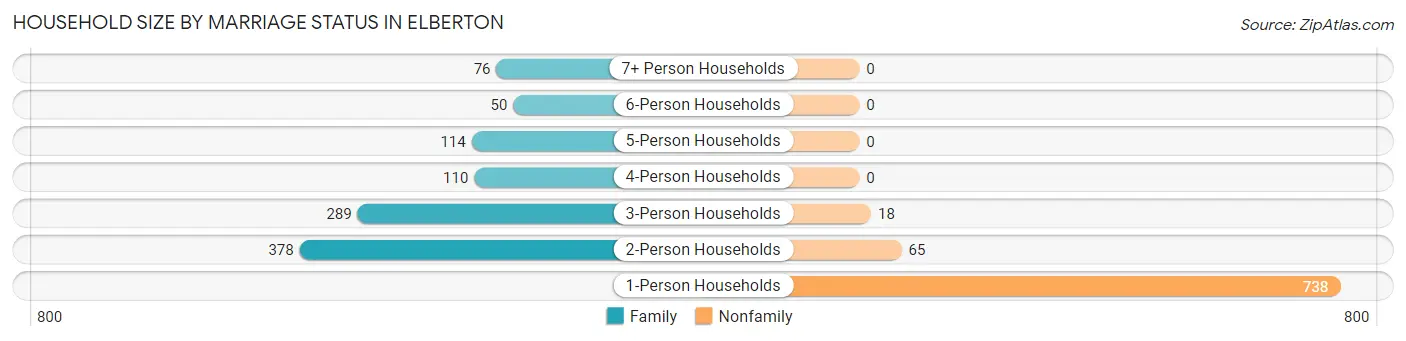
| Household Size | Family Households | Nonfamily Households |
| 1-Person Households | - | 738 (40.2%) |
| 2-Person Households | 378 (20.6%) | 65 (3.5%) |
| 3-Person Households | 289 (15.7%) | 18 (1.0%) |
| 4-Person Households | 110 (6.0%) | 0 (0.0%) |
| 5-Person Households | 114 (6.2%) | 0 (0.0%) |
| 6-Person Households | 50 (2.7%) | 0 (0.0%) |
| 7+ Person Households | 76 (4.1%) | 0 (0.0%) |
| Total | 1,017 (55.3%) | 821 (44.7%) |
Female Fertility in Elberton
Fertility by Age in Elberton
Average fertility rate in Elberton is 101.0 births per 1,000 women. Women in the age bracket of 20 to 34 years have the highest fertility rate with 216.0 births per 1,000 women. Women in the age bracket of 20 to 34 years acount for 100.0% of all women with births.
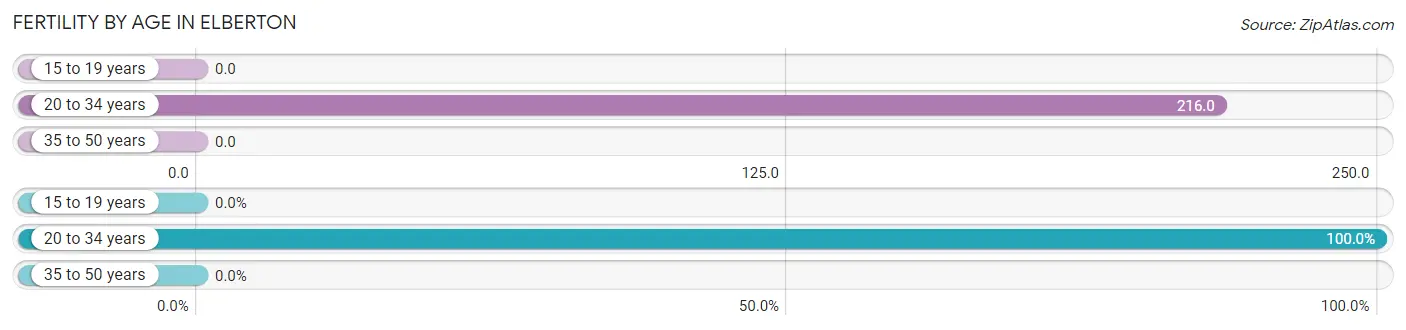
| Age Bracket | Women with Births | Births / 1,000 Women |
| 15 to 19 years | 0 (0.0%) | 0.0 |
| 20 to 34 years | 105 (100.0%) | 216.0 |
| 35 to 50 years | 0 (0.0%) | 0.0 |
| Total | 105 (100.0%) | 101.0 |
Fertility by Age by Marriage Status in Elberton
66.7% of women with births (105) in Elberton are married. The highest percentage of unmarried women with births falls into 20 to 34 years age bracket with 33.3% of them unmarried at the time of birth, while the lowest percentage of unmarried women with births belong to 20 to 34 years age bracket with 33.3% of them unmarried.
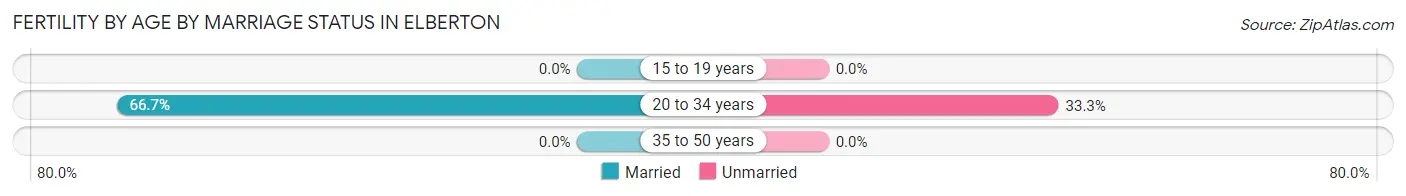
| Age Bracket | Married | Unmarried |
| 15 to 19 years | 0 (0.0%) | 0 (0.0%) |
| 20 to 34 years | 70 (66.7%) | 35 (33.3%) |
| 35 to 50 years | 0 (0.0%) | 0 (0.0%) |
| Total | 70 (66.7%) | 35 (33.3%) |
Fertility by Education in Elberton
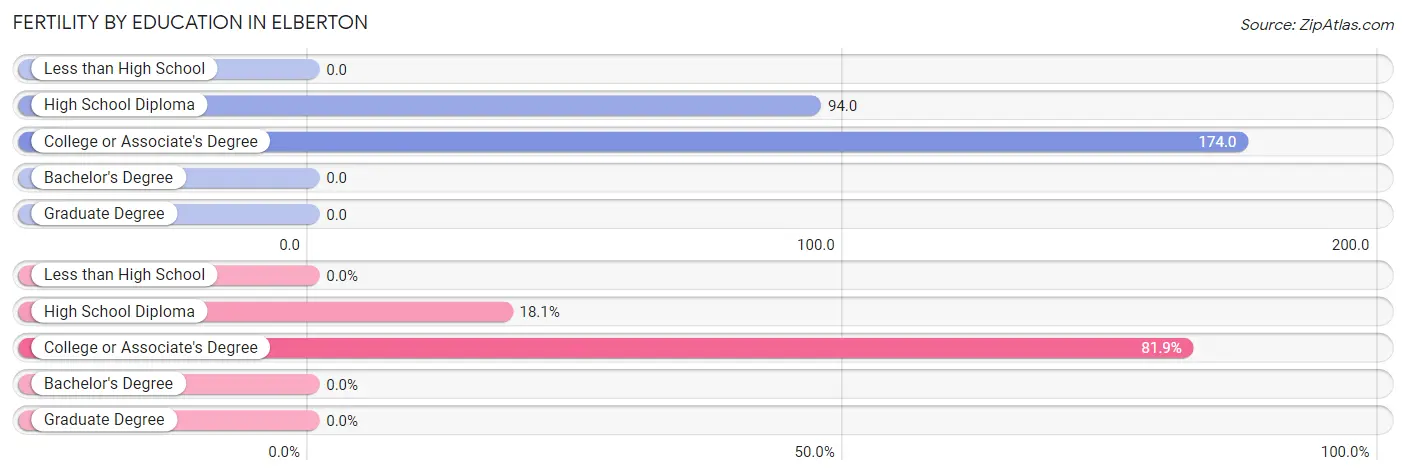
| Educational Attainment | Women with Births | Births / 1,000 Women |
| Less than High School | 0 (0.0%) | 0.0 |
| High School Diploma | 19 (18.1%) | 94.0 |
| College or Associate's Degree | 86 (81.9%) | 174.0 |
| Bachelor's Degree | 0 (0.0%) | 0.0 |
| Graduate Degree | 0 (0.0%) | 0.0 |
| Total | 105 (100.0%) | 101.0 |
Fertility by Education by Marriage Status in Elberton
33.3% of women with births in Elberton are unmarried. Women with the educational attainment of college or associate's degree are most likely to be married with 72.1% of them married at childbirth, while women with the educational attainment of high school diploma are least likely to be married with 57.9% of them unmarried at childbirth.
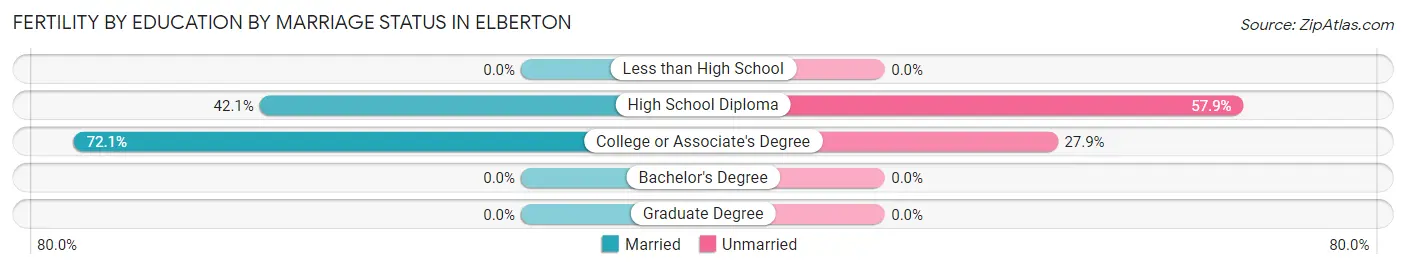
| Educational Attainment | Married | Unmarried |
| Less than High School | 0 (0.0%) | 0 (0.0%) |
| High School Diploma | 8 (42.1%) | 11 (57.9%) |
| College or Associate's Degree | 62 (72.1%) | 24 (27.9%) |
| Bachelor's Degree | 0 (0.0%) | 0 (0.0%) |
| Graduate Degree | 0 (0.0%) | 0 (0.0%) |
| Total | 70 (66.7%) | 35 (33.3%) |
Employment Characteristics in Elberton
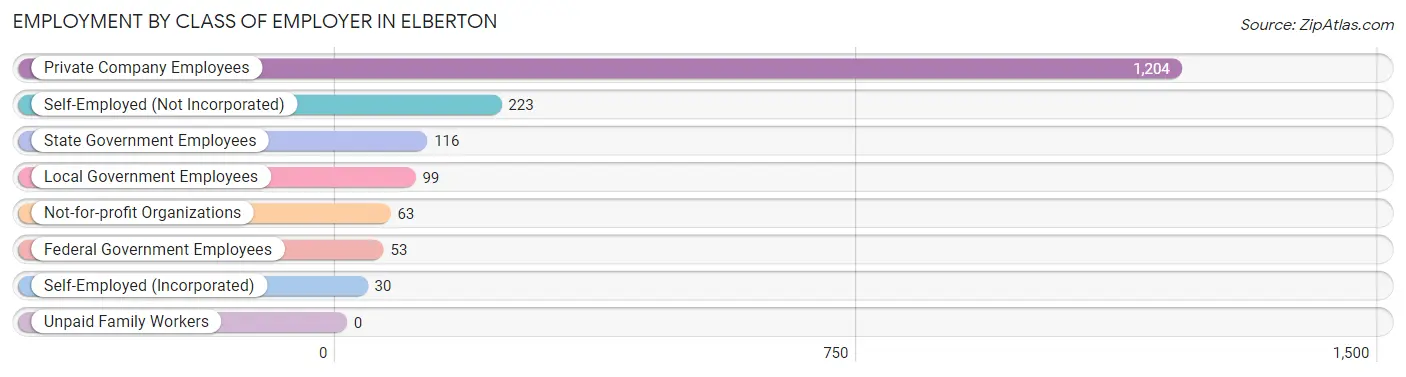
Employment by Class of Employer in Elberton
Among the 1,788 employed individuals in Elberton, private company employees (1,204 | 67.3%), self-employed (not incorporated) (223 | 12.5%), and state government employees (116 | 6.5%) make up the most common classes of employment.
| Employer Class | # Employees | % Employees |
| Private Company Employees | 1,204 | 67.3% |
| Self-Employed (Incorporated) | 30 | 1.7% |
| Self-Employed (Not Incorporated) | 223 | 12.5% |
| Not-for-profit Organizations | 63 | 3.5% |
| Local Government Employees | 99 | 5.5% |
| State Government Employees | 116 | 6.5% |
| Federal Government Employees | 53 | 3.0% |
| Unpaid Family Workers | 0 | 0.0% |
| Total | 1,788 | 100.0% |
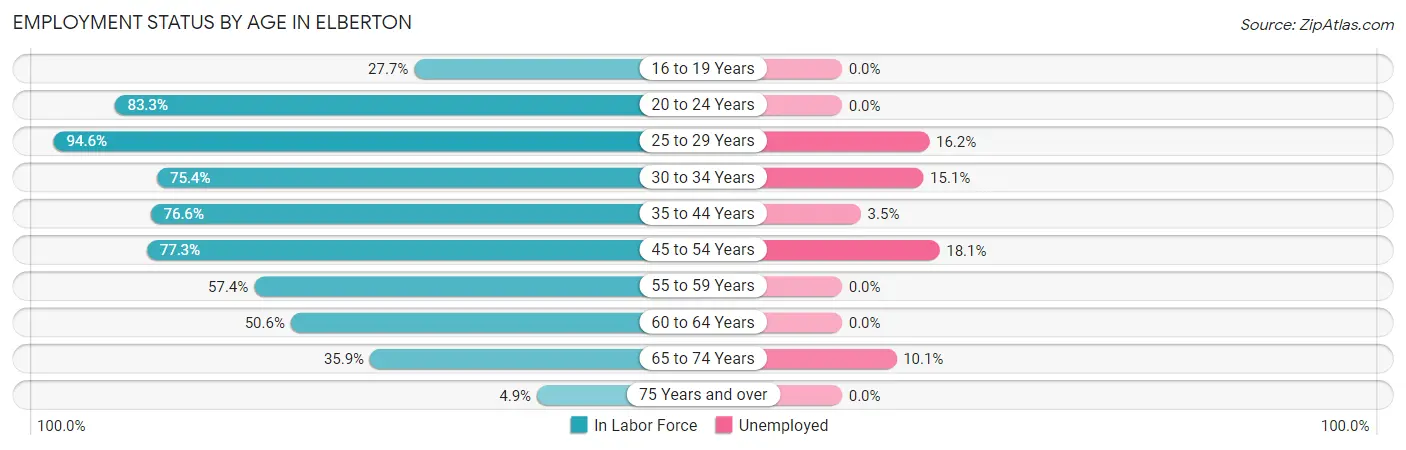
Employment Status by Age in Elberton
According to the labor force statistics for Elberton, out of the total population over 16 years of age (3,374), 58.6% or 1,977 individuals are in the labor force, with 8.4% or 166 of them unemployed. The age group with the highest labor force participation rate is 25 to 29 years, with 94.6% or 229 individuals in the labor force. Within the labor force, the 45 to 54 years age range has the highest percentage of unemployed individuals, with 18.1% or 45 of them being unemployed.
| Age Bracket | In Labor Force | Unemployed |
| 16 to 19 Years | 64 (27.7%) | 0 (0.0%) |
| 20 to 24 Years | 165 (83.3%) | 0 (0.0%) |
| 25 to 29 Years | 229 (94.6%) | 37 (16.2%) |
| 30 to 34 Years | 318 (75.4%) | 48 (15.1%) |
| 35 to 44 Years | 433 (76.6%) | 15 (3.5%) |
| 45 to 54 Years | 248 (77.3%) | 45 (18.1%) |
| 55 to 59 Years | 143 (57.4%) | 0 (0.0%) |
| 60 to 64 Years | 165 (50.6%) | 0 (0.0%) |
| 65 to 74 Years | 198 (35.9%) | 20 (10.1%) |
| 75 Years and over | 13 (4.9%) | 0 (0.0%) |
| Total | 1,977 (58.6%) | 166 (8.4%) |
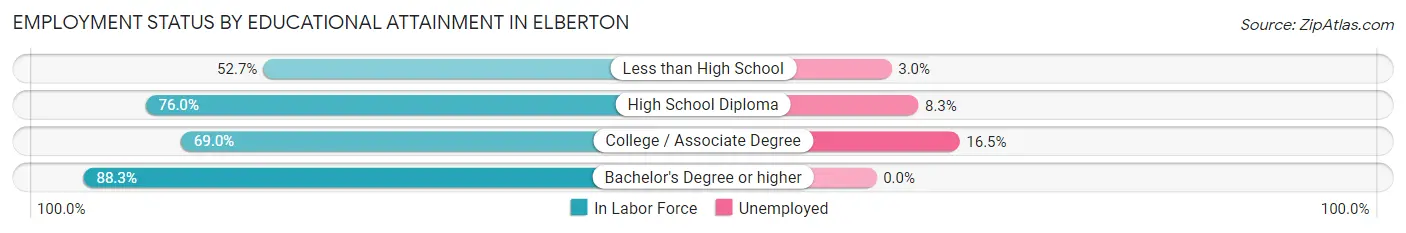
Employment Status by Educational Attainment in Elberton
According to labor force statistics for Elberton, 72.3% of individuals (1,536) out of the total population between 25 and 64 years of age (2,125) are in the labor force, with 9.4% or 144 of them being unemployed. The group with the highest labor force participation rate are those with the educational attainment of bachelor's degree or higher, with 88.3% or 287 individuals in the labor force. Within the labor force, individuals with college / associate degree education have the highest percentage of unemployment, with 16.5% or 97 of them being unemployed.
| Educational Attainment | In Labor Force | Unemployed |
| Less than High School | 135 (52.7%) | 8 (3.0%) |
| High School Diploma | 527 (76.0%) | 58 (8.3%) |
| College / Associate Degree | 587 (69.0%) | 140 (16.5%) |
| Bachelor's Degree or higher | 287 (88.3%) | 0 (0.0%) |
| Total | 1,536 (72.3%) | 200 (9.4%) |
Employment Occupations by Sex in Elberton
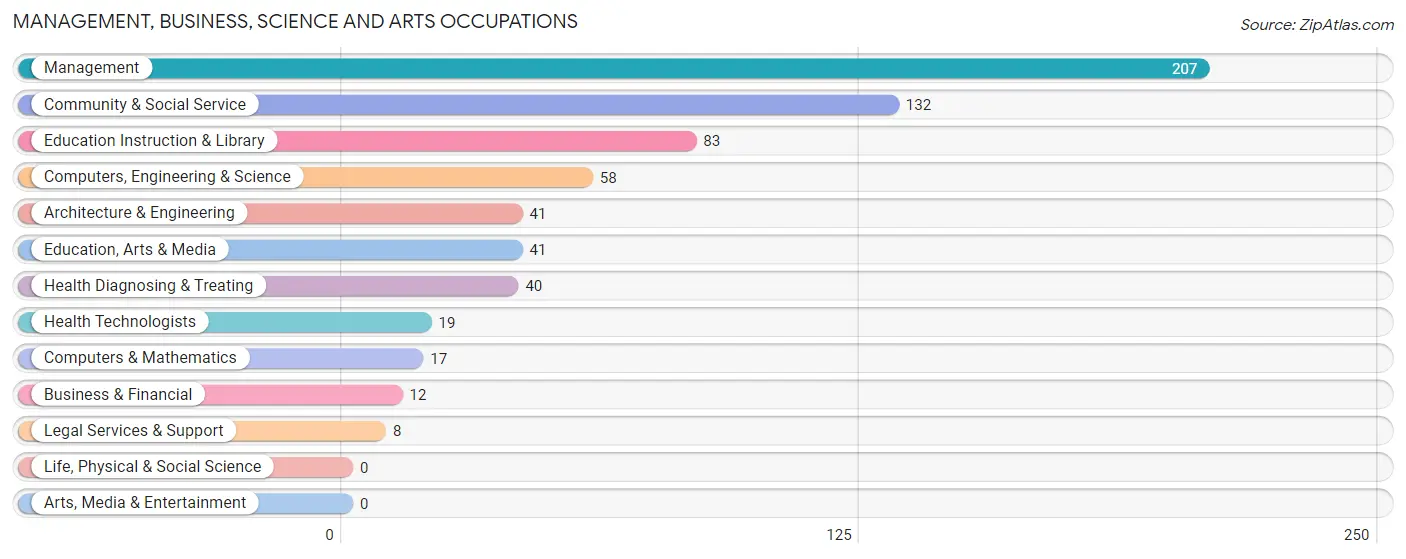
Management, Business, Science and Arts Occupations
The most common Management, Business, Science and Arts occupations in Elberton are Management (207 | 11.6%), Community & Social Service (132 | 7.4%), Education Instruction & Library (83 | 4.6%), Computers, Engineering & Science (58 | 3.2%), and Architecture & Engineering (41 | 2.3%).
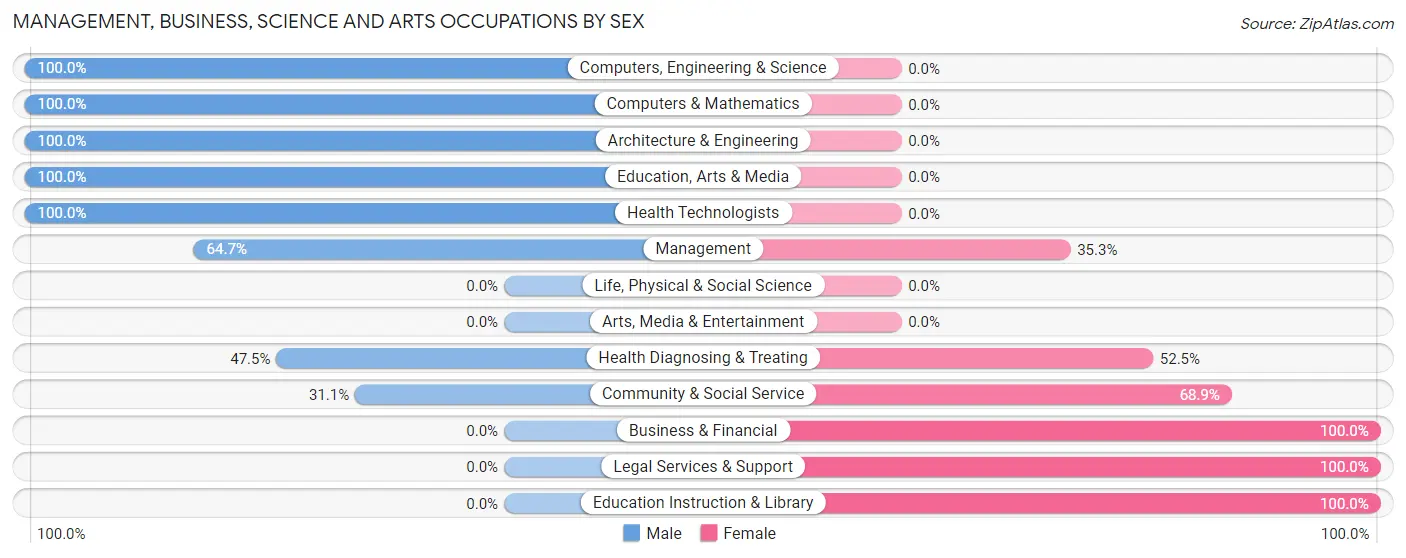
Management, Business, Science and Arts Occupations by Sex
Within the Management, Business, Science and Arts occupations in Elberton, the most male-oriented occupations are Computers, Engineering & Science (100.0%), Computers & Mathematics (100.0%), and Architecture & Engineering (100.0%), while the most female-oriented occupations are Business & Financial (100.0%), Legal Services & Support (100.0%), and Education Instruction & Library (100.0%).
| Occupation | Male | Female |
| Management | 134 (64.7%) | 73 (35.3%) |
| Business & Financial | 0 (0.0%) | 12 (100.0%) |
| Computers, Engineering & Science | 58 (100.0%) | 0 (0.0%) |
| Computers & Mathematics | 17 (100.0%) | 0 (0.0%) |
| Architecture & Engineering | 41 (100.0%) | 0 (0.0%) |
| Life, Physical & Social Science | 0 (0.0%) | 0 (0.0%) |
| Community & Social Service | 41 (31.1%) | 91 (68.9%) |
| Education, Arts & Media | 41 (100.0%) | 0 (0.0%) |
| Legal Services & Support | 0 (0.0%) | 8 (100.0%) |
| Education Instruction & Library | 0 (0.0%) | 83 (100.0%) |
| Arts, Media & Entertainment | 0 (0.0%) | 0 (0.0%) |
| Health Diagnosing & Treating | 19 (47.5%) | 21 (52.5%) |
| Health Technologists | 19 (100.0%) | 0 (0.0%) |
| Total (Category) | 252 (56.1%) | 197 (43.9%) |
| Total (Overall) | 1,063 (59.4%) | 728 (40.6%) |
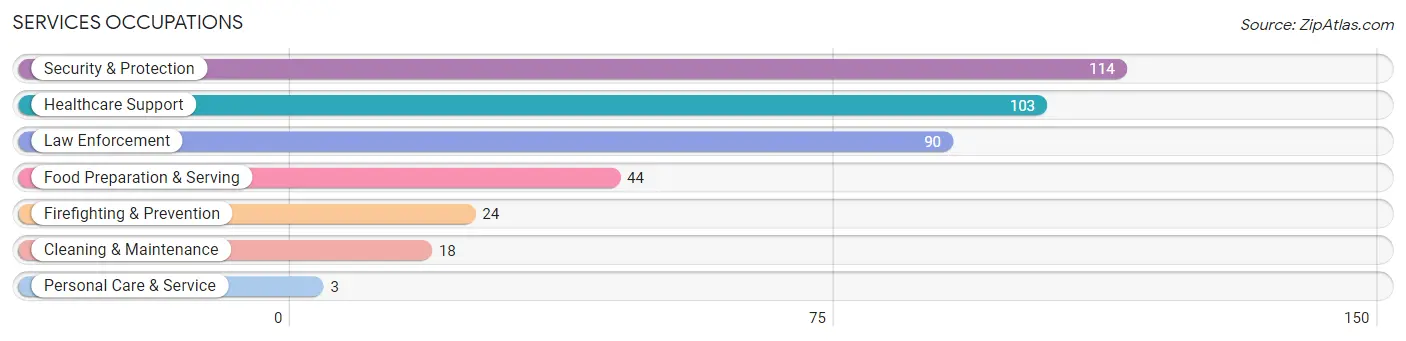
Services Occupations
The most common Services occupations in Elberton are Security & Protection (114 | 6.4%), Healthcare Support (103 | 5.8%), Law Enforcement (90 | 5.0%), Food Preparation & Serving (44 | 2.5%), and Firefighting & Prevention (24 | 1.3%).
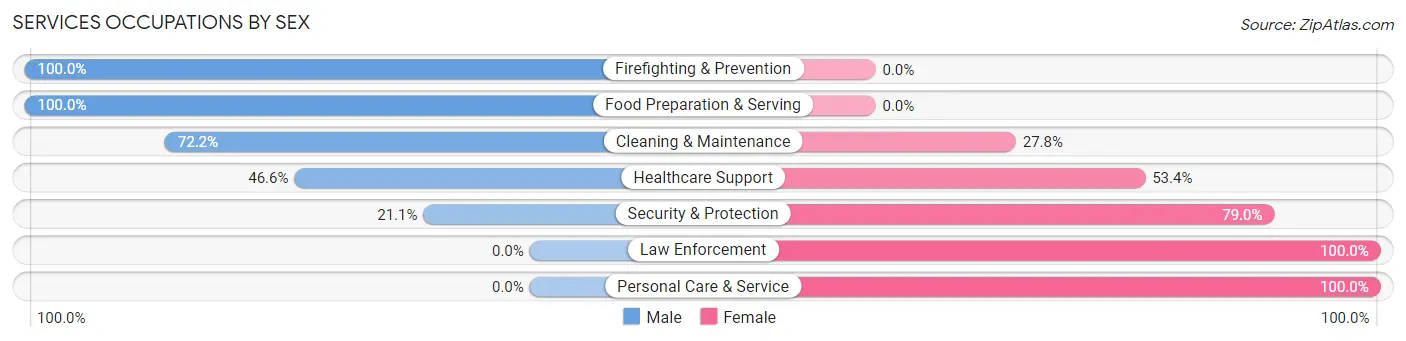
Services Occupations by Sex
Within the Services occupations in Elberton, the most male-oriented occupations are Firefighting & Prevention (100.0%), Food Preparation & Serving (100.0%), and Cleaning & Maintenance (72.2%), while the most female-oriented occupations are Law Enforcement (100.0%), Personal Care & Service (100.0%), and Security & Protection (78.9%).
| Occupation | Male | Female |
| Healthcare Support | 48 (46.6%) | 55 (53.4%) |
| Security & Protection | 24 (21.0%) | 90 (78.9%) |
| Firefighting & Prevention | 24 (100.0%) | 0 (0.0%) |
| Law Enforcement | 0 (0.0%) | 90 (100.0%) |
| Food Preparation & Serving | 44 (100.0%) | 0 (0.0%) |
| Cleaning & Maintenance | 13 (72.2%) | 5 (27.8%) |
| Personal Care & Service | 0 (0.0%) | 3 (100.0%) |
| Total (Category) | 129 (45.7%) | 153 (54.3%) |
| Total (Overall) | 1,063 (59.4%) | 728 (40.6%) |
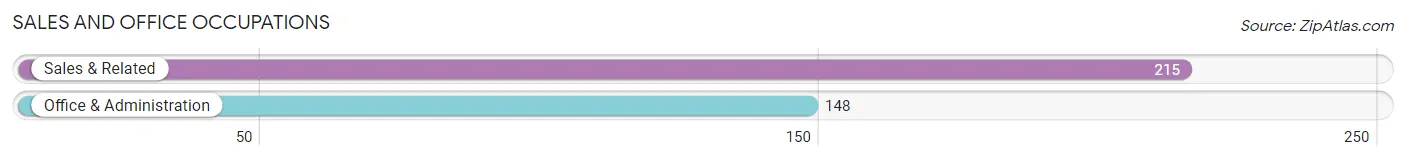
Sales and Office Occupations
The most common Sales and Office occupations in Elberton are Sales & Related (215 | 12.0%), and Office & Administration (148 | 8.3%).
Sales and Office Occupations by Sex
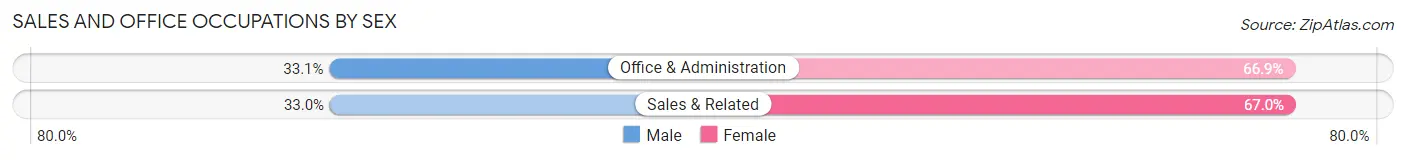
| Occupation | Male | Female |
| Sales & Related | 71 (33.0%) | 144 (67.0%) |
| Office & Administration | 49 (33.1%) | 99 (66.9%) |
| Total (Category) | 120 (33.1%) | 243 (66.9%) |
| Total (Overall) | 1,063 (59.4%) | 728 (40.6%) |
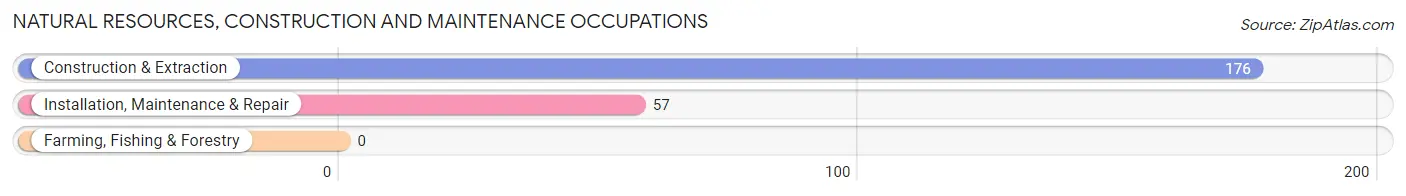
Natural Resources, Construction and Maintenance Occupations
The most common Natural Resources, Construction and Maintenance occupations in Elberton are Construction & Extraction (176 | 9.8%), and Installation, Maintenance & Repair (57 | 3.2%).
Natural Resources, Construction and Maintenance Occupations by Sex
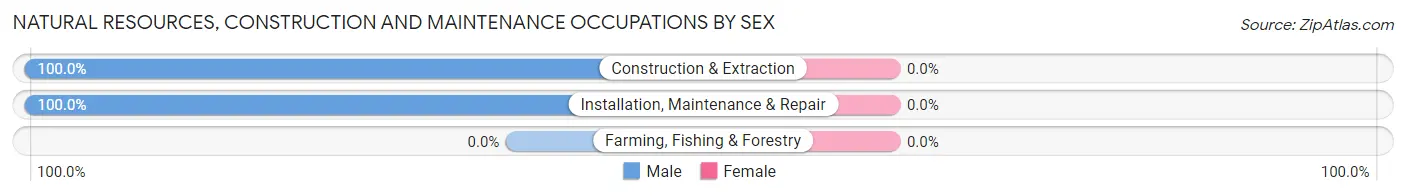
| Occupation | Male | Female |
| Farming, Fishing & Forestry | 0 (0.0%) | 0 (0.0%) |
| Construction & Extraction | 176 (100.0%) | 0 (0.0%) |
| Installation, Maintenance & Repair | 57 (100.0%) | 0 (0.0%) |
| Total (Category) | 233 (100.0%) | 0 (0.0%) |
| Total (Overall) | 1,063 (59.4%) | 728 (40.6%) |
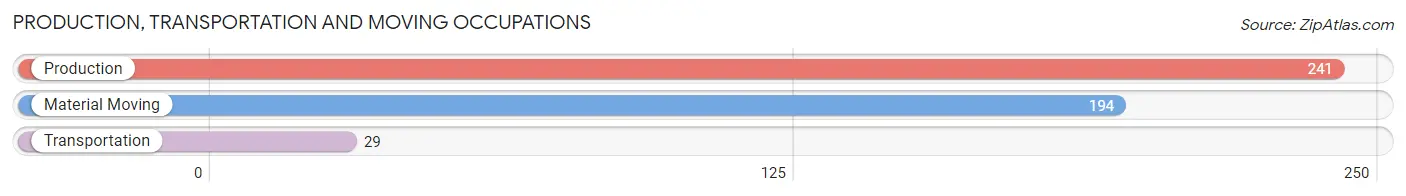
Production, Transportation and Moving Occupations
The most common Production, Transportation and Moving occupations in Elberton are Production (241 | 13.5%), Material Moving (194 | 10.8%), and Transportation (29 | 1.6%).
Production, Transportation and Moving Occupations by Sex
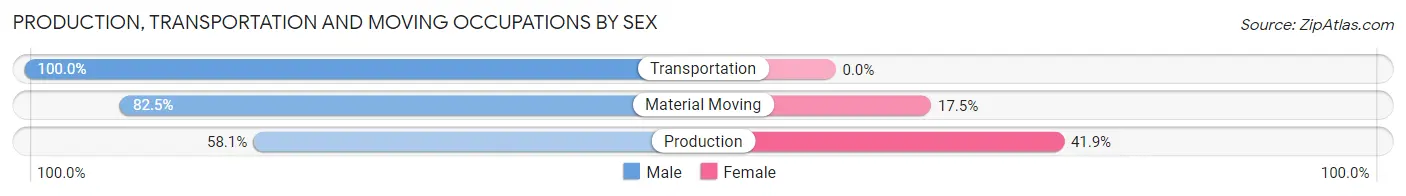
| Occupation | Male | Female |
| Production | 140 (58.1%) | 101 (41.9%) |
| Transportation | 29 (100.0%) | 0 (0.0%) |
| Material Moving | 160 (82.5%) | 34 (17.5%) |
| Total (Category) | 329 (70.9%) | 135 (29.1%) |
| Total (Overall) | 1,063 (59.4%) | 728 (40.6%) |
Employment Industries by Sex in Elberton
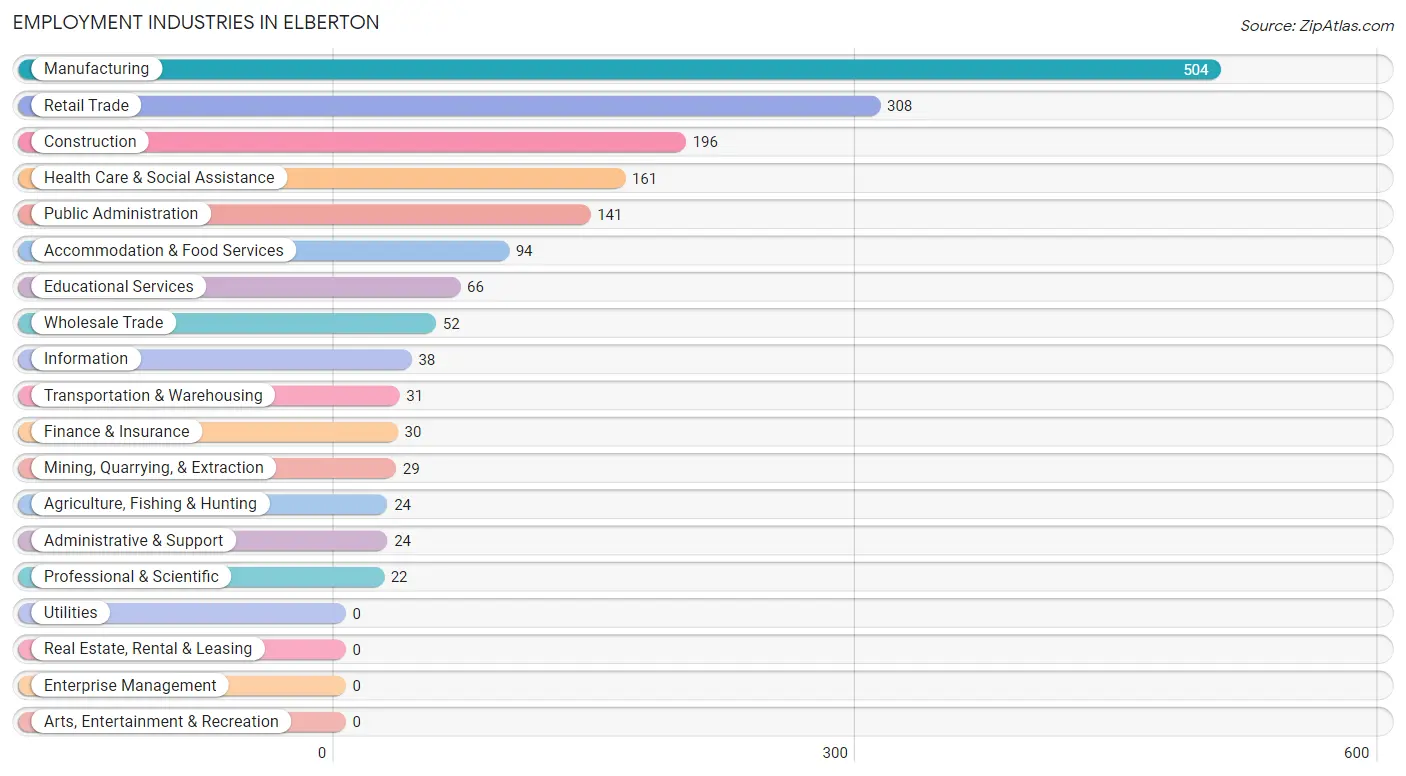
Employment Industries in Elberton
The major employment industries in Elberton include Manufacturing (504 | 28.1%), Retail Trade (308 | 17.2%), Construction (196 | 10.9%), Health Care & Social Assistance (161 | 9.0%), and Public Administration (141 | 7.9%).
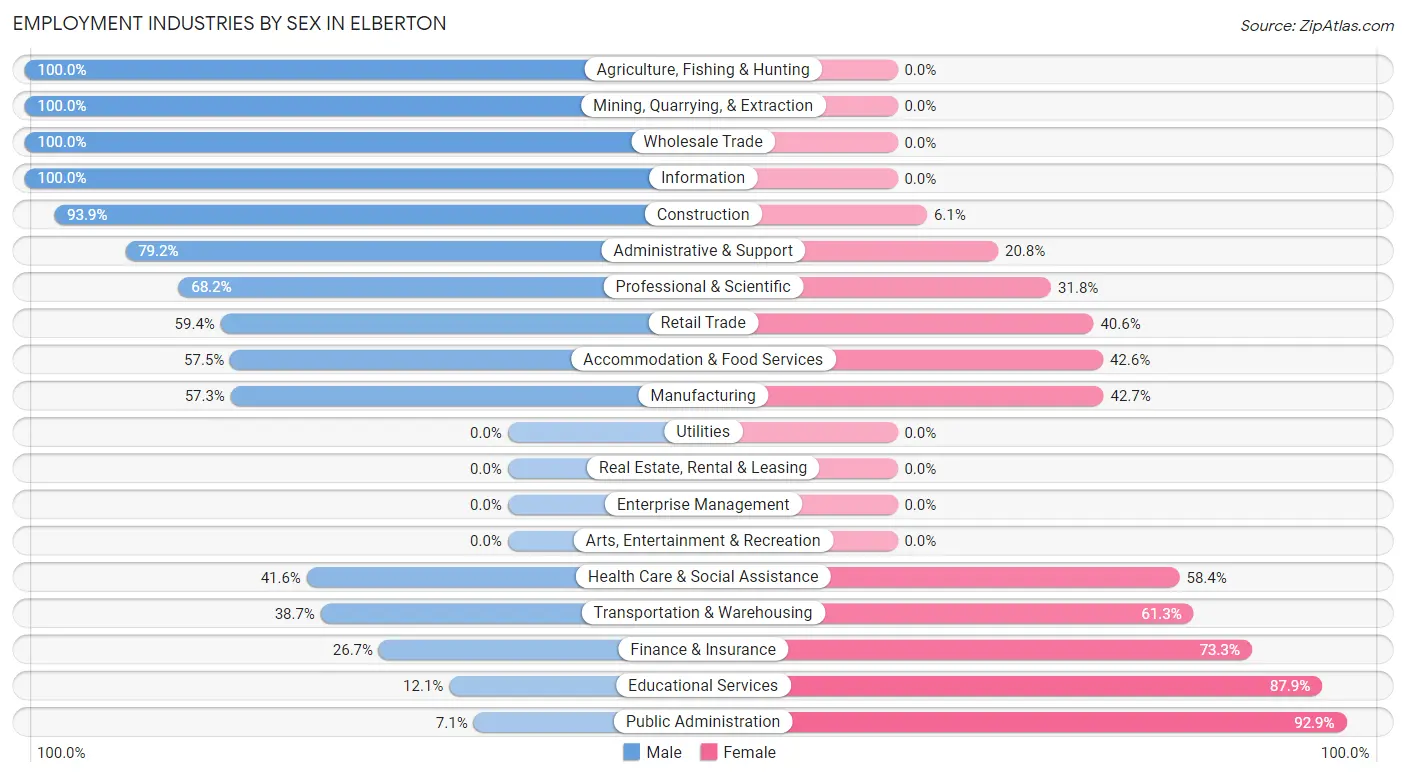
Employment Industries by Sex in Elberton
The Elberton industries that see more men than women are Agriculture, Fishing & Hunting (100.0%), Mining, Quarrying, & Extraction (100.0%), and Wholesale Trade (100.0%), whereas the industries that tend to have a higher number of women are Public Administration (92.9%), Educational Services (87.9%), and Finance & Insurance (73.3%).
| Industry | Male | Female |
| Agriculture, Fishing & Hunting | 24 (100.0%) | 0 (0.0%) |
| Mining, Quarrying, & Extraction | 29 (100.0%) | 0 (0.0%) |
| Construction | 184 (93.9%) | 12 (6.1%) |
| Manufacturing | 289 (57.3%) | 215 (42.7%) |
| Wholesale Trade | 52 (100.0%) | 0 (0.0%) |
| Retail Trade | 183 (59.4%) | 125 (40.6%) |
| Transportation & Warehousing | 12 (38.7%) | 19 (61.3%) |
| Utilities | 0 (0.0%) | 0 (0.0%) |
| Information | 38 (100.0%) | 0 (0.0%) |
| Finance & Insurance | 8 (26.7%) | 22 (73.3%) |
| Real Estate, Rental & Leasing | 0 (0.0%) | 0 (0.0%) |
| Professional & Scientific | 15 (68.2%) | 7 (31.8%) |
| Enterprise Management | 0 (0.0%) | 0 (0.0%) |
| Administrative & Support | 19 (79.2%) | 5 (20.8%) |
| Educational Services | 8 (12.1%) | 58 (87.9%) |
| Health Care & Social Assistance | 67 (41.6%) | 94 (58.4%) |
| Arts, Entertainment & Recreation | 0 (0.0%) | 0 (0.0%) |
| Accommodation & Food Services | 54 (57.5%) | 40 (42.5%) |
| Public Administration | 10 (7.1%) | 131 (92.9%) |
| Total | 1,063 (59.4%) | 728 (40.6%) |
Education in Elberton
School Enrollment in Elberton
The most common levels of schooling among the 1,440 students in Elberton are elementary school (370 | 25.7%), high school (305 | 21.2%), and middle school (224 | 15.6%).
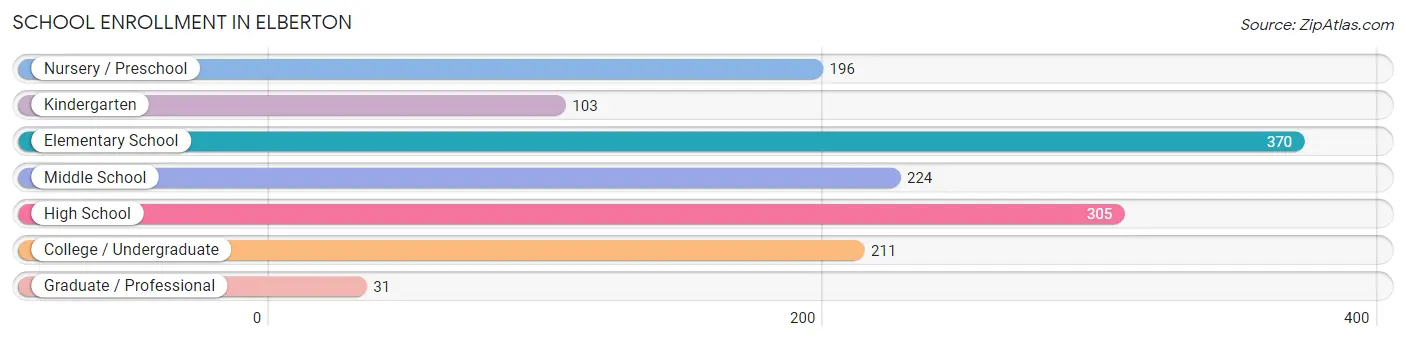
| School Level | # Students | % Students |
| Nursery / Preschool | 196 | 13.6% |
| Kindergarten | 103 | 7.1% |
| Elementary School | 370 | 25.7% |
| Middle School | 224 | 15.6% |
| High School | 305 | 21.2% |
| College / Undergraduate | 211 | 14.6% |
| Graduate / Professional | 31 | 2.1% |
| Total | 1,440 | 100.0% |
School Enrollment by Age by Funding Source in Elberton
Out of a total of 1,440 students who are enrolled in schools in Elberton, 78 (5.4%) attend a private institution, while the remaining 1,362 (94.6%) are enrolled in public schools. The age group of 20 to 24 year olds has the highest likelihood of being enrolled in private schools, with 18 (15.9% in the age bracket) enrolled. Conversely, the age group of 3 to 4 year olds has the lowest likelihood of being enrolled in a private school, with 137 (100.0% in the age bracket) attending a public institution.
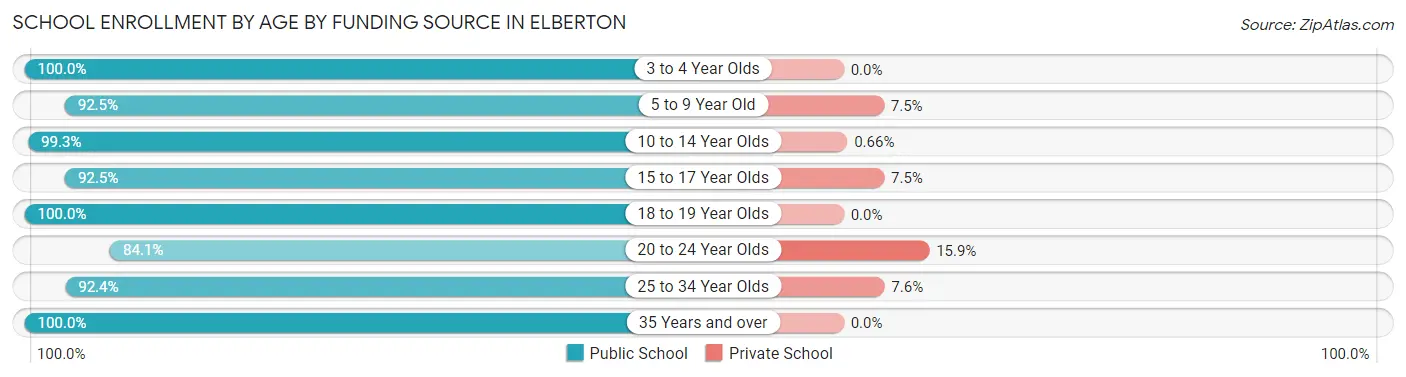
| Age Bracket | Public School | Private School |
| 3 to 4 Year Olds | 137 (100.0%) | 0 (0.0%) |
| 5 to 9 Year Old | 420 (92.5%) | 34 (7.5%) |
| 10 to 14 Year Olds | 300 (99.3%) | 2 (0.7%) |
| 15 to 17 Year Olds | 221 (92.5%) | 18 (7.5%) |
| 18 to 19 Year Olds | 82 (100.0%) | 0 (0.0%) |
| 20 to 24 Year Olds | 95 (84.1%) | 18 (15.9%) |
| 25 to 34 Year Olds | 73 (92.4%) | 6 (7.6%) |
| 35 Years and over | 34 (100.0%) | 0 (0.0%) |
| Total | 1,362 (94.6%) | 78 (5.4%) |
Educational Attainment by Field of Study in Elberton
Education (167 | 36.3%), business (69 | 15.0%), social sciences (32 | 7.0%), engineering (30 | 6.5%), and psychology (28 | 6.1%) are the most common fields of study among 460 individuals in Elberton who have obtained a bachelor's degree or higher.
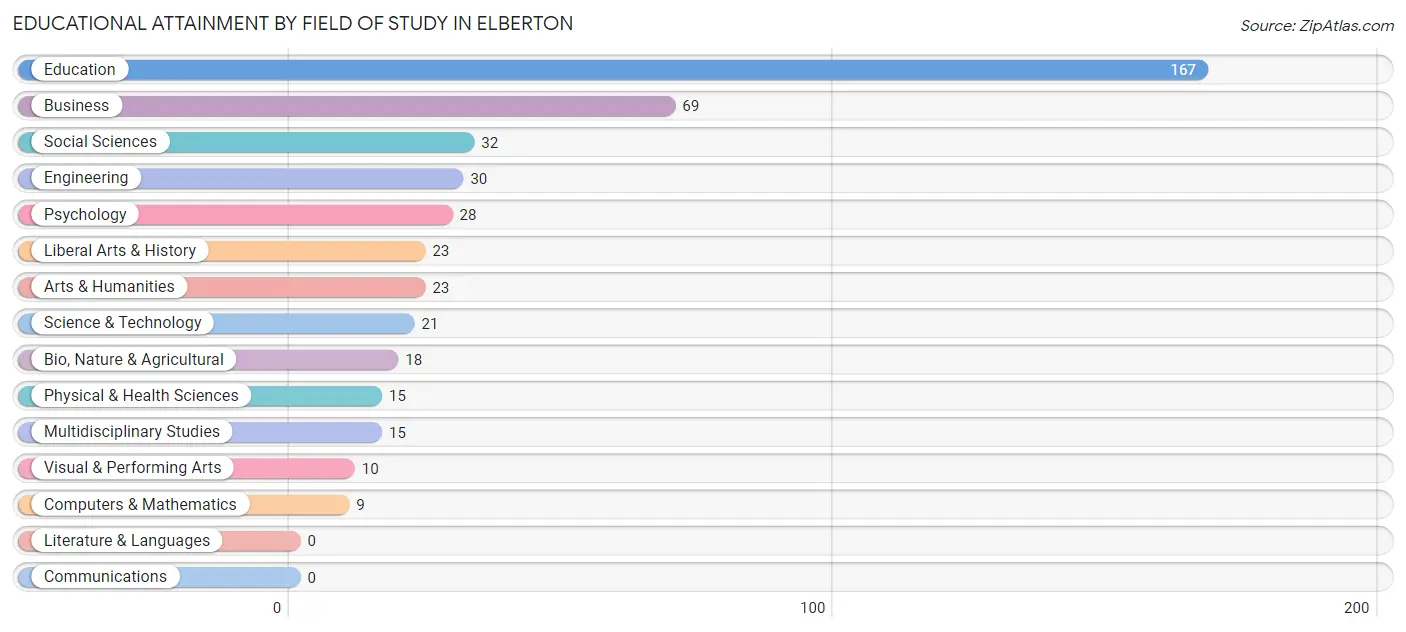
| Field of Study | # Graduates | % Graduates |
| Computers & Mathematics | 9 | 2.0% |
| Bio, Nature & Agricultural | 18 | 3.9% |
| Physical & Health Sciences | 15 | 3.3% |
| Psychology | 28 | 6.1% |
| Social Sciences | 32 | 7.0% |
| Engineering | 30 | 6.5% |
| Multidisciplinary Studies | 15 | 3.3% |
| Science & Technology | 21 | 4.6% |
| Business | 69 | 15.0% |
| Education | 167 | 36.3% |
| Literature & Languages | 0 | 0.0% |
| Liberal Arts & History | 23 | 5.0% |
| Visual & Performing Arts | 10 | 2.2% |
| Communications | 0 | 0.0% |
| Arts & Humanities | 23 | 5.0% |
| Total | 460 | 100.0% |
Transportation & Commute in Elberton
Vehicle Availability by Sex in Elberton
The most prevalent vehicle ownership categories in Elberton are males with 2 vehicles (381, accounting for 36.2%) and females with 2 vehicles (158, making up 51.8%).
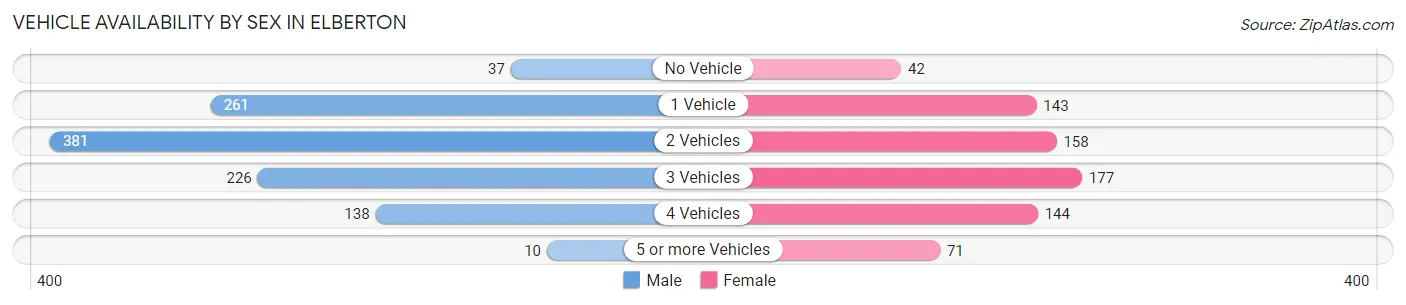
| Vehicles Available | Male | Female |
| No Vehicle | 37 (3.5%) | 42 (5.7%) |
| 1 Vehicle | 261 (24.8%) | 143 (19.5%) |
| 2 Vehicles | 381 (36.2%) | 158 (21.5%) |
| 3 Vehicles | 226 (21.5%) | 177 (24.1%) |
| 4 Vehicles | 138 (13.1%) | 144 (19.6%) |
| 5 or more Vehicles | 10 (0.9%) | 71 (9.7%) |
| Total | 1,053 (100.0%) | 735 (100.0%) |
Commute Time in Elberton
The most frequently occuring commute durations in Elberton are 10 to 14 minutes (431 commuters, 26.0%), less than 5 minutes (267 commuters, 16.1%), and 5 to 9 minutes (261 commuters, 15.8%).
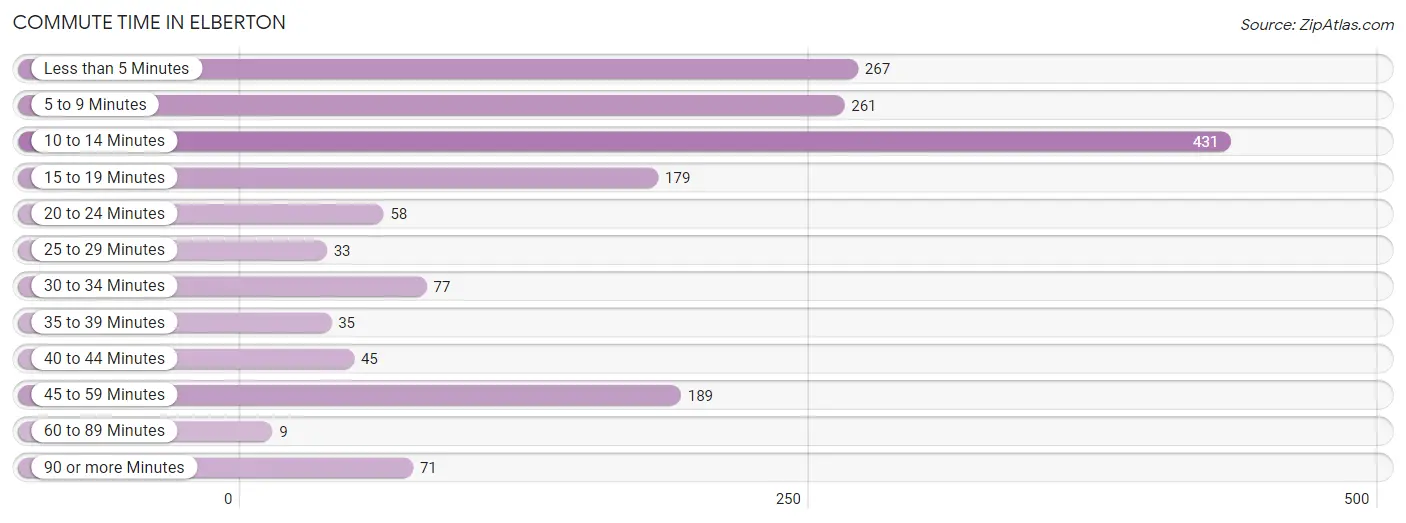
| Commute Time | # Commuters | % Commuters |
| Less than 5 Minutes | 267 | 16.1% |
| 5 to 9 Minutes | 261 | 15.8% |
| 10 to 14 Minutes | 431 | 26.0% |
| 15 to 19 Minutes | 179 | 10.8% |
| 20 to 24 Minutes | 58 | 3.5% |
| 25 to 29 Minutes | 33 | 2.0% |
| 30 to 34 Minutes | 77 | 4.6% |
| 35 to 39 Minutes | 35 | 2.1% |
| 40 to 44 Minutes | 45 | 2.7% |
| 45 to 59 Minutes | 189 | 11.4% |
| 60 to 89 Minutes | 9 | 0.5% |
| 90 or more Minutes | 71 | 4.3% |
Commute Time by Sex in Elberton
The most common commute times in Elberton are 10 to 14 minutes (378 commuters, 38.4%) for males and less than 5 minutes (123 commuters, 18.3%) for females.
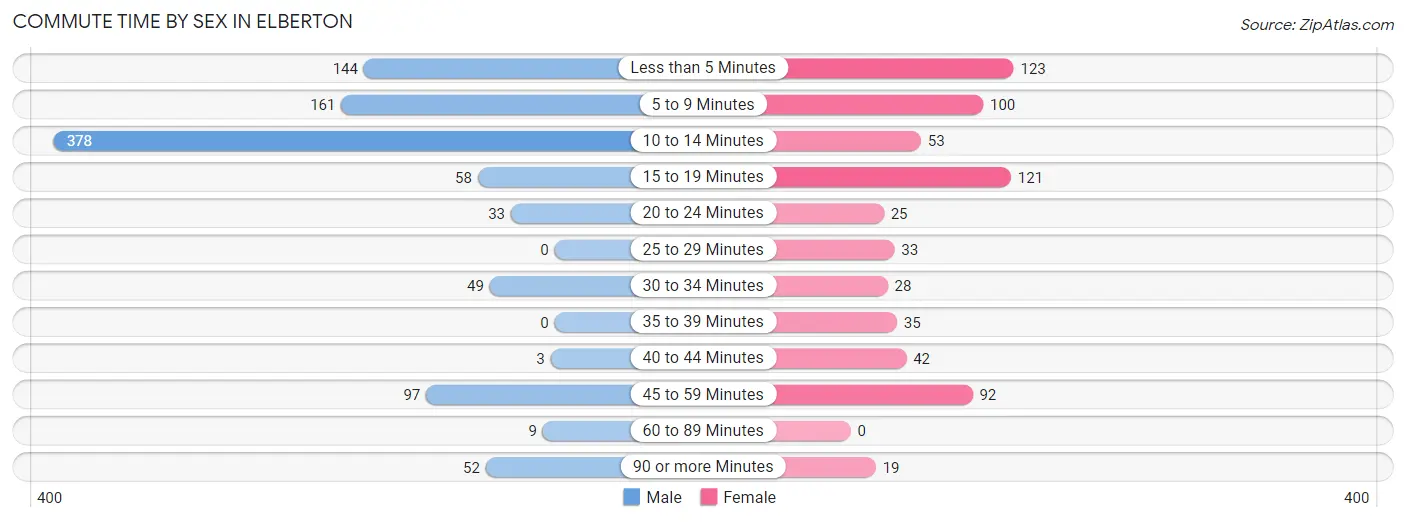
| Commute Time | Male | Female |
| Less than 5 Minutes | 144 (14.6%) | 123 (18.3%) |
| 5 to 9 Minutes | 161 (16.4%) | 100 (14.9%) |
| 10 to 14 Minutes | 378 (38.4%) | 53 (7.9%) |
| 15 to 19 Minutes | 58 (5.9%) | 121 (18.0%) |
| 20 to 24 Minutes | 33 (3.4%) | 25 (3.7%) |
| 25 to 29 Minutes | 0 (0.0%) | 33 (4.9%) |
| 30 to 34 Minutes | 49 (5.0%) | 28 (4.2%) |
| 35 to 39 Minutes | 0 (0.0%) | 35 (5.2%) |
| 40 to 44 Minutes | 3 (0.3%) | 42 (6.3%) |
| 45 to 59 Minutes | 97 (9.9%) | 92 (13.7%) |
| 60 to 89 Minutes | 9 (0.9%) | 0 (0.0%) |
| 90 or more Minutes | 52 (5.3%) | 19 (2.8%) |
Time of Departure to Work by Sex in Elberton
The most frequent times of departure to work in Elberton are 7:00 AM to 7:29 AM (398, 40.5%) for males and 7:00 AM to 7:29 AM (217, 32.3%) for females.
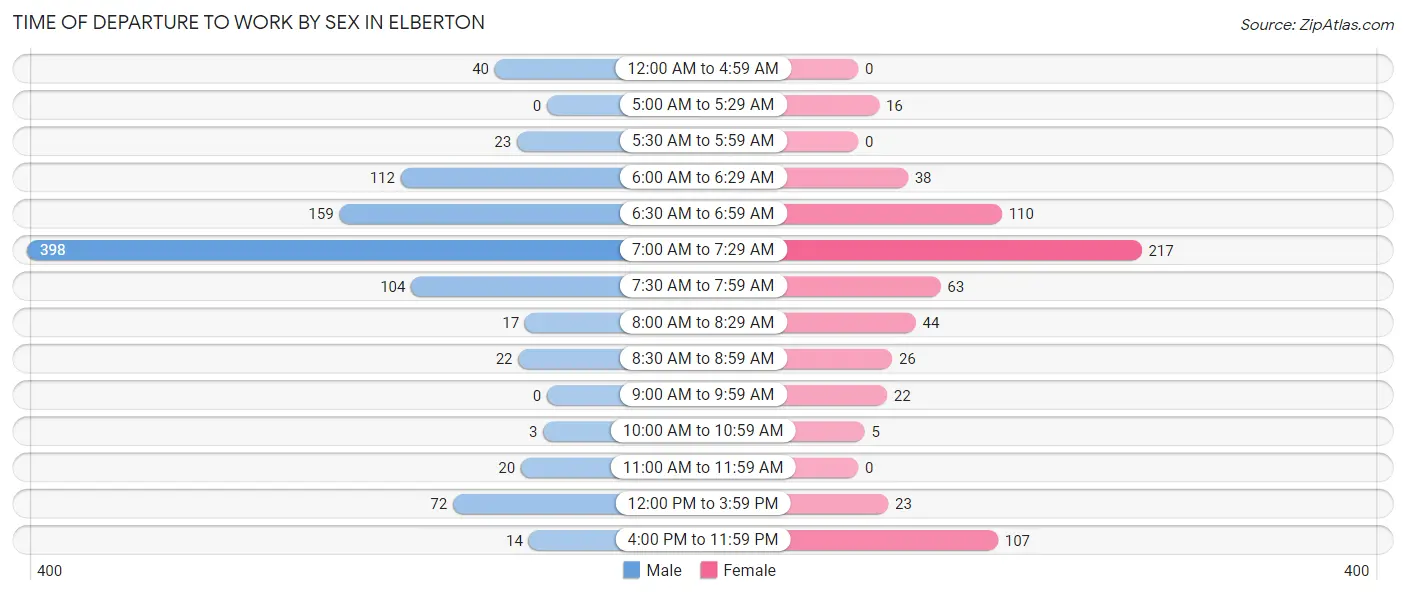
| Time of Departure | Male | Female |
| 12:00 AM to 4:59 AM | 40 (4.1%) | 0 (0.0%) |
| 5:00 AM to 5:29 AM | 0 (0.0%) | 16 (2.4%) |
| 5:30 AM to 5:59 AM | 23 (2.3%) | 0 (0.0%) |
| 6:00 AM to 6:29 AM | 112 (11.4%) | 38 (5.7%) |
| 6:30 AM to 6:59 AM | 159 (16.2%) | 110 (16.4%) |
| 7:00 AM to 7:29 AM | 398 (40.5%) | 217 (32.3%) |
| 7:30 AM to 7:59 AM | 104 (10.6%) | 63 (9.4%) |
| 8:00 AM to 8:29 AM | 17 (1.7%) | 44 (6.6%) |
| 8:30 AM to 8:59 AM | 22 (2.2%) | 26 (3.9%) |
| 9:00 AM to 9:59 AM | 0 (0.0%) | 22 (3.3%) |
| 10:00 AM to 10:59 AM | 3 (0.3%) | 5 (0.7%) |
| 11:00 AM to 11:59 AM | 20 (2.0%) | 0 (0.0%) |
| 12:00 PM to 3:59 PM | 72 (7.3%) | 23 (3.4%) |
| 4:00 PM to 11:59 PM | 14 (1.4%) | 107 (16.0%) |
| Total | 984 (100.0%) | 671 (100.0%) |
Housing Occupancy in Elberton
Occupancy by Ownership in Elberton
Of the total 1,838 dwellings in Elberton, owner-occupied units account for 909 (49.5%), while renter-occupied units make up 929 (50.5%).
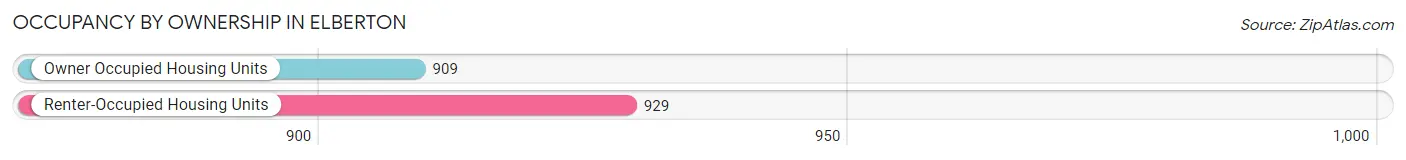
| Occupancy | # Housing Units | % Housing Units |
| Owner Occupied Housing Units | 909 | 49.5% |
| Renter-Occupied Housing Units | 929 | 50.5% |
| Total Occupied Housing Units | 1,838 | 100.0% |
Occupancy by Household Size in Elberton
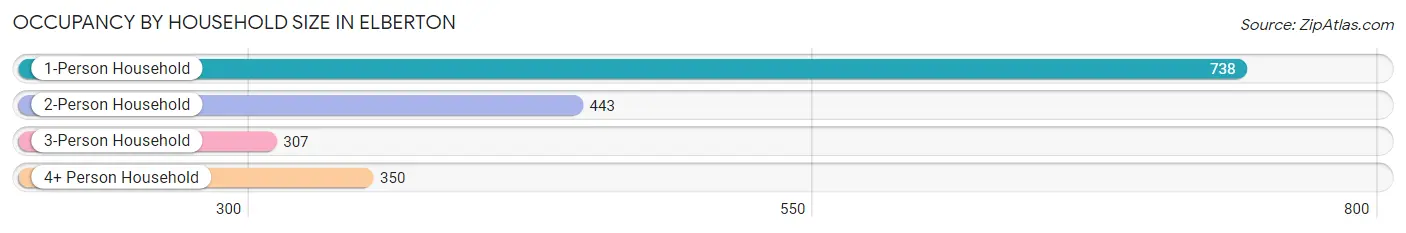
| Household Size | # Housing Units | % Housing Units |
| 1-Person Household | 738 | 40.2% |
| 2-Person Household | 443 | 24.1% |
| 3-Person Household | 307 | 16.7% |
| 4+ Person Household | 350 | 19.0% |
| Total Housing Units | 1,838 | 100.0% |
Occupancy by Ownership by Household Size in Elberton
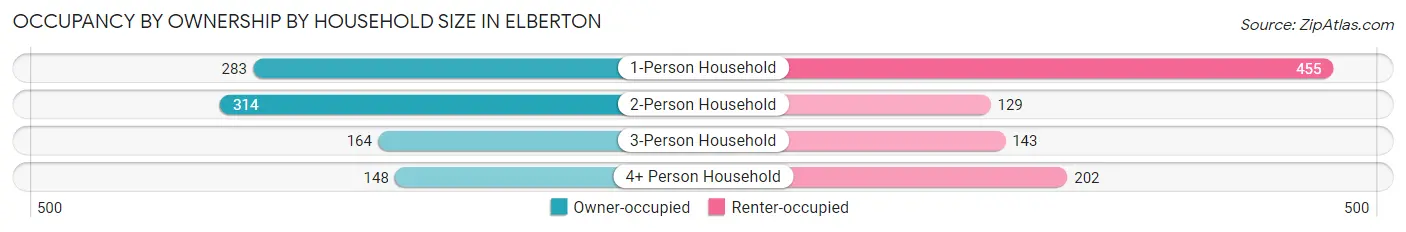
| Household Size | Owner-occupied | Renter-occupied |
| 1-Person Household | 283 (38.4%) | 455 (61.7%) |
| 2-Person Household | 314 (70.9%) | 129 (29.1%) |
| 3-Person Household | 164 (53.4%) | 143 (46.6%) |
| 4+ Person Household | 148 (42.3%) | 202 (57.7%) |
| Total Housing Units | 909 (49.5%) | 929 (50.5%) |
Occupancy by Educational Attainment in Elberton
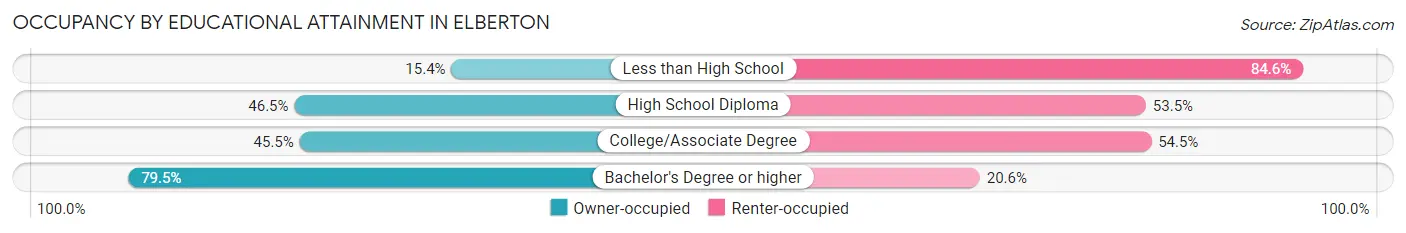
| Household Size | Owner-occupied | Renter-occupied |
| Less than High School | 16 (15.4%) | 88 (84.6%) |
| High School Diploma | 234 (46.5%) | 269 (53.5%) |
| College/Associate Degree | 427 (45.5%) | 512 (54.5%) |
| Bachelor's Degree or higher | 232 (79.4%) | 60 (20.5%) |
Occupancy by Age of Householder in Elberton
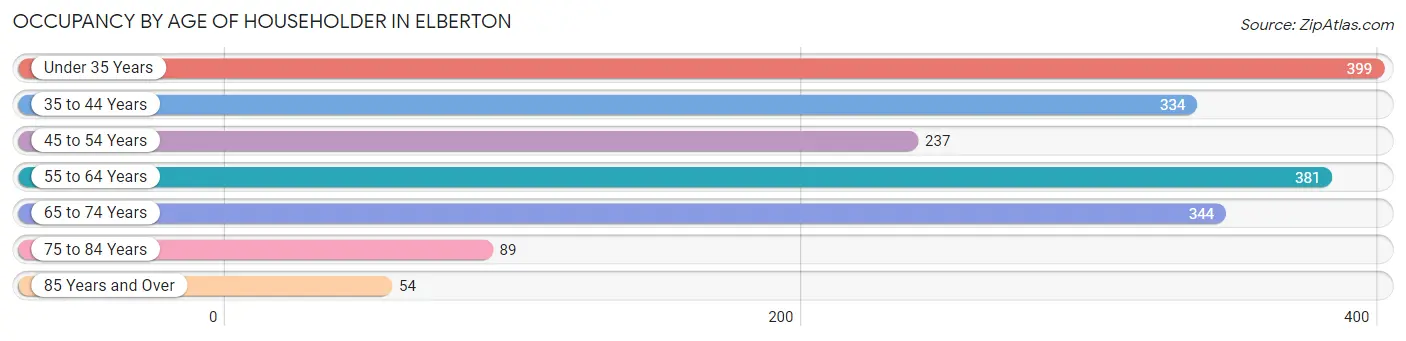
| Age Bracket | # Households | % Households |
| Under 35 Years | 399 | 21.7% |
| 35 to 44 Years | 334 | 18.2% |
| 45 to 54 Years | 237 | 12.9% |
| 55 to 64 Years | 381 | 20.7% |
| 65 to 74 Years | 344 | 18.7% |
| 75 to 84 Years | 89 | 4.8% |
| 85 Years and Over | 54 | 2.9% |
| Total | 1,838 | 100.0% |
Housing Finances in Elberton
Median Income by Occupancy in Elberton
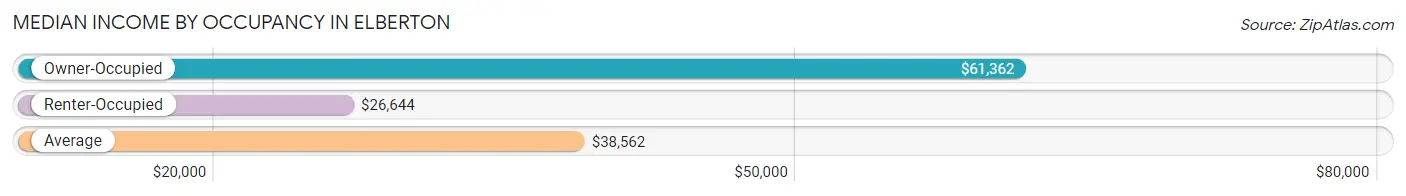
| Occupancy Type | # Households | Median Income |
| Owner-Occupied | 909 (49.5%) | $61,362 |
| Renter-Occupied | 929 (50.5%) | $26,644 |
| Average | 1,838 (100.0%) | $38,562 |
Occupancy by Householder Income Bracket in Elberton
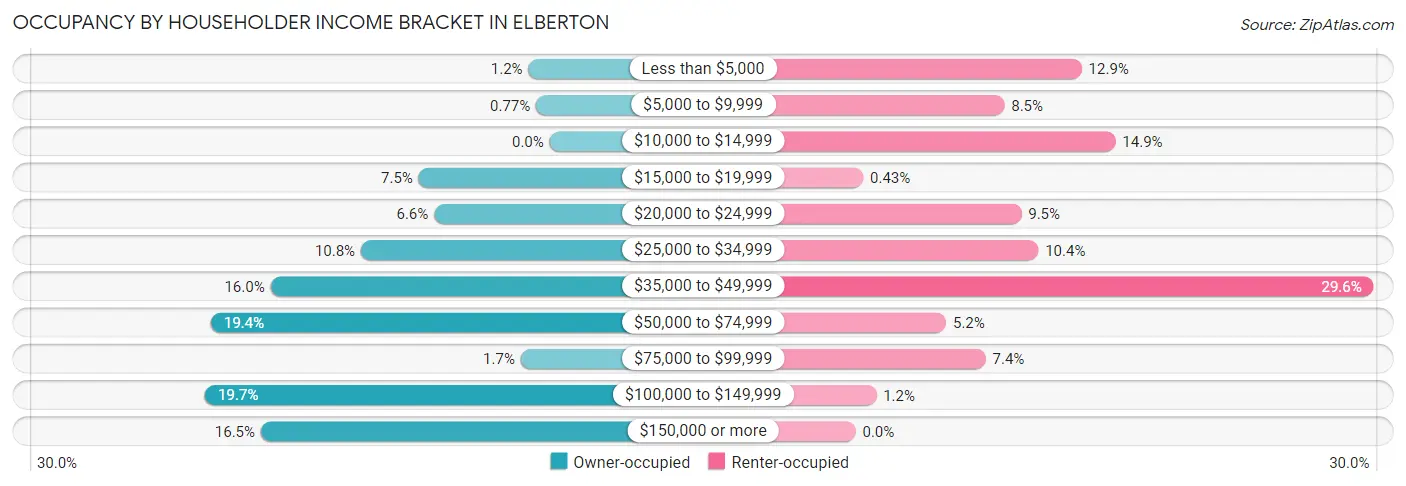
| Income Bracket | Owner-occupied | Renter-occupied |
| Less than $5,000 | 11 (1.2%) | 120 (12.9%) |
| $5,000 to $9,999 | 7 (0.8%) | 79 (8.5%) |
| $10,000 to $14,999 | 0 (0.0%) | 138 (14.8%) |
| $15,000 to $19,999 | 68 (7.5%) | 4 (0.4%) |
| $20,000 to $24,999 | 60 (6.6%) | 88 (9.5%) |
| $25,000 to $34,999 | 98 (10.8%) | 97 (10.4%) |
| $35,000 to $49,999 | 145 (16.0%) | 275 (29.6%) |
| $50,000 to $74,999 | 176 (19.4%) | 48 (5.2%) |
| $75,000 to $99,999 | 15 (1.7%) | 69 (7.4%) |
| $100,000 to $149,999 | 179 (19.7%) | 11 (1.2%) |
| $150,000 or more | 150 (16.5%) | 0 (0.0%) |
| Total | 909 (100.0%) | 929 (100.0%) |
Monthly Housing Cost Tiers in Elberton
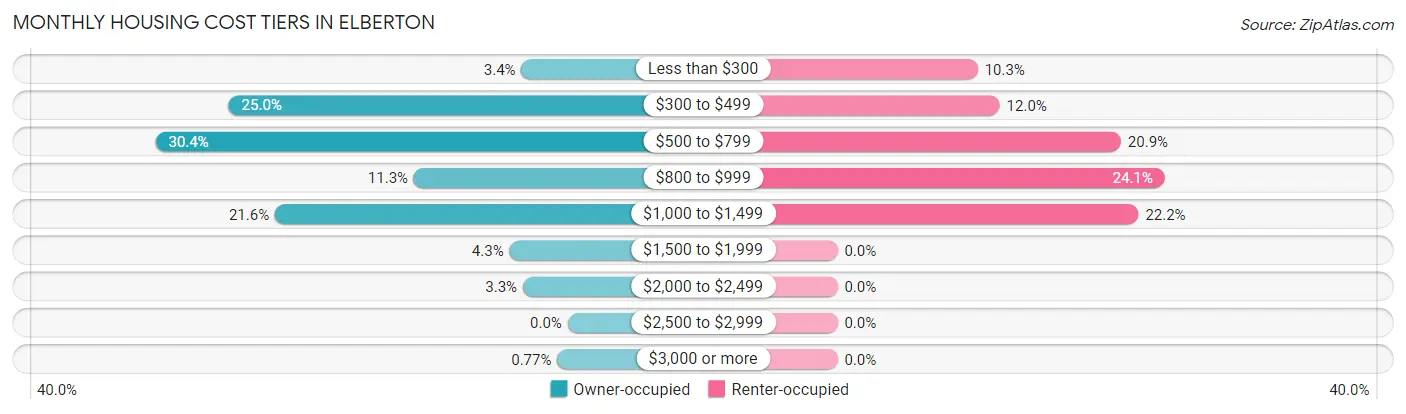
| Monthly Cost | Owner-occupied | Renter-occupied |
| Less than $300 | 31 (3.4%) | 96 (10.3%) |
| $300 to $499 | 227 (25.0%) | 111 (11.9%) |
| $500 to $799 | 276 (30.4%) | 194 (20.9%) |
| $800 to $999 | 103 (11.3%) | 224 (24.1%) |
| $1,000 to $1,499 | 196 (21.6%) | 206 (22.2%) |
| $1,500 to $1,999 | 39 (4.3%) | 0 (0.0%) |
| $2,000 to $2,499 | 30 (3.3%) | 0 (0.0%) |
| $2,500 to $2,999 | 0 (0.0%) | 0 (0.0%) |
| $3,000 or more | 7 (0.8%) | 0 (0.0%) |
| Total | 909 (100.0%) | 929 (100.0%) |
Physical Housing Characteristics in Elberton
Housing Structures in Elberton
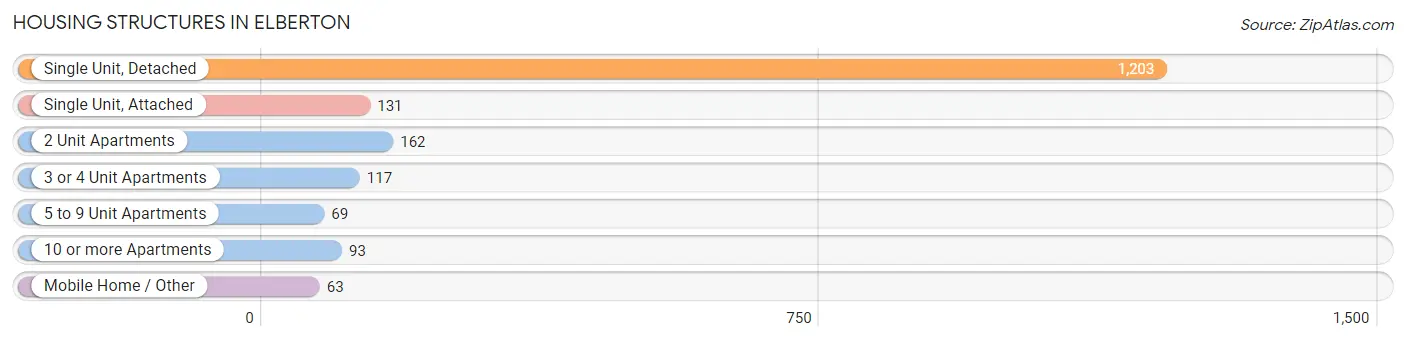
| Structure Type | # Housing Units | % Housing Units |
| Single Unit, Detached | 1,203 | 65.4% |
| Single Unit, Attached | 131 | 7.1% |
| 2 Unit Apartments | 162 | 8.8% |
| 3 or 4 Unit Apartments | 117 | 6.4% |
| 5 to 9 Unit Apartments | 69 | 3.7% |
| 10 or more Apartments | 93 | 5.1% |
| Mobile Home / Other | 63 | 3.4% |
| Total | 1,838 | 100.0% |
Housing Structures by Occupancy in Elberton
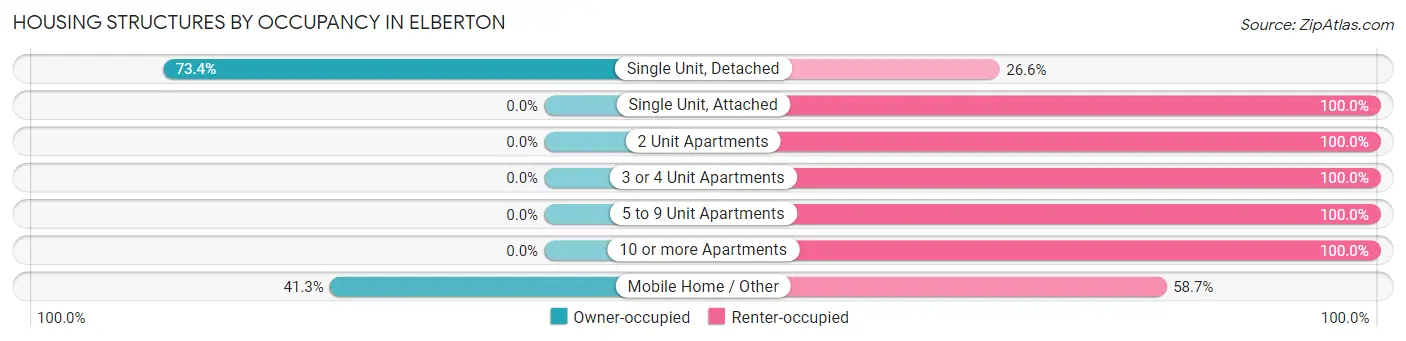
| Structure Type | Owner-occupied | Renter-occupied |
| Single Unit, Detached | 883 (73.4%) | 320 (26.6%) |
| Single Unit, Attached | 0 (0.0%) | 131 (100.0%) |
| 2 Unit Apartments | 0 (0.0%) | 162 (100.0%) |
| 3 or 4 Unit Apartments | 0 (0.0%) | 117 (100.0%) |
| 5 to 9 Unit Apartments | 0 (0.0%) | 69 (100.0%) |
| 10 or more Apartments | 0 (0.0%) | 93 (100.0%) |
| Mobile Home / Other | 26 (41.3%) | 37 (58.7%) |
| Total | 909 (49.5%) | 929 (50.5%) |
Housing Structures by Number of Rooms in Elberton
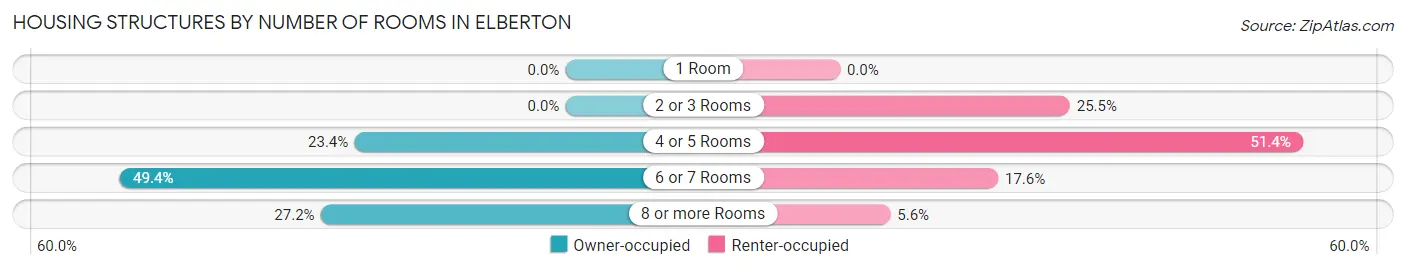
| Number of Rooms | Owner-occupied | Renter-occupied |
| 1 Room | 0 (0.0%) | 0 (0.0%) |
| 2 or 3 Rooms | 0 (0.0%) | 237 (25.5%) |
| 4 or 5 Rooms | 213 (23.4%) | 477 (51.3%) |
| 6 or 7 Rooms | 449 (49.4%) | 163 (17.5%) |
| 8 or more Rooms | 247 (27.2%) | 52 (5.6%) |
| Total | 909 (100.0%) | 929 (100.0%) |
Housing Structure by Heating Type in Elberton
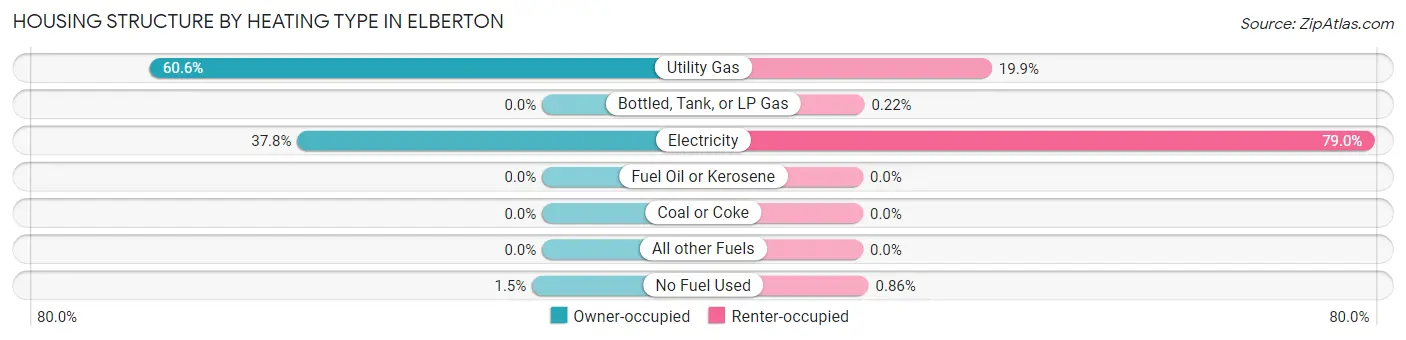
| Heating Type | Owner-occupied | Renter-occupied |
| Utility Gas | 551 (60.6%) | 185 (19.9%) |
| Bottled, Tank, or LP Gas | 0 (0.0%) | 2 (0.2%) |
| Electricity | 344 (37.8%) | 734 (79.0%) |
| Fuel Oil or Kerosene | 0 (0.0%) | 0 (0.0%) |
| Coal or Coke | 0 (0.0%) | 0 (0.0%) |
| All other Fuels | 0 (0.0%) | 0 (0.0%) |
| No Fuel Used | 14 (1.5%) | 8 (0.9%) |
| Total | 909 (100.0%) | 929 (100.0%) |
Household Vehicle Usage in Elberton
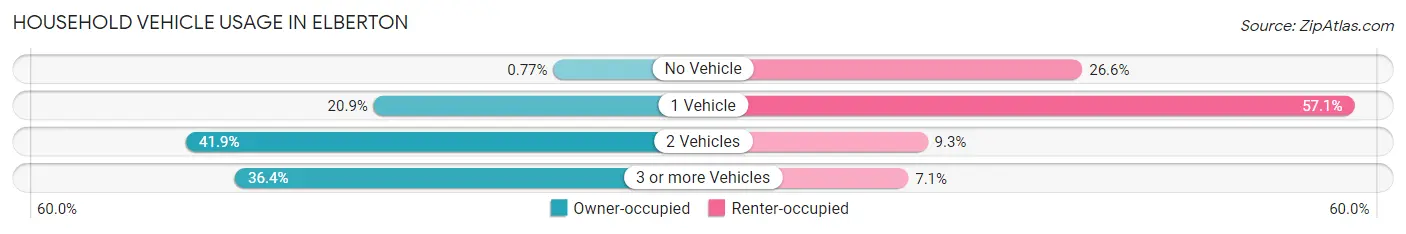
| Vehicles per Household | Owner-occupied | Renter-occupied |
| No Vehicle | 7 (0.8%) | 247 (26.6%) |
| 1 Vehicle | 190 (20.9%) | 530 (57.1%) |
| 2 Vehicles | 381 (41.9%) | 86 (9.3%) |
| 3 or more Vehicles | 331 (36.4%) | 66 (7.1%) |
| Total | 909 (100.0%) | 929 (100.0%) |
Real Estate & Mortgages in Elberton
Real Estate and Mortgage Overview in Elberton
| Characteristic | Without Mortgage | With Mortgage |
| Housing Units | 537 | 372 |
| Median Property Value | $77,000 | $150,000 |
| Median Household Income | $68,315 | $54 |
| Monthly Housing Costs | $518 | $7 |
| Real Estate Taxes | $770 | $20 |
Property Value by Mortgage Status in Elberton
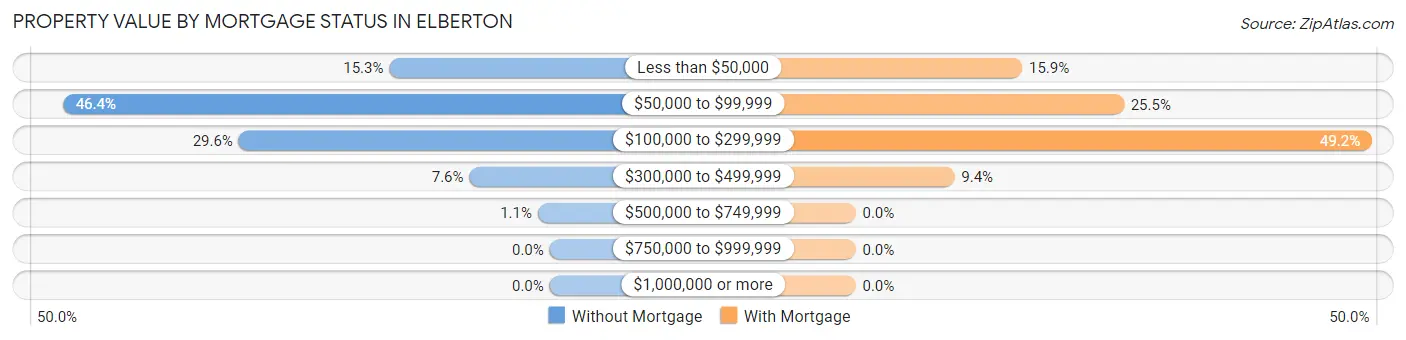
| Property Value | Without Mortgage | With Mortgage |
| Less than $50,000 | 82 (15.3%) | 59 (15.9%) |
| $50,000 to $99,999 | 249 (46.4%) | 95 (25.5%) |
| $100,000 to $299,999 | 159 (29.6%) | 183 (49.2%) |
| $300,000 to $499,999 | 41 (7.6%) | 35 (9.4%) |
| $500,000 to $749,999 | 6 (1.1%) | 0 (0.0%) |
| $750,000 to $999,999 | 0 (0.0%) | 0 (0.0%) |
| $1,000,000 or more | 0 (0.0%) | 0 (0.0%) |
| Total | 537 (100.0%) | 372 (100.0%) |
Household Income by Mortgage Status in Elberton
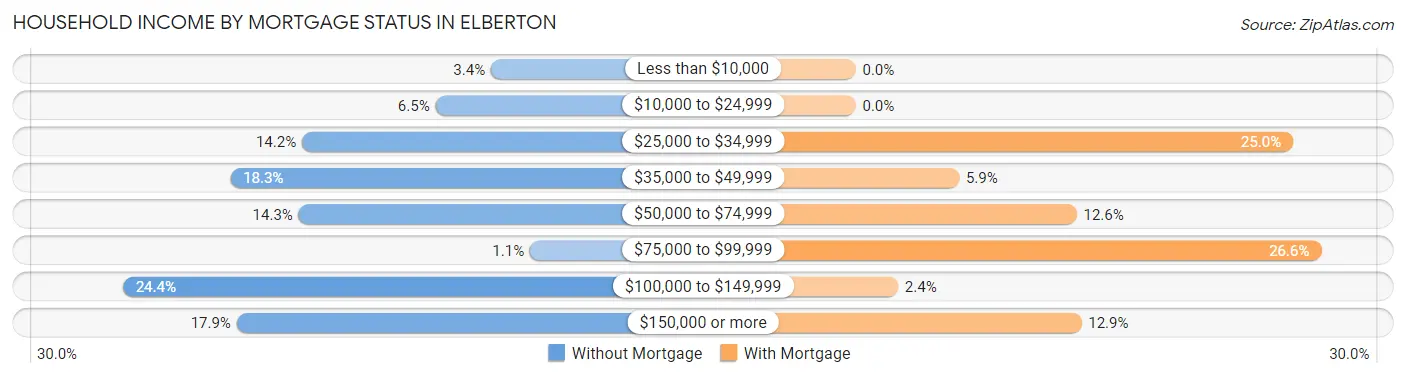
| Household Income | Without Mortgage | With Mortgage |
| Less than $10,000 | 18 (3.4%) | 0 (0.0%) |
| $10,000 to $24,999 | 35 (6.5%) | 0 (0.0%) |
| $25,000 to $34,999 | 76 (14.1%) | 93 (25.0%) |
| $35,000 to $49,999 | 98 (18.2%) | 22 (5.9%) |
| $50,000 to $74,999 | 77 (14.3%) | 47 (12.6%) |
| $75,000 to $99,999 | 6 (1.1%) | 99 (26.6%) |
| $100,000 to $149,999 | 131 (24.4%) | 9 (2.4%) |
| $150,000 or more | 96 (17.9%) | 48 (12.9%) |
| Total | 537 (100.0%) | 372 (100.0%) |
Property Value to Household Income Ratio in Elberton
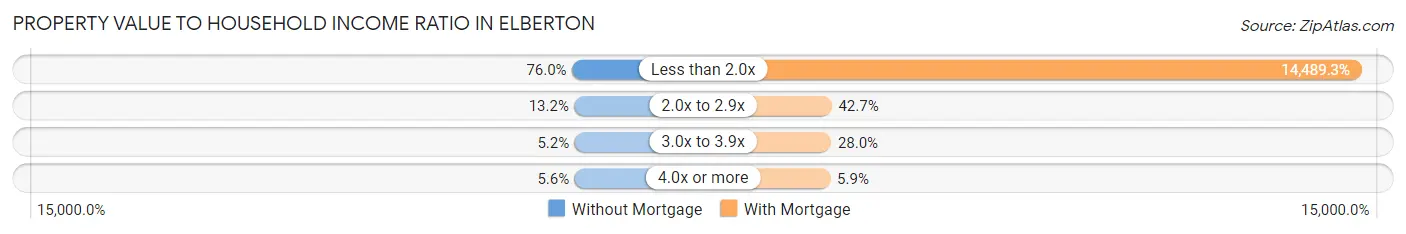
| Value-to-Income Ratio | Without Mortgage | With Mortgage |
| Less than 2.0x | 408 (76.0%) | 53,900 (14,489.3%) |
| 2.0x to 2.9x | 71 (13.2%) | 159 (42.7%) |
| 3.0x to 3.9x | 28 (5.2%) | 104 (28.0%) |
| 4.0x or more | 30 (5.6%) | 22 (5.9%) |
| Total | 537 (100.0%) | 372 (100.0%) |
Real Estate Taxes by Mortgage Status in Elberton
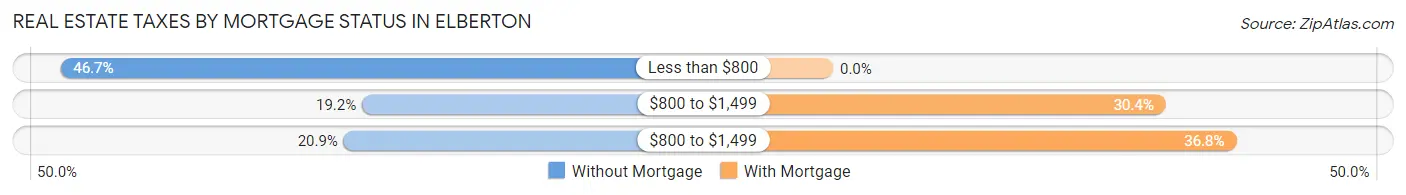
| Property Taxes | Without Mortgage | With Mortgage |
| Less than $800 | 251 (46.7%) | 0 (0.0%) |
| $800 to $1,499 | 103 (19.2%) | 113 (30.4%) |
| $800 to $1,499 | 112 (20.9%) | 137 (36.8%) |
| Total | 537 (100.0%) | 372 (100.0%) |
Health & Disability in Elberton
Health Insurance Coverage by Age in Elberton
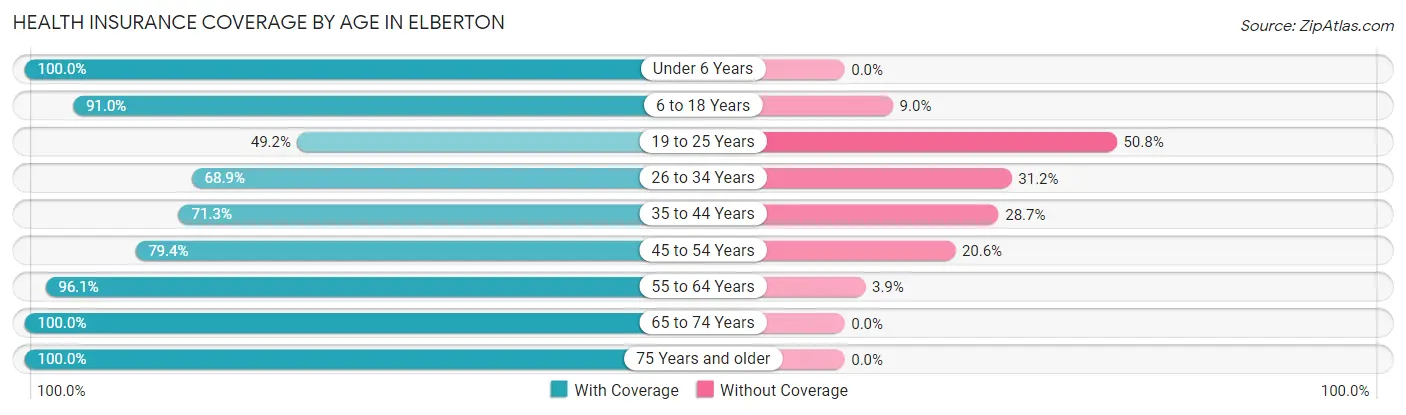
| Age Bracket | With Coverage | Without Coverage |
| Under 6 Years | 495 (100.0%) | 0 (0.0%) |
| 6 to 18 Years | 878 (91.0%) | 87 (9.0%) |
| 19 to 25 Years | 129 (49.2%) | 133 (50.8%) |
| 26 to 34 Years | 389 (68.9%) | 176 (31.1%) |
| 35 to 44 Years | 402 (71.3%) | 162 (28.7%) |
| 45 to 54 Years | 250 (79.4%) | 65 (20.6%) |
| 55 to 64 Years | 547 (96.1%) | 22 (3.9%) |
| 65 to 74 Years | 520 (100.0%) | 0 (0.0%) |
| 75 Years and older | 214 (100.0%) | 0 (0.0%) |
| Total | 3,824 (85.6%) | 645 (14.4%) |
Health Insurance Coverage by Citizenship Status in Elberton
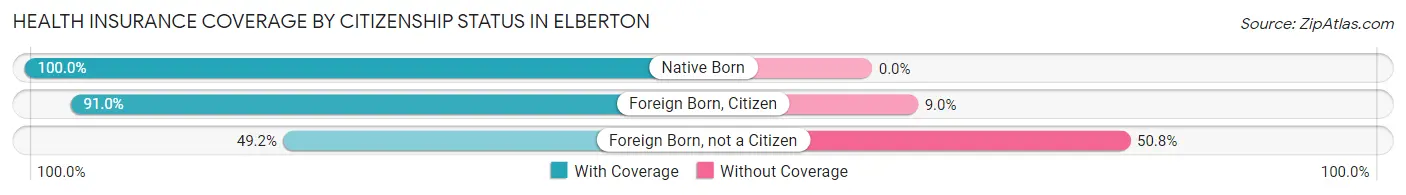
| Citizenship Status | With Coverage | Without Coverage |
| Native Born | 495 (100.0%) | 0 (0.0%) |
| Foreign Born, Citizen | 878 (91.0%) | 87 (9.0%) |
| Foreign Born, not a Citizen | 129 (49.2%) | 133 (50.8%) |
Health Insurance Coverage by Household Income in Elberton
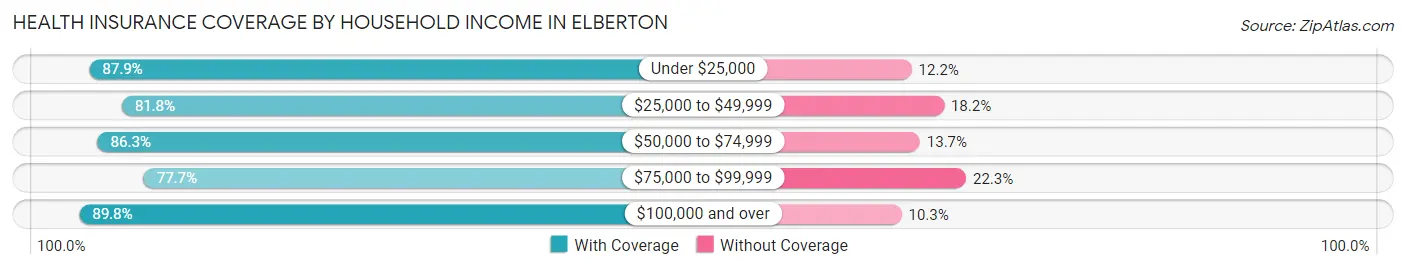
| Household Income | With Coverage | Without Coverage |
| Under $25,000 | 1,027 (87.8%) | 142 (12.1%) |
| $25,000 to $49,999 | 1,204 (81.8%) | 268 (18.2%) |
| $50,000 to $74,999 | 624 (86.3%) | 99 (13.7%) |
| $75,000 to $99,999 | 146 (77.7%) | 42 (22.3%) |
| $100,000 and over | 823 (89.7%) | 94 (10.2%) |
Public vs Private Health Insurance Coverage by Age in Elberton
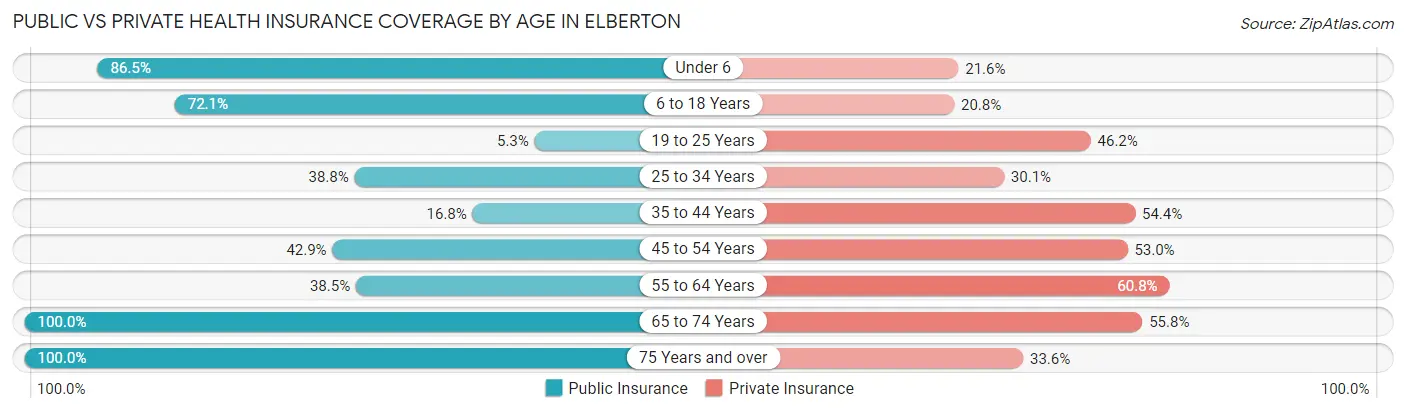
| Age Bracket | Public Insurance | Private Insurance |
| Under 6 | 428 (86.5%) | 107 (21.6%) |
| 6 to 18 Years | 696 (72.1%) | 201 (20.8%) |
| 19 to 25 Years | 14 (5.3%) | 121 (46.2%) |
| 25 to 34 Years | 219 (38.8%) | 170 (30.1%) |
| 35 to 44 Years | 95 (16.8%) | 307 (54.4%) |
| 45 to 54 Years | 135 (42.9%) | 167 (53.0%) |
| 55 to 64 Years | 219 (38.5%) | 346 (60.8%) |
| 65 to 74 Years | 520 (100.0%) | 290 (55.8%) |
| 75 Years and over | 214 (100.0%) | 72 (33.6%) |
| Total | 2,540 (56.8%) | 1,781 (39.9%) |
Disability Status by Sex by Age in Elberton
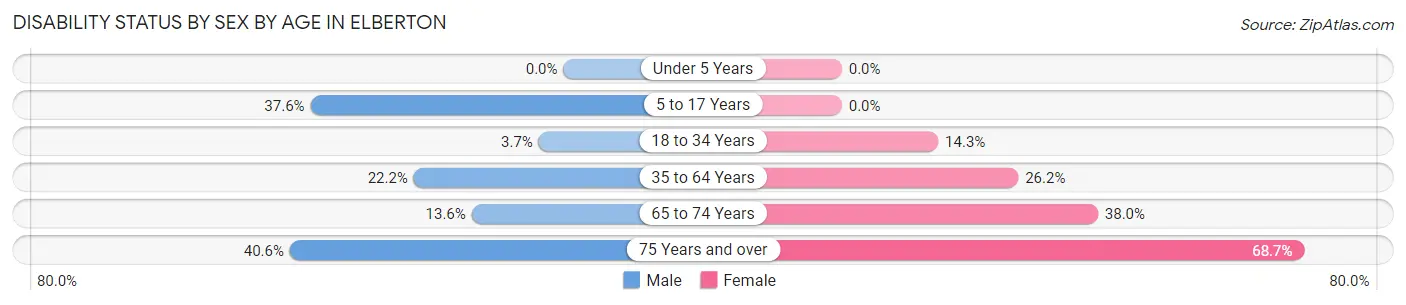
| Age Bracket | Male | Female |
| Under 5 Years | 0 (0.0%) | 0 (0.0%) |
| 5 to 17 Years | 151 (37.6%) | 0 (0.0%) |
| 18 to 34 Years | 13 (3.7%) | 77 (14.3%) |
| 35 to 64 Years | 164 (22.2%) | 186 (26.2%) |
| 65 to 74 Years | 35 (13.6%) | 100 (38.0%) |
| 75 Years and over | 26 (40.6%) | 103 (68.7%) |
Disability Class by Sex by Age in Elberton
Disability Class: Hearing Difficulty
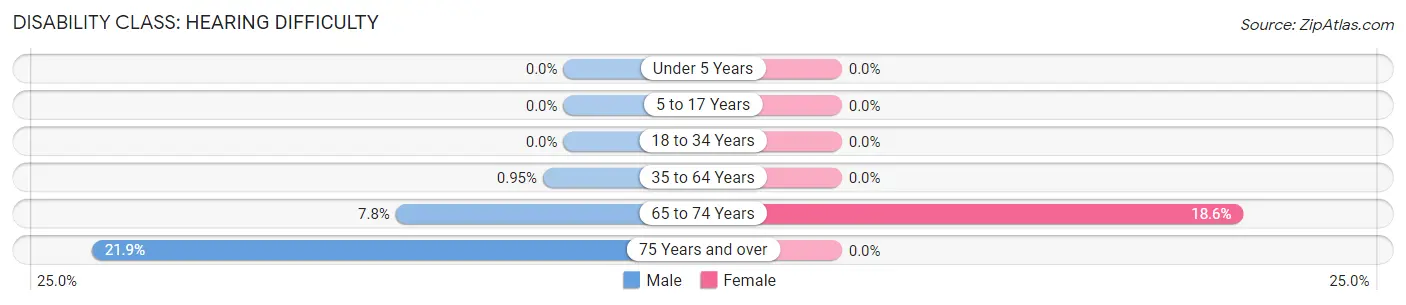
| Age Bracket | Male | Female |
| Under 5 Years | 0 (0.0%) | 0 (0.0%) |
| 5 to 17 Years | 0 (0.0%) | 0 (0.0%) |
| 18 to 34 Years | 0 (0.0%) | 0 (0.0%) |
| 35 to 64 Years | 7 (0.9%) | 0 (0.0%) |
| 65 to 74 Years | 20 (7.8%) | 49 (18.6%) |
| 75 Years and over | 14 (21.9%) | 0 (0.0%) |
Disability Class: Vision Difficulty
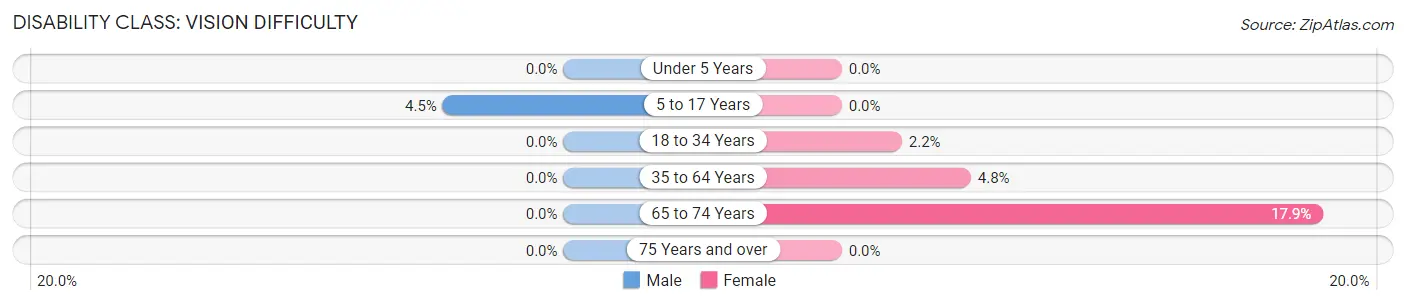
| Age Bracket | Male | Female |
| Under 5 Years | 0 (0.0%) | 0 (0.0%) |
| 5 to 17 Years | 18 (4.5%) | 0 (0.0%) |
| 18 to 34 Years | 0 (0.0%) | 12 (2.2%) |
| 35 to 64 Years | 0 (0.0%) | 34 (4.8%) |
| 65 to 74 Years | 0 (0.0%) | 47 (17.9%) |
| 75 Years and over | 0 (0.0%) | 0 (0.0%) |
Disability Class: Cognitive Difficulty
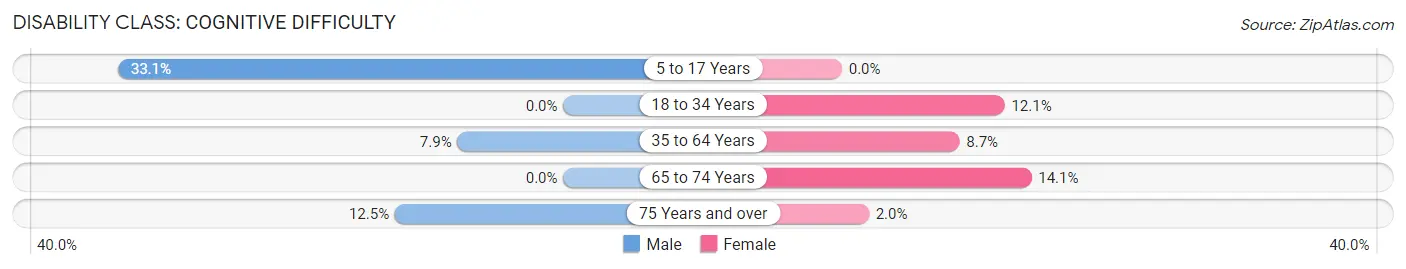
| Age Bracket | Male | Female |
| 5 to 17 Years | 133 (33.1%) | 0 (0.0%) |
| 18 to 34 Years | 0 (0.0%) | 65 (12.1%) |
| 35 to 64 Years | 58 (7.9%) | 62 (8.7%) |
| 65 to 74 Years | 0 (0.0%) | 37 (14.1%) |
| 75 Years and over | 8 (12.5%) | 3 (2.0%) |
Disability Class: Ambulatory Difficulty
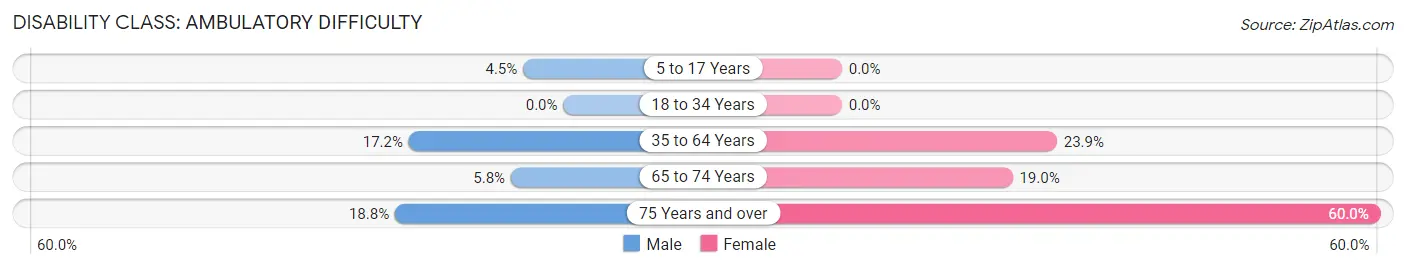
| Age Bracket | Male | Female |
| 5 to 17 Years | 18 (4.5%) | 0 (0.0%) |
| 18 to 34 Years | 0 (0.0%) | 0 (0.0%) |
| 35 to 64 Years | 127 (17.2%) | 170 (23.9%) |
| 65 to 74 Years | 15 (5.8%) | 50 (19.0%) |
| 75 Years and over | 12 (18.8%) | 90 (60.0%) |
Disability Class: Self-Care Difficulty
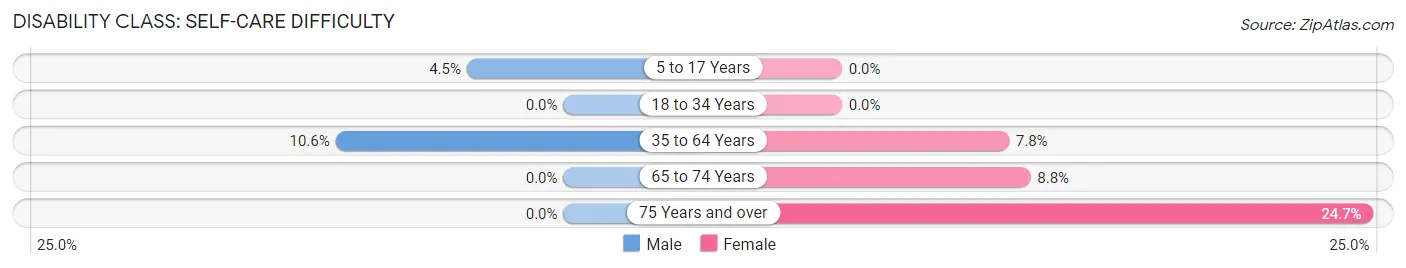
| Age Bracket | Male | Female |
| 5 to 17 Years | 18 (4.5%) | 0 (0.0%) |
| 18 to 34 Years | 0 (0.0%) | 0 (0.0%) |
| 35 to 64 Years | 78 (10.6%) | 55 (7.7%) |
| 65 to 74 Years | 0 (0.0%) | 23 (8.7%) |
| 75 Years and over | 0 (0.0%) | 37 (24.7%) |
Technology Access in Elberton
Computing Device Access in Elberton
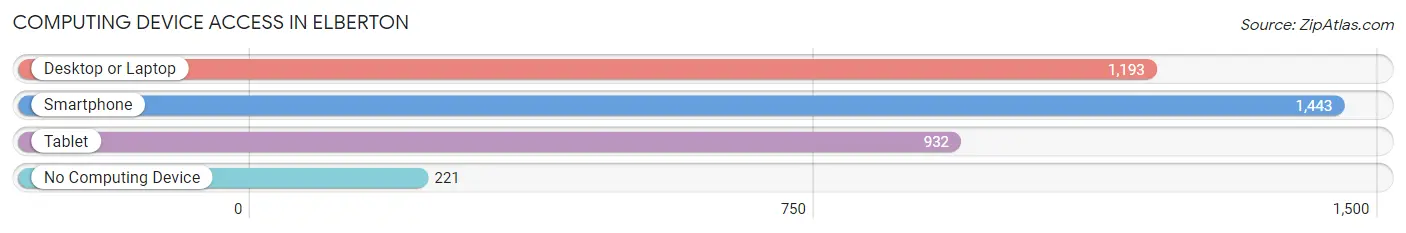
| Device Type | # Households | % Households |
| Desktop or Laptop | 1,193 | 64.9% |
| Smartphone | 1,443 | 78.5% |
| Tablet | 932 | 50.7% |
| No Computing Device | 221 | 12.0% |
| Total | 1,838 | 100.0% |
Internet Access in Elberton
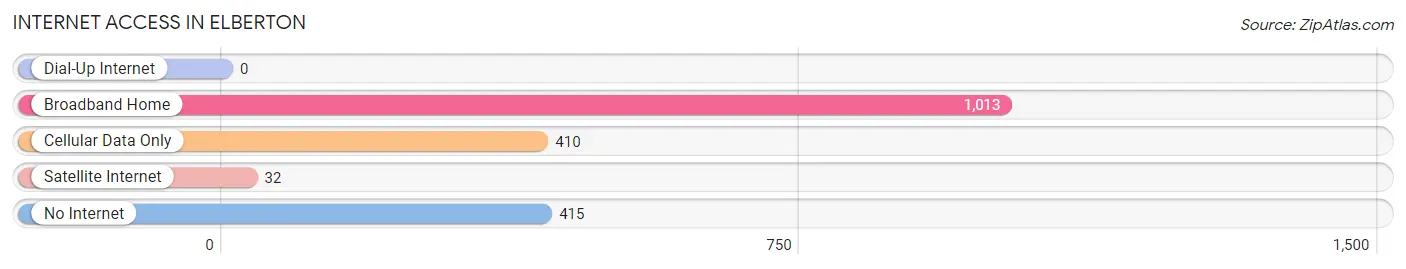
| Internet Type | # Households | % Households |
| Dial-Up Internet | 0 | 0.0% |
| Broadband Home | 1,013 | 55.1% |
| Cellular Data Only | 410 | 22.3% |
| Satellite Internet | 32 | 1.7% |
| No Internet | 415 | 22.6% |
| Total | 1,838 | 100.0% |
Elberton Summary
Elberton, Georgia is a small city located in Elbert County in the northeastern part of the state. It is the county seat and the largest city in the county. The city is situated along the Broad River and is home to a population of 4,653 people as of the 2010 census.
History
Elberton was founded in 1803 by a group of settlers from Elbert County, Georgia. The city was named after General Samuel Elbert, a Revolutionary War hero. The city was incorporated in 1854 and has since grown to become the largest city in Elbert County.
Geography
Elberton is located in the northeastern part of Georgia, in Elbert County. It is situated along the Broad River and is bordered by Hart County to the north, Franklin County to the east, and Oglethorpe County to the south. The city has a total area of 4.2 square miles, all of which is land.
Economy
Elberton’s economy is largely based on agriculture and manufacturing. The city is home to several large manufacturing plants, including a granite quarry and a paper mill. The city is also home to several small businesses, including restaurants, retail stores, and service providers.
Demographics
As of the 2010 census, Elberton had a population of 4,653 people. The racial makeup of the city was 73.3% White, 22.2% African American, 0.3% Native American, 0.7% Asian, 0.1% Pacific Islander, 1.7% from other races, and 1.9% from two or more races. Hispanic or Latino of any race were 3.3% of the population.
The median income for a household in Elberton was $30,938, and the median income for a family was $37,917. The per capita income for the city was $17,845. About 17.2% of families and 20.2% of the population were below the poverty line, including 28.2% of those under age 18 and 16.2% of those age 65 or over.
Elberton is served by the Elbert County School District, which includes four elementary schools, one middle school, and one high school. The city is also home to several private schools, including Elberton Christian Academy and Elberton Academy.
Elberton is home to several churches, including First Baptist Church, Elberton United Methodist Church, and Elberton Presbyterian Church. The city is also home to several parks, including Elbert Square Park, Elbert Memorial Park, and Elbert County Park.
Elberton is served by the Elbert County Airport, which is located just outside the city limits. The city is also served by several major highways, including US Highway 29, US Highway 78, and Georgia State Route 72.
Elberton is a small city with a rich history and a vibrant economy. It is home to a diverse population and offers a variety of recreational activities and cultural attractions. Elberton is a great place to live, work, and play.
Common Questions
What is Per Capita Income in Elberton?
Per Capita income in Elberton is $24,891.
What is the Median Family Income in Elberton?
Median Family Income in Elberton is $49,621.
What is the Median Household income in Elberton?
Median Household Income in Elberton is $38,562.
What is Income or Wage Gap in Elberton?
Income or Wage Gap in Elberton is 40.9%.
Women in Elberton earn 59.1 cents for every dollar earned by a man.
What is Inequality or Gini Index in Elberton?
Inequality or Gini Index in Elberton is 0.49.
What is the Total Population of Elberton?
Total Population of Elberton is 4,627.
What is the Total Male Population of Elberton?
Total Male Population of Elberton is 2,214.
What is the Total Female Population of Elberton?
Total Female Population of Elberton is 2,413.
What is the Ratio of Males per 100 Females in Elberton?
There are 91.75 Males per 100 Females in Elberton.
What is the Ratio of Females per 100 Males in Elberton?
There are 108.99 Females per 100 Males in Elberton.
What is the Median Population Age in Elberton?
Median Population Age in Elberton is 34.6 Years.
What is the Average Family Size in Elberton
Average Family Size in Elberton is 3.4 People.
What is the Average Household Size in Elberton
Average Household Size in Elberton is 2.4 People.
How Large is the Labor Force in Elberton?
There are 1,977 People in the Labor Forcein in Elberton.
What is the Percentage of People in the Labor Force in Elberton?
58.6% of People are in the Labor Force in Elberton.
What is the Unemployment Rate in Elberton?
Unemployment Rate in Elberton is 8.4%.