Du Pont, GA Map & Demographics
Du Pont Map
Du Pont Overview
$12,592
PER CAPITA INCOME
$24,688
AVG HOUSEHOLD INCOME
0.55
INEQUALITY / GINI INDEX
142
TOTAL POPULATION
71
MALE POPULATION
71
FEMALE POPULATION
100.00
MALES / 100 FEMALES
100.00
FEMALES / 100 MALES
32.5
MEDIAN AGE
3.4
AVG FAMILY SIZE
3.2
AVG HOUSEHOLD SIZE
19
LABOR FORCE [ PEOPLE ]
22.1%
PERCENT IN LABOR FORCE
Du Pont Zip Codes
Du Pont Area Codes
Income in Du Pont
Income Overview in Du Pont
| Characteristic | Number | Measure |
| Per Capita Income | 142 | $12,592 |
| Median Family Income | 36 | $0 |
| Mean Family Income | 36 | $47,792 |
| Median Household Income | 45 | $24,688 |
| Mean Household Income | 45 | $45,220 |
| Income Deficit | 36 | $0 |
| Wage / Income Gap (%) | 142 | 0.00% |
| Wage / Income Gap ($) | 142 | 100.00¢ per $1 |
| Gini / Inequality Index | 142 | 0.55 |
Earnings by Sex in Du Pont
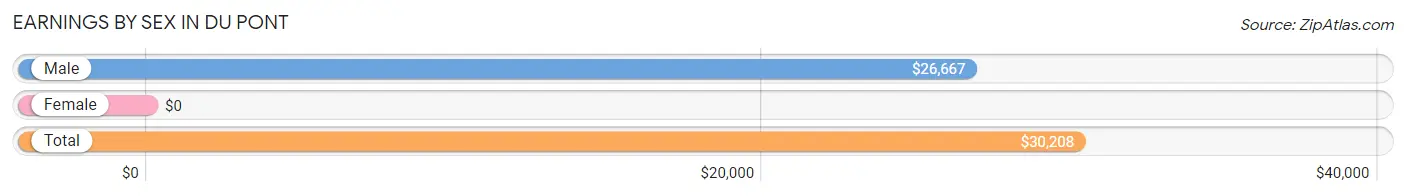
| Sex | Number | Average Earnings |
| Male | 10 (52.6%) | $26,667 |
| Female | 9 (47.4%) | $0 |
| Total | 19 (100.0%) | $30,208 |
Earnings by Sex by Income Bracket in Du Pont
The most common earnings brackets in Du Pont are $30,000 to $34,999 for men (4 | 40.0%) and $2,499 or less for women (3 | 33.3%).
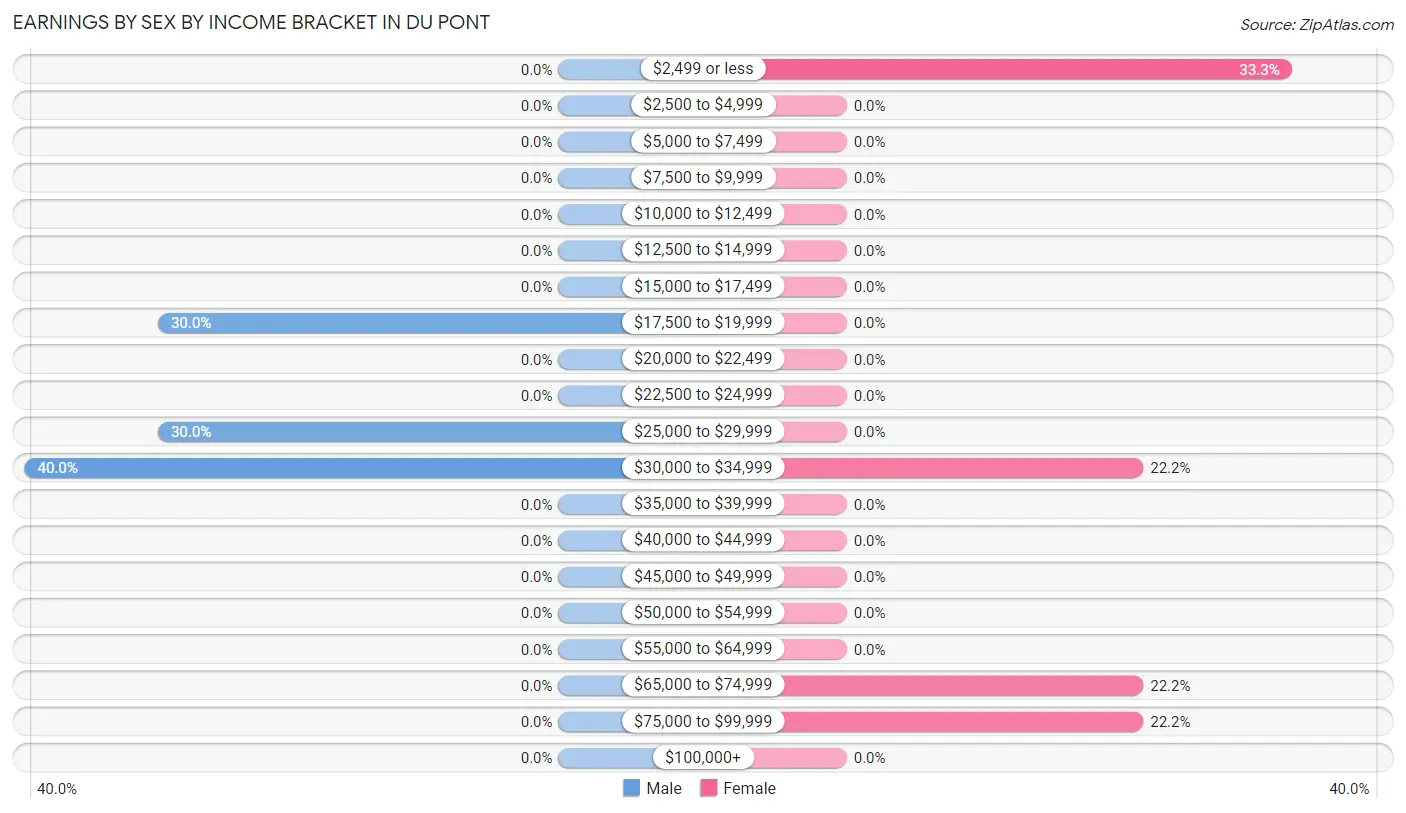
| Income | Male | Female |
| $2,499 or less | 0 (0.0%) | 3 (33.3%) |
| $2,500 to $4,999 | 0 (0.0%) | 0 (0.0%) |
| $5,000 to $7,499 | 0 (0.0%) | 0 (0.0%) |
| $7,500 to $9,999 | 0 (0.0%) | 0 (0.0%) |
| $10,000 to $12,499 | 0 (0.0%) | 0 (0.0%) |
| $12,500 to $14,999 | 0 (0.0%) | 0 (0.0%) |
| $15,000 to $17,499 | 0 (0.0%) | 0 (0.0%) |
| $17,500 to $19,999 | 3 (30.0%) | 0 (0.0%) |
| $20,000 to $22,499 | 0 (0.0%) | 0 (0.0%) |
| $22,500 to $24,999 | 0 (0.0%) | 0 (0.0%) |
| $25,000 to $29,999 | 3 (30.0%) | 0 (0.0%) |
| $30,000 to $34,999 | 4 (40.0%) | 2 (22.2%) |
| $35,000 to $39,999 | 0 (0.0%) | 0 (0.0%) |
| $40,000 to $44,999 | 0 (0.0%) | 0 (0.0%) |
| $45,000 to $49,999 | 0 (0.0%) | 0 (0.0%) |
| $50,000 to $54,999 | 0 (0.0%) | 0 (0.0%) |
| $55,000 to $64,999 | 0 (0.0%) | 0 (0.0%) |
| $65,000 to $74,999 | 0 (0.0%) | 2 (22.2%) |
| $75,000 to $99,999 | 0 (0.0%) | 2 (22.2%) |
| $100,000+ | 0 (0.0%) | 0 (0.0%) |
| Total | 10 (100.0%) | 9 (100.0%) |
Earnings by Sex by Educational Attainment in Du Pont
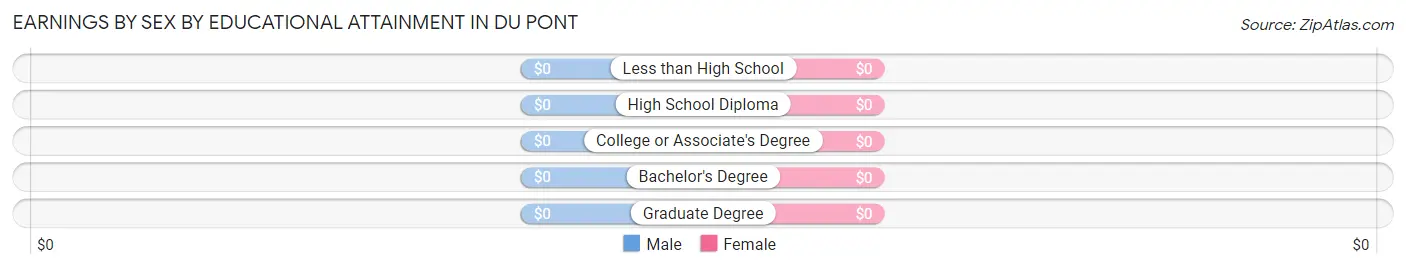
| Educational Attainment | Male Income | Female Income |
| Less than High School | - | - |
| High School Diploma | - | - |
| College or Associate's Degree | - | - |
| Bachelor's Degree | - | - |
| Graduate Degree | - | - |
| Total | $26,667 | $73,750 |
Family Income in Du Pont
Family Income Brackets in Du Pont
According to the Du Pont family income data, there are 13 families falling into the less than $10,000 income range, which is the most common income bracket and makes up 36.1% of all families.
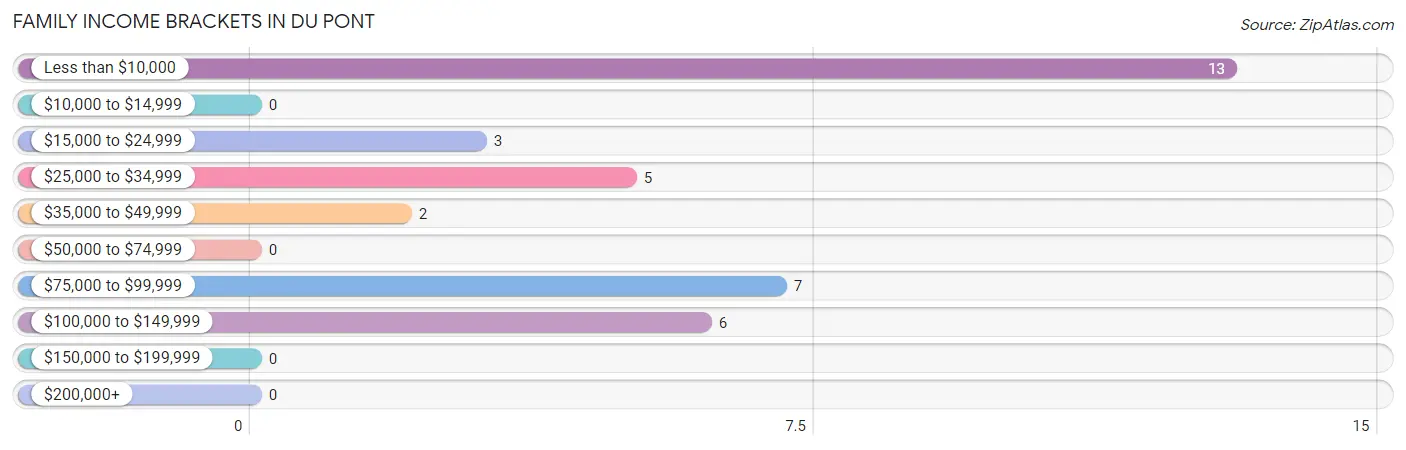
| Income Bracket | # Families | % Families |
| Less than $10,000 | 13 | 36.1% |
| $10,000 to $14,999 | 0 | 0.0% |
| $15,000 to $24,999 | 3 | 8.3% |
| $25,000 to $34,999 | 5 | 13.9% |
| $35,000 to $49,999 | 2 | 5.6% |
| $50,000 to $74,999 | 0 | 0.0% |
| $75,000 to $99,999 | 7 | 19.4% |
| $100,000 to $149,999 | 6 | 16.7% |
| $150,000 to $199,999 | 0 | 0.0% |
| $200,000+ | 0 | 0.0% |
Family Income by Famaliy Size in Du Pont
| Income Bracket | # Families | Median Income |
| 2-Person Families | 21 (58.3%) | $0 |
| 3-Person Families | 4 (11.1%) | $0 |
| 4-Person Families | 2 (5.6%) | $0 |
| 5-Person Families | 5 (13.9%) | $0 |
| 6-Person Families | 0 (0.0%) | $0 |
| 7+ Person Families | 4 (11.1%) | $0 |
| Total | 36 (100.0%) | $0 |
Family Income by Number of Earners in Du Pont
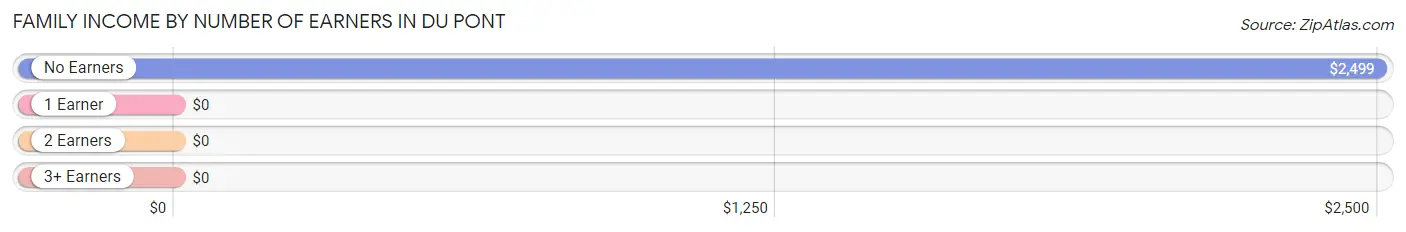
| Number of Earners | # Families | Median Income |
| No Earners | 21 (58.3%) | $2,499 |
| 1 Earner | 11 (30.6%) | $0 |
| 2 Earners | 4 (11.1%) | $0 |
| 3+ Earners | 0 (0.0%) | $0 |
| Total | 36 (100.0%) | $0 |
Household Income in Du Pont
Household Income Brackets in Du Pont
With 13 households falling in the category, the less than $10,000 income range is the most frequent in Du Pont, accounting for 28.9% of all households.
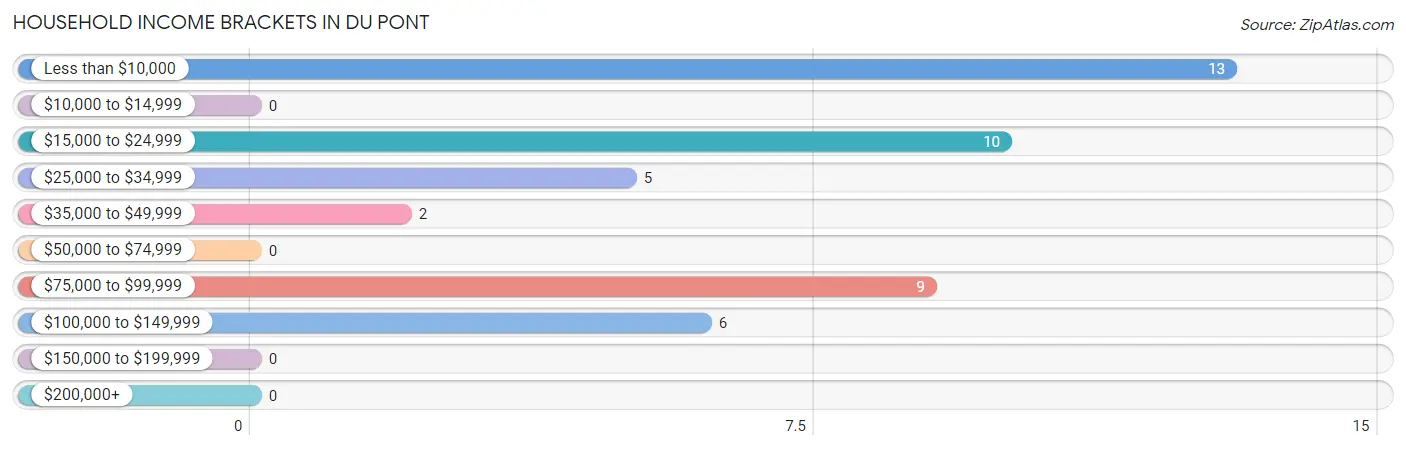
| Income Bracket | # Households | % Households |
| Less than $10,000 | 13 | 28.9% |
| $10,000 to $14,999 | 0 | 0.0% |
| $15,000 to $24,999 | 10 | 22.2% |
| $25,000 to $34,999 | 5 | 11.1% |
| $35,000 to $49,999 | 2 | 4.4% |
| $50,000 to $74,999 | 0 | 0.0% |
| $75,000 to $99,999 | 9 | 20.0% |
| $100,000 to $149,999 | 6 | 13.3% |
| $150,000 to $199,999 | 0 | 0.0% |
| $200,000+ | 0 | 0.0% |
Household Income by Householder Age in Du Pont
| Income Bracket | # Households | Median Income |
| 15 to 24 Years | 0 (0.0%) | $0 |
| 25 to 44 Years | 14 (31.1%) | $0 |
| 45 to 64 Years | 8 (17.8%) | $0 |
| 65+ Years | 23 (51.1%) | $0 |
| Total | 45 (100.0%) | $24,688 |
Poverty in Du Pont
Income Below Poverty by Sex and Age in Du Pont
With 67.6% poverty level for males and 76.1% for females among the residents of Du Pont, under 5 year old males and under 5 year old females are the most vulnerable to poverty, with 14 males (100.0%) and 7 females (100.0%) in their respective age groups living below the poverty level.
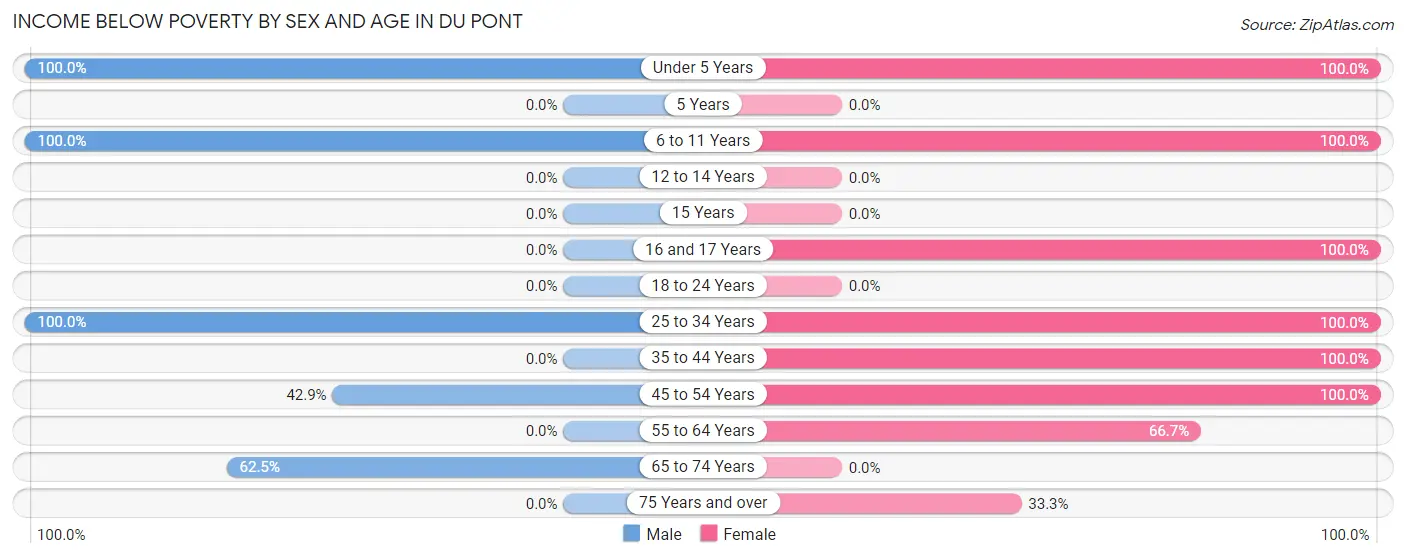
| Age Bracket | Male | Female |
| Under 5 Years | 14 (100.0%) | 7 (100.0%) |
| 5 Years | 0 (0.0%) | 0 (0.0%) |
| 6 to 11 Years | 19 (100.0%) | 16 (100.0%) |
| 12 to 14 Years | 0 (0.0%) | 0 (0.0%) |
| 15 Years | 0 (0.0%) | 0 (0.0%) |
| 16 and 17 Years | 0 (0.0%) | 6 (100.0%) |
| 18 to 24 Years | 0 (0.0%) | 0 (0.0%) |
| 25 to 34 Years | 2 (100.0%) | 6 (100.0%) |
| 35 to 44 Years | 0 (0.0%) | 5 (100.0%) |
| 45 to 54 Years | 3 (42.9%) | 9 (100.0%) |
| 55 to 64 Years | 0 (0.0%) | 4 (66.7%) |
| 65 to 74 Years | 10 (62.5%) | 0 (0.0%) |
| 75 Years and over | 0 (0.0%) | 1 (33.3%) |
| Total | 48 (67.6%) | 54 (76.1%) |
Income Above Poverty by Sex and Age in Du Pont
According to the poverty statistics in Du Pont, males aged 35 to 44 years and females aged 18 to 24 years are the age groups that are most secure financially, with 100.0% of males and 100.0% of females in these age groups living above the poverty line.
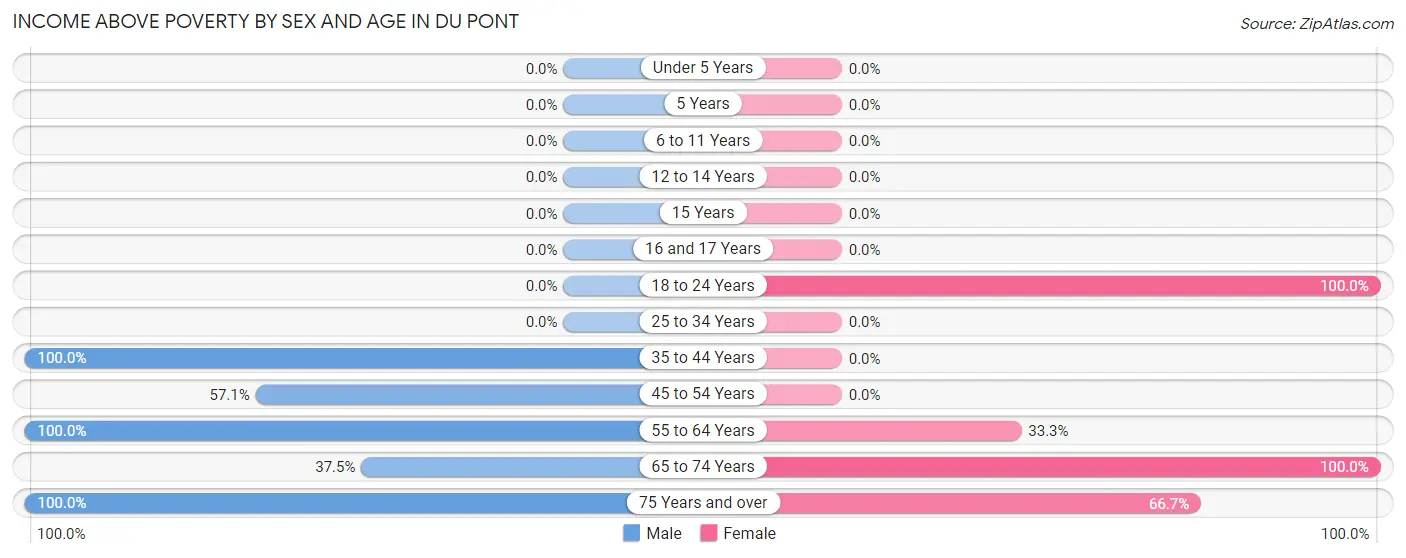
| Age Bracket | Male | Female |
| Under 5 Years | 0 (0.0%) | 0 (0.0%) |
| 5 Years | 0 (0.0%) | 0 (0.0%) |
| 6 to 11 Years | 0 (0.0%) | 0 (0.0%) |
| 12 to 14 Years | 0 (0.0%) | 0 (0.0%) |
| 15 Years | 0 (0.0%) | 0 (0.0%) |
| 16 and 17 Years | 0 (0.0%) | 0 (0.0%) |
| 18 to 24 Years | 0 (0.0%) | 3 (100.0%) |
| 25 to 34 Years | 0 (0.0%) | 0 (0.0%) |
| 35 to 44 Years | 3 (100.0%) | 0 (0.0%) |
| 45 to 54 Years | 4 (57.1%) | 0 (0.0%) |
| 55 to 64 Years | 8 (100.0%) | 2 (33.3%) |
| 65 to 74 Years | 6 (37.5%) | 10 (100.0%) |
| 75 Years and over | 2 (100.0%) | 2 (66.7%) |
| Total | 23 (32.4%) | 17 (23.9%) |
Income Below Poverty Among Married-Couple Families in Du Pont
The poverty statistics for married-couple families in Du Pont show that 60.7% or 17 of the total 28 families live below the poverty line. Families with 1 or 2 children have the highest poverty rate of 100.0%, comprising of 2 families. On the other hand, families with no children have the lowest poverty rate of 47.6%, which includes 10 families.
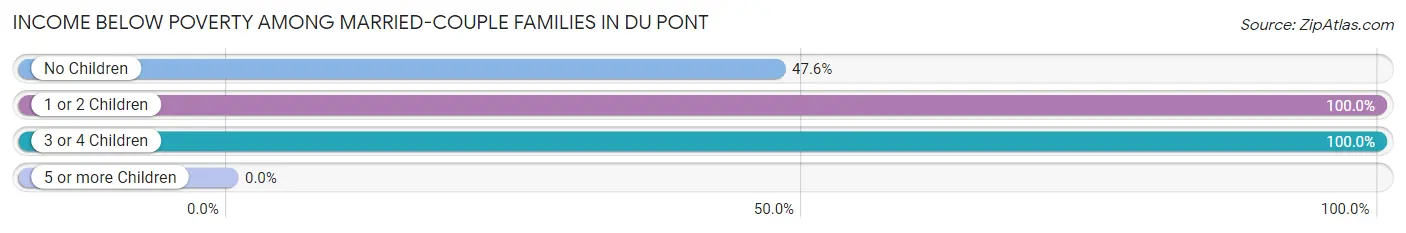
| Children | Above Poverty | Below Poverty |
| No Children | 11 (52.4%) | 10 (47.6%) |
| 1 or 2 Children | 0 (0.0%) | 2 (100.0%) |
| 3 or 4 Children | 0 (0.0%) | 5 (100.0%) |
| 5 or more Children | 0 (0.0%) | 0 (0.0%) |
| Total | 11 (39.3%) | 17 (60.7%) |
Income Below Poverty Among Single-Parent Households in Du Pont

| Children | Single Father | Single Mother |
| No Children | 0 (0.0%) | 0 (0.0%) |
| 1 or 2 Children | 0 (0.0%) | 0 (0.0%) |
| 3 or 4 Children | 0 (0.0%) | 0 (0.0%) |
| 5 or more Children | 0 (0.0%) | 4 (100.0%) |
| Total | 0 (0.0%) | 4 (50.0%) |
Income Below Poverty Among Married-Couple vs Single-Parent Households in Du Pont
The poverty data for Du Pont shows that 17 of the married-couple family households (60.7%) and 4 of the single-parent households (50.0%) are living below the poverty level. Within the married-couple family households, those with 1 or 2 children have the highest poverty rate, with 2 households (100.0%) falling below the poverty line. Among the single-parent households, those with 5 or more children have the highest poverty rate, with 4 household (100.0%) living below poverty.
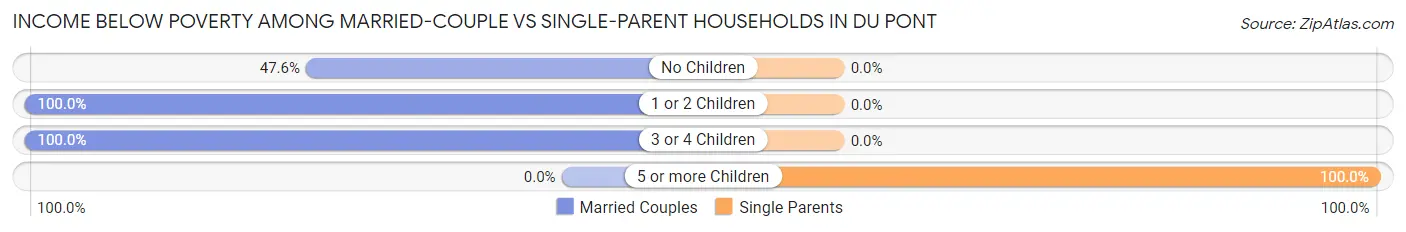
| Children | Married-Couple Families | Single-Parent Households |
| No Children | 10 (47.6%) | 0 (0.0%) |
| 1 or 2 Children | 2 (100.0%) | 0 (0.0%) |
| 3 or 4 Children | 5 (100.0%) | 0 (0.0%) |
| 5 or more Children | 0 (0.0%) | 4 (100.0%) |
| Total | 17 (60.7%) | 4 (50.0%) |
Race in Du Pont
The most populous races in Du Pont are Black / African American (70 | 49.3%), White / Caucasian (60 | 42.2%), and Hispanic or Latino (12 | 8.5%).
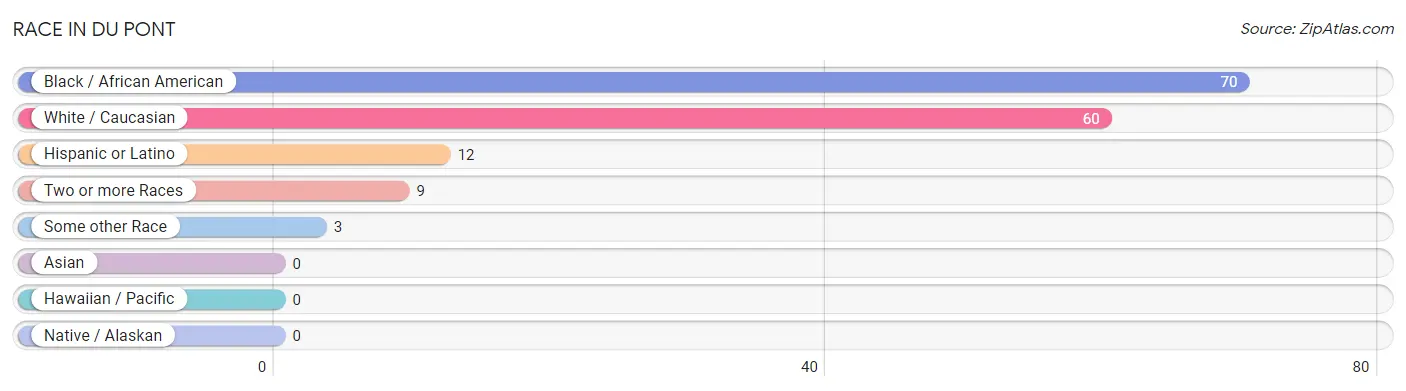
| Race | # Population | % Population |
| Asian | 0 | 0.0% |
| Black / African American | 70 | 49.3% |
| Hawaiian / Pacific | 0 | 0.0% |
| Hispanic or Latino | 12 | 8.5% |
| Native / Alaskan | 0 | 0.0% |
| White / Caucasian | 60 | 42.2% |
| Two or more Races | 9 | 6.3% |
| Some other Race | 3 | 2.1% |
| Total | 142 | 100.0% |
Ancestry in Du Pont
The most populous ancestries reported in Du Pont are Irish (25 | 17.6%), American (20 | 14.1%), German (10 | 7.0%), English (9 | 6.3%), and Puerto Rican (9 | 6.3%), together accounting for 51.4% of all Du Pont residents.
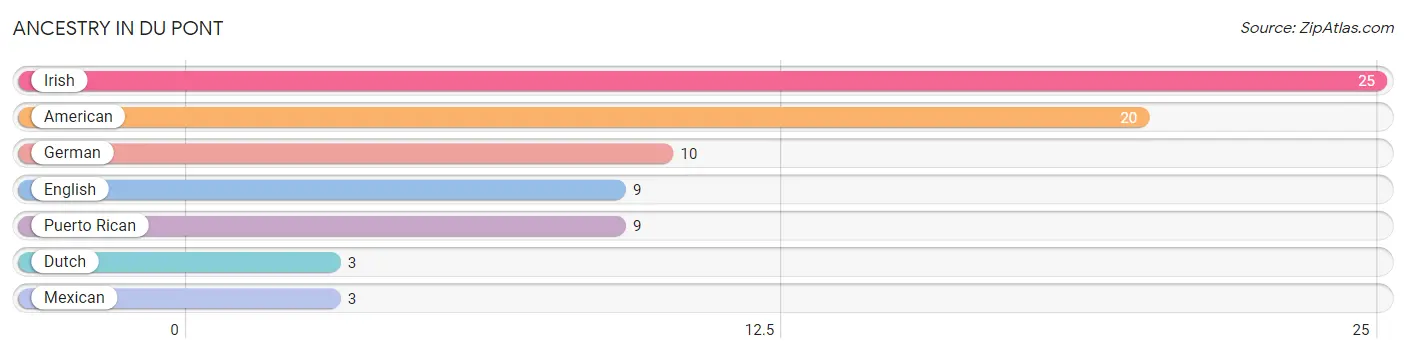
| Ancestry | # Population | % Population |
| American | 20 | 14.1% |
| Dutch | 3 | 2.1% |
| English | 9 | 6.3% |
| German | 10 | 7.0% |
| Irish | 25 | 17.6% |
| Mexican | 3 | 2.1% |
| Puerto Rican | 9 | 6.3% | View All 7 Rows |
Immigrants in Du Pont

| Immigration Origin | # Population | % Population | View All 0 Rows |
Sex and Age in Du Pont
Sex and Age in Du Pont
The most populous age groups in Du Pont are 70 to 74 Years (16 | 22.5%) for men and 5 to 9 Years (11 | 15.5%) for women.
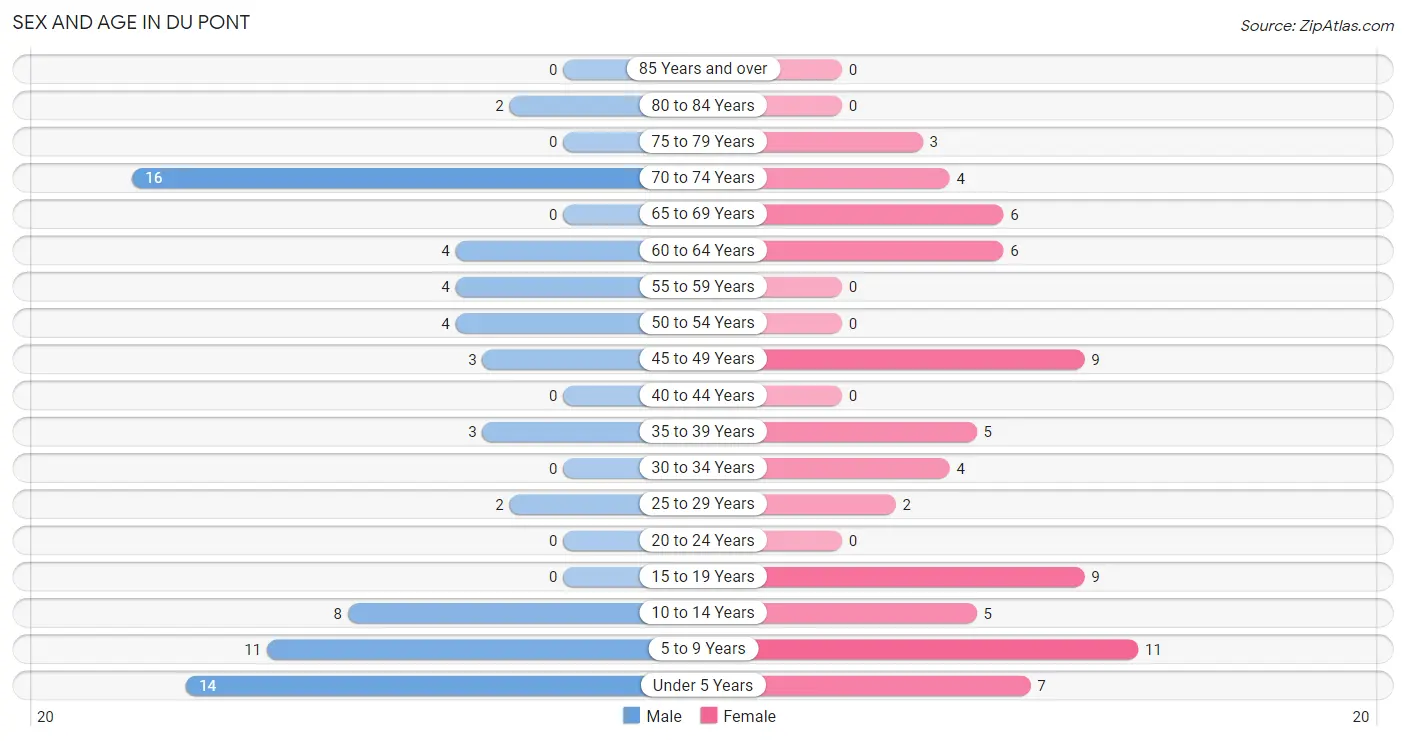
| Age Bracket | Male | Female |
| Under 5 Years | 14 (19.7%) | 7 (9.9%) |
| 5 to 9 Years | 11 (15.5%) | 11 (15.5%) |
| 10 to 14 Years | 8 (11.3%) | 5 (7.0%) |
| 15 to 19 Years | 0 (0.0%) | 9 (12.7%) |
| 20 to 24 Years | 0 (0.0%) | 0 (0.0%) |
| 25 to 29 Years | 2 (2.8%) | 2 (2.8%) |
| 30 to 34 Years | 0 (0.0%) | 4 (5.6%) |
| 35 to 39 Years | 3 (4.2%) | 5 (7.0%) |
| 40 to 44 Years | 0 (0.0%) | 0 (0.0%) |
| 45 to 49 Years | 3 (4.2%) | 9 (12.7%) |
| 50 to 54 Years | 4 (5.6%) | 0 (0.0%) |
| 55 to 59 Years | 4 (5.6%) | 0 (0.0%) |
| 60 to 64 Years | 4 (5.6%) | 6 (8.5%) |
| 65 to 69 Years | 0 (0.0%) | 6 (8.5%) |
| 70 to 74 Years | 16 (22.5%) | 4 (5.6%) |
| 75 to 79 Years | 0 (0.0%) | 3 (4.2%) |
| 80 to 84 Years | 2 (2.8%) | 0 (0.0%) |
| 85 Years and over | 0 (0.0%) | 0 (0.0%) |
| Total | 71 (100.0%) | 71 (100.0%) |
Families and Households in Du Pont
Median Family Size in Du Pont
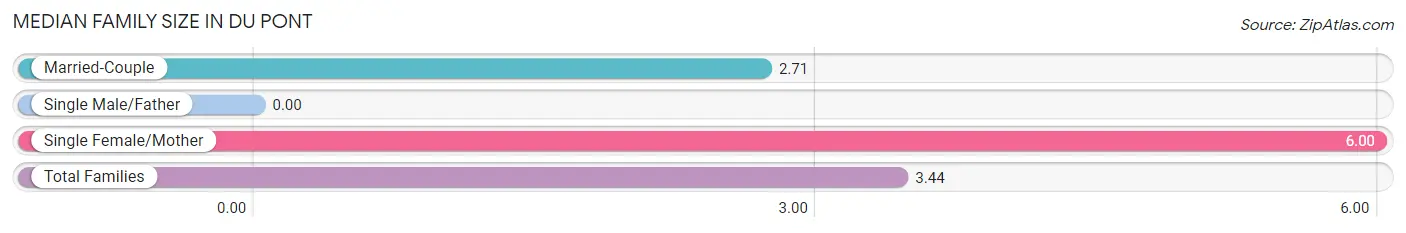
| Family Type | # Families | Family Size |
| Married-Couple | 28 (77.8%) | 2.71 |
| Single Male/Father | 0 (0.0%) | - |
| Single Female/Mother | 8 (22.2%) | 6.00 |
| Total Families | 36 (100.0%) | 3.44 |
Median Household Size in Du Pont
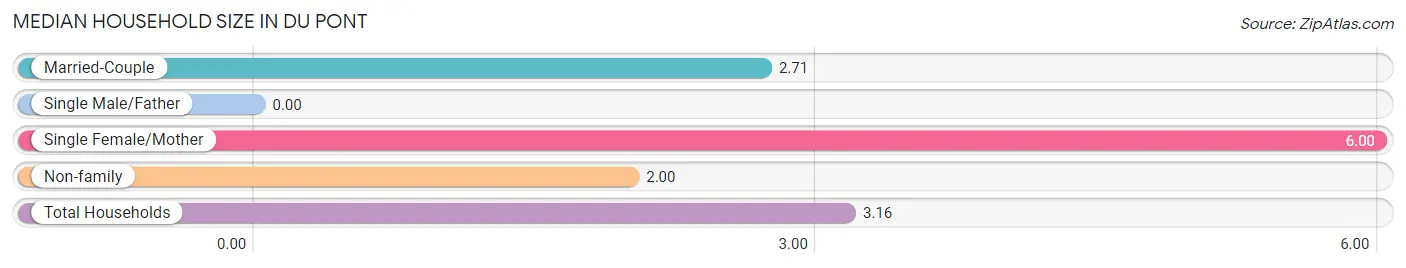
| Household Type | # Households | Household Size |
| Married-Couple | 28 (62.2%) | 2.71 |
| Single Male/Father | 0 (0.0%) | - |
| Single Female/Mother | 8 (17.8%) | 6.00 |
| Non-family | 9 (20.0%) | 2.00 |
| Total Households | 45 (100.0%) | 3.16 |
Household Size by Marriage Status in Du Pont
Out of a total of 45 households in Du Pont, 36 (80.0%) are family households, while 9 (20.0%) are nonfamily households. The most numerous type of family households are 2-person households, comprising 21, and the most common type of nonfamily households are 1-person households, comprising 5.
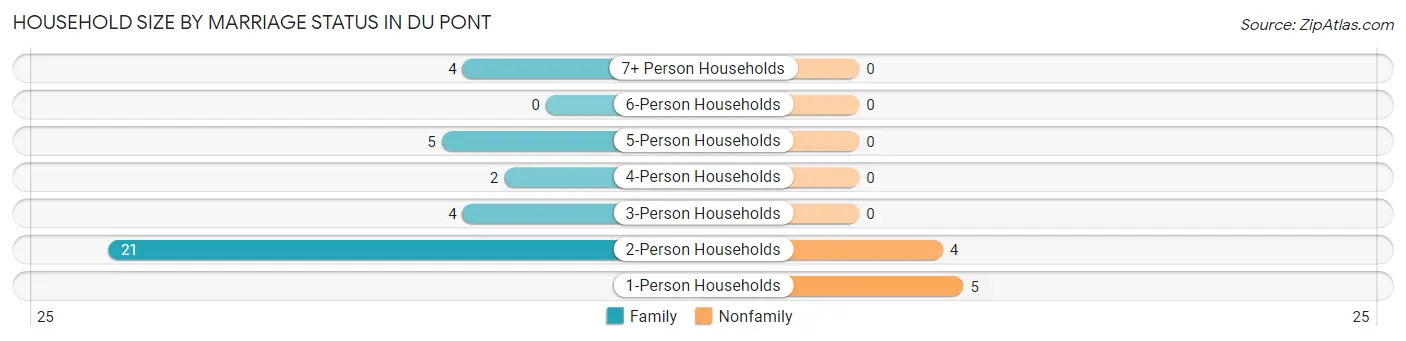
| Household Size | Family Households | Nonfamily Households |
| 1-Person Households | - | 5 (11.1%) |
| 2-Person Households | 21 (46.7%) | 4 (8.9%) |
| 3-Person Households | 4 (8.9%) | 0 (0.0%) |
| 4-Person Households | 2 (4.4%) | 0 (0.0%) |
| 5-Person Households | 5 (11.1%) | 0 (0.0%) |
| 6-Person Households | 0 (0.0%) | 0 (0.0%) |
| 7+ Person Households | 4 (8.9%) | 0 (0.0%) |
| Total | 36 (80.0%) | 9 (20.0%) |
Female Fertility in Du Pont
Fertility by Age in Du Pont
| Age Bracket | Women with Births | Births / 1,000 Women |
| 15 to 19 years | 0 (0.0%) | 0.0 |
| 20 to 34 years | 0 (0.0%) | 0.0 |
| 35 to 50 years | 0 (0.0%) | 0.0 |
| Total | 0 (0.0%) | 0.0 |
Fertility by Age by Marriage Status in Du Pont

| Age Bracket | Married | Unmarried |
| 15 to 19 years | 0 (0.0%) | 0 (0.0%) |
| 20 to 34 years | 0 (0.0%) | 0 (0.0%) |
| 35 to 50 years | 0 (0.0%) | 0 (0.0%) |
| Total | 0 (0.0%) | 0 (0.0%) |
Fertility by Education in Du Pont
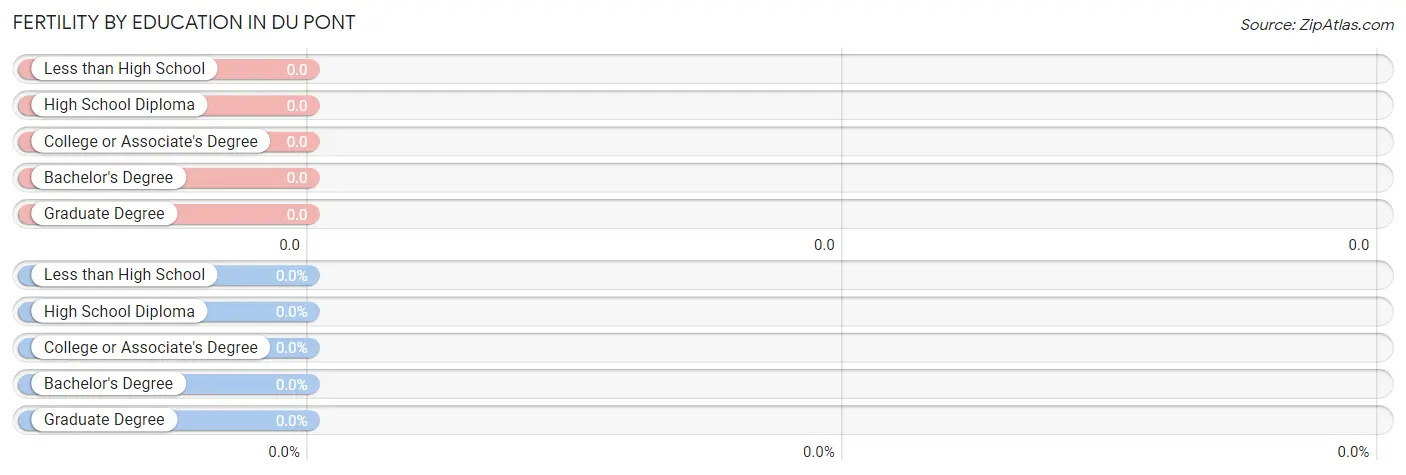
| Educational Attainment | Women with Births | Births / 1,000 Women |
| Less than High School | 0 (0.0%) | 0.0 |
| High School Diploma | 0 (0.0%) | 0.0 |
| College or Associate's Degree | 0 (0.0%) | 0.0 |
| Bachelor's Degree | 0 (0.0%) | 0.0 |
| Graduate Degree | 0 (0.0%) | 0.0 |
| Total | 0 (0.0%) | 0.0 |
Fertility by Education by Marriage Status in Du Pont
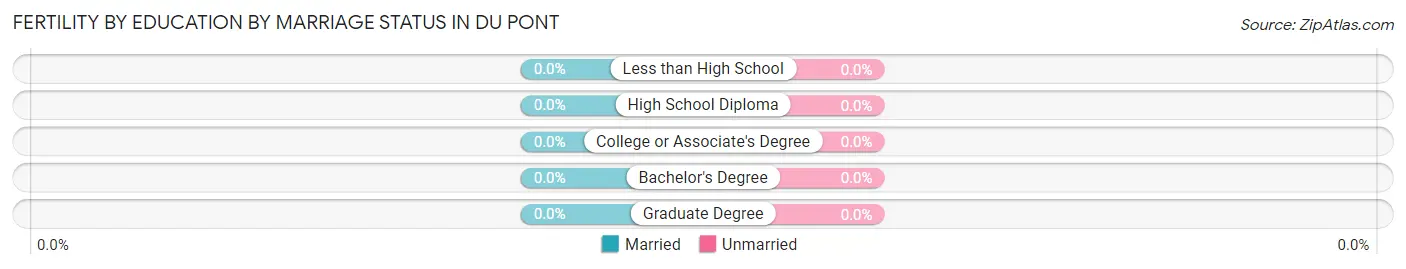
| Educational Attainment | Married | Unmarried |
| Less than High School | 0 (0.0%) | 0 (0.0%) |
| High School Diploma | 0 (0.0%) | 0 (0.0%) |
| College or Associate's Degree | 0 (0.0%) | 0 (0.0%) |
| Bachelor's Degree | 0 (0.0%) | 0 (0.0%) |
| Graduate Degree | 0 (0.0%) | 0 (0.0%) |
| Total | 0 (0.0%) | 0 (0.0%) |
Employment Characteristics in Du Pont
Employment by Class of Employer in Du Pont
Among the 16 employed individuals in Du Pont, private company employees (14 | 87.5%), and state government employees (2 | 12.5%) make up the most common classes of employment.
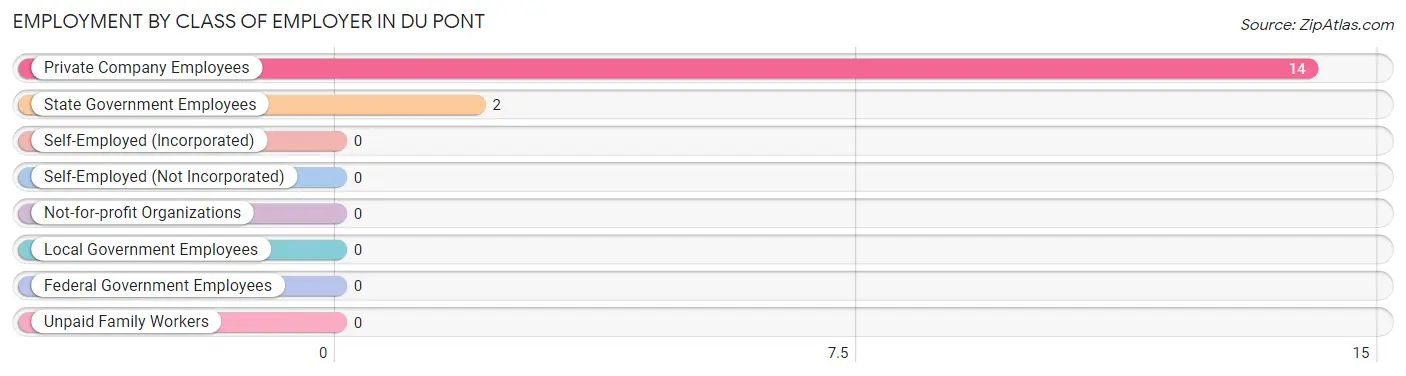
| Employer Class | # Employees | % Employees |
| Private Company Employees | 14 | 87.5% |
| Self-Employed (Incorporated) | 0 | 0.0% |
| Self-Employed (Not Incorporated) | 0 | 0.0% |
| Not-for-profit Organizations | 0 | 0.0% |
| Local Government Employees | 0 | 0.0% |
| State Government Employees | 2 | 12.5% |
| Federal Government Employees | 0 | 0.0% |
| Unpaid Family Workers | 0 | 0.0% |
| Total | 16 | 100.0% |
Employment Status by Age in Du Pont
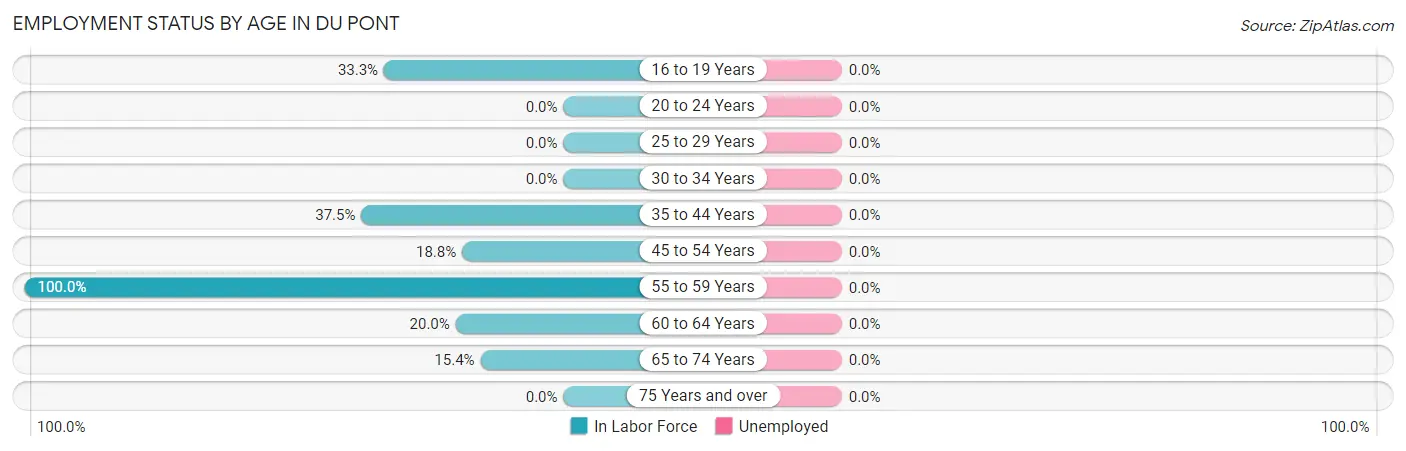
| Age Bracket | In Labor Force | Unemployed |
| 16 to 19 Years | 3 (33.3%) | 0 (0.0%) |
| 20 to 24 Years | 0 (0.0%) | 0 (0.0%) |
| 25 to 29 Years | 0 (0.0%) | 0 (0.0%) |
| 30 to 34 Years | 0 (0.0%) | 0 (0.0%) |
| 35 to 44 Years | 3 (37.5%) | 0 (0.0%) |
| 45 to 54 Years | 3 (18.8%) | 0 (0.0%) |
| 55 to 59 Years | 4 (100.0%) | 0 (0.0%) |
| 60 to 64 Years | 2 (20.0%) | 0 (0.0%) |
| 65 to 74 Years | 4 (15.4%) | 0 (0.0%) |
| 75 Years and over | 0 (0.0%) | 0 (0.0%) |
| Total | 19 (22.1%) | 0 (0.0%) |
Employment Status by Educational Attainment in Du Pont

| Educational Attainment | In Labor Force | Unemployed |
| Less than High School | 6 (100.0%) | 0 (0.0%) |
| High School Diploma | 4 (16.7%) | 0 (0.0%) |
| College / Associate Degree | 2 (14.3%) | 0 (0.0%) |
| Bachelor's Degree or higher | 0 (0.0%) | 0 (0.0%) |
| Total | 12 (26.1%) | 0 (0.0%) |
Employment Occupations by Sex in Du Pont
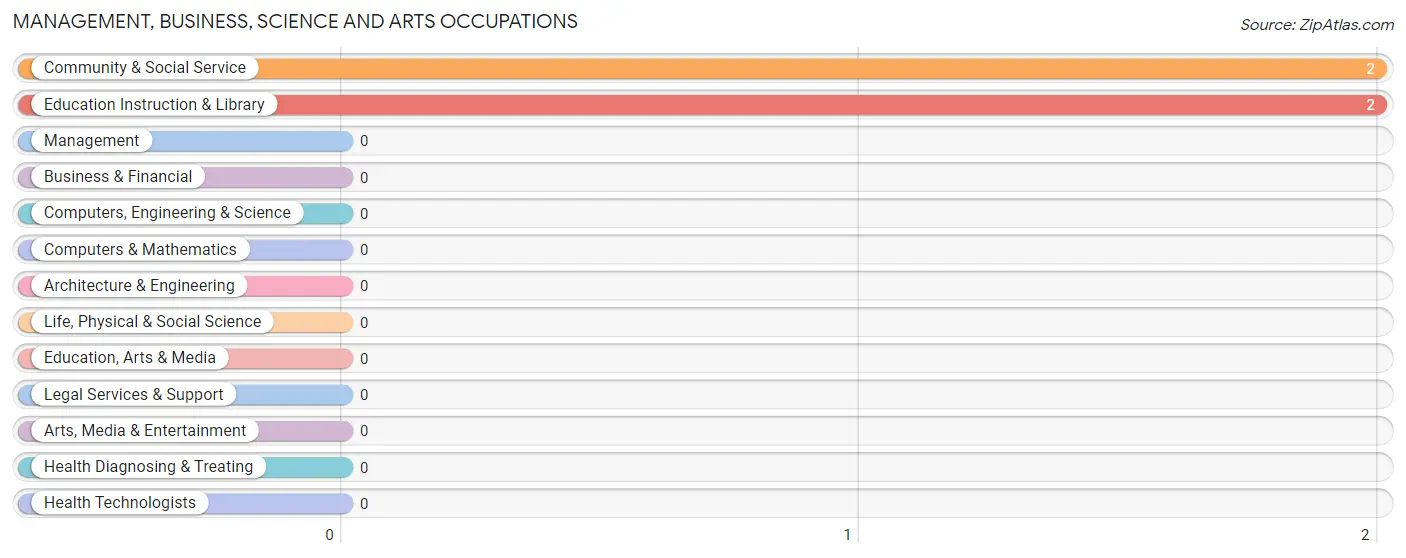
Management, Business, Science and Arts Occupations
The most common Management, Business, Science and Arts occupations in Du Pont are Community & Social Service (2 | 10.5%), and Education Instruction & Library (2 | 10.5%).
Management, Business, Science and Arts Occupations by Sex
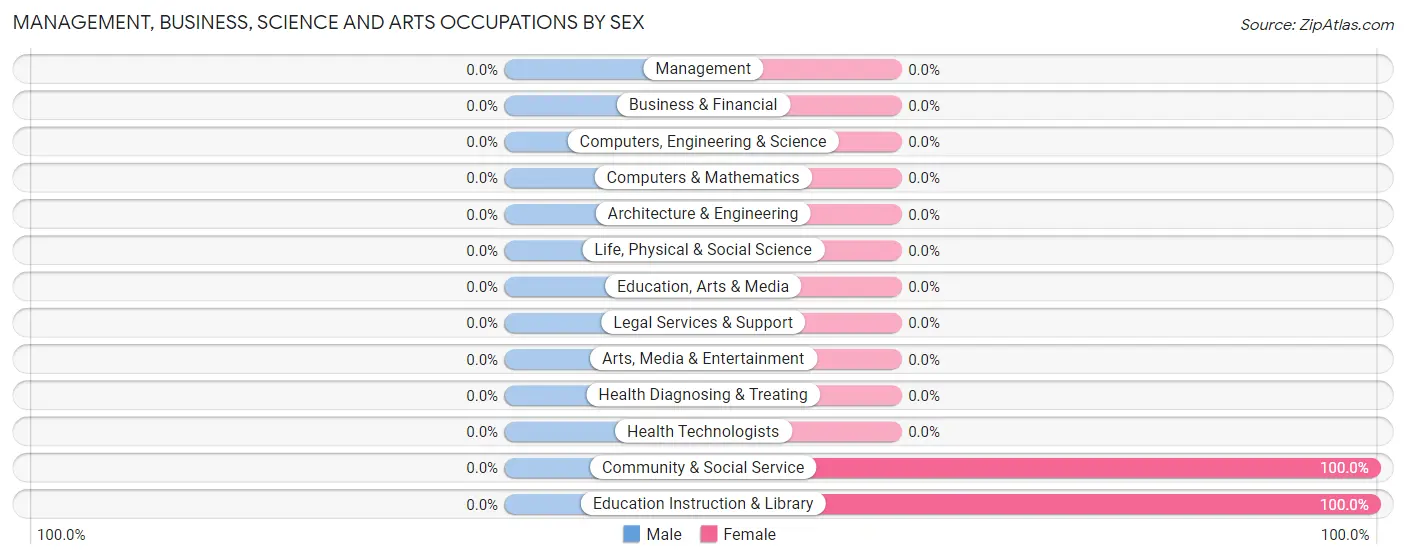
| Occupation | Male | Female |
| Management | 0 (0.0%) | 0 (0.0%) |
| Business & Financial | 0 (0.0%) | 0 (0.0%) |
| Computers, Engineering & Science | 0 (0.0%) | 0 (0.0%) |
| Computers & Mathematics | 0 (0.0%) | 0 (0.0%) |
| Architecture & Engineering | 0 (0.0%) | 0 (0.0%) |
| Life, Physical & Social Science | 0 (0.0%) | 0 (0.0%) |
| Community & Social Service | 0 (0.0%) | 2 (100.0%) |
| Education, Arts & Media | 0 (0.0%) | 0 (0.0%) |
| Legal Services & Support | 0 (0.0%) | 0 (0.0%) |
| Education Instruction & Library | 0 (0.0%) | 2 (100.0%) |
| Arts, Media & Entertainment | 0 (0.0%) | 0 (0.0%) |
| Health Diagnosing & Treating | 0 (0.0%) | 0 (0.0%) |
| Health Technologists | 0 (0.0%) | 0 (0.0%) |
| Total (Category) | 0 (0.0%) | 2 (100.0%) |
| Total (Overall) | 10 (52.6%) | 9 (47.4%) |
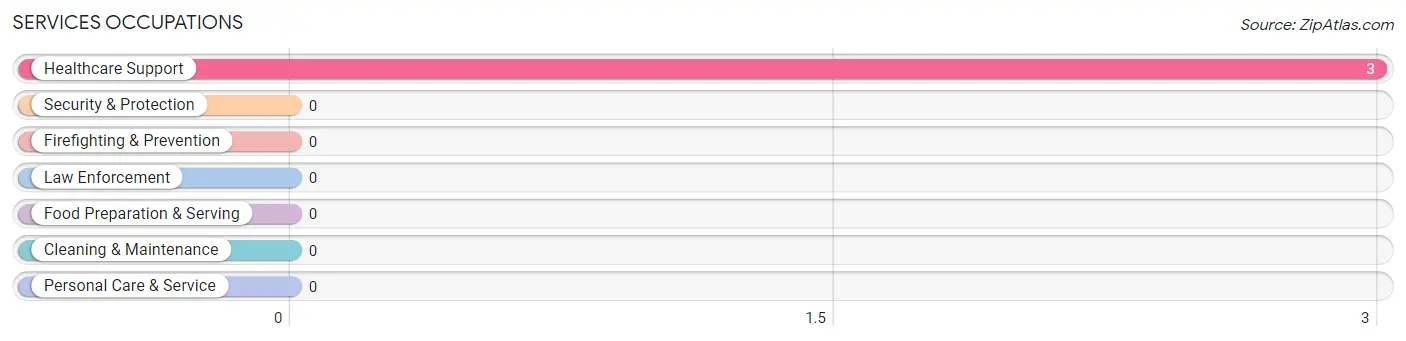
Services Occupations
The most common Services occupations in Du Pont are , and Healthcare Support (3 | 15.8%).
Services Occupations by Sex
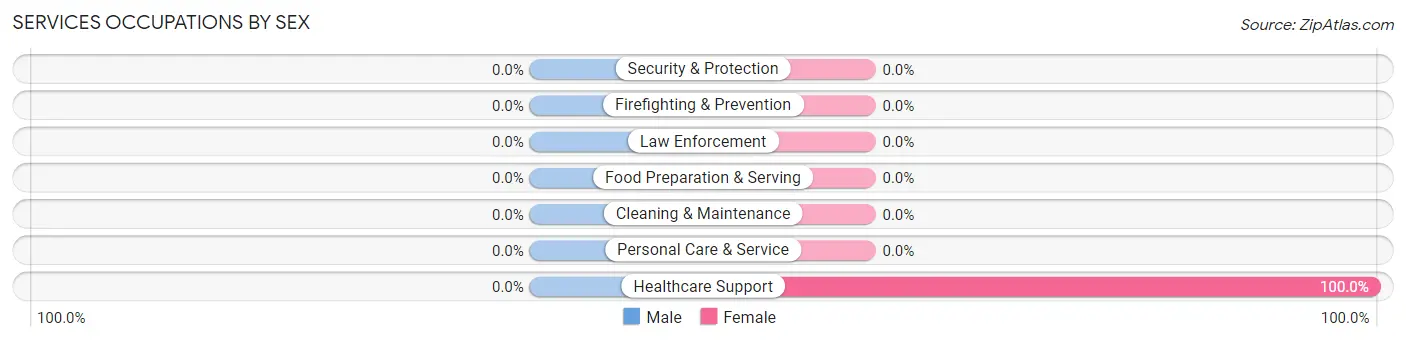
| Occupation | Male | Female |
| Healthcare Support | 0 (0.0%) | 3 (100.0%) |
| Security & Protection | 0 (0.0%) | 0 (0.0%) |
| Firefighting & Prevention | 0 (0.0%) | 0 (0.0%) |
| Law Enforcement | 0 (0.0%) | 0 (0.0%) |
| Food Preparation & Serving | 0 (0.0%) | 0 (0.0%) |
| Cleaning & Maintenance | 0 (0.0%) | 0 (0.0%) |
| Personal Care & Service | 0 (0.0%) | 0 (0.0%) |
| Total (Category) | 0 (0.0%) | 3 (100.0%) |
| Total (Overall) | 10 (52.6%) | 9 (47.4%) |
Sales and Office Occupations
The most common Sales and Office occupations in Du Pont are , and Office & Administration (6 | 31.6%).

Sales and Office Occupations by Sex

| Occupation | Male | Female |
| Sales & Related | 0 (0.0%) | 0 (0.0%) |
| Office & Administration | 4 (66.7%) | 2 (33.3%) |
| Total (Category) | 4 (66.7%) | 2 (33.3%) |
| Total (Overall) | 10 (52.6%) | 9 (47.4%) |
Natural Resources, Construction and Maintenance Occupations
The most common Natural Resources, Construction and Maintenance occupations in Du Pont are Installation, Maintenance & Repair (3 | 15.8%), and Construction & Extraction (2 | 10.5%).

Natural Resources, Construction and Maintenance Occupations by Sex

| Occupation | Male | Female |
| Farming, Fishing & Forestry | 0 (0.0%) | 0 (0.0%) |
| Construction & Extraction | 0 (0.0%) | 2 (100.0%) |
| Installation, Maintenance & Repair | 3 (100.0%) | 0 (0.0%) |
| Total (Category) | 3 (60.0%) | 2 (40.0%) |
| Total (Overall) | 10 (52.6%) | 9 (47.4%) |
Production, Transportation and Moving Occupations
The most common Production, Transportation and Moving occupations in Du Pont are , and Material Moving (3 | 15.8%).
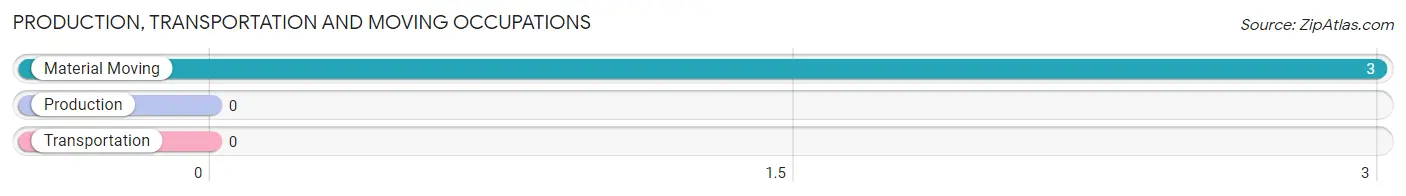
Production, Transportation and Moving Occupations by Sex

| Occupation | Male | Female |
| Production | 0 (0.0%) | 0 (0.0%) |
| Transportation | 0 (0.0%) | 0 (0.0%) |
| Material Moving | 3 (100.0%) | 0 (0.0%) |
| Total (Category) | 3 (100.0%) | 0 (0.0%) |
| Total (Overall) | 10 (52.6%) | 9 (47.4%) |
Employment Industries by Sex in Du Pont
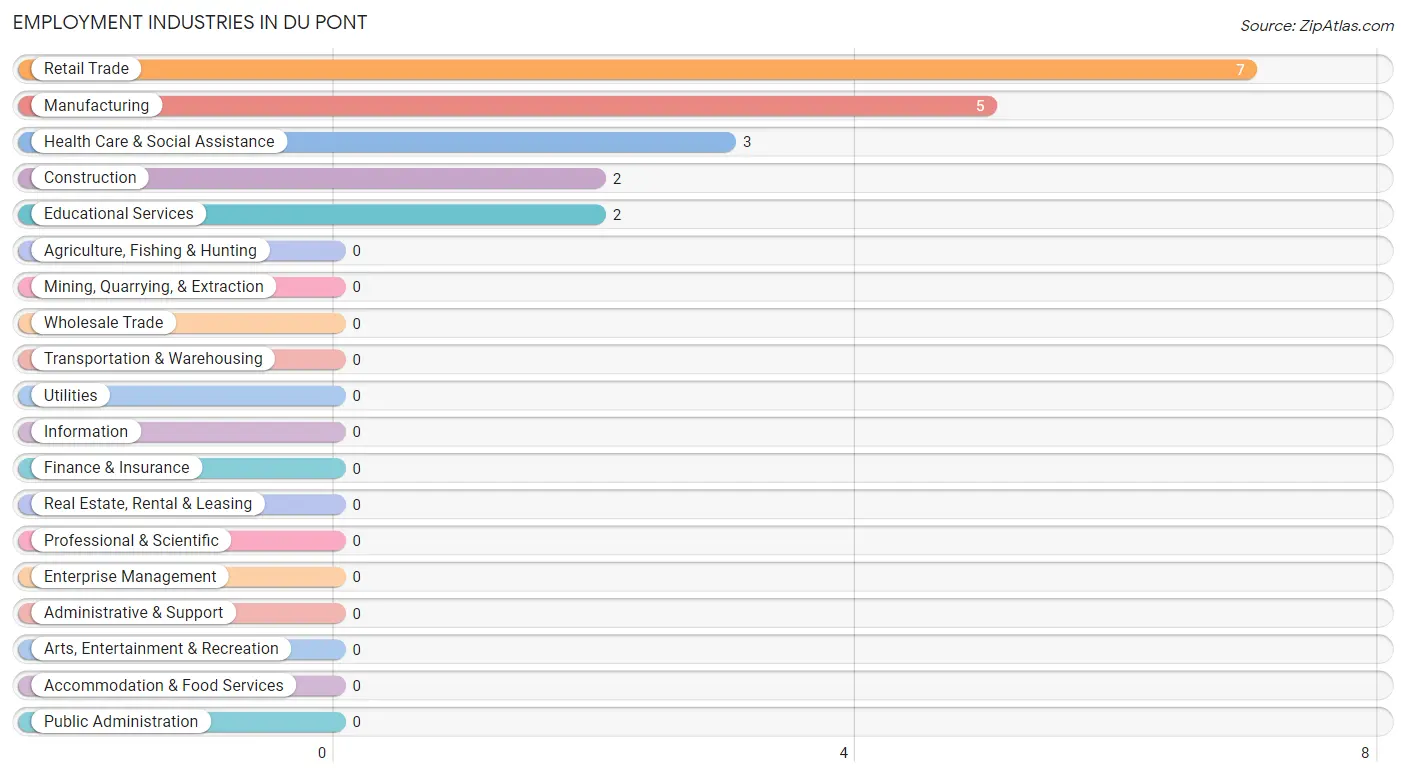
Employment Industries in Du Pont
The major employment industries in Du Pont include Retail Trade (7 | 36.8%), Manufacturing (5 | 26.3%), Health Care & Social Assistance (3 | 15.8%), Construction (2 | 10.5%), and Educational Services (2 | 10.5%).
Employment Industries by Sex in Du Pont
The Du Pont industries that see more men than women are Retail Trade (100.0%), and Manufacturing (60.0%), whereas the industries that tend to have a higher number of women are Construction (100.0%), Educational Services (100.0%), and Health Care & Social Assistance (100.0%).
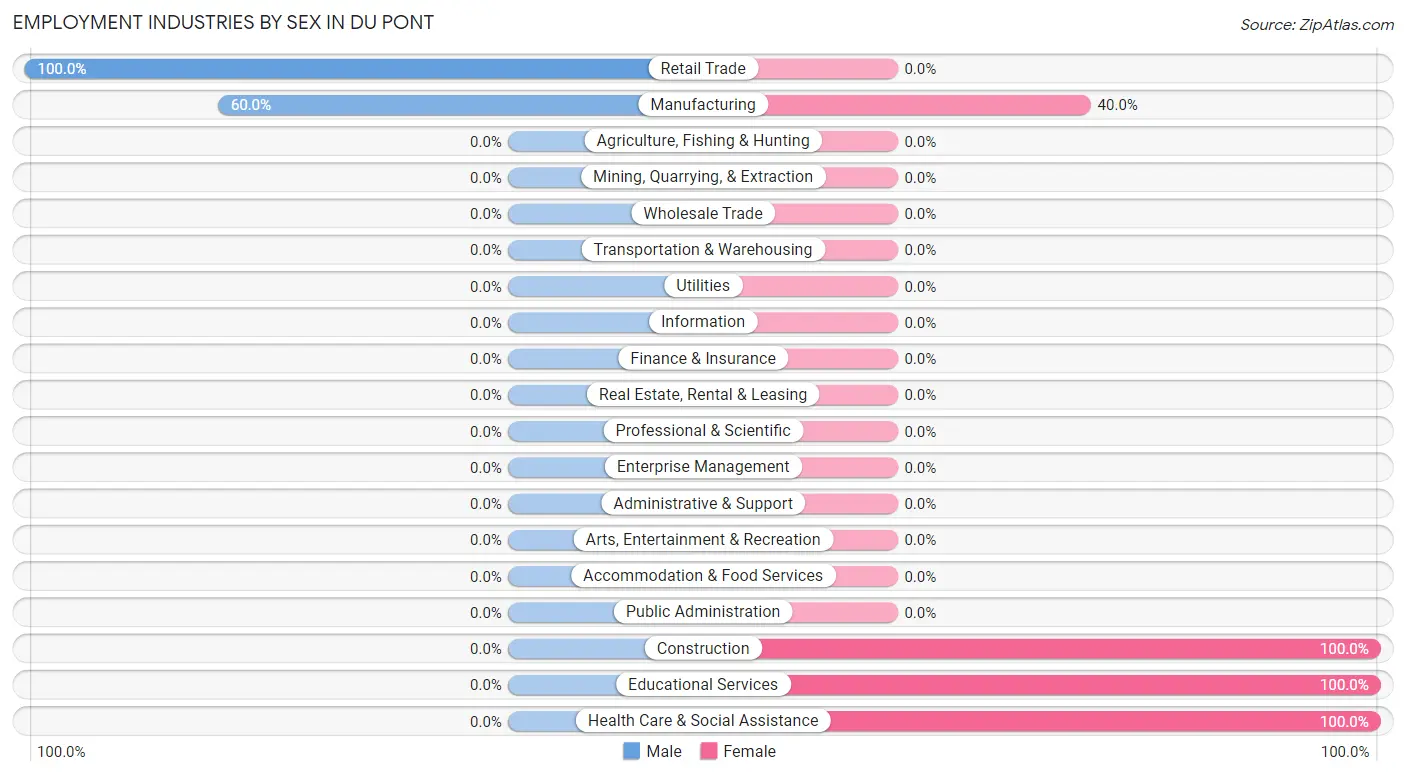
| Industry | Male | Female |
| Agriculture, Fishing & Hunting | 0 (0.0%) | 0 (0.0%) |
| Mining, Quarrying, & Extraction | 0 (0.0%) | 0 (0.0%) |
| Construction | 0 (0.0%) | 2 (100.0%) |
| Manufacturing | 3 (60.0%) | 2 (40.0%) |
| Wholesale Trade | 0 (0.0%) | 0 (0.0%) |
| Retail Trade | 7 (100.0%) | 0 (0.0%) |
| Transportation & Warehousing | 0 (0.0%) | 0 (0.0%) |
| Utilities | 0 (0.0%) | 0 (0.0%) |
| Information | 0 (0.0%) | 0 (0.0%) |
| Finance & Insurance | 0 (0.0%) | 0 (0.0%) |
| Real Estate, Rental & Leasing | 0 (0.0%) | 0 (0.0%) |
| Professional & Scientific | 0 (0.0%) | 0 (0.0%) |
| Enterprise Management | 0 (0.0%) | 0 (0.0%) |
| Administrative & Support | 0 (0.0%) | 0 (0.0%) |
| Educational Services | 0 (0.0%) | 2 (100.0%) |
| Health Care & Social Assistance | 0 (0.0%) | 3 (100.0%) |
| Arts, Entertainment & Recreation | 0 (0.0%) | 0 (0.0%) |
| Accommodation & Food Services | 0 (0.0%) | 0 (0.0%) |
| Public Administration | 0 (0.0%) | 0 (0.0%) |
| Total | 10 (52.6%) | 9 (47.4%) |
Education in Du Pont
School Enrollment in Du Pont
The most common levels of schooling among the 53 students in Du Pont are elementary school (22 | 41.5%), middle school (8 | 15.1%), and nursery / preschool (7 | 13.2%).
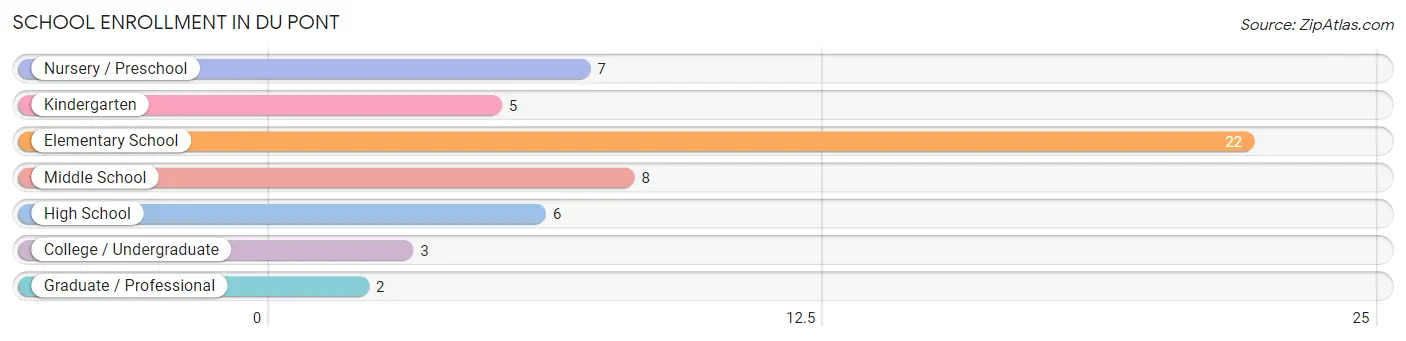
| School Level | # Students | % Students |
| Nursery / Preschool | 7 | 13.2% |
| Kindergarten | 5 | 9.4% |
| Elementary School | 22 | 41.5% |
| Middle School | 8 | 15.1% |
| High School | 6 | 11.3% |
| College / Undergraduate | 3 | 5.7% |
| Graduate / Professional | 2 | 3.8% |
| Total | 53 | 100.0% |
School Enrollment by Age by Funding Source in Du Pont
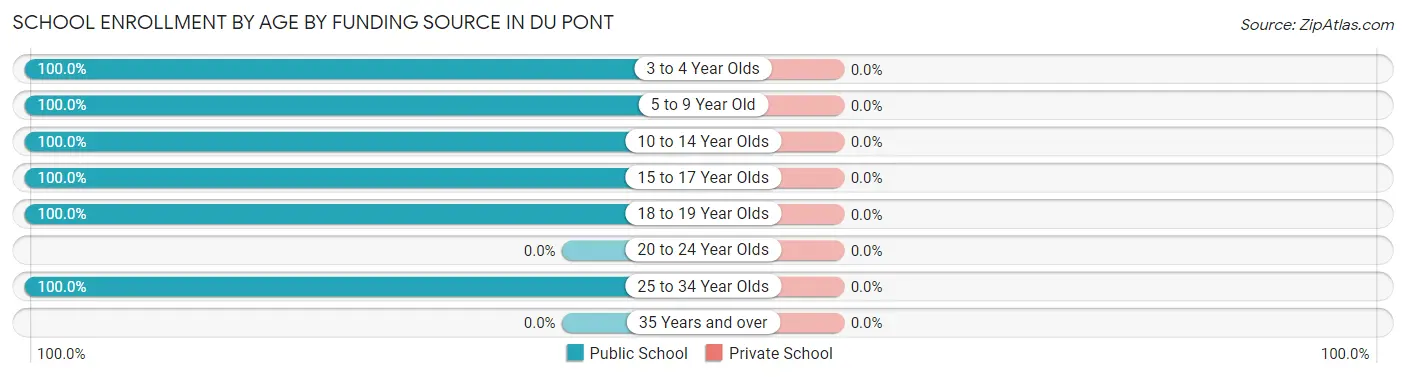
| Age Bracket | Public School | Private School |
| 3 to 4 Year Olds | 7 (100.0%) | 0 (0.0%) |
| 5 to 9 Year Old | 22 (100.0%) | 0 (0.0%) |
| 10 to 14 Year Olds | 13 (100.0%) | 0 (0.0%) |
| 15 to 17 Year Olds | 6 (100.0%) | 0 (0.0%) |
| 18 to 19 Year Olds | 3 (100.0%) | 0 (0.0%) |
| 20 to 24 Year Olds | 0 (0.0%) | 0 (0.0%) |
| 25 to 34 Year Olds | 2 (100.0%) | 0 (0.0%) |
| 35 Years and over | 0 (0.0%) | 0 (0.0%) |
| Total | 53 (100.0%) | 0 (0.0%) |
Educational Attainment by Field of Study in Du Pont
Education (4 | 40.0%), liberal arts & history (4 | 40.0%), and business (2 | 20.0%) are the most common fields of study among 10 individuals in Du Pont who have obtained a bachelor's degree or higher.
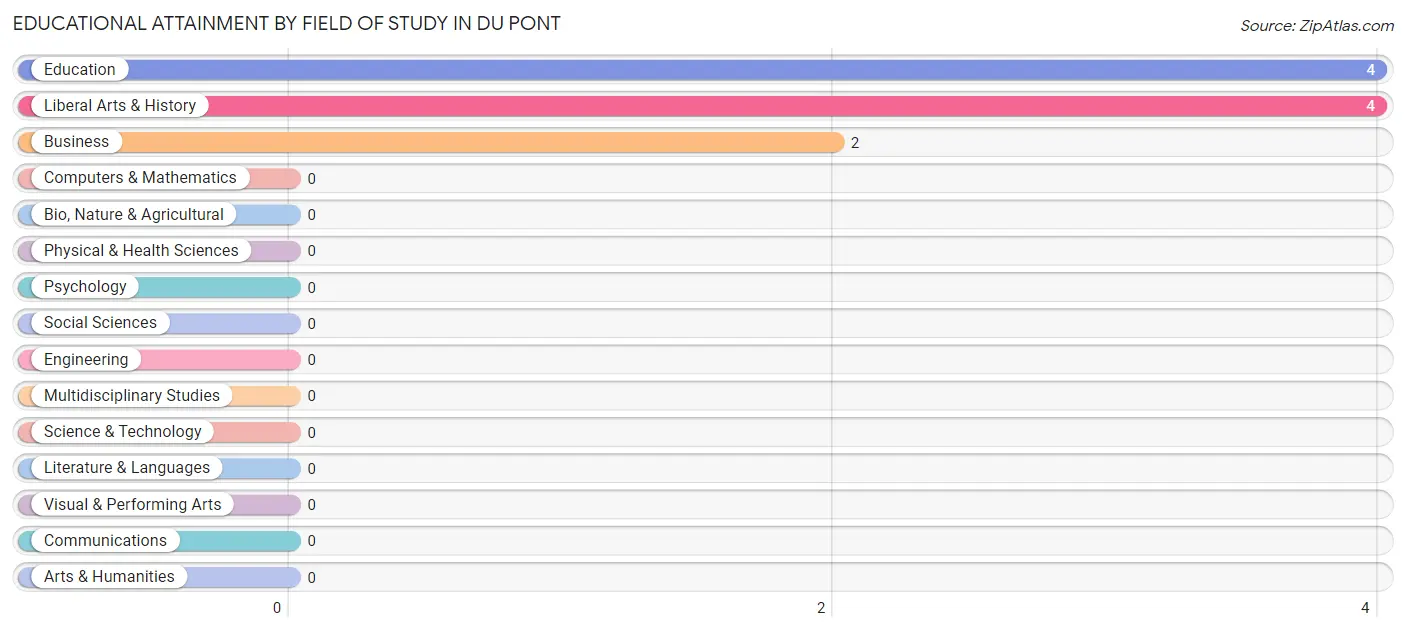
| Field of Study | # Graduates | % Graduates |
| Computers & Mathematics | 0 | 0.0% |
| Bio, Nature & Agricultural | 0 | 0.0% |
| Physical & Health Sciences | 0 | 0.0% |
| Psychology | 0 | 0.0% |
| Social Sciences | 0 | 0.0% |
| Engineering | 0 | 0.0% |
| Multidisciplinary Studies | 0 | 0.0% |
| Science & Technology | 0 | 0.0% |
| Business | 2 | 20.0% |
| Education | 4 | 40.0% |
| Literature & Languages | 0 | 0.0% |
| Liberal Arts & History | 4 | 40.0% |
| Visual & Performing Arts | 0 | 0.0% |
| Communications | 0 | 0.0% |
| Arts & Humanities | 0 | 0.0% |
| Total | 10 | 100.0% |
Transportation & Commute in Du Pont
Vehicle Availability by Sex in Du Pont
The most prevalent vehicle ownership categories in Du Pont are males with 3 vehicles (4, accounting for 40.0%) and females with 3 vehicles (2, making up 66.7%).
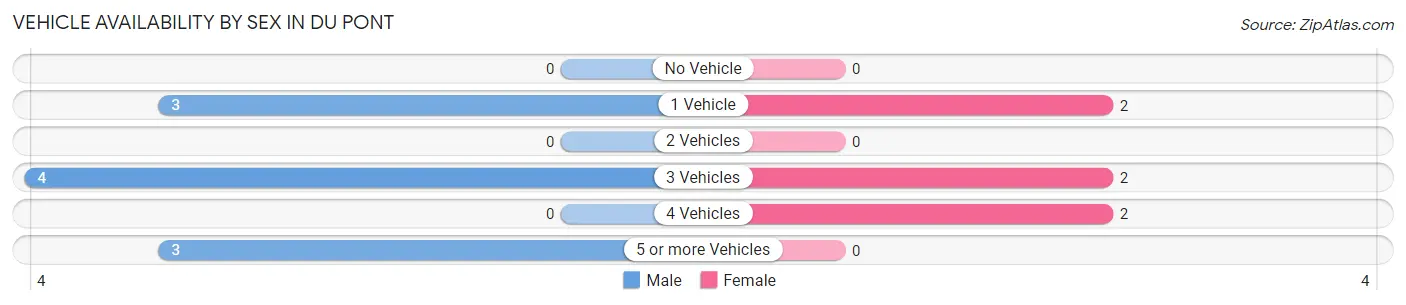
| Vehicles Available | Male | Female |
| No Vehicle | 0 (0.0%) | 0 (0.0%) |
| 1 Vehicle | 3 (30.0%) | 2 (33.3%) |
| 2 Vehicles | 0 (0.0%) | 0 (0.0%) |
| 3 Vehicles | 4 (40.0%) | 2 (33.3%) |
| 4 Vehicles | 0 (0.0%) | 2 (33.3%) |
| 5 or more Vehicles | 3 (30.0%) | 0 (0.0%) |
| Total | 10 (100.0%) | 6 (100.0%) |
Commute Time in Du Pont
The most frequently occuring commute durations in Du Pont are 10 to 14 minutes (5 commuters, 31.2%), 45 to 59 minutes (4 commuters, 25.0%), and less than 5 minutes (3 commuters, 18.8%).
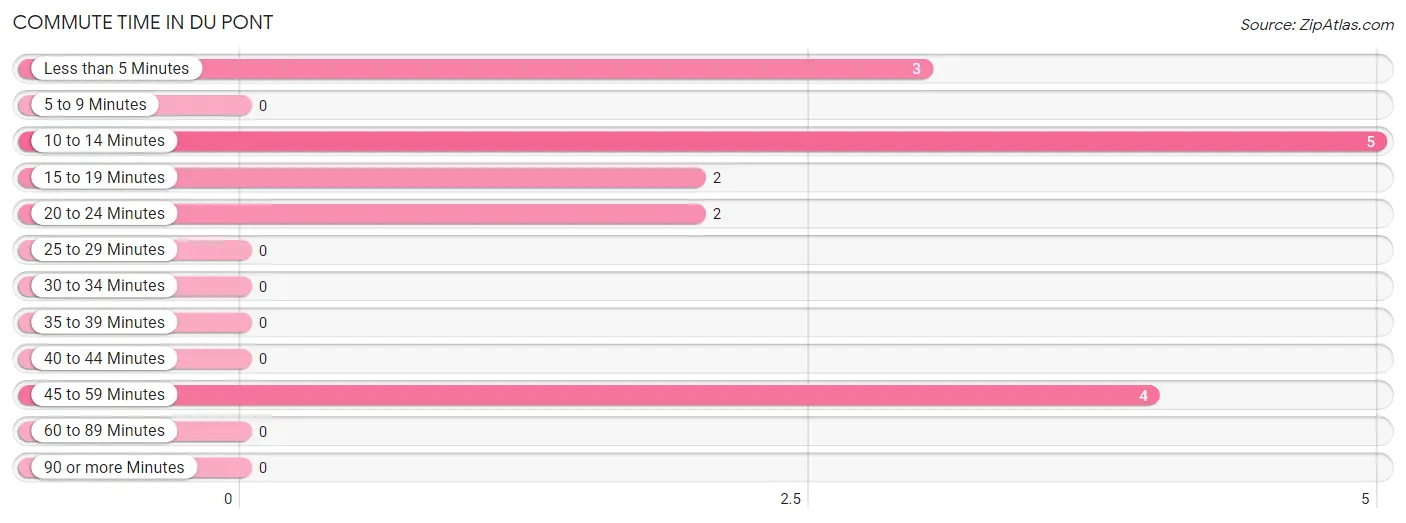
| Commute Time | # Commuters | % Commuters |
| Less than 5 Minutes | 3 | 18.8% |
| 5 to 9 Minutes | 0 | 0.0% |
| 10 to 14 Minutes | 5 | 31.2% |
| 15 to 19 Minutes | 2 | 12.5% |
| 20 to 24 Minutes | 2 | 12.5% |
| 25 to 29 Minutes | 0 | 0.0% |
| 30 to 34 Minutes | 0 | 0.0% |
| 35 to 39 Minutes | 0 | 0.0% |
| 40 to 44 Minutes | 0 | 0.0% |
| 45 to 59 Minutes | 4 | 25.0% |
| 60 to 89 Minutes | 0 | 0.0% |
| 90 or more Minutes | 0 | 0.0% |
Commute Time by Sex in Du Pont
The most common commute times in Du Pont are 45 to 59 minutes (4 commuters, 40.0%) for males and 10 to 14 minutes (2 commuters, 33.3%) for females.
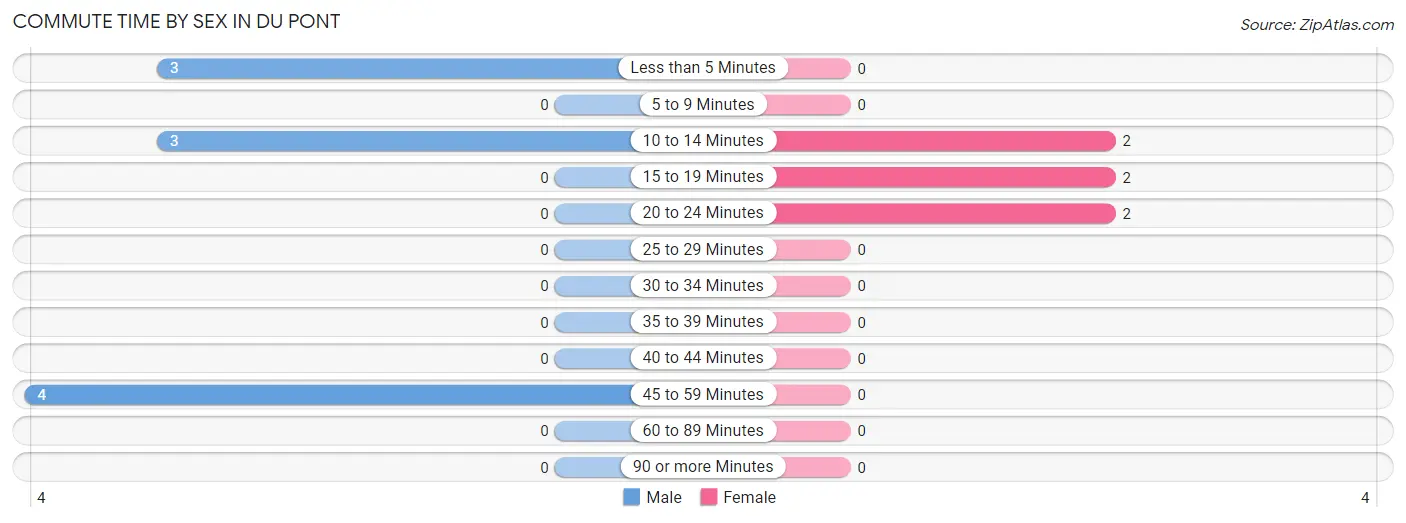
| Commute Time | Male | Female |
| Less than 5 Minutes | 3 (30.0%) | 0 (0.0%) |
| 5 to 9 Minutes | 0 (0.0%) | 0 (0.0%) |
| 10 to 14 Minutes | 3 (30.0%) | 2 (33.3%) |
| 15 to 19 Minutes | 0 (0.0%) | 2 (33.3%) |
| 20 to 24 Minutes | 0 (0.0%) | 2 (33.3%) |
| 25 to 29 Minutes | 0 (0.0%) | 0 (0.0%) |
| 30 to 34 Minutes | 0 (0.0%) | 0 (0.0%) |
| 35 to 39 Minutes | 0 (0.0%) | 0 (0.0%) |
| 40 to 44 Minutes | 0 (0.0%) | 0 (0.0%) |
| 45 to 59 Minutes | 4 (40.0%) | 0 (0.0%) |
| 60 to 89 Minutes | 0 (0.0%) | 0 (0.0%) |
| 90 or more Minutes | 0 (0.0%) | 0 (0.0%) |
Time of Departure to Work by Sex in Du Pont
The most frequent times of departure to work in Du Pont are 12:00 PM to 3:59 PM (4, 40.0%) for males and 7:30 AM to 7:59 AM (4, 66.7%) for females.
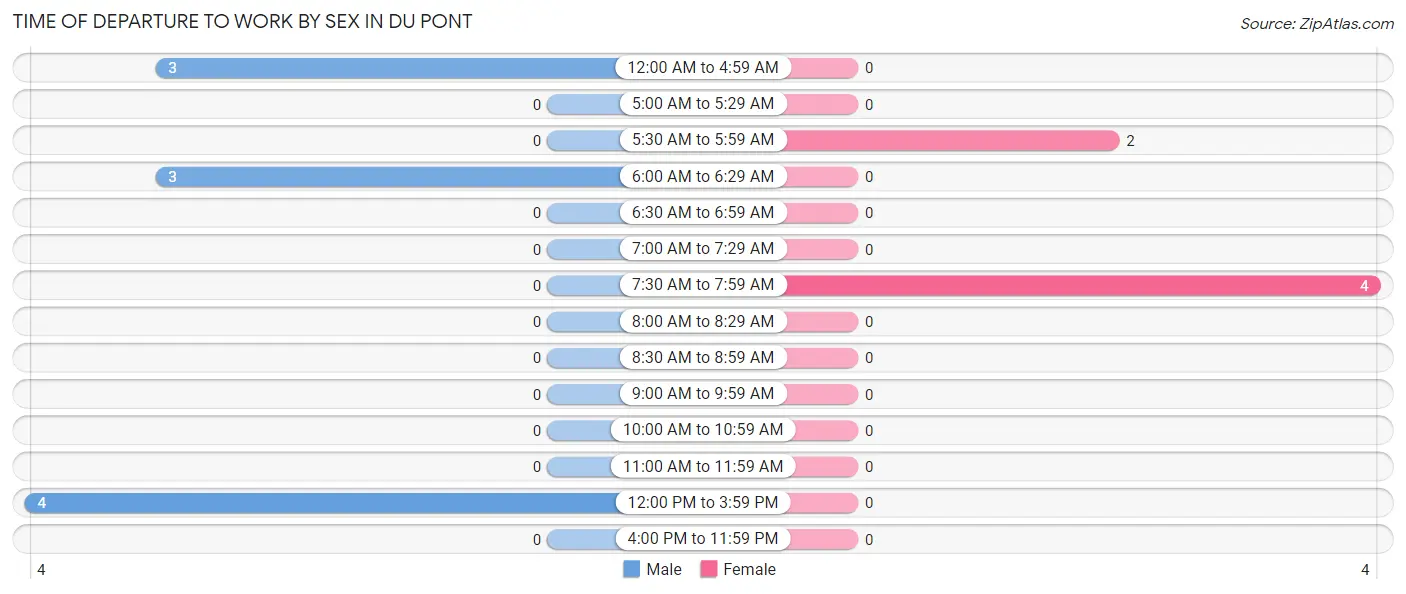
| Time of Departure | Male | Female |
| 12:00 AM to 4:59 AM | 3 (30.0%) | 0 (0.0%) |
| 5:00 AM to 5:29 AM | 0 (0.0%) | 0 (0.0%) |
| 5:30 AM to 5:59 AM | 0 (0.0%) | 2 (33.3%) |
| 6:00 AM to 6:29 AM | 3 (30.0%) | 0 (0.0%) |
| 6:30 AM to 6:59 AM | 0 (0.0%) | 0 (0.0%) |
| 7:00 AM to 7:29 AM | 0 (0.0%) | 0 (0.0%) |
| 7:30 AM to 7:59 AM | 0 (0.0%) | 4 (66.7%) |
| 8:00 AM to 8:29 AM | 0 (0.0%) | 0 (0.0%) |
| 8:30 AM to 8:59 AM | 0 (0.0%) | 0 (0.0%) |
| 9:00 AM to 9:59 AM | 0 (0.0%) | 0 (0.0%) |
| 10:00 AM to 10:59 AM | 0 (0.0%) | 0 (0.0%) |
| 11:00 AM to 11:59 AM | 0 (0.0%) | 0 (0.0%) |
| 12:00 PM to 3:59 PM | 4 (40.0%) | 0 (0.0%) |
| 4:00 PM to 11:59 PM | 0 (0.0%) | 0 (0.0%) |
| Total | 10 (100.0%) | 6 (100.0%) |
Housing Occupancy in Du Pont
Occupancy by Ownership in Du Pont
Of the total 45 dwellings in Du Pont, owner-occupied units account for 37 (82.2%), while renter-occupied units make up 8 (17.8%).
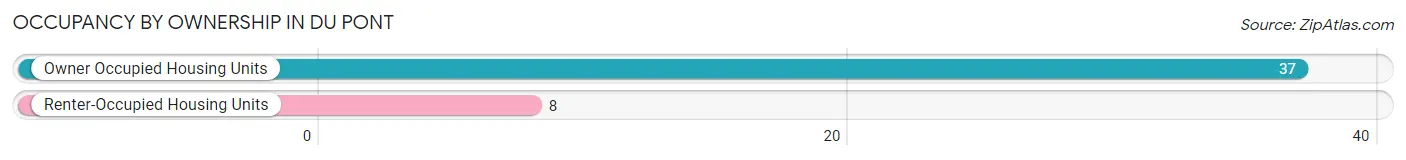
| Occupancy | # Housing Units | % Housing Units |
| Owner Occupied Housing Units | 37 | 82.2% |
| Renter-Occupied Housing Units | 8 | 17.8% |
| Total Occupied Housing Units | 45 | 100.0% |
Occupancy by Household Size in Du Pont
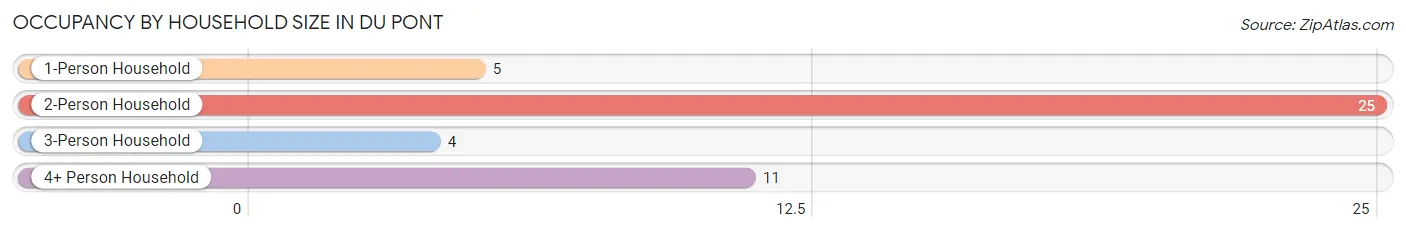
| Household Size | # Housing Units | % Housing Units |
| 1-Person Household | 5 | 11.1% |
| 2-Person Household | 25 | 55.6% |
| 3-Person Household | 4 | 8.9% |
| 4+ Person Household | 11 | 24.4% |
| Total Housing Units | 45 | 100.0% |
Occupancy by Ownership by Household Size in Du Pont
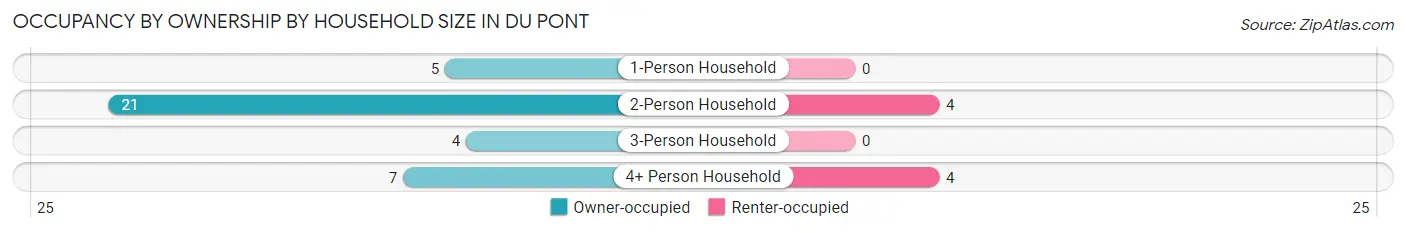
| Household Size | Owner-occupied | Renter-occupied |
| 1-Person Household | 5 (100.0%) | 0 (0.0%) |
| 2-Person Household | 21 (84.0%) | 4 (16.0%) |
| 3-Person Household | 4 (100.0%) | 0 (0.0%) |
| 4+ Person Household | 7 (63.6%) | 4 (36.4%) |
| Total Housing Units | 37 (82.2%) | 8 (17.8%) |
Occupancy by Educational Attainment in Du Pont

| Household Size | Owner-occupied | Renter-occupied |
| Less than High School | 3 (100.0%) | 0 (0.0%) |
| High School Diploma | 10 (71.4%) | 4 (28.6%) |
| College/Associate Degree | 14 (77.8%) | 4 (22.2%) |
| Bachelor's Degree or higher | 10 (100.0%) | 0 (0.0%) |
Occupancy by Age of Householder in Du Pont
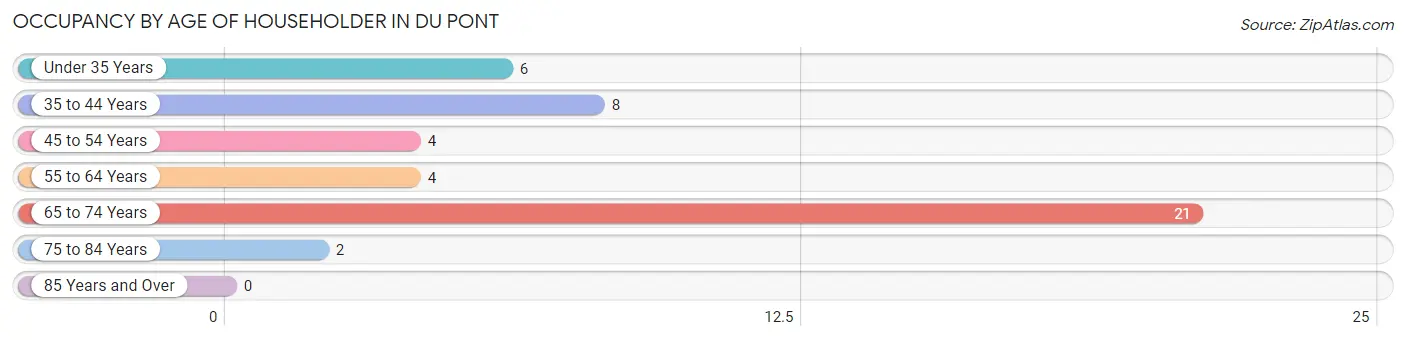
| Age Bracket | # Households | % Households |
| Under 35 Years | 6 | 13.3% |
| 35 to 44 Years | 8 | 17.8% |
| 45 to 54 Years | 4 | 8.9% |
| 55 to 64 Years | 4 | 8.9% |
| 65 to 74 Years | 21 | 46.7% |
| 75 to 84 Years | 2 | 4.4% |
| 85 Years and Over | 0 | 0.0% |
| Total | 45 | 100.0% |
Housing Finances in Du Pont
Median Income by Occupancy in Du Pont
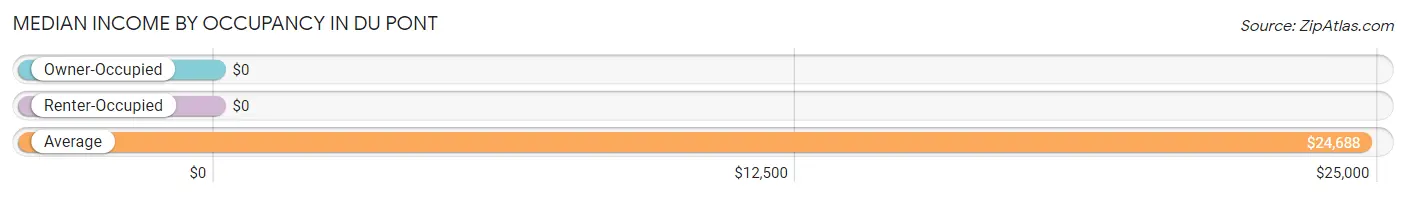
| Occupancy Type | # Households | Median Income |
| Owner-Occupied | 37 (82.2%) | $0 |
| Renter-Occupied | 8 (17.8%) | $0 |
| Average | 45 (100.0%) | $24,688 |
Occupancy by Householder Income Bracket in Du Pont
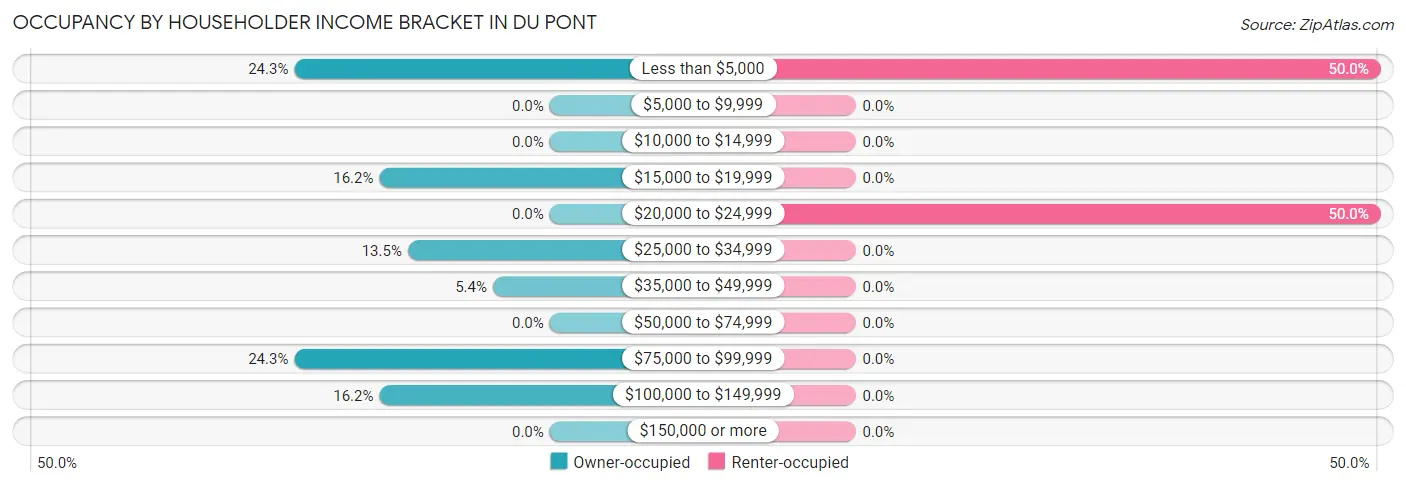
| Income Bracket | Owner-occupied | Renter-occupied |
| Less than $5,000 | 9 (24.3%) | 4 (50.0%) |
| $5,000 to $9,999 | 0 (0.0%) | 0 (0.0%) |
| $10,000 to $14,999 | 0 (0.0%) | 0 (0.0%) |
| $15,000 to $19,999 | 6 (16.2%) | 0 (0.0%) |
| $20,000 to $24,999 | 0 (0.0%) | 4 (50.0%) |
| $25,000 to $34,999 | 5 (13.5%) | 0 (0.0%) |
| $35,000 to $49,999 | 2 (5.4%) | 0 (0.0%) |
| $50,000 to $74,999 | 0 (0.0%) | 0 (0.0%) |
| $75,000 to $99,999 | 9 (24.3%) | 0 (0.0%) |
| $100,000 to $149,999 | 6 (16.2%) | 0 (0.0%) |
| $150,000 or more | 0 (0.0%) | 0 (0.0%) |
| Total | 37 (100.0%) | 8 (100.0%) |
Monthly Housing Cost Tiers in Du Pont
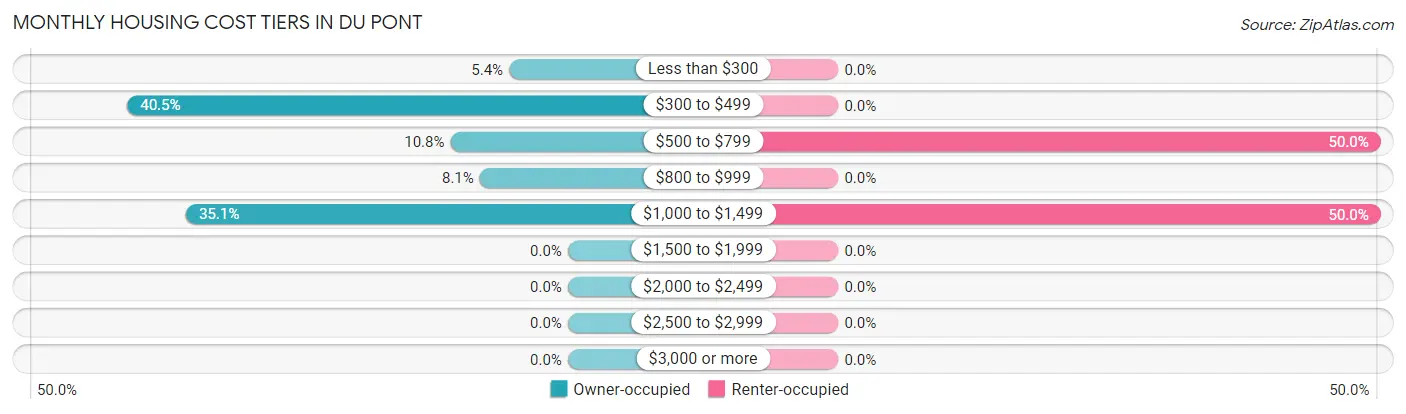
| Monthly Cost | Owner-occupied | Renter-occupied |
| Less than $300 | 2 (5.4%) | 0 (0.0%) |
| $300 to $499 | 15 (40.5%) | 0 (0.0%) |
| $500 to $799 | 4 (10.8%) | 4 (50.0%) |
| $800 to $999 | 3 (8.1%) | 0 (0.0%) |
| $1,000 to $1,499 | 13 (35.1%) | 4 (50.0%) |
| $1,500 to $1,999 | 0 (0.0%) | 0 (0.0%) |
| $2,000 to $2,499 | 0 (0.0%) | 0 (0.0%) |
| $2,500 to $2,999 | 0 (0.0%) | 0 (0.0%) |
| $3,000 or more | 0 (0.0%) | 0 (0.0%) |
| Total | 37 (100.0%) | 8 (100.0%) |
Physical Housing Characteristics in Du Pont
Housing Structures in Du Pont
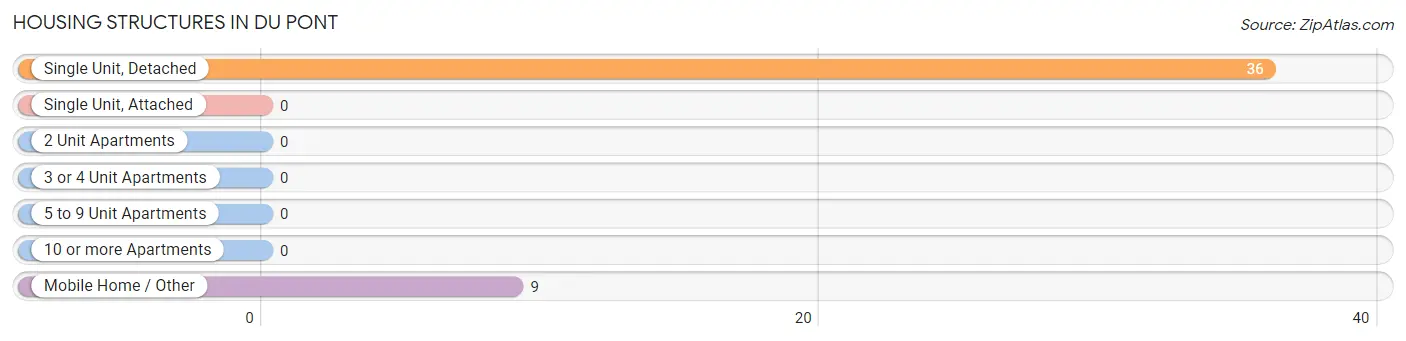
| Structure Type | # Housing Units | % Housing Units |
| Single Unit, Detached | 36 | 80.0% |
| Single Unit, Attached | 0 | 0.0% |
| 2 Unit Apartments | 0 | 0.0% |
| 3 or 4 Unit Apartments | 0 | 0.0% |
| 5 to 9 Unit Apartments | 0 | 0.0% |
| 10 or more Apartments | 0 | 0.0% |
| Mobile Home / Other | 9 | 20.0% |
| Total | 45 | 100.0% |
Housing Structures by Occupancy in Du Pont
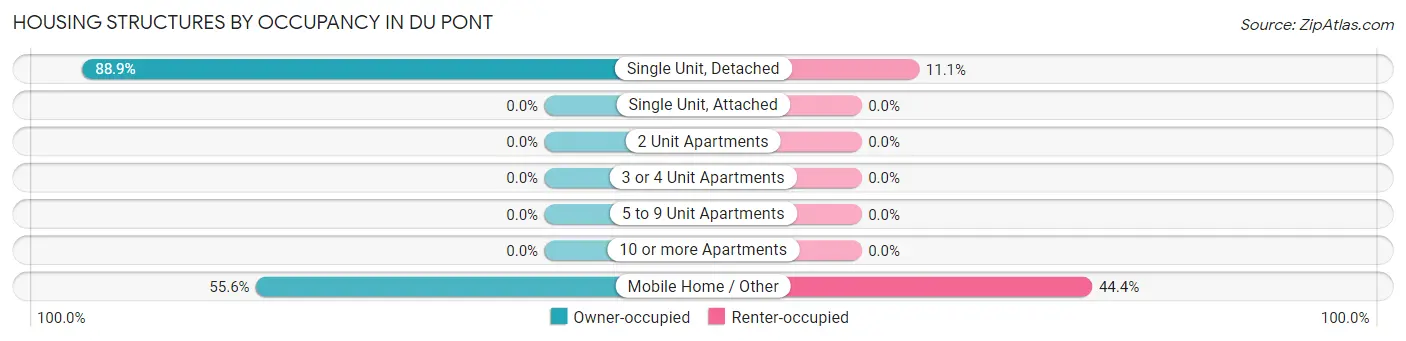
| Structure Type | Owner-occupied | Renter-occupied |
| Single Unit, Detached | 32 (88.9%) | 4 (11.1%) |
| Single Unit, Attached | 0 (0.0%) | 0 (0.0%) |
| 2 Unit Apartments | 0 (0.0%) | 0 (0.0%) |
| 3 or 4 Unit Apartments | 0 (0.0%) | 0 (0.0%) |
| 5 to 9 Unit Apartments | 0 (0.0%) | 0 (0.0%) |
| 10 or more Apartments | 0 (0.0%) | 0 (0.0%) |
| Mobile Home / Other | 5 (55.6%) | 4 (44.4%) |
| Total | 37 (82.2%) | 8 (17.8%) |
Housing Structures by Number of Rooms in Du Pont
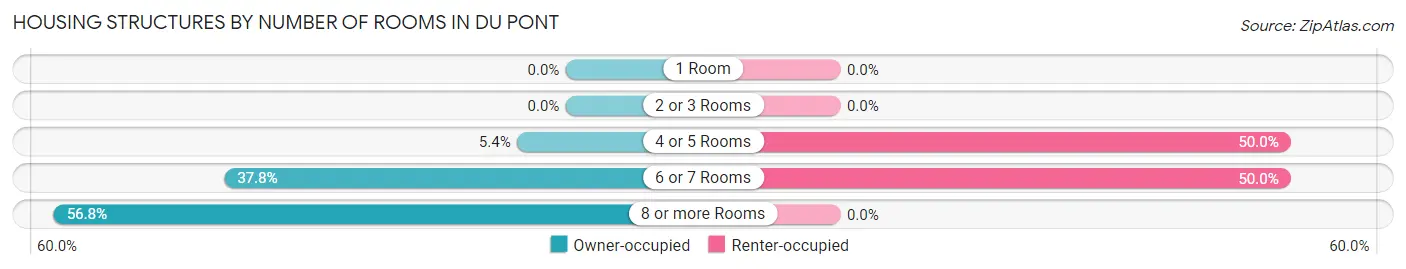
| Number of Rooms | Owner-occupied | Renter-occupied |
| 1 Room | 0 (0.0%) | 0 (0.0%) |
| 2 or 3 Rooms | 0 (0.0%) | 0 (0.0%) |
| 4 or 5 Rooms | 2 (5.4%) | 4 (50.0%) |
| 6 or 7 Rooms | 14 (37.8%) | 4 (50.0%) |
| 8 or more Rooms | 21 (56.8%) | 0 (0.0%) |
| Total | 37 (100.0%) | 8 (100.0%) |
Housing Structure by Heating Type in Du Pont
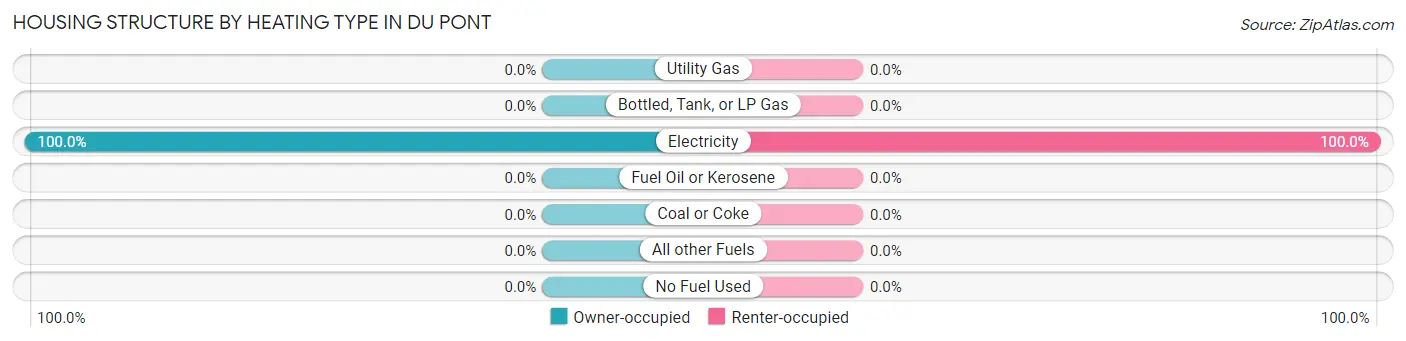
| Heating Type | Owner-occupied | Renter-occupied |
| Utility Gas | 0 (0.0%) | 0 (0.0%) |
| Bottled, Tank, or LP Gas | 0 (0.0%) | 0 (0.0%) |
| Electricity | 37 (100.0%) | 8 (100.0%) |
| Fuel Oil or Kerosene | 0 (0.0%) | 0 (0.0%) |
| Coal or Coke | 0 (0.0%) | 0 (0.0%) |
| All other Fuels | 0 (0.0%) | 0 (0.0%) |
| No Fuel Used | 0 (0.0%) | 0 (0.0%) |
| Total | 37 (100.0%) | 8 (100.0%) |
Household Vehicle Usage in Du Pont

| Vehicles per Household | Owner-occupied | Renter-occupied |
| No Vehicle | 0 (0.0%) | 0 (0.0%) |
| 1 Vehicle | 7 (18.9%) | 8 (100.0%) |
| 2 Vehicles | 8 (21.6%) | 0 (0.0%) |
| 3 or more Vehicles | 22 (59.5%) | 0 (0.0%) |
| Total | 37 (100.0%) | 8 (100.0%) |
Real Estate & Mortgages in Du Pont
Real Estate and Mortgage Overview in Du Pont
| Characteristic | Without Mortgage | With Mortgage |
| Housing Units | 28 | 9 |
| Median Property Value | - | - |
| Median Household Income | - | - |
| Monthly Housing Costs | $440 | $0 |
| Real Estate Taxes | - | - |
Property Value by Mortgage Status in Du Pont
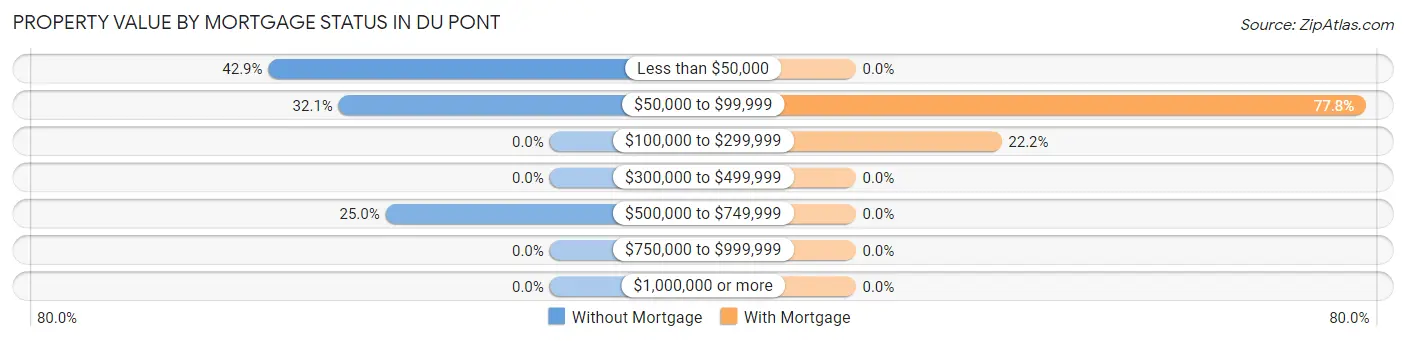
| Property Value | Without Mortgage | With Mortgage |
| Less than $50,000 | 12 (42.9%) | 0 (0.0%) |
| $50,000 to $99,999 | 9 (32.1%) | 7 (77.8%) |
| $100,000 to $299,999 | 0 (0.0%) | 2 (22.2%) |
| $300,000 to $499,999 | 0 (0.0%) | 0 (0.0%) |
| $500,000 to $749,999 | 7 (25.0%) | 0 (0.0%) |
| $750,000 to $999,999 | 0 (0.0%) | 0 (0.0%) |
| $1,000,000 or more | 0 (0.0%) | 0 (0.0%) |
| Total | 28 (100.0%) | 9 (100.0%) |
Household Income by Mortgage Status in Du Pont
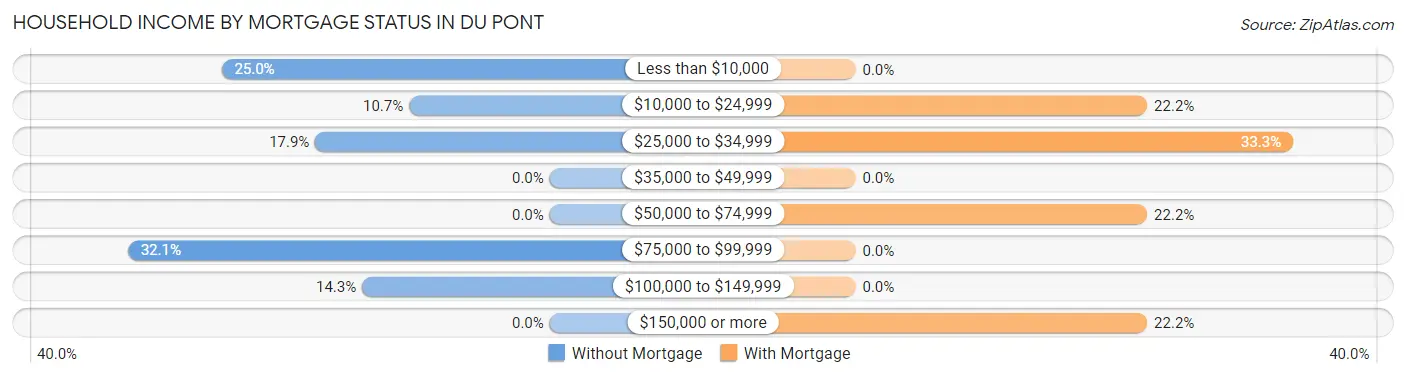
| Household Income | Without Mortgage | With Mortgage |
| Less than $10,000 | 7 (25.0%) | 0 (0.0%) |
| $10,000 to $24,999 | 3 (10.7%) | 2 (22.2%) |
| $25,000 to $34,999 | 5 (17.9%) | 3 (33.3%) |
| $35,000 to $49,999 | 0 (0.0%) | 0 (0.0%) |
| $50,000 to $74,999 | 0 (0.0%) | 2 (22.2%) |
| $75,000 to $99,999 | 9 (32.1%) | 0 (0.0%) |
| $100,000 to $149,999 | 4 (14.3%) | 0 (0.0%) |
| $150,000 or more | 0 (0.0%) | 2 (22.2%) |
| Total | 28 (100.0%) | 9 (100.0%) |
Property Value to Household Income Ratio in Du Pont
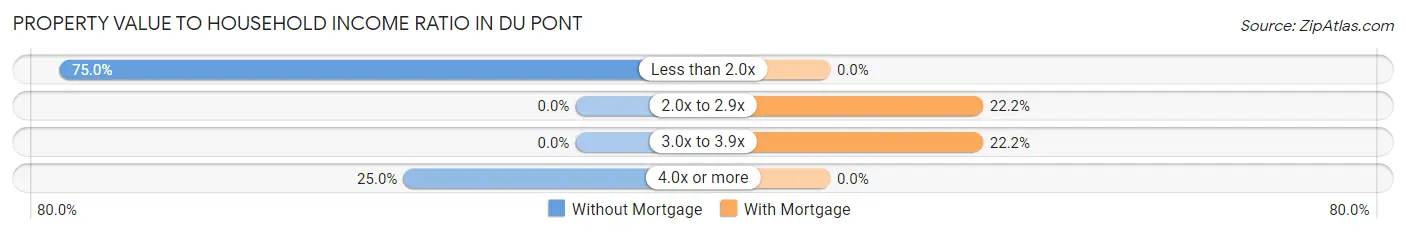
| Value-to-Income Ratio | Without Mortgage | With Mortgage |
| Less than 2.0x | 21 (75.0%) | 0 (0.0%) |
| 2.0x to 2.9x | 0 (0.0%) | 2 (22.2%) |
| 3.0x to 3.9x | 0 (0.0%) | 2 (22.2%) |
| 4.0x or more | 7 (25.0%) | 0 (0.0%) |
| Total | 28 (100.0%) | 9 (100.0%) |
Real Estate Taxes by Mortgage Status in Du Pont

| Property Taxes | Without Mortgage | With Mortgage |
| Less than $800 | 10 (35.7%) | 2 (22.2%) |
| $800 to $1,499 | 8 (28.6%) | 5 (55.6%) |
| $800 to $1,499 | 7 (25.0%) | 4 (44.4%) |
| Total | 28 (100.0%) | 9 (100.0%) |
Health & Disability in Du Pont
Health Insurance Coverage by Age in Du Pont
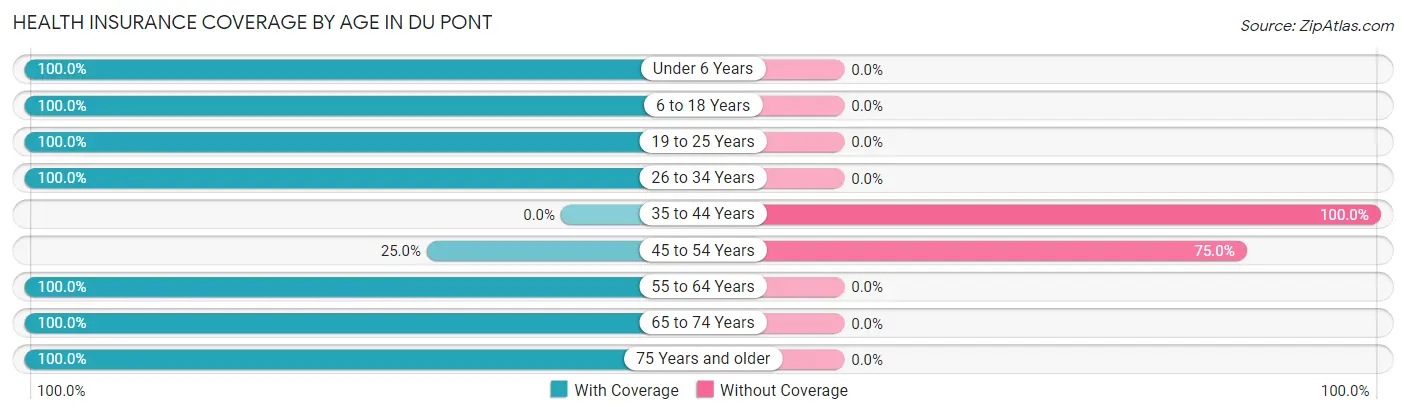
| Age Bracket | With Coverage | Without Coverage |
| Under 6 Years | 21 (100.0%) | 0 (0.0%) |
| 6 to 18 Years | 41 (100.0%) | 0 (0.0%) |
| 19 to 25 Years | 3 (100.0%) | 0 (0.0%) |
| 26 to 34 Years | 8 (100.0%) | 0 (0.0%) |
| 35 to 44 Years | 0 (0.0%) | 8 (100.0%) |
| 45 to 54 Years | 4 (25.0%) | 12 (75.0%) |
| 55 to 64 Years | 14 (100.0%) | 0 (0.0%) |
| 65 to 74 Years | 26 (100.0%) | 0 (0.0%) |
| 75 Years and older | 5 (100.0%) | 0 (0.0%) |
| Total | 122 (85.9%) | 20 (14.1%) |
Health Insurance Coverage by Citizenship Status in Du Pont

| Citizenship Status | With Coverage | Without Coverage |
| Native Born | 21 (100.0%) | 0 (0.0%) |
| Foreign Born, Citizen | 41 (100.0%) | 0 (0.0%) |
| Foreign Born, not a Citizen | 3 (100.0%) | 0 (0.0%) |
Health Insurance Coverage by Household Income in Du Pont

| Household Income | With Coverage | Without Coverage |
| Under $25,000 | 67 (84.8%) | 12 (15.2%) |
| $25,000 to $49,999 | 26 (76.5%) | 8 (23.5%) |
| $50,000 to $74,999 | 0 (0.0%) | 0 (0.0%) |
| $75,000 to $99,999 | 15 (100.0%) | 0 (0.0%) |
| $100,000 and over | 14 (100.0%) | 0 (0.0%) |
Public vs Private Health Insurance Coverage by Age in Du Pont
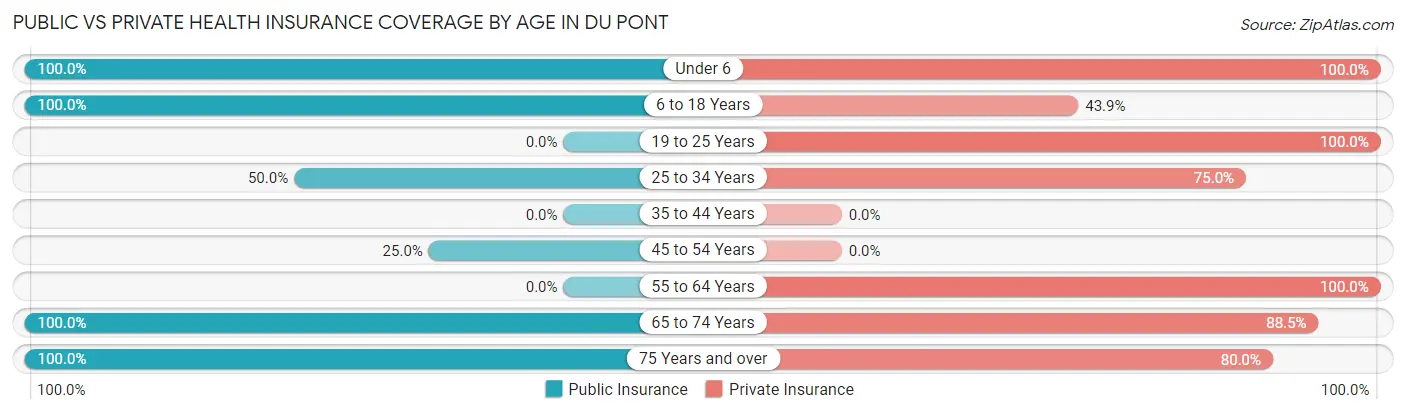
| Age Bracket | Public Insurance | Private Insurance |
| Under 6 | 21 (100.0%) | 21 (100.0%) |
| 6 to 18 Years | 41 (100.0%) | 18 (43.9%) |
| 19 to 25 Years | 0 (0.0%) | 3 (100.0%) |
| 25 to 34 Years | 4 (50.0%) | 6 (75.0%) |
| 35 to 44 Years | 0 (0.0%) | 0 (0.0%) |
| 45 to 54 Years | 4 (25.0%) | 0 (0.0%) |
| 55 to 64 Years | 0 (0.0%) | 14 (100.0%) |
| 65 to 74 Years | 26 (100.0%) | 23 (88.5%) |
| 75 Years and over | 5 (100.0%) | 4 (80.0%) |
| Total | 101 (71.1%) | 89 (62.7%) |
Disability Status by Sex by Age in Du Pont
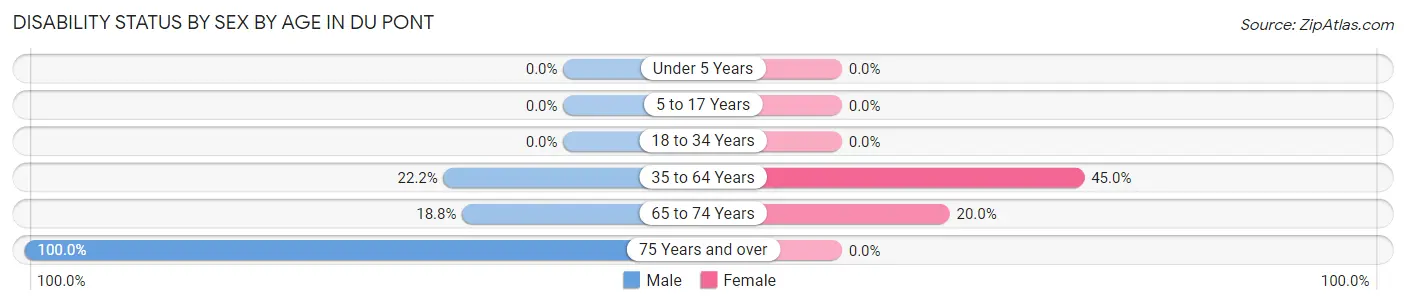
| Age Bracket | Male | Female |
| Under 5 Years | 0 (0.0%) | 0 (0.0%) |
| 5 to 17 Years | 0 (0.0%) | 0 (0.0%) |
| 18 to 34 Years | 0 (0.0%) | 0 (0.0%) |
| 35 to 64 Years | 4 (22.2%) | 9 (45.0%) |
| 65 to 74 Years | 3 (18.8%) | 2 (20.0%) |
| 75 Years and over | 2 (100.0%) | 0 (0.0%) |
Disability Class by Sex by Age in Du Pont
Disability Class: Hearing Difficulty
| Age Bracket | Male | Female |
| Under 5 Years | 0 (0.0%) | 0 (0.0%) |
| 5 to 17 Years | 0 (0.0%) | 0 (0.0%) |
| 18 to 34 Years | 0 (0.0%) | 0 (0.0%) |
| 35 to 64 Years | 0 (0.0%) | 0 (0.0%) |
| 65 to 74 Years | 0 (0.0%) | 0 (0.0%) |
| 75 Years and over | 0 (0.0%) | 0 (0.0%) |
Disability Class: Vision Difficulty
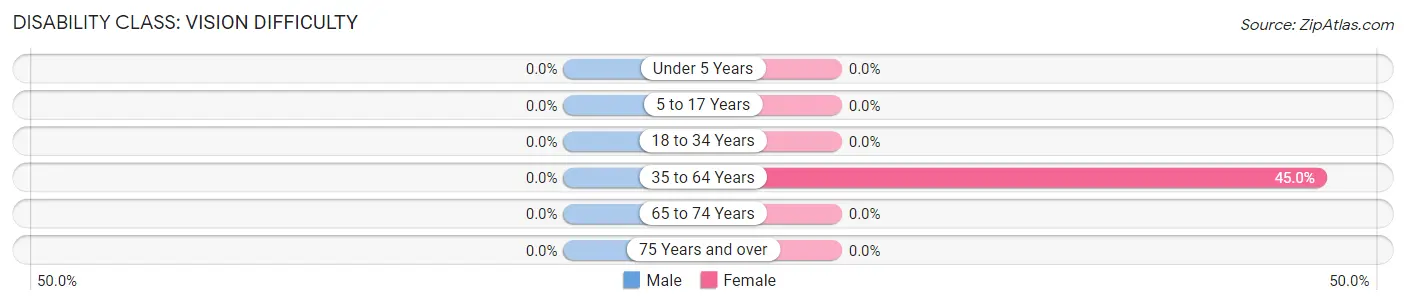
| Age Bracket | Male | Female |
| Under 5 Years | 0 (0.0%) | 0 (0.0%) |
| 5 to 17 Years | 0 (0.0%) | 0 (0.0%) |
| 18 to 34 Years | 0 (0.0%) | 0 (0.0%) |
| 35 to 64 Years | 0 (0.0%) | 9 (45.0%) |
| 65 to 74 Years | 0 (0.0%) | 0 (0.0%) |
| 75 Years and over | 0 (0.0%) | 0 (0.0%) |
Disability Class: Cognitive Difficulty

| Age Bracket | Male | Female |
| 5 to 17 Years | 0 (0.0%) | 0 (0.0%) |
| 18 to 34 Years | 0 (0.0%) | 0 (0.0%) |
| 35 to 64 Years | 0 (0.0%) | 0 (0.0%) |
| 65 to 74 Years | 0 (0.0%) | 2 (20.0%) |
| 75 Years and over | 0 (0.0%) | 0 (0.0%) |
Disability Class: Ambulatory Difficulty

| Age Bracket | Male | Female |
| 5 to 17 Years | 0 (0.0%) | 0 (0.0%) |
| 18 to 34 Years | 0 (0.0%) | 0 (0.0%) |
| 35 to 64 Years | 4 (22.2%) | 9 (45.0%) |
| 65 to 74 Years | 3 (18.8%) | 2 (20.0%) |
| 75 Years and over | 2 (100.0%) | 0 (0.0%) |
Disability Class: Self-Care Difficulty

| Age Bracket | Male | Female |
| 5 to 17 Years | 0 (0.0%) | 0 (0.0%) |
| 18 to 34 Years | 0 (0.0%) | 0 (0.0%) |
| 35 to 64 Years | 0 (0.0%) | 0 (0.0%) |
| 65 to 74 Years | 0 (0.0%) | 2 (20.0%) |
| 75 Years and over | 0 (0.0%) | 0 (0.0%) |
Technology Access in Du Pont
Computing Device Access in Du Pont
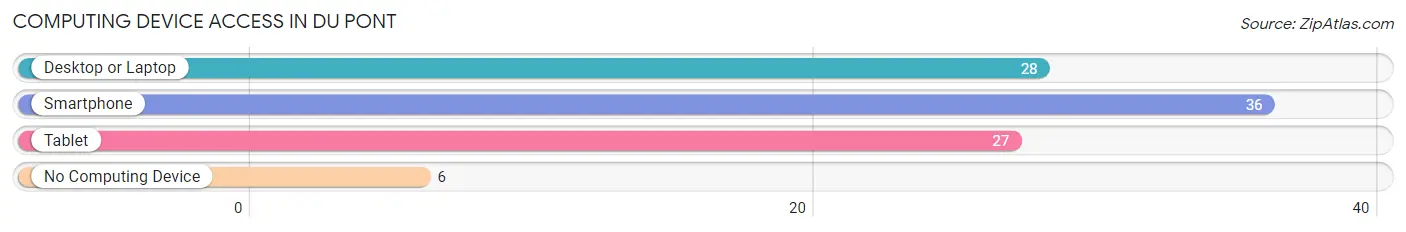
| Device Type | # Households | % Households |
| Desktop or Laptop | 28 | 62.2% |
| Smartphone | 36 | 80.0% |
| Tablet | 27 | 60.0% |
| No Computing Device | 6 | 13.3% |
| Total | 45 | 100.0% |
Internet Access in Du Pont
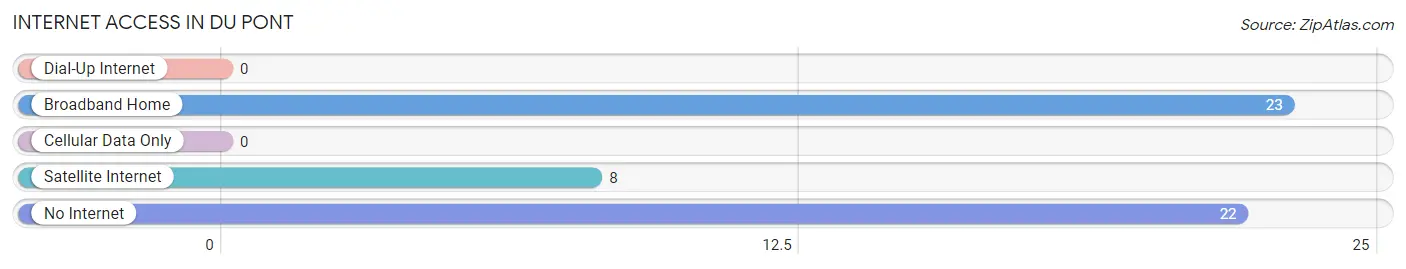
| Internet Type | # Households | % Households |
| Dial-Up Internet | 0 | 0.0% |
| Broadband Home | 23 | 51.1% |
| Cellular Data Only | 0 | 0.0% |
| Satellite Internet | 8 | 17.8% |
| No Internet | 22 | 48.9% |
| Total | 45 | 100.0% |
Du Pont Summary
Du Pont, Georgia is a small town located in the southeastern corner of the state, near the border of Florida. It is part of the Valdosta Metropolitan Statistical Area and is located in Lowndes County. The town was founded in 1891 and was named after the Du Pont family, who were prominent in the area. The population of Du Pont was estimated to be 1,072 in 2019.
Geography
Du Pont is located in the southeastern corner of Georgia, near the border of Florida. It is part of the Valdosta Metropolitan Statistical Area and is located in Lowndes County. The town is situated on the banks of the Withlacoochee River, which is a tributary of the Suwannee River. The town is surrounded by a variety of natural features, including the Withlacoochee State Forest, the Okefenokee Swamp, and the Osceola National Forest. The town is located approximately 30 miles from the city of Valdosta and is accessible via US Highway 84.
History
Du Pont was founded in 1891 and was named after the Du Pont family, who were prominent in the area. The town was originally a small farming community, but it grew rapidly in the early 20th century due to the development of the nearby Withlacoochee River. The town was incorporated in 1906 and was home to a variety of businesses, including a sawmill, a gristmill, and a cotton gin. The town also had a railroad station, which was used to transport goods and passengers to and from the town.
Economy
Du Pont is a small town with a limited economy. The town is home to a variety of small businesses, including a grocery store, a hardware store, and a few restaurants. The town is also home to a few manufacturing companies, including a paper mill and a wood products plant. The town is also home to a few agricultural operations, including a dairy farm and a poultry farm.
Demographics
The population of Du Pont was estimated to be 1,072 in 2019. The town is predominantly white, with a small African American population. The median household income in the town is $37,000, and the median home value is $90,000. The town has a high rate of poverty, with nearly 30% of the population living below the poverty line.
Conclusion
Du Pont, Georgia is a small town located in the southeastern corner of the state, near the border of Florida. It is part of the Valdosta Metropolitan Statistical Area and is located in Lowndes County. The town was founded in 1891 and was named after the Du Pont family, who were prominent in the area. The population of Du Pont was estimated to be 1,072 in 2019. The town is predominantly white, with a small African American population. The town has a limited economy, with a variety of small businesses and a few manufacturing and agricultural operations. The median household income in the town is $37,000, and the median home value is $90,000. The town has a high rate of poverty, with nearly 30% of the population living below the poverty line.
Common Questions
What is Per Capita Income in Du Pont?
Per Capita income in Du Pont is $12,592.
What is the Median Household income in Du Pont?
Median Household Income in Du Pont is $24,688.
What is Inequality or Gini Index in Du Pont?
Inequality or Gini Index in Du Pont is 0.55.
What is the Total Population of Du Pont?
Total Population of Du Pont is 142.
What is the Total Male Population of Du Pont?
Total Male Population of Du Pont is 71.
What is the Total Female Population of Du Pont?
Total Female Population of Du Pont is 71.
What is the Ratio of Males per 100 Females in Du Pont?
There are 100.00 Males per 100 Females in Du Pont.
What is the Ratio of Females per 100 Males in Du Pont?
There are 100.00 Females per 100 Males in Du Pont.
What is the Median Population Age in Du Pont?
Median Population Age in Du Pont is 32.5 Years.
What is the Average Family Size in Du Pont
Average Family Size in Du Pont is 3.4 People.
What is the Average Household Size in Du Pont
Average Household Size in Du Pont is 3.2 People.
How Large is the Labor Force in Du Pont?
There are 19 People in the Labor Forcein in Du Pont.
What is the Percentage of People in the Labor Force in Du Pont?
22.1% of People are in the Labor Force in Du Pont.