Commerce, GA Map & Demographics
Commerce Map
Commerce Overview
$23,269
PER CAPITA INCOME
$66,468
AVG FAMILY INCOME
$58,763
AVG HOUSEHOLD INCOME
5.1%
WAGE / INCOME GAP [ % ]
94.9¢/ $1
WAGE / INCOME GAP [ $ ]
0.37
INEQUALITY / GINI INDEX
7,391
TOTAL POPULATION
3,510
MALE POPULATION
3,881
FEMALE POPULATION
90.44
MALES / 100 FEMALES
110.57
FEMALES / 100 MALES
34.8
MEDIAN AGE
3.5
AVG FAMILY SIZE
2.9
AVG HOUSEHOLD SIZE
3,244
LABOR FORCE [ PEOPLE ]
57.7%
PERCENT IN LABOR FORCE
0.2%
UNEMPLOYMENT RATE
Income in Commerce
Income Overview in Commerce
Per Capita Income in Commerce is $23,269, while median incomes of families and households are $66,468 and $58,763 respectively.
| Characteristic | Number | Measure |
| Per Capita Income | 7,391 | $23,269 |
| Median Family Income | 1,827 | $66,468 |
| Mean Family Income | 1,827 | $72,049 |
| Median Household Income | 2,451 | $58,763 |
| Mean Household Income | 2,451 | $66,603 |
| Income Deficit | 1,827 | $0 |
| Wage / Income Gap (%) | 7,391 | 5.06% |
| Wage / Income Gap ($) | 7,391 | 94.94¢ per $1 |
| Gini / Inequality Index | 7,391 | 0.37 |
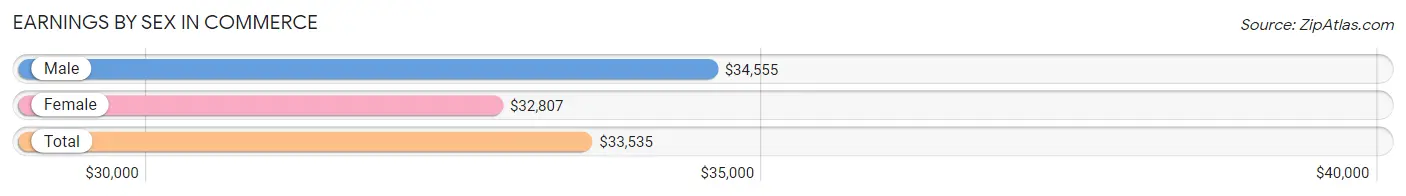
Earnings by Sex in Commerce
Average Earnings in Commerce are $33,535, $34,555 for men and $32,807 for women, a difference of 5.1%.
| Sex | Number | Average Earnings |
| Male | 1,849 (53.1%) | $34,555 |
| Female | 1,634 (46.9%) | $32,807 |
| Total | 3,483 (100.0%) | $33,535 |
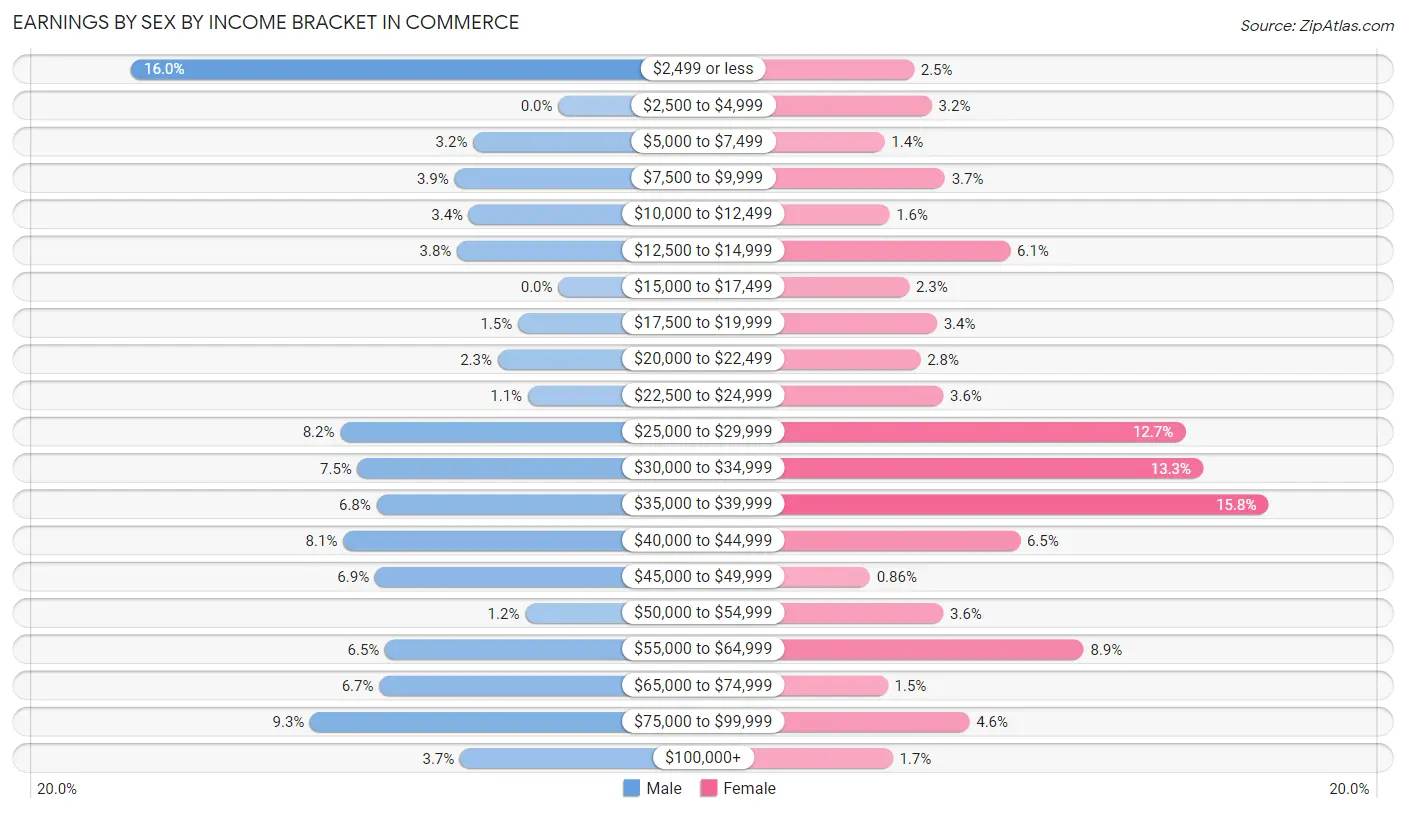
Earnings by Sex by Income Bracket in Commerce
The most common earnings brackets in Commerce are $2,499 or less for men (296 | 16.0%) and $35,000 to $39,999 for women (258 | 15.8%).
| Income | Male | Female |
| $2,499 or less | 296 (16.0%) | 41 (2.5%) |
| $2,500 to $4,999 | 0 (0.0%) | 52 (3.2%) |
| $5,000 to $7,499 | 59 (3.2%) | 23 (1.4%) |
| $7,500 to $9,999 | 72 (3.9%) | 60 (3.7%) |
| $10,000 to $12,499 | 62 (3.4%) | 26 (1.6%) |
| $12,500 to $14,999 | 70 (3.8%) | 100 (6.1%) |
| $15,000 to $17,499 | 0 (0.0%) | 38 (2.3%) |
| $17,500 to $19,999 | 28 (1.5%) | 55 (3.4%) |
| $20,000 to $22,499 | 42 (2.3%) | 45 (2.8%) |
| $22,500 to $24,999 | 21 (1.1%) | 59 (3.6%) |
| $25,000 to $29,999 | 151 (8.2%) | 207 (12.7%) |
| $30,000 to $34,999 | 139 (7.5%) | 218 (13.3%) |
| $35,000 to $39,999 | 126 (6.8%) | 258 (15.8%) |
| $40,000 to $44,999 | 149 (8.1%) | 106 (6.5%) |
| $45,000 to $49,999 | 127 (6.9%) | 14 (0.9%) |
| $50,000 to $54,999 | 23 (1.2%) | 59 (3.6%) |
| $55,000 to $64,999 | 120 (6.5%) | 145 (8.9%) |
| $65,000 to $74,999 | 124 (6.7%) | 25 (1.5%) |
| $75,000 to $99,999 | 172 (9.3%) | 75 (4.6%) |
| $100,000+ | 68 (3.7%) | 28 (1.7%) |
| Total | 1,849 (100.0%) | 1,634 (100.0%) |
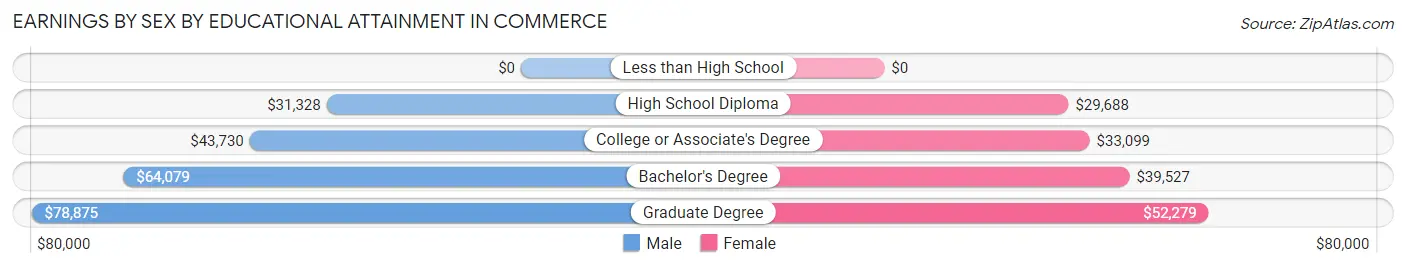
Earnings by Sex by Educational Attainment in Commerce
Average earnings in Commerce are $38,160 for men and $33,165 for women, a difference of 13.1%. Men with an educational attainment of graduate degree enjoy the highest average annual earnings of $78,875, while those with high school diploma education earn the least with $31,328. Women with an educational attainment of graduate degree earn the most with the average annual earnings of $52,279, while those with high school diploma education have the smallest earnings of $29,688.
| Educational Attainment | Male Income | Female Income |
| Less than High School | - | - |
| High School Diploma | $31,328 | $29,688 |
| College or Associate's Degree | $43,730 | $33,099 |
| Bachelor's Degree | $64,079 | $39,527 |
| Graduate Degree | $78,875 | $52,279 |
| Total | $38,160 | $33,165 |
Family Income in Commerce
Family Income Brackets in Commerce
According to the Commerce family income data, there are 385 families falling into the $50,000 to $74,999 income range, which is the most common income bracket and makes up 21.1% of all families. Conversely, the $10,000 to $14,999 income bracket is the least frequent group with only 26 families (1.4%) belonging to this category.
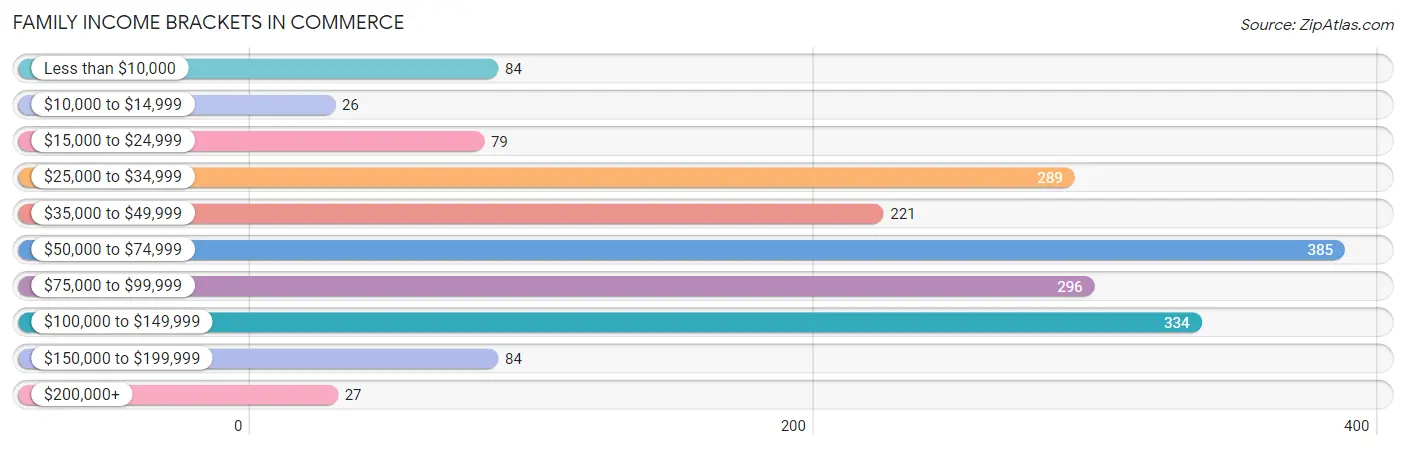
| Income Bracket | # Families | % Families |
| Less than $10,000 | 84 | 4.6% |
| $10,000 to $14,999 | 26 | 1.4% |
| $15,000 to $24,999 | 79 | 4.3% |
| $25,000 to $34,999 | 289 | 15.8% |
| $35,000 to $49,999 | 221 | 12.1% |
| $50,000 to $74,999 | 385 | 21.1% |
| $75,000 to $99,999 | 296 | 16.2% |
| $100,000 to $149,999 | 334 | 18.3% |
| $150,000 to $199,999 | 84 | 4.6% |
| $200,000+ | 27 | 1.5% |
Family Income by Famaliy Size in Commerce
6-person families (108 | 5.9%) account for the highest median family income in Commerce with $95,588 per family, while 2-person families (856 | 46.9%) have the highest median income of $28,889 per family member.
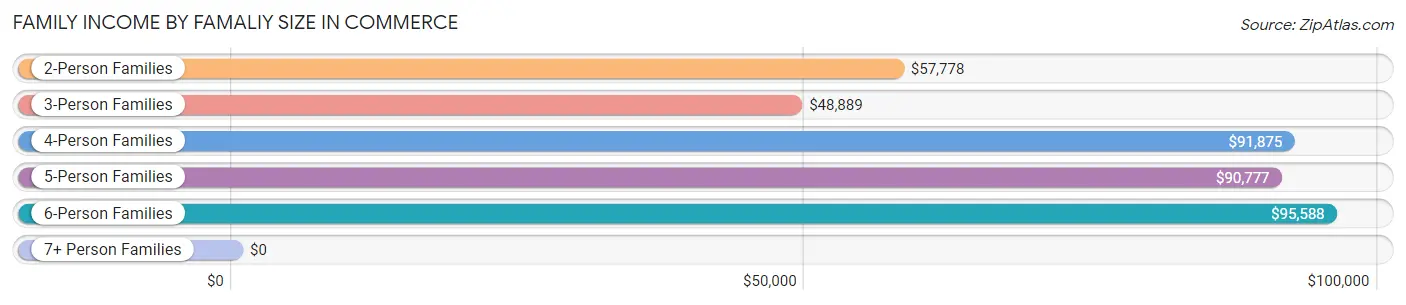
| Income Bracket | # Families | Median Income |
| 2-Person Families | 856 (46.9%) | $57,778 |
| 3-Person Families | 388 (21.2%) | $48,889 |
| 4-Person Families | 277 (15.2%) | $91,875 |
| 5-Person Families | 125 (6.8%) | $90,777 |
| 6-Person Families | 108 (5.9%) | $95,588 |
| 7+ Person Families | 73 (4.0%) | $0 |
| Total | 1,827 (100.0%) | $66,468 |
Family Income by Number of Earners in Commerce
The median family income in Commerce is $66,468, with families comprising 3+ earners (98) having the highest median family income of $97,402, while families with no earners (268) have the lowest median family income of $33,661, accounting for 5.4% and 14.7% of families, respectively.
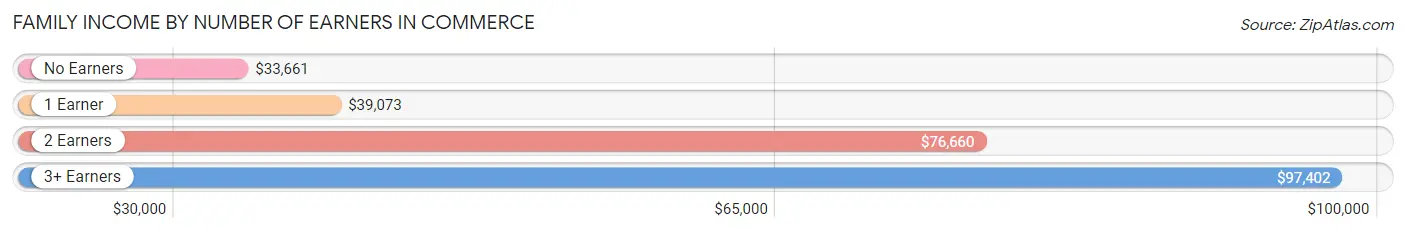
| Number of Earners | # Families | Median Income |
| No Earners | 268 (14.7%) | $33,661 |
| 1 Earner | 556 (30.4%) | $39,073 |
| 2 Earners | 905 (49.5%) | $76,660 |
| 3+ Earners | 98 (5.4%) | $97,402 |
| Total | 1,827 (100.0%) | $66,468 |
Household Income in Commerce
Household Income Brackets in Commerce
With 493 households falling in the category, the $50,000 to $74,999 income range is the most frequent in Commerce, accounting for 20.1% of all households. In contrast, only 39 households (1.6%) fall into the $200,000+ income bracket, making it the least populous group.
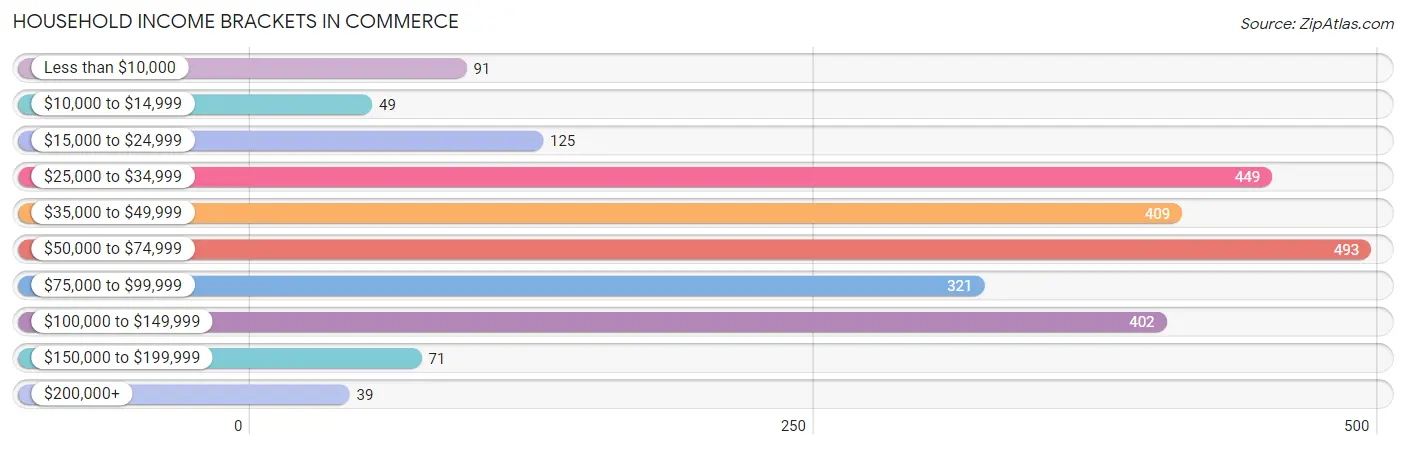
| Income Bracket | # Households | % Households |
| Less than $10,000 | 91 | 3.7% |
| $10,000 to $14,999 | 49 | 2.0% |
| $15,000 to $24,999 | 125 | 5.1% |
| $25,000 to $34,999 | 449 | 18.3% |
| $35,000 to $49,999 | 409 | 16.7% |
| $50,000 to $74,999 | 493 | 20.1% |
| $75,000 to $99,999 | 321 | 13.1% |
| $100,000 to $149,999 | 402 | 16.4% |
| $150,000 to $199,999 | 71 | 2.9% |
| $200,000+ | 39 | 1.6% |
Household Income by Householder Age in Commerce
The median household income in Commerce is $58,763, with the highest median household income of $69,412 found in the 25 to 44 years age bracket for the primary householder. A total of 900 households (36.7%) fall into this category. Meanwhile, the 15 to 24 years age bracket for the primary householder has the lowest median household income of $46,100, with 160 households (6.5%) in this group.
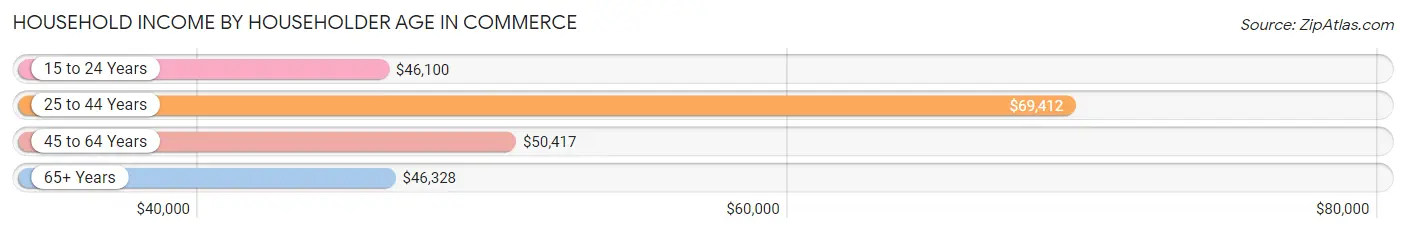
| Income Bracket | # Households | Median Income |
| 15 to 24 Years | 160 (6.5%) | $46,100 |
| 25 to 44 Years | 900 (36.7%) | $69,412 |
| 45 to 64 Years | 812 (33.1%) | $50,417 |
| 65+ Years | 579 (23.6%) | $46,328 |
| Total | 2,451 (100.0%) | $58,763 |
Poverty in Commerce
Income Below Poverty by Sex and Age in Commerce
With 12.9% poverty level for males and 10.6% for females among the residents of Commerce, under 5 year old males and 18 to 24 year old females are the most vulnerable to poverty, with 68 males (25.0%) and 36 females (17.3%) in their respective age groups living below the poverty level.
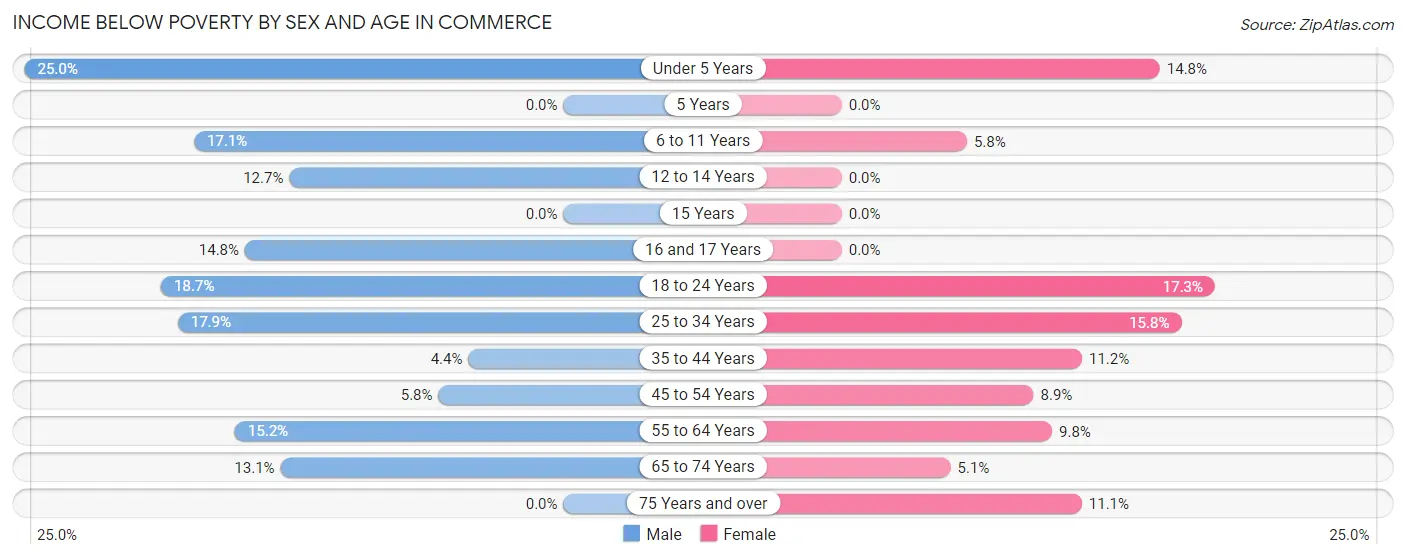
| Age Bracket | Male | Female |
| Under 5 Years | 68 (25.0%) | 49 (14.8%) |
| 5 Years | 0 (0.0%) | 0 (0.0%) |
| 6 to 11 Years | 42 (17.1%) | 19 (5.8%) |
| 12 to 14 Years | 43 (12.7%) | 0 (0.0%) |
| 15 Years | 0 (0.0%) | 0 (0.0%) |
| 16 and 17 Years | 47 (14.8%) | 0 (0.0%) |
| 18 to 24 Years | 31 (18.7%) | 36 (17.3%) |
| 25 to 34 Years | 90 (17.9%) | 109 (15.8%) |
| 35 to 44 Years | 25 (4.4%) | 62 (11.2%) |
| 45 to 54 Years | 17 (5.8%) | 34 (8.9%) |
| 55 to 64 Years | 57 (15.2%) | 29 (9.8%) |
| 65 to 74 Years | 26 (13.1%) | 16 (5.1%) |
| 75 Years and over | 0 (0.0%) | 38 (11.1%) |
| Total | 446 (12.9%) | 392 (10.6%) |
Income Above Poverty by Sex and Age in Commerce
According to the poverty statistics in Commerce, males aged 5 years and females aged 12 to 14 years are the age groups that are most secure financially, with 100.0% of males and 100.0% of females in these age groups living above the poverty line.
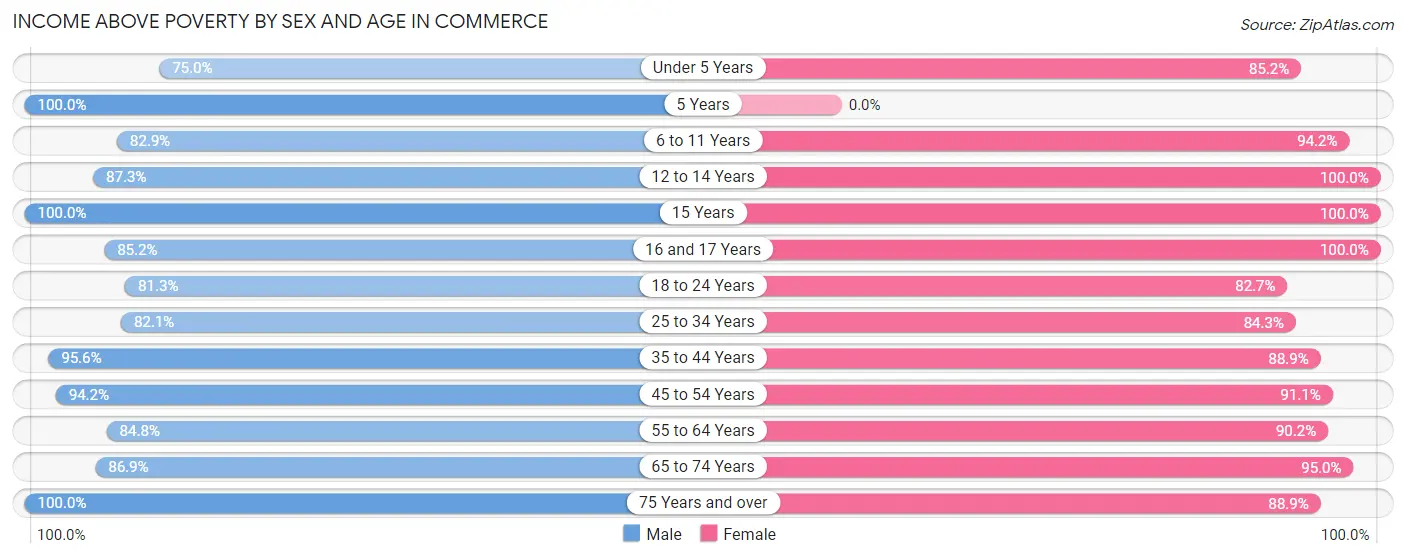
| Age Bracket | Male | Female |
| Under 5 Years | 204 (75.0%) | 283 (85.2%) |
| 5 Years | 30 (100.0%) | 0 (0.0%) |
| 6 to 11 Years | 203 (82.9%) | 308 (94.2%) |
| 12 to 14 Years | 295 (87.3%) | 140 (100.0%) |
| 15 Years | 38 (100.0%) | 47 (100.0%) |
| 16 and 17 Years | 271 (85.2%) | 57 (100.0%) |
| 18 to 24 Years | 135 (81.3%) | 172 (82.7%) |
| 25 to 34 Years | 413 (82.1%) | 583 (84.3%) |
| 35 to 44 Years | 542 (95.6%) | 494 (88.8%) |
| 45 to 54 Years | 276 (94.2%) | 348 (91.1%) |
| 55 to 64 Years | 317 (84.8%) | 268 (90.2%) |
| 65 to 74 Years | 172 (86.9%) | 301 (95.0%) |
| 75 Years and over | 112 (100.0%) | 303 (88.9%) |
| Total | 3,008 (87.1%) | 3,304 (89.4%) |
Income Below Poverty Among Married-Couple Families in Commerce
The poverty statistics for married-couple families in Commerce show that 5.5% or 74 of the total 1,353 families live below the poverty line. Families with 3 or 4 children have the highest poverty rate of 18.0%, comprising of 41 families. On the other hand, families with 1 or 2 children have the lowest poverty rate of 0.0%, which includes 0 families.
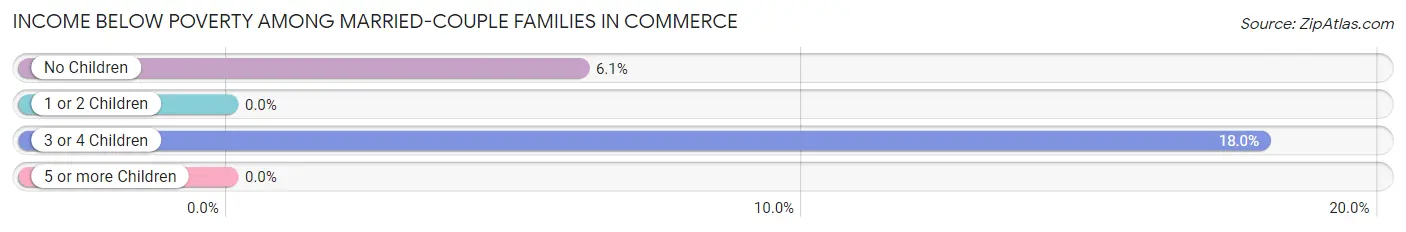
| Children | Above Poverty | Below Poverty |
| No Children | 507 (93.9%) | 33 (6.1%) |
| 1 or 2 Children | 573 (100.0%) | 0 (0.0%) |
| 3 or 4 Children | 187 (82.0%) | 41 (18.0%) |
| 5 or more Children | 12 (100.0%) | 0 (0.0%) |
| Total | 1,279 (94.5%) | 74 (5.5%) |
Income Below Poverty Among Single-Parent Households in Commerce
According to the poverty data in Commerce, 4.7% or 9 single-father households and 15.6% or 44 single-mother households are living below the poverty line. Among single-father households, those with 1 or 2 children have the highest poverty rate, with 9 households (6.7%) experiencing poverty. Likewise, among single-mother households, those with 1 or 2 children have the highest poverty rate, with 29 households (27.1%) falling below the poverty line.
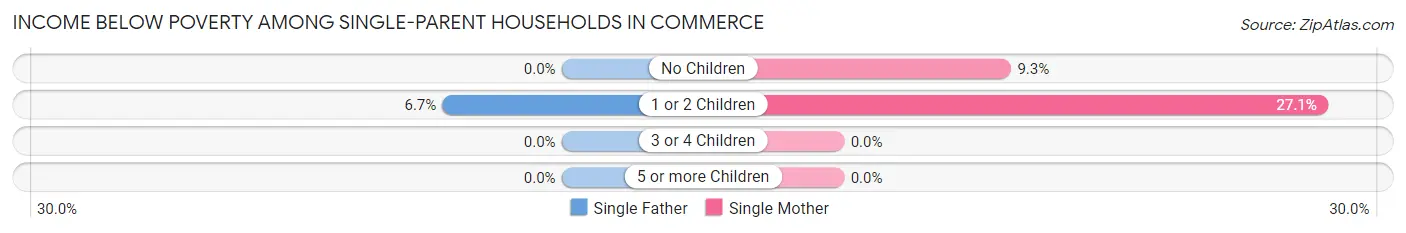
| Children | Single Father | Single Mother |
| No Children | 0 (0.0%) | 15 (9.3%) |
| 1 or 2 Children | 9 (6.7%) | 29 (27.1%) |
| 3 or 4 Children | 0 (0.0%) | 0 (0.0%) |
| 5 or more Children | 0 (0.0%) | 0 (0.0%) |
| Total | 9 (4.7%) | 44 (15.6%) |
Income Below Poverty Among Married-Couple vs Single-Parent Households in Commerce
The poverty data for Commerce shows that 74 of the married-couple family households (5.5%) and 53 of the single-parent households (11.2%) are living below the poverty level. Within the married-couple family households, those with 3 or 4 children have the highest poverty rate, with 41 households (18.0%) falling below the poverty line. Among the single-parent households, those with 1 or 2 children have the highest poverty rate, with 38 household (15.7%) living below poverty.
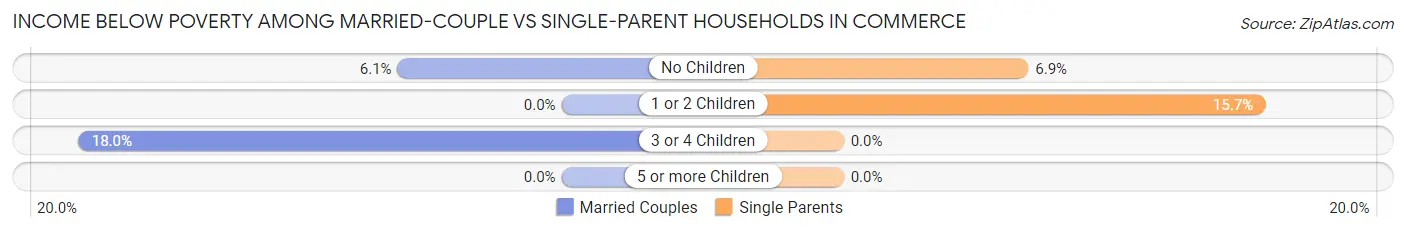
| Children | Married-Couple Families | Single-Parent Households |
| No Children | 33 (6.1%) | 15 (6.9%) |
| 1 or 2 Children | 0 (0.0%) | 38 (15.7%) |
| 3 or 4 Children | 41 (18.0%) | 0 (0.0%) |
| 5 or more Children | 0 (0.0%) | 0 (0.0%) |
| Total | 74 (5.5%) | 53 (11.2%) |
Race in Commerce
The most populous races in Commerce are White / Caucasian (5,565 | 75.3%), Black / African American (1,148 | 15.5%), and Hispanic or Latino (788 | 10.7%).
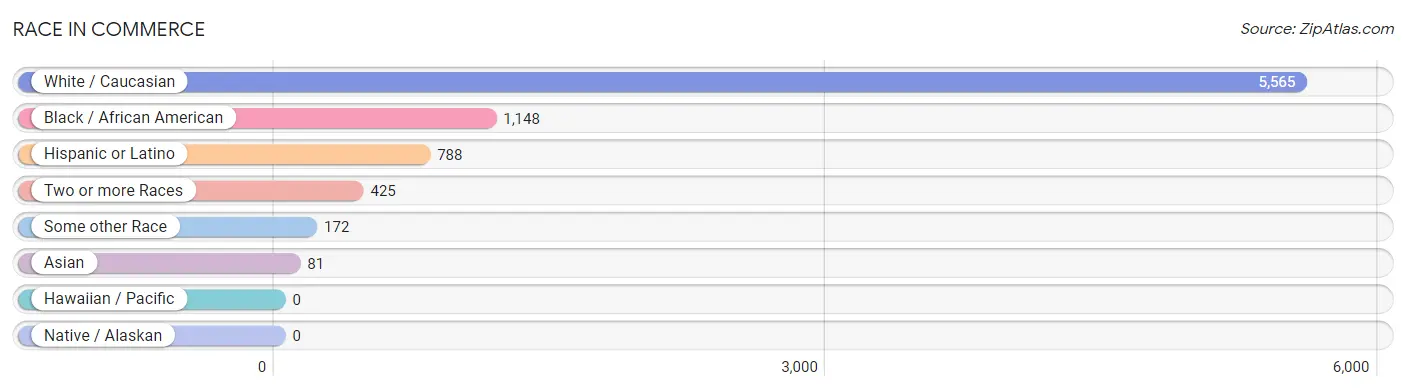
| Race | # Population | % Population |
| Asian | 81 | 1.1% |
| Black / African American | 1,148 | 15.5% |
| Hawaiian / Pacific | 0 | 0.0% |
| Hispanic or Latino | 788 | 10.7% |
| Native / Alaskan | 0 | 0.0% |
| White / Caucasian | 5,565 | 75.3% |
| Two or more Races | 425 | 5.8% |
| Some other Race | 172 | 2.3% |
| Total | 7,391 | 100.0% |
Ancestry in Commerce
The most populous ancestries reported in Commerce are English (1,047 | 14.2%), American (726 | 9.8%), German (674 | 9.1%), Mexican (525 | 7.1%), and Irish (270 | 3.6%), together accounting for 43.9% of all Commerce residents.
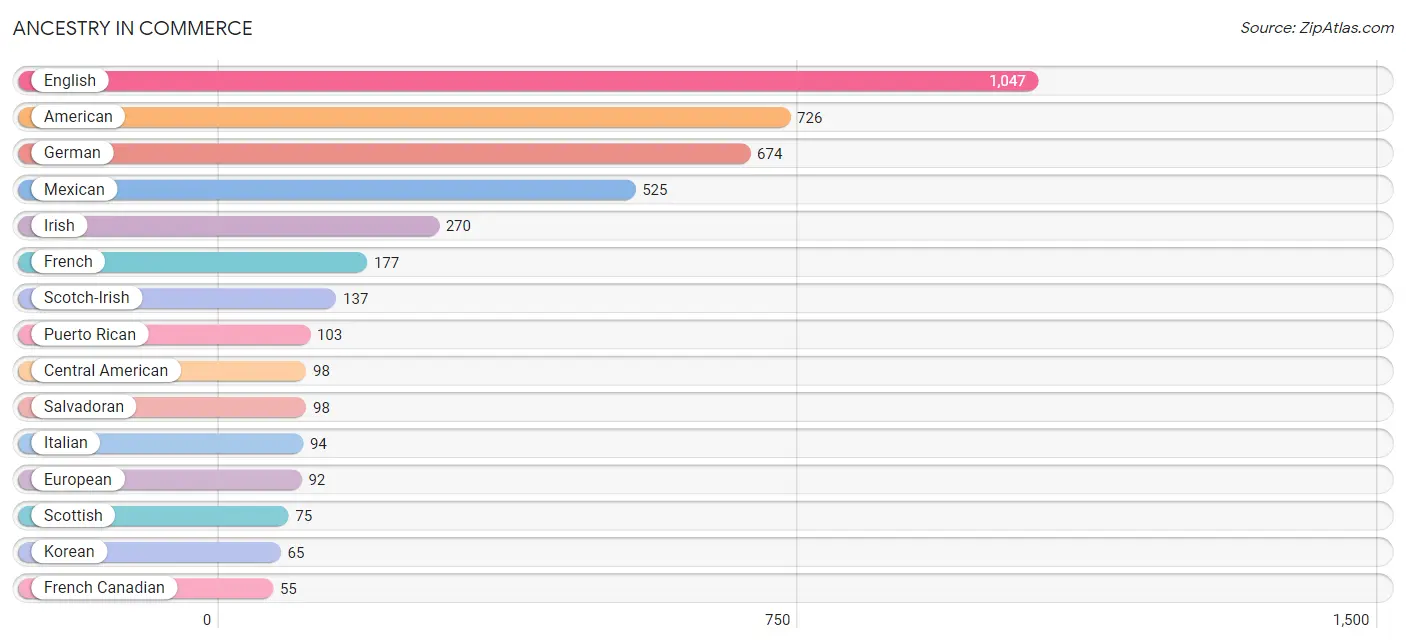
| Ancestry | # Population | % Population |
| American | 726 | 9.8% |
| Austrian | 4 | 0.1% |
| Central American | 98 | 1.3% |
| Colombian | 8 | 0.1% |
| Danish | 38 | 0.5% |
| Dutch | 38 | 0.5% |
| English | 1,047 | 14.2% |
| European | 92 | 1.2% |
| French | 177 | 2.4% |
| French Canadian | 55 | 0.7% |
| German | 674 | 9.1% |
| Greek | 15 | 0.2% |
| Indian (Asian) | 23 | 0.3% |
| Irish | 270 | 3.6% |
| Italian | 94 | 1.3% |
| Japanese | 8 | 0.1% |
| Korean | 65 | 0.9% |
| Mexican | 525 | 7.1% |
| Nigerian | 11 | 0.2% |
| Norwegian | 21 | 0.3% |
| Polish | 9 | 0.1% |
| Puerto Rican | 103 | 1.4% |
| Salvadoran | 98 | 1.3% |
| Scotch-Irish | 137 | 1.8% |
| Scottish | 75 | 1.0% |
| Slavic | 14 | 0.2% |
| South American | 8 | 0.1% |
| Sri Lankan | 15 | 0.2% |
| Subsaharan African | 11 | 0.2% |
| Welsh | 24 | 0.3% | View All 30 Rows |
Immigrants in Commerce
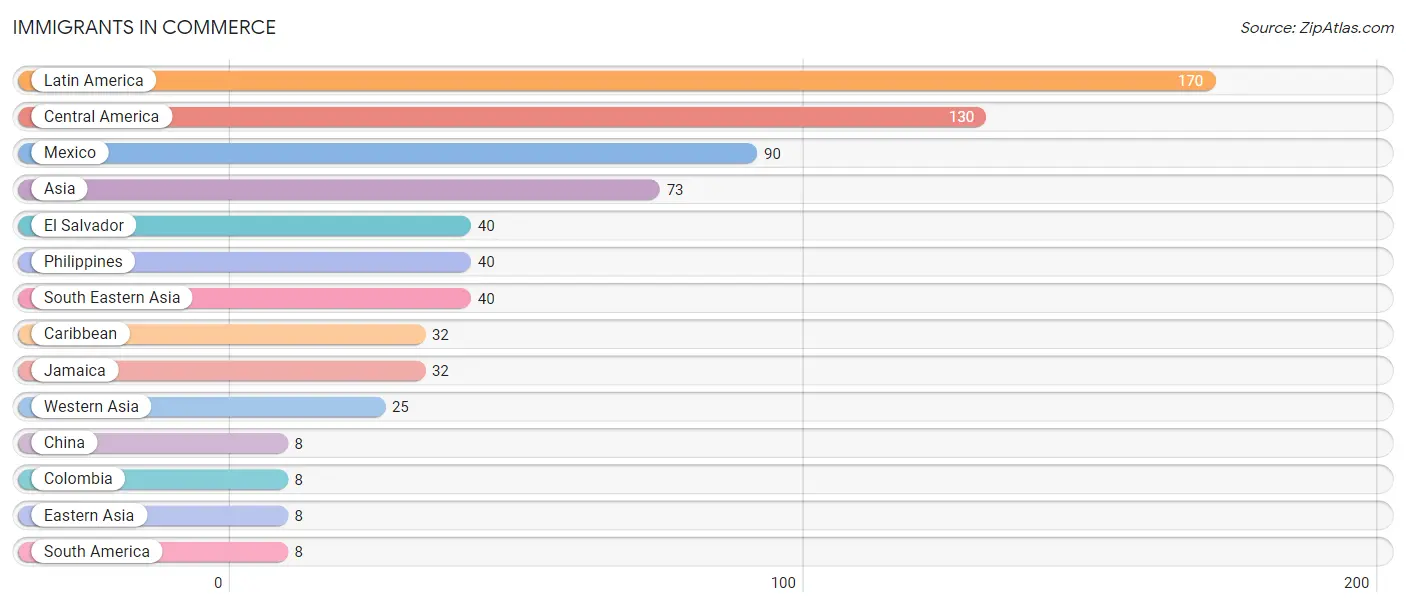
The most numerous immigrant groups reported in Commerce came from Latin America (170 | 2.3%), Central America (130 | 1.8%), Mexico (90 | 1.2%), Asia (73 | 1.0%), and El Salvador (40 | 0.5%), together accounting for 6.8% of all Commerce residents.
| Immigration Origin | # Population | % Population |
| Asia | 73 | 1.0% |
| Caribbean | 32 | 0.4% |
| Central America | 130 | 1.8% |
| China | 8 | 0.1% |
| Colombia | 8 | 0.1% |
| Eastern Asia | 8 | 0.1% |
| El Salvador | 40 | 0.5% |
| Jamaica | 32 | 0.4% |
| Latin America | 170 | 2.3% |
| Mexico | 90 | 1.2% |
| Philippines | 40 | 0.5% |
| South America | 8 | 0.1% |
| South Eastern Asia | 40 | 0.5% |
| Western Asia | 25 | 0.3% | View All 14 Rows |
Sex and Age in Commerce
Sex and Age in Commerce
The most populous age groups in Commerce are 10 to 14 Years (466 | 13.3%) for men and 30 to 34 Years (431 | 11.1%) for women.
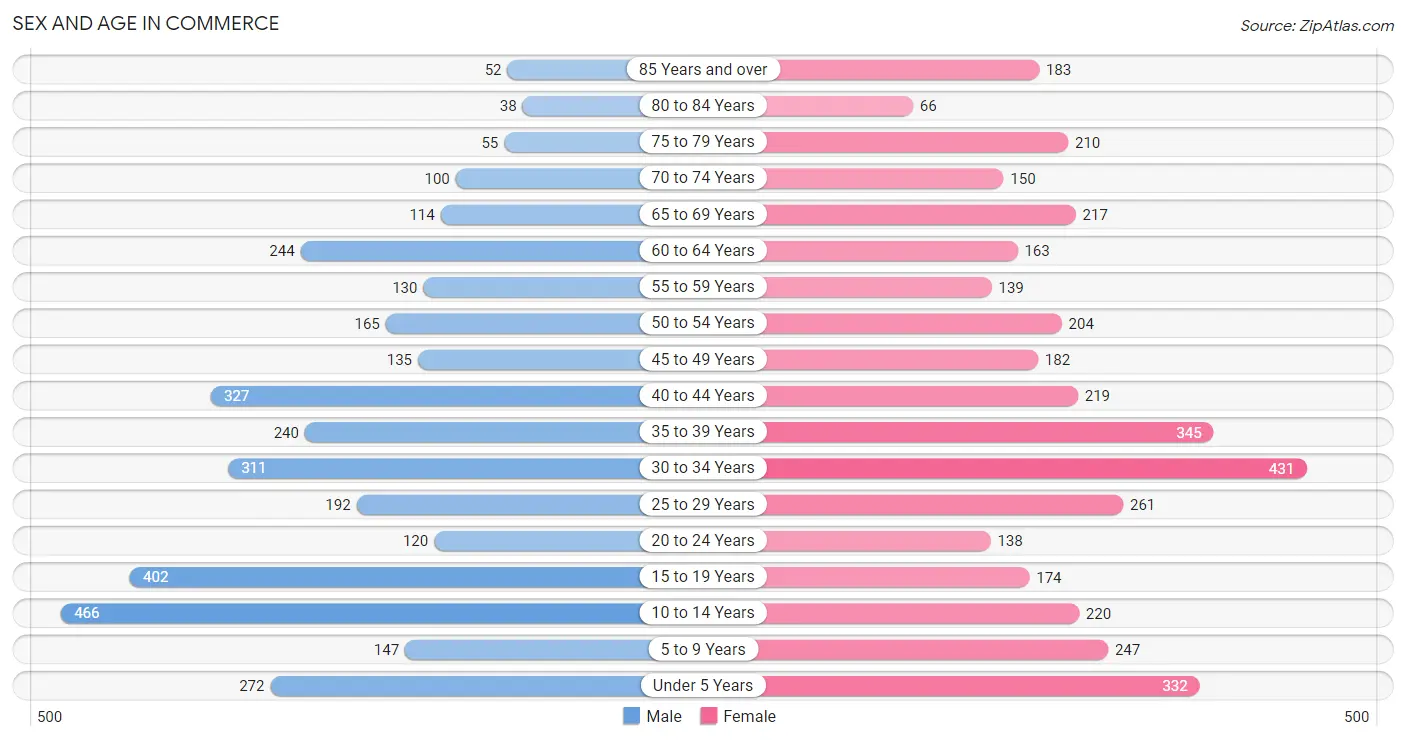
| Age Bracket | Male | Female |
| Under 5 Years | 272 (7.7%) | 332 (8.6%) |
| 5 to 9 Years | 147 (4.2%) | 247 (6.4%) |
| 10 to 14 Years | 466 (13.3%) | 220 (5.7%) |
| 15 to 19 Years | 402 (11.5%) | 174 (4.5%) |
| 20 to 24 Years | 120 (3.4%) | 138 (3.6%) |
| 25 to 29 Years | 192 (5.5%) | 261 (6.7%) |
| 30 to 34 Years | 311 (8.9%) | 431 (11.1%) |
| 35 to 39 Years | 240 (6.8%) | 345 (8.9%) |
| 40 to 44 Years | 327 (9.3%) | 219 (5.6%) |
| 45 to 49 Years | 135 (3.8%) | 182 (4.7%) |
| 50 to 54 Years | 165 (4.7%) | 204 (5.3%) |
| 55 to 59 Years | 130 (3.7%) | 139 (3.6%) |
| 60 to 64 Years | 244 (7.0%) | 163 (4.2%) |
| 65 to 69 Years | 114 (3.3%) | 217 (5.6%) |
| 70 to 74 Years | 100 (2.9%) | 150 (3.9%) |
| 75 to 79 Years | 55 (1.6%) | 210 (5.4%) |
| 80 to 84 Years | 38 (1.1%) | 66 (1.7%) |
| 85 Years and over | 52 (1.5%) | 183 (4.7%) |
| Total | 3,510 (100.0%) | 3,881 (100.0%) |
Families and Households in Commerce
Median Family Size in Commerce
The median family size in Commerce is 3.46 persons per family, with married-couple families (1,353 | 74.1%) accounting for the largest median family size of 3.8 persons per family. On the other hand, single male/father families (192 | 10.5%) represent the smallest median family size with 2.13 persons per family.
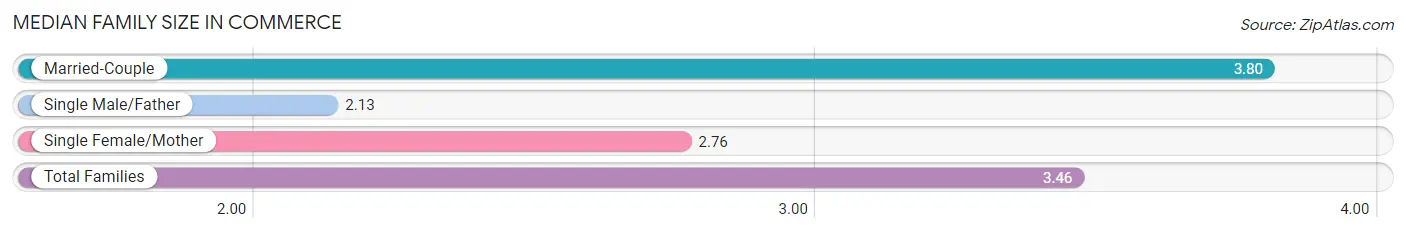
| Family Type | # Families | Family Size |
| Married-Couple | 1,353 (74.1%) | 3.80 |
| Single Male/Father | 192 (10.5%) | 2.13 |
| Single Female/Mother | 282 (15.4%) | 2.76 |
| Total Families | 1,827 (100.0%) | 3.46 |
Median Household Size in Commerce
The median household size in Commerce is 2.92 persons per household, with married-couple households (1,353 | 55.2%) accounting for the largest median household size of 3.83 persons per household. non-family households (624 | 25.5%) represent the smallest median household size with 1.23 persons per household.
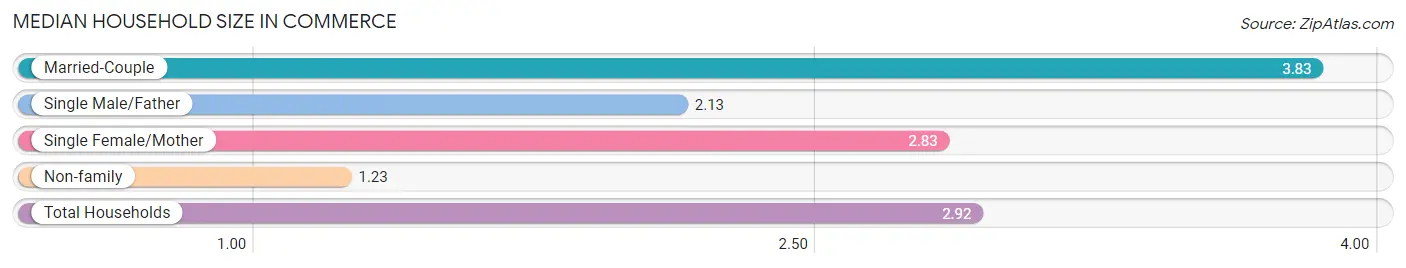
| Household Type | # Households | Household Size |
| Married-Couple | 1,353 (55.2%) | 3.83 |
| Single Male/Father | 192 (7.8%) | 2.13 |
| Single Female/Mother | 282 (11.5%) | 2.83 |
| Non-family | 624 (25.5%) | 1.23 |
| Total Households | 2,451 (100.0%) | 2.92 |
Household Size by Marriage Status in Commerce
Out of a total of 2,451 households in Commerce, 1,827 (74.5%) are family households, while 624 (25.5%) are nonfamily households. The most numerous type of family households are 2-person households, comprising 820, and the most common type of nonfamily households are 1-person households, comprising 505.
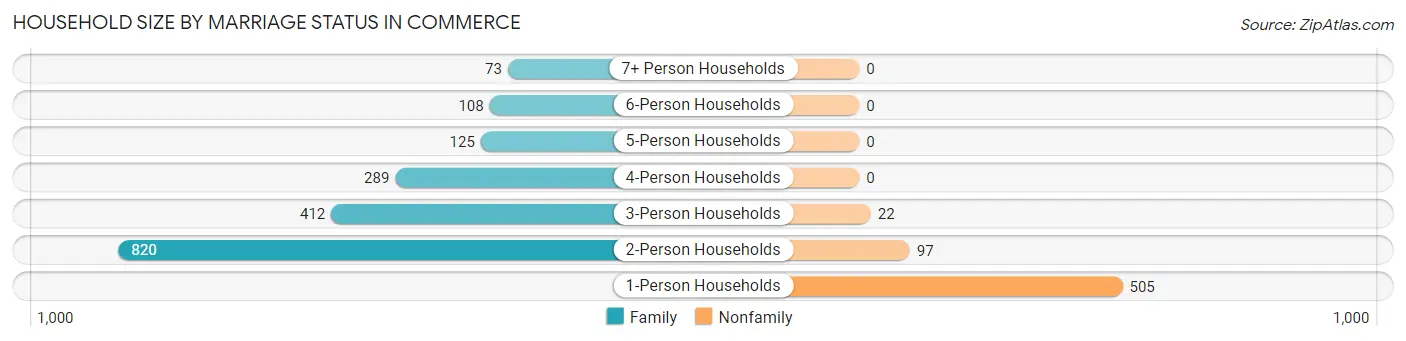
| Household Size | Family Households | Nonfamily Households |
| 1-Person Households | - | 505 (20.6%) |
| 2-Person Households | 820 (33.5%) | 97 (4.0%) |
| 3-Person Households | 412 (16.8%) | 22 (0.9%) |
| 4-Person Households | 289 (11.8%) | 0 (0.0%) |
| 5-Person Households | 125 (5.1%) | 0 (0.0%) |
| 6-Person Households | 108 (4.4%) | 0 (0.0%) |
| 7+ Person Households | 73 (3.0%) | 0 (0.0%) |
| Total | 1,827 (74.5%) | 624 (25.5%) |
Female Fertility in Commerce
Fertility by Age in Commerce
Average fertility rate in Commerce is 75.0 births per 1,000 women. Women in the age bracket of 20 to 34 years have the highest fertility rate with 160.0 births per 1,000 women. Women in the age bracket of 20 to 34 years acount for 100.0% of all women with births.
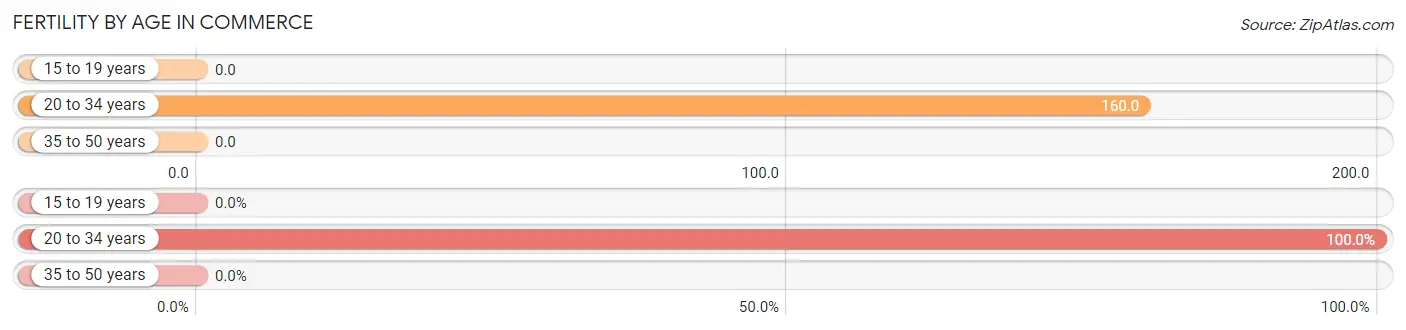
| Age Bracket | Women with Births | Births / 1,000 Women |
| 15 to 19 years | 0 (0.0%) | 0.0 |
| 20 to 34 years | 133 (100.0%) | 160.0 |
| 35 to 50 years | 0 (0.0%) | 0.0 |
| Total | 133 (100.0%) | 75.0 |
Fertility by Age by Marriage Status in Commerce
86.5% of women with births (133) in Commerce are married. The highest percentage of unmarried women with births falls into 20 to 34 years age bracket with 13.5% of them unmarried at the time of birth, while the lowest percentage of unmarried women with births belong to 20 to 34 years age bracket with 13.5% of them unmarried.
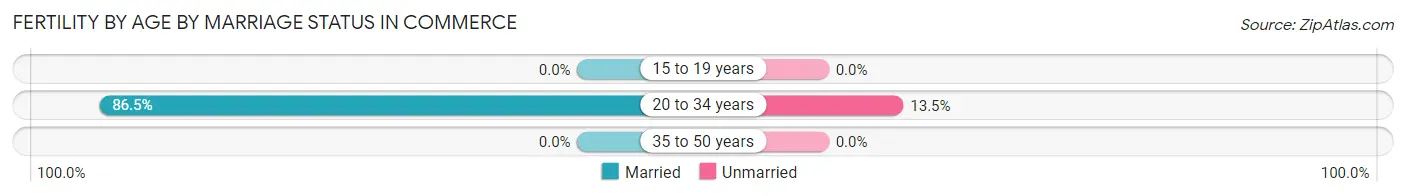
| Age Bracket | Married | Unmarried |
| 15 to 19 years | 0 (0.0%) | 0 (0.0%) |
| 20 to 34 years | 115 (86.5%) | 18 (13.5%) |
| 35 to 50 years | 0 (0.0%) | 0 (0.0%) |
| Total | 115 (86.5%) | 18 (13.5%) |
Fertility by Education in Commerce
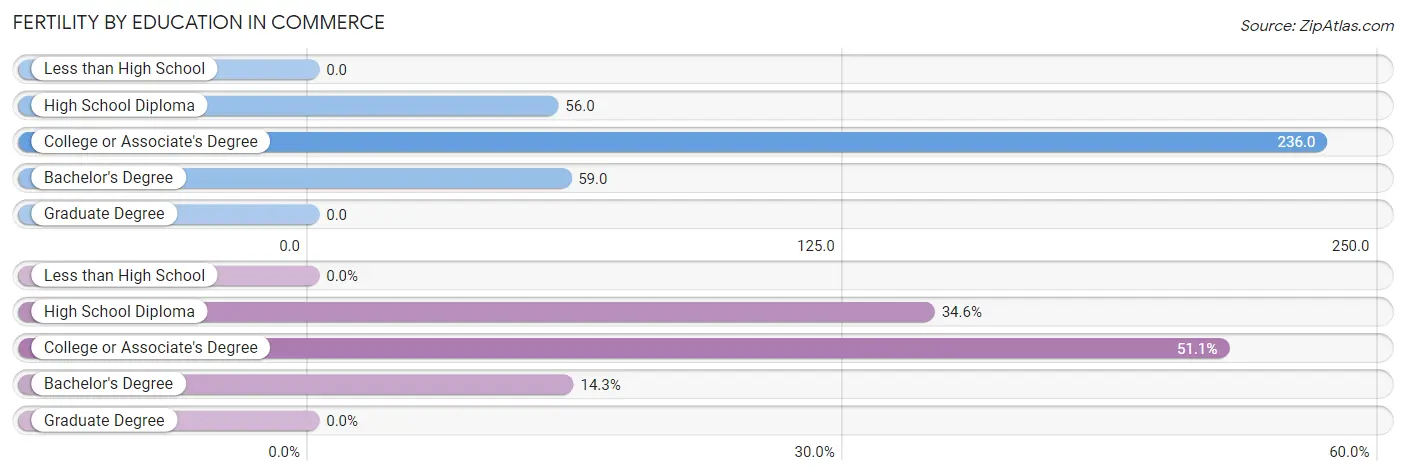
| Educational Attainment | Women with Births | Births / 1,000 Women |
| Less than High School | 0 (0.0%) | 0.0 |
| High School Diploma | 46 (34.6%) | 56.0 |
| College or Associate's Degree | 68 (51.1%) | 236.0 |
| Bachelor's Degree | 19 (14.3%) | 59.0 |
| Graduate Degree | 0 (0.0%) | 0.0 |
| Total | 133 (100.0%) | 75.0 |
Fertility by Education by Marriage Status in Commerce
13.5% of women with births in Commerce are unmarried. Women with the educational attainment of college or associate's degree are most likely to be married with 100.0% of them married at childbirth, while women with the educational attainment of high school diploma are least likely to be married with 39.1% of them unmarried at childbirth.
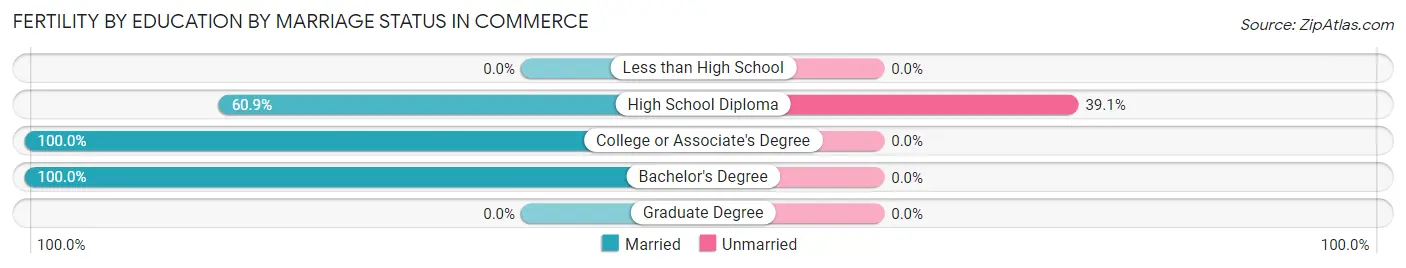
| Educational Attainment | Married | Unmarried |
| Less than High School | 0 (0.0%) | 0 (0.0%) |
| High School Diploma | 28 (60.9%) | 18 (39.1%) |
| College or Associate's Degree | 68 (100.0%) | 0 (0.0%) |
| Bachelor's Degree | 19 (100.0%) | 0 (0.0%) |
| Graduate Degree | 0 (0.0%) | 0 (0.0%) |
| Total | 115 (86.5%) | 18 (13.5%) |
Employment Characteristics in Commerce
Employment by Class of Employer in Commerce
Among the 3,229 employed individuals in Commerce, private company employees (2,191 | 67.8%), local government employees (534 | 16.5%), and self-employed (not incorporated) (151 | 4.7%) make up the most common classes of employment.
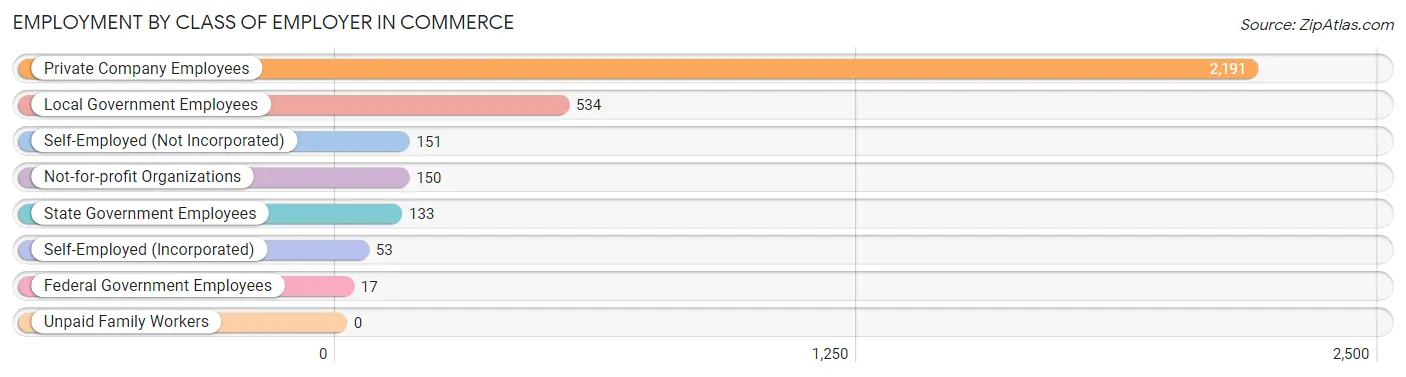
| Employer Class | # Employees | % Employees |
| Private Company Employees | 2,191 | 67.8% |
| Self-Employed (Incorporated) | 53 | 1.6% |
| Self-Employed (Not Incorporated) | 151 | 4.7% |
| Not-for-profit Organizations | 150 | 4.6% |
| Local Government Employees | 534 | 16.5% |
| State Government Employees | 133 | 4.1% |
| Federal Government Employees | 17 | 0.5% |
| Unpaid Family Workers | 0 | 0.0% |
| Total | 3,229 | 100.0% |
Employment Status by Age in Commerce
According to the labor force statistics for Commerce, out of the total population over 16 years of age (5,622), 57.7% or 3,244 individuals are in the labor force, with 0.2% or 6 of them unemployed. The age group with the highest labor force participation rate is 55 to 59 years, with 91.4% or 246 individuals in the labor force. Within the labor force, the 75 years and over age range has the highest percentage of unemployed individuals, with 31.6% or 6 of them being unemployed.
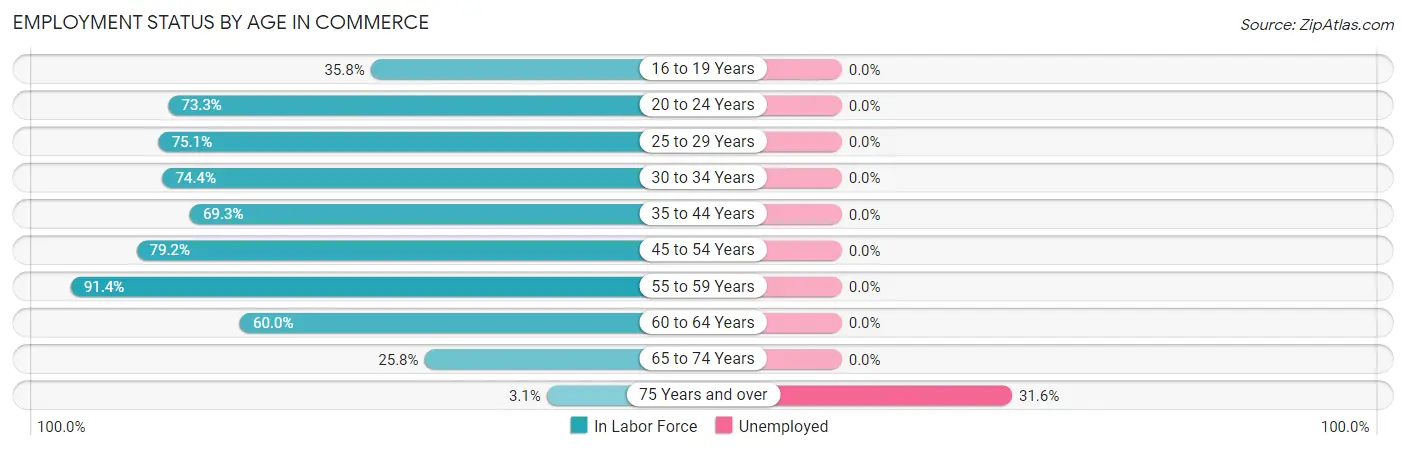
| Age Bracket | In Labor Force | Unemployed |
| 16 to 19 Years | 176 (35.8%) | 0 (0.0%) |
| 20 to 24 Years | 189 (73.3%) | 0 (0.0%) |
| 25 to 29 Years | 340 (75.1%) | 0 (0.0%) |
| 30 to 34 Years | 552 (74.4%) | 0 (0.0%) |
| 35 to 44 Years | 784 (69.3%) | 0 (0.0%) |
| 45 to 54 Years | 543 (79.2%) | 0 (0.0%) |
| 55 to 59 Years | 246 (91.4%) | 0 (0.0%) |
| 60 to 64 Years | 244 (60.0%) | 0 (0.0%) |
| 65 to 74 Years | 150 (25.8%) | 0 (0.0%) |
| 75 Years and over | 19 (3.1%) | 6 (31.6%) |
| Total | 3,244 (57.7%) | 6 (0.2%) |
Employment Status by Educational Attainment in Commerce
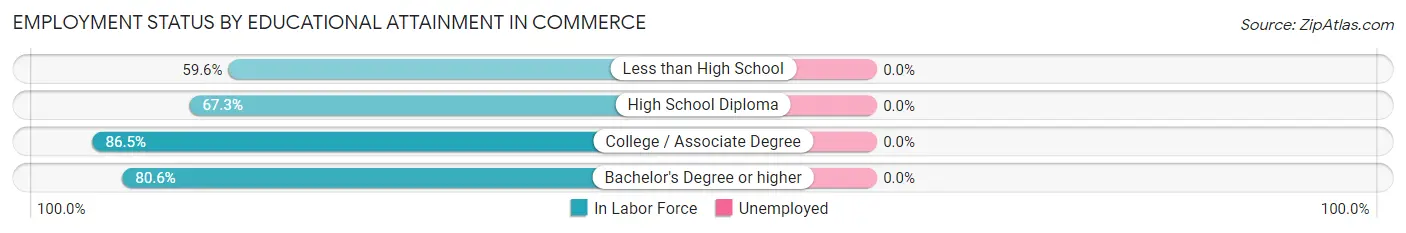
| Educational Attainment | In Labor Force | Unemployed |
| Less than High School | 321 (59.6%) | 0 (0.0%) |
| High School Diploma | 1,047 (67.3%) | 0 (0.0%) |
| College / Associate Degree | 843 (86.5%) | 0 (0.0%) |
| Bachelor's Degree or higher | 498 (80.6%) | 0 (0.0%) |
| Total | 2,711 (73.5%) | 0 (0.0%) |
Employment Occupations by Sex in Commerce
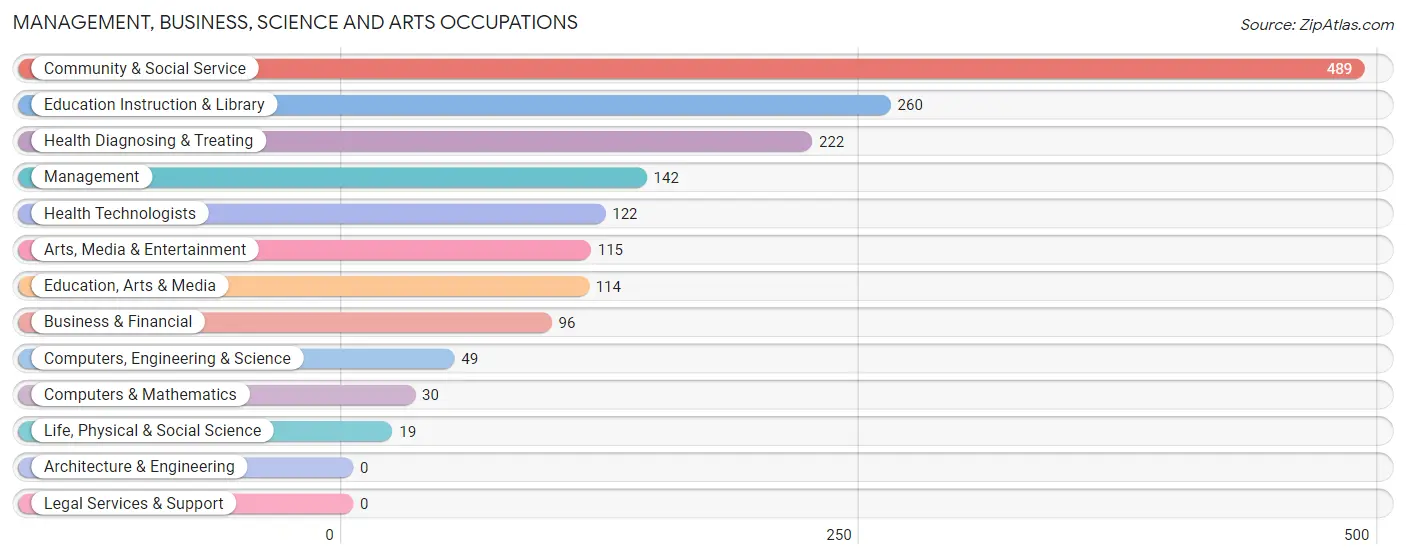
Management, Business, Science and Arts Occupations
The most common Management, Business, Science and Arts occupations in Commerce are Community & Social Service (489 | 15.1%), Education Instruction & Library (260 | 8.0%), Health Diagnosing & Treating (222 | 6.9%), Management (142 | 4.4%), and Health Technologists (122 | 3.8%).
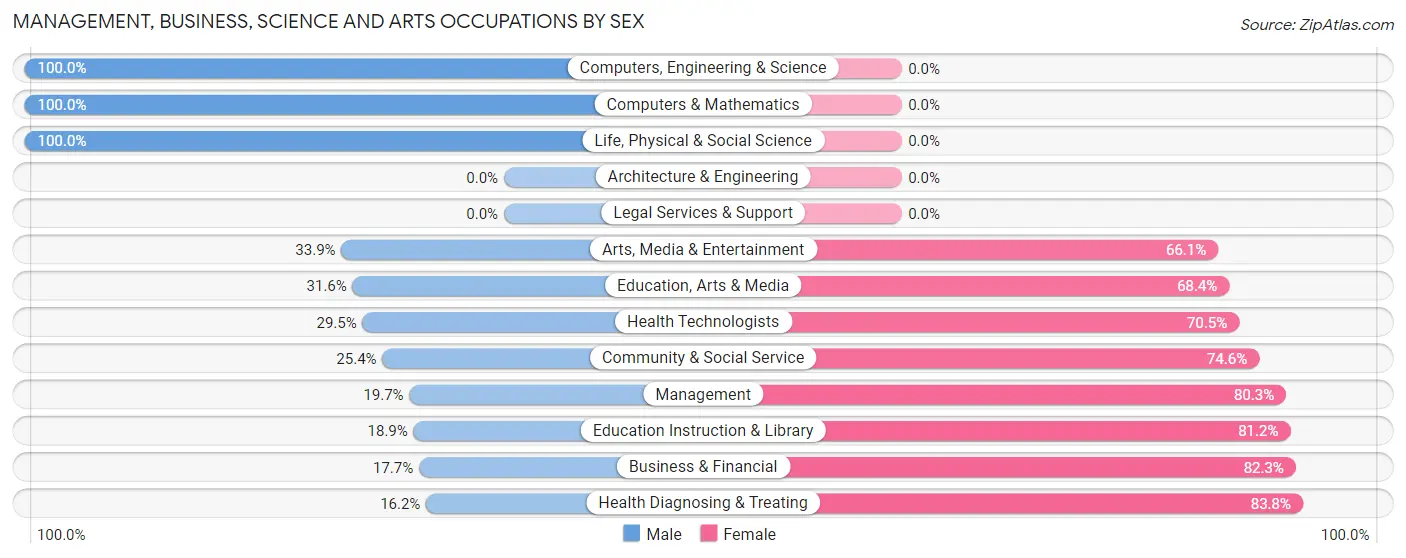
Management, Business, Science and Arts Occupations by Sex
Within the Management, Business, Science and Arts occupations in Commerce, the most male-oriented occupations are Computers, Engineering & Science (100.0%), Computers & Mathematics (100.0%), and Life, Physical & Social Science (100.0%), while the most female-oriented occupations are Health Diagnosing & Treating (83.8%), Business & Financial (82.3%), and Education Instruction & Library (81.1%).
| Occupation | Male | Female |
| Management | 28 (19.7%) | 114 (80.3%) |
| Business & Financial | 17 (17.7%) | 79 (82.3%) |
| Computers, Engineering & Science | 49 (100.0%) | 0 (0.0%) |
| Computers & Mathematics | 30 (100.0%) | 0 (0.0%) |
| Architecture & Engineering | 0 (0.0%) | 0 (0.0%) |
| Life, Physical & Social Science | 19 (100.0%) | 0 (0.0%) |
| Community & Social Service | 124 (25.4%) | 365 (74.6%) |
| Education, Arts & Media | 36 (31.6%) | 78 (68.4%) |
| Legal Services & Support | 0 (0.0%) | 0 (0.0%) |
| Education Instruction & Library | 49 (18.9%) | 211 (81.1%) |
| Arts, Media & Entertainment | 39 (33.9%) | 76 (66.1%) |
| Health Diagnosing & Treating | 36 (16.2%) | 186 (83.8%) |
| Health Technologists | 36 (29.5%) | 86 (70.5%) |
| Total (Category) | 254 (25.5%) | 744 (74.6%) |
| Total (Overall) | 1,694 (52.3%) | 1,543 (47.7%) |
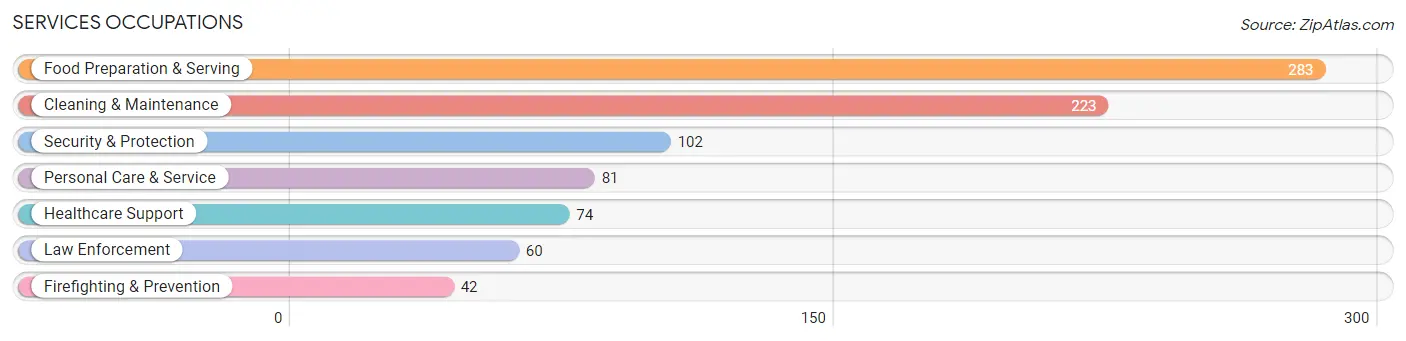
Services Occupations
The most common Services occupations in Commerce are Food Preparation & Serving (283 | 8.7%), Cleaning & Maintenance (223 | 6.9%), Security & Protection (102 | 3.2%), Personal Care & Service (81 | 2.5%), and Healthcare Support (74 | 2.3%).
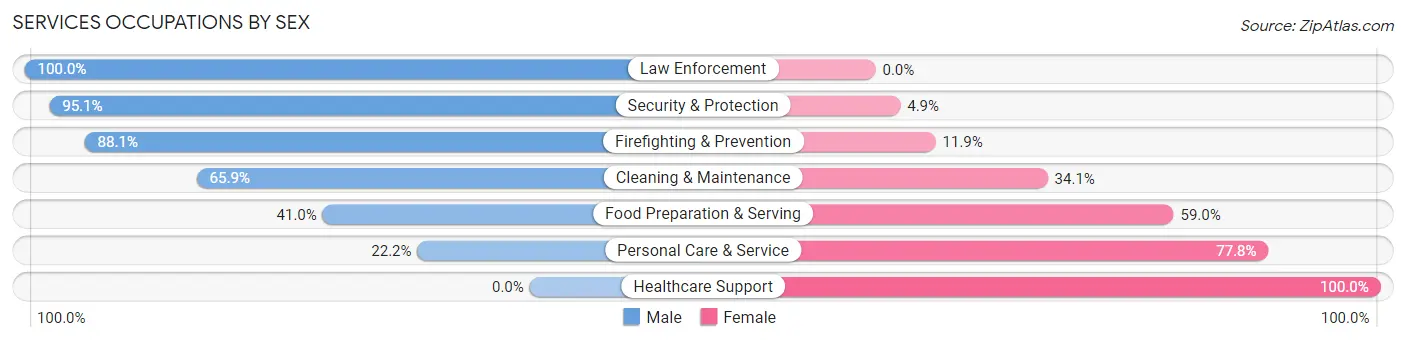
Services Occupations by Sex
Within the Services occupations in Commerce, the most male-oriented occupations are Law Enforcement (100.0%), Security & Protection (95.1%), and Firefighting & Prevention (88.1%), while the most female-oriented occupations are Healthcare Support (100.0%), Personal Care & Service (77.8%), and Food Preparation & Serving (59.0%).
| Occupation | Male | Female |
| Healthcare Support | 0 (0.0%) | 74 (100.0%) |
| Security & Protection | 97 (95.1%) | 5 (4.9%) |
| Firefighting & Prevention | 37 (88.1%) | 5 (11.9%) |
| Law Enforcement | 60 (100.0%) | 0 (0.0%) |
| Food Preparation & Serving | 116 (41.0%) | 167 (59.0%) |
| Cleaning & Maintenance | 147 (65.9%) | 76 (34.1%) |
| Personal Care & Service | 18 (22.2%) | 63 (77.8%) |
| Total (Category) | 378 (49.5%) | 385 (50.5%) |
| Total (Overall) | 1,694 (52.3%) | 1,543 (47.7%) |
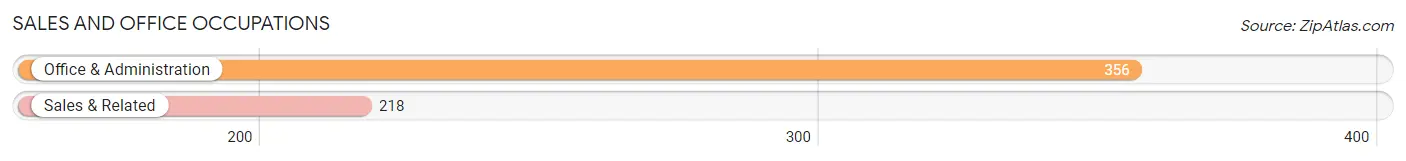
Sales and Office Occupations
The most common Sales and Office occupations in Commerce are Office & Administration (356 | 11.0%), and Sales & Related (218 | 6.7%).
Sales and Office Occupations by Sex
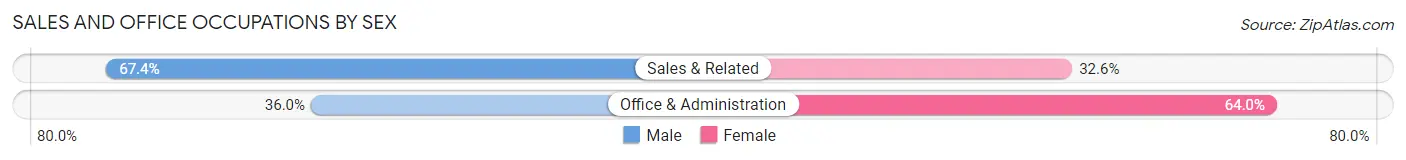
| Occupation | Male | Female |
| Sales & Related | 147 (67.4%) | 71 (32.6%) |
| Office & Administration | 128 (36.0%) | 228 (64.0%) |
| Total (Category) | 275 (47.9%) | 299 (52.1%) |
| Total (Overall) | 1,694 (52.3%) | 1,543 (47.7%) |
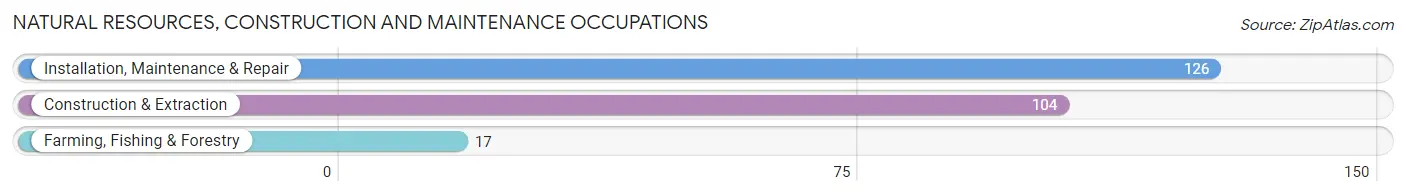
Natural Resources, Construction and Maintenance Occupations
The most common Natural Resources, Construction and Maintenance occupations in Commerce are Installation, Maintenance & Repair (126 | 3.9%), Construction & Extraction (104 | 3.2%), and Farming, Fishing & Forestry (17 | 0.5%).
Natural Resources, Construction and Maintenance Occupations by Sex
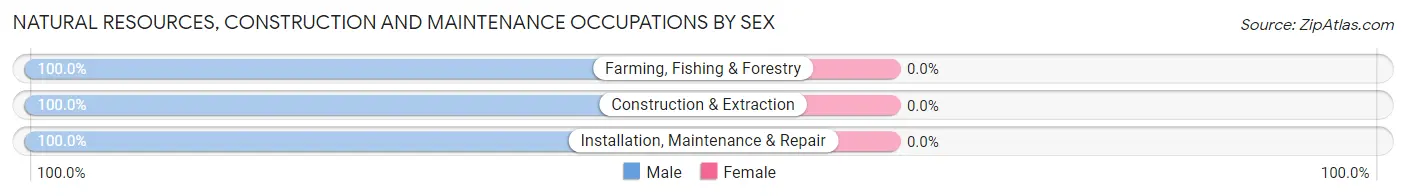
| Occupation | Male | Female |
| Farming, Fishing & Forestry | 17 (100.0%) | 0 (0.0%) |
| Construction & Extraction | 104 (100.0%) | 0 (0.0%) |
| Installation, Maintenance & Repair | 126 (100.0%) | 0 (0.0%) |
| Total (Category) | 247 (100.0%) | 0 (0.0%) |
| Total (Overall) | 1,694 (52.3%) | 1,543 (47.7%) |
Production, Transportation and Moving Occupations
The most common Production, Transportation and Moving occupations in Commerce are Production (315 | 9.7%), Material Moving (243 | 7.5%), and Transportation (97 | 3.0%).
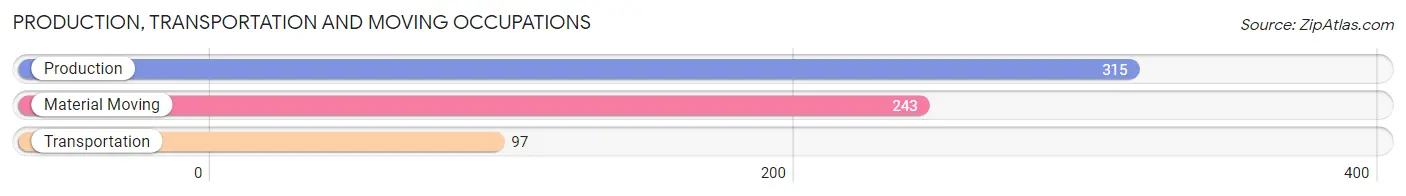
Production, Transportation and Moving Occupations by Sex
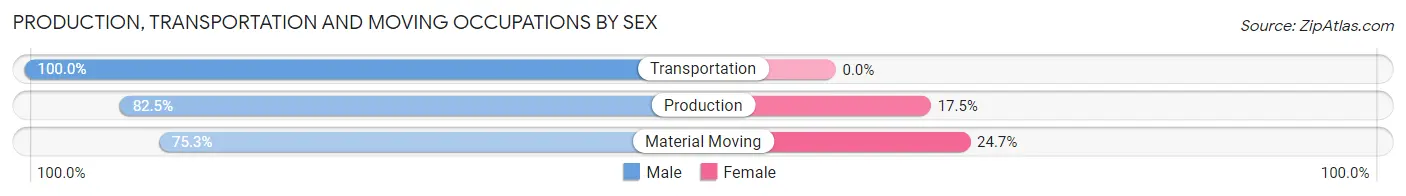
| Occupation | Male | Female |
| Production | 260 (82.5%) | 55 (17.5%) |
| Transportation | 97 (100.0%) | 0 (0.0%) |
| Material Moving | 183 (75.3%) | 60 (24.7%) |
| Total (Category) | 540 (82.4%) | 115 (17.6%) |
| Total (Overall) | 1,694 (52.3%) | 1,543 (47.7%) |
Employment Industries by Sex in Commerce
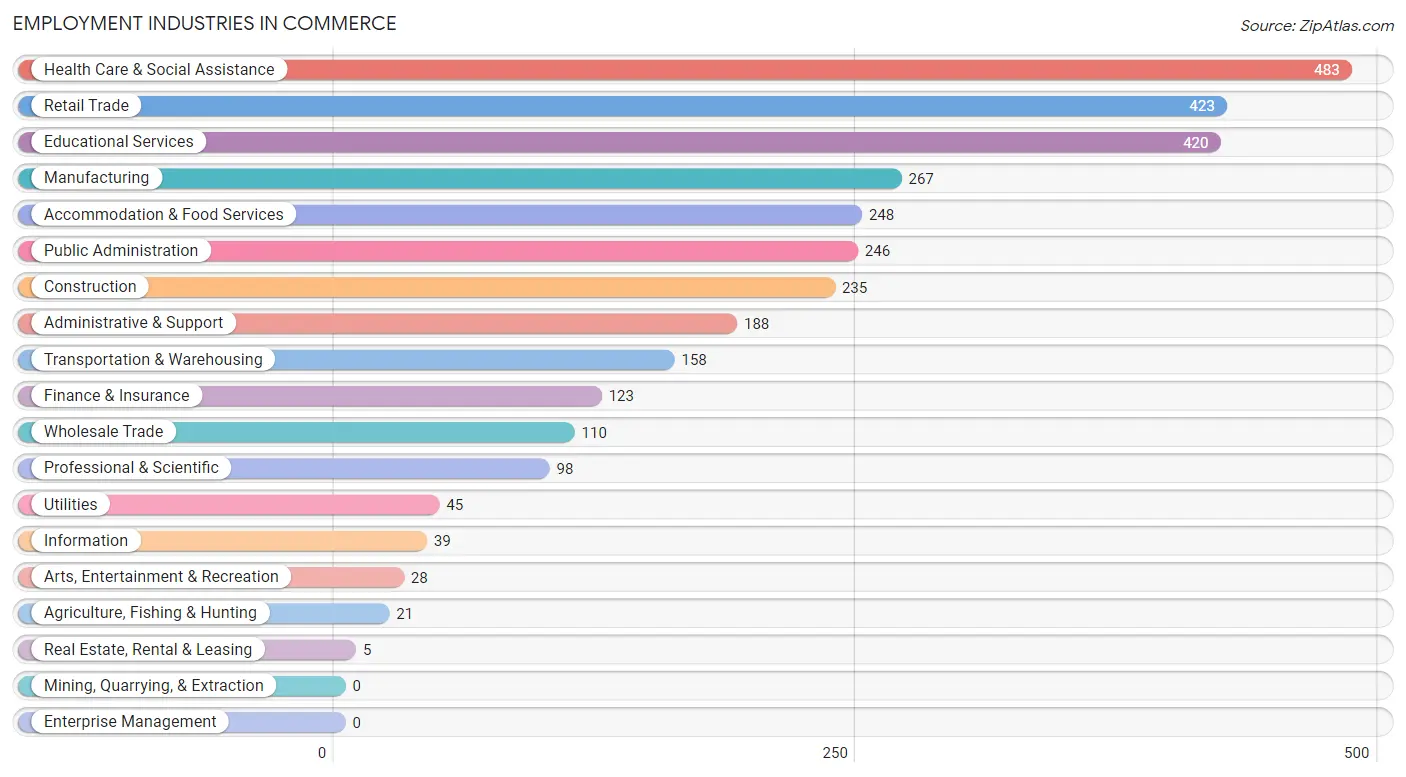
Employment Industries in Commerce
The major employment industries in Commerce include Health Care & Social Assistance (483 | 14.9%), Retail Trade (423 | 13.1%), Educational Services (420 | 13.0%), Manufacturing (267 | 8.3%), and Accommodation & Food Services (248 | 7.7%).
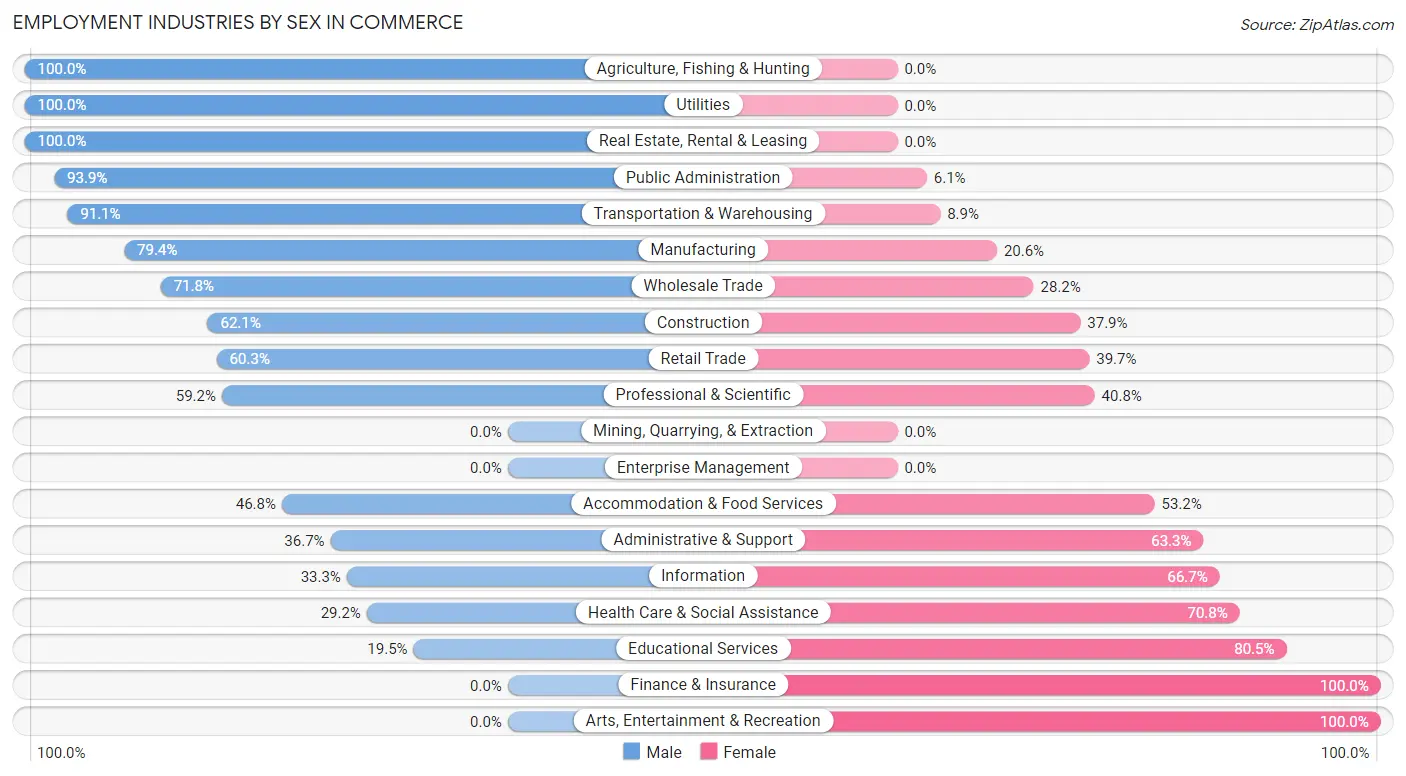
Employment Industries by Sex in Commerce
The Commerce industries that see more men than women are Agriculture, Fishing & Hunting (100.0%), Utilities (100.0%), and Real Estate, Rental & Leasing (100.0%), whereas the industries that tend to have a higher number of women are Finance & Insurance (100.0%), Arts, Entertainment & Recreation (100.0%), and Educational Services (80.5%).
| Industry | Male | Female |
| Agriculture, Fishing & Hunting | 21 (100.0%) | 0 (0.0%) |
| Mining, Quarrying, & Extraction | 0 (0.0%) | 0 (0.0%) |
| Construction | 146 (62.1%) | 89 (37.9%) |
| Manufacturing | 212 (79.4%) | 55 (20.6%) |
| Wholesale Trade | 79 (71.8%) | 31 (28.2%) |
| Retail Trade | 255 (60.3%) | 168 (39.7%) |
| Transportation & Warehousing | 144 (91.1%) | 14 (8.9%) |
| Utilities | 45 (100.0%) | 0 (0.0%) |
| Information | 13 (33.3%) | 26 (66.7%) |
| Finance & Insurance | 0 (0.0%) | 123 (100.0%) |
| Real Estate, Rental & Leasing | 5 (100.0%) | 0 (0.0%) |
| Professional & Scientific | 58 (59.2%) | 40 (40.8%) |
| Enterprise Management | 0 (0.0%) | 0 (0.0%) |
| Administrative & Support | 69 (36.7%) | 119 (63.3%) |
| Educational Services | 82 (19.5%) | 338 (80.5%) |
| Health Care & Social Assistance | 141 (29.2%) | 342 (70.8%) |
| Arts, Entertainment & Recreation | 0 (0.0%) | 28 (100.0%) |
| Accommodation & Food Services | 116 (46.8%) | 132 (53.2%) |
| Public Administration | 231 (93.9%) | 15 (6.1%) |
| Total | 1,694 (52.3%) | 1,543 (47.7%) |
Education in Commerce
School Enrollment in Commerce
The most common levels of schooling among the 1,902 students in Commerce are middle school (654 | 34.4%), high school (442 | 23.2%), and elementary school (398 | 20.9%).
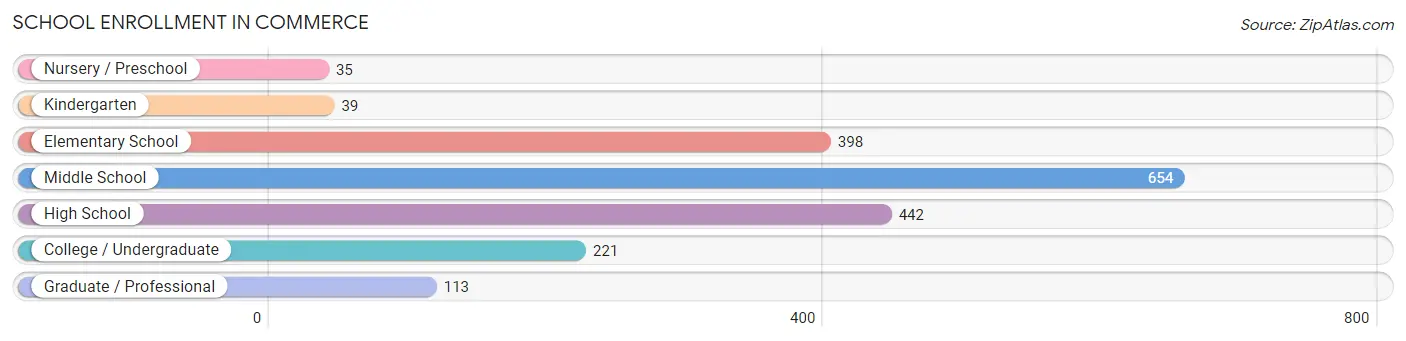
| School Level | # Students | % Students |
| Nursery / Preschool | 35 | 1.8% |
| Kindergarten | 39 | 2.1% |
| Elementary School | 398 | 20.9% |
| Middle School | 654 | 34.4% |
| High School | 442 | 23.2% |
| College / Undergraduate | 221 | 11.6% |
| Graduate / Professional | 113 | 5.9% |
| Total | 1,902 | 100.0% |
School Enrollment by Age by Funding Source in Commerce
Out of a total of 1,902 students who are enrolled in schools in Commerce, 93 (4.9%) attend a private institution, while the remaining 1,809 (95.1%) are enrolled in public schools. The age group of 3 to 4 year olds has the highest likelihood of being enrolled in private schools, with 8 (22.9% in the age bracket) enrolled. Conversely, the age group of 10 to 14 year olds has the lowest likelihood of being enrolled in a private school, with 686 (100.0% in the age bracket) attending a public institution.
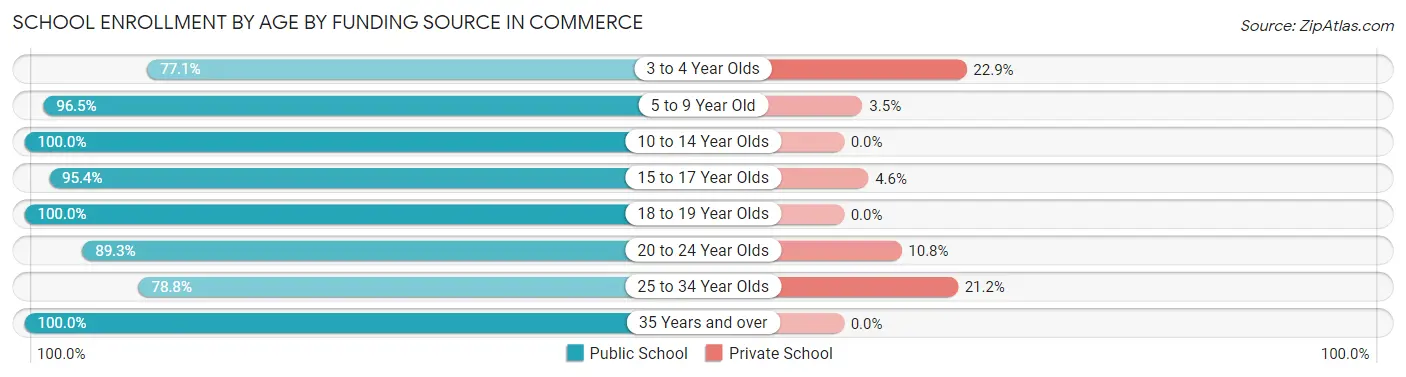
| Age Bracket | Public School | Private School |
| 3 to 4 Year Olds | 27 (77.1%) | 8 (22.9%) |
| 5 to 9 Year Old | 359 (96.5%) | 13 (3.5%) |
| 10 to 14 Year Olds | 686 (100.0%) | 0 (0.0%) |
| 15 to 17 Year Olds | 439 (95.4%) | 21 (4.6%) |
| 18 to 19 Year Olds | 40 (100.0%) | 0 (0.0%) |
| 20 to 24 Year Olds | 83 (89.2%) | 10 (10.7%) |
| 25 to 34 Year Olds | 152 (78.8%) | 41 (21.2%) |
| 35 Years and over | 23 (100.0%) | 0 (0.0%) |
| Total | 1,809 (95.1%) | 93 (4.9%) |
Educational Attainment by Field of Study in Commerce
Education (217 | 22.9%), business (140 | 14.8%), science & technology (108 | 11.4%), social sciences (94 | 9.9%), and literature & languages (86 | 9.1%) are the most common fields of study among 946 individuals in Commerce who have obtained a bachelor's degree or higher.
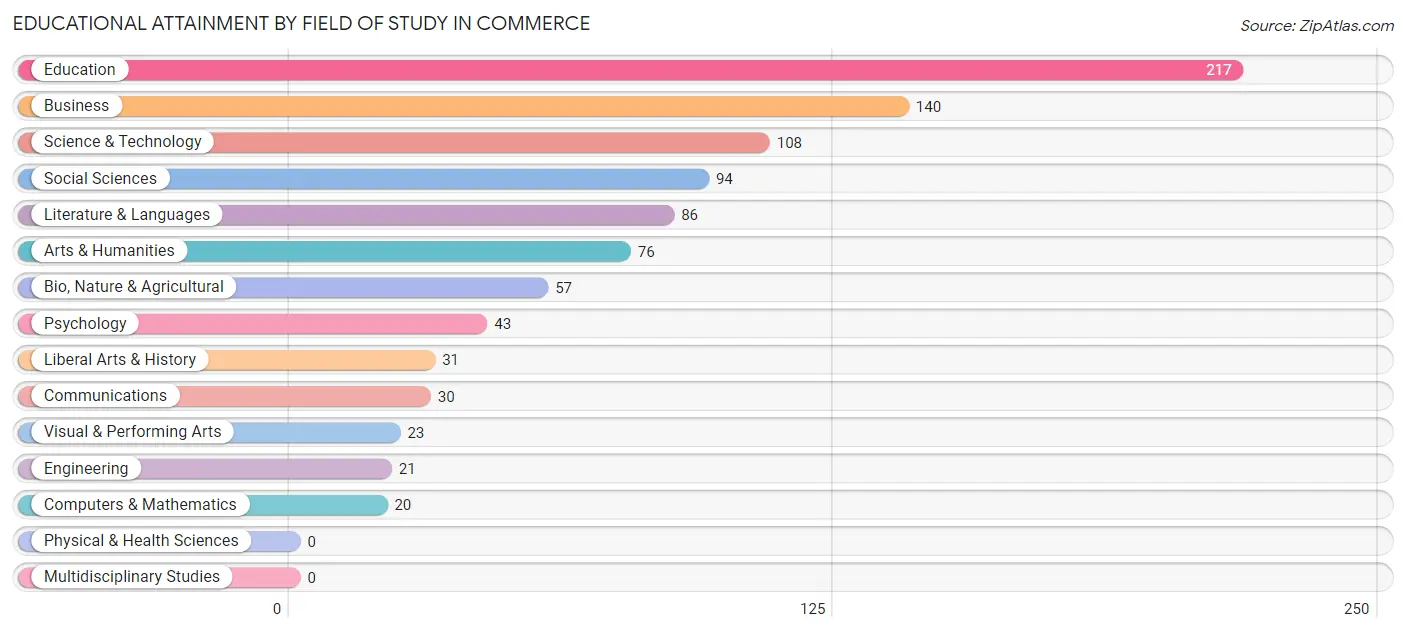
| Field of Study | # Graduates | % Graduates |
| Computers & Mathematics | 20 | 2.1% |
| Bio, Nature & Agricultural | 57 | 6.0% |
| Physical & Health Sciences | 0 | 0.0% |
| Psychology | 43 | 4.5% |
| Social Sciences | 94 | 9.9% |
| Engineering | 21 | 2.2% |
| Multidisciplinary Studies | 0 | 0.0% |
| Science & Technology | 108 | 11.4% |
| Business | 140 | 14.8% |
| Education | 217 | 22.9% |
| Literature & Languages | 86 | 9.1% |
| Liberal Arts & History | 31 | 3.3% |
| Visual & Performing Arts | 23 | 2.4% |
| Communications | 30 | 3.2% |
| Arts & Humanities | 76 | 8.0% |
| Total | 946 | 100.0% |
Transportation & Commute in Commerce
Vehicle Availability by Sex in Commerce
The most prevalent vehicle ownership categories in Commerce are males with 2 vehicles (851, accounting for 50.5%) and females with 2 vehicles (683, making up 55.1%).
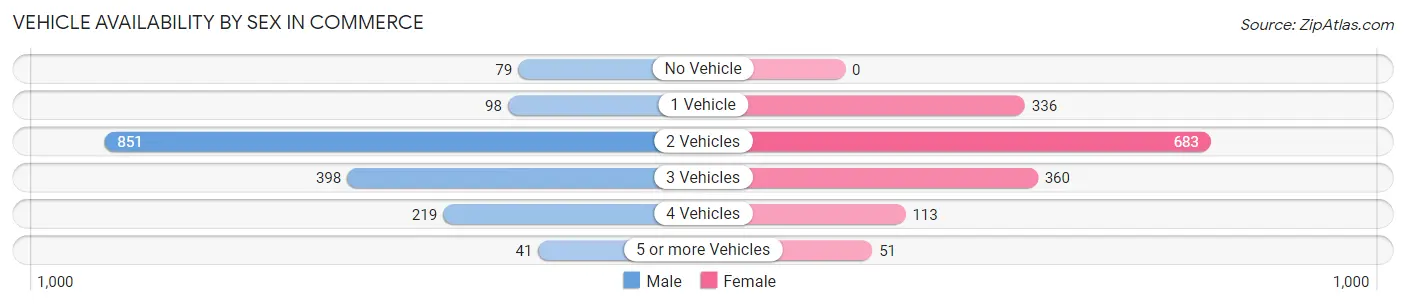
| Vehicles Available | Male | Female |
| No Vehicle | 79 (4.7%) | 0 (0.0%) |
| 1 Vehicle | 98 (5.8%) | 336 (21.8%) |
| 2 Vehicles | 851 (50.5%) | 683 (44.3%) |
| 3 Vehicles | 398 (23.6%) | 360 (23.3%) |
| 4 Vehicles | 219 (13.0%) | 113 (7.3%) |
| 5 or more Vehicles | 41 (2.4%) | 51 (3.3%) |
| Total | 1,686 (100.0%) | 1,543 (100.0%) |
Commute Time in Commerce
The most frequently occuring commute durations in Commerce are 5 to 9 minutes (683 commuters, 22.3%), 10 to 14 minutes (581 commuters, 19.0%), and 15 to 19 minutes (428 commuters, 14.0%).
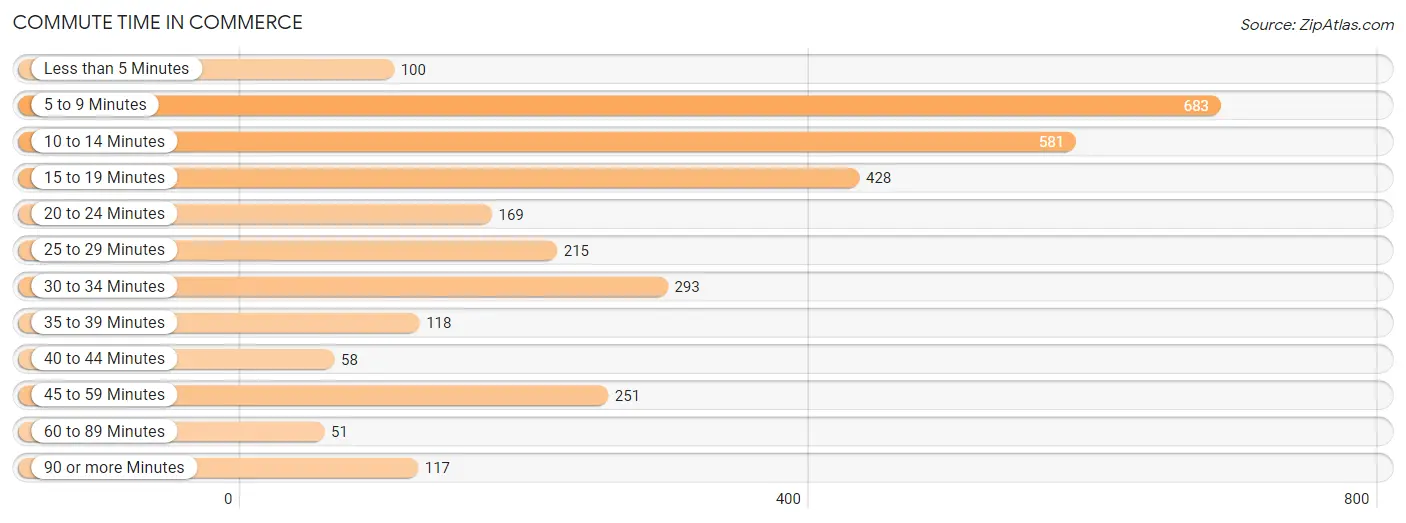
| Commute Time | # Commuters | % Commuters |
| Less than 5 Minutes | 100 | 3.3% |
| 5 to 9 Minutes | 683 | 22.3% |
| 10 to 14 Minutes | 581 | 19.0% |
| 15 to 19 Minutes | 428 | 14.0% |
| 20 to 24 Minutes | 169 | 5.5% |
| 25 to 29 Minutes | 215 | 7.0% |
| 30 to 34 Minutes | 293 | 9.6% |
| 35 to 39 Minutes | 118 | 3.8% |
| 40 to 44 Minutes | 58 | 1.9% |
| 45 to 59 Minutes | 251 | 8.2% |
| 60 to 89 Minutes | 51 | 1.7% |
| 90 or more Minutes | 117 | 3.8% |
Commute Time by Sex in Commerce
The most common commute times in Commerce are 5 to 9 minutes (383 commuters, 23.0%) for males and 10 to 14 minutes (350 commuters, 25.0%) for females.
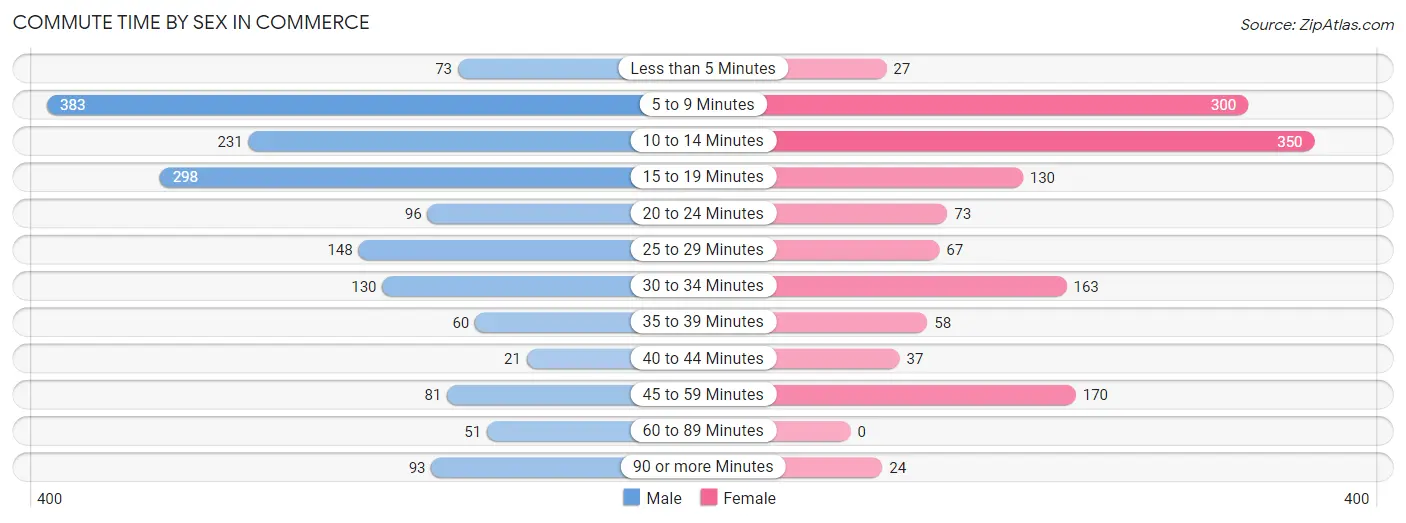
| Commute Time | Male | Female |
| Less than 5 Minutes | 73 (4.4%) | 27 (1.9%) |
| 5 to 9 Minutes | 383 (23.0%) | 300 (21.4%) |
| 10 to 14 Minutes | 231 (13.9%) | 350 (25.0%) |
| 15 to 19 Minutes | 298 (17.9%) | 130 (9.3%) |
| 20 to 24 Minutes | 96 (5.8%) | 73 (5.2%) |
| 25 to 29 Minutes | 148 (8.9%) | 67 (4.8%) |
| 30 to 34 Minutes | 130 (7.8%) | 163 (11.7%) |
| 35 to 39 Minutes | 60 (3.6%) | 58 (4.2%) |
| 40 to 44 Minutes | 21 (1.3%) | 37 (2.6%) |
| 45 to 59 Minutes | 81 (4.9%) | 170 (12.1%) |
| 60 to 89 Minutes | 51 (3.1%) | 0 (0.0%) |
| 90 or more Minutes | 93 (5.6%) | 24 (1.7%) |
Time of Departure to Work by Sex in Commerce
The most frequent times of departure to work in Commerce are 7:30 AM to 7:59 AM (283, 17.0%) for males and 6:00 AM to 6:29 AM (213, 15.2%) for females.
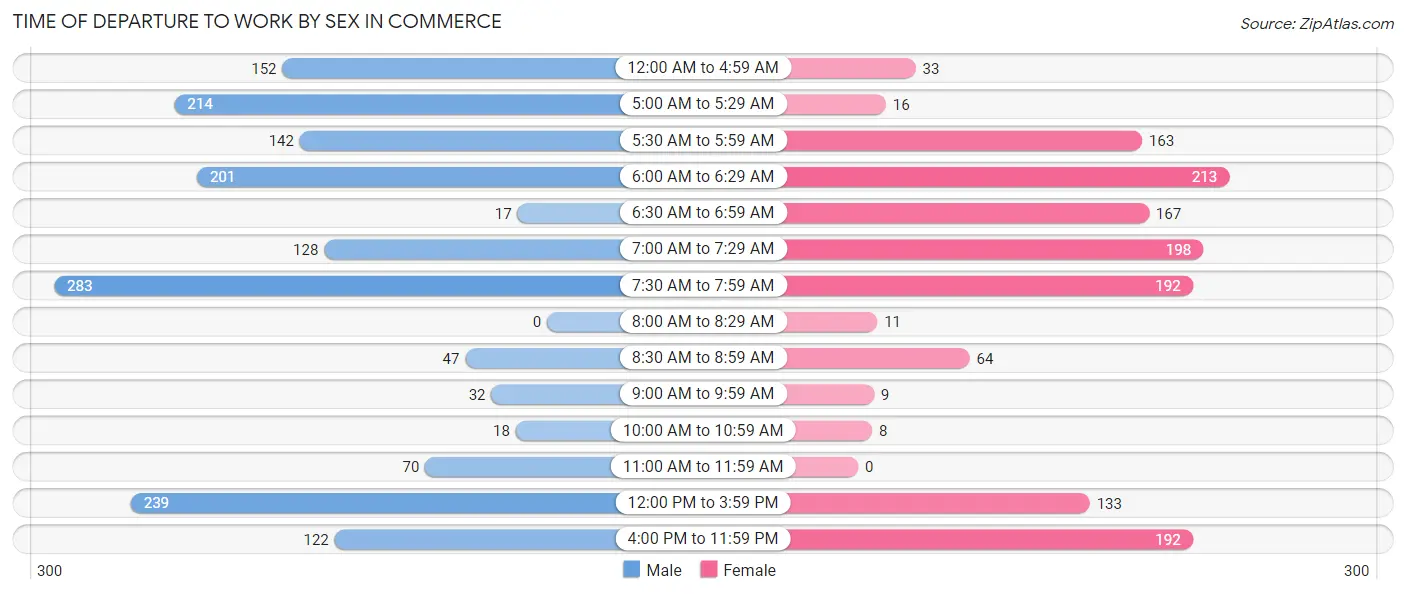
| Time of Departure | Male | Female |
| 12:00 AM to 4:59 AM | 152 (9.1%) | 33 (2.4%) |
| 5:00 AM to 5:29 AM | 214 (12.9%) | 16 (1.1%) |
| 5:30 AM to 5:59 AM | 142 (8.5%) | 163 (11.7%) |
| 6:00 AM to 6:29 AM | 201 (12.1%) | 213 (15.2%) |
| 6:30 AM to 6:59 AM | 17 (1.0%) | 167 (11.9%) |
| 7:00 AM to 7:29 AM | 128 (7.7%) | 198 (14.1%) |
| 7:30 AM to 7:59 AM | 283 (17.0%) | 192 (13.7%) |
| 8:00 AM to 8:29 AM | 0 (0.0%) | 11 (0.8%) |
| 8:30 AM to 8:59 AM | 47 (2.8%) | 64 (4.6%) |
| 9:00 AM to 9:59 AM | 32 (1.9%) | 9 (0.6%) |
| 10:00 AM to 10:59 AM | 18 (1.1%) | 8 (0.6%) |
| 11:00 AM to 11:59 AM | 70 (4.2%) | 0 (0.0%) |
| 12:00 PM to 3:59 PM | 239 (14.3%) | 133 (9.5%) |
| 4:00 PM to 11:59 PM | 122 (7.3%) | 192 (13.7%) |
| Total | 1,665 (100.0%) | 1,399 (100.0%) |
Housing Occupancy in Commerce
Occupancy by Ownership in Commerce
Of the total 2,451 dwellings in Commerce, owner-occupied units account for 1,619 (66.0%), while renter-occupied units make up 832 (34.0%).
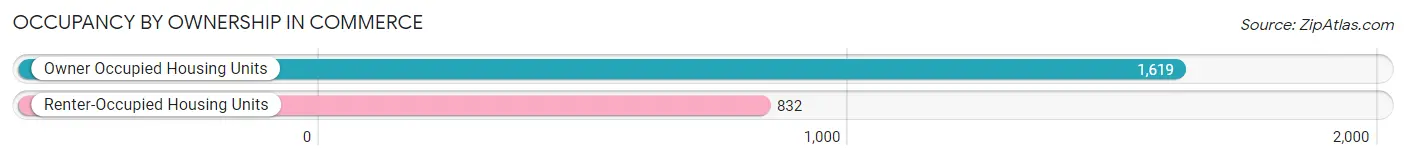
| Occupancy | # Housing Units | % Housing Units |
| Owner Occupied Housing Units | 1,619 | 66.0% |
| Renter-Occupied Housing Units | 832 | 34.0% |
| Total Occupied Housing Units | 2,451 | 100.0% |
Occupancy by Household Size in Commerce
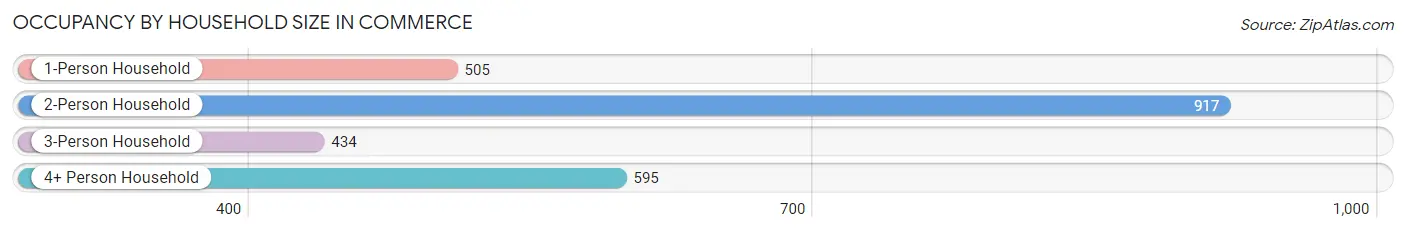
| Household Size | # Housing Units | % Housing Units |
| 1-Person Household | 505 | 20.6% |
| 2-Person Household | 917 | 37.4% |
| 3-Person Household | 434 | 17.7% |
| 4+ Person Household | 595 | 24.3% |
| Total Housing Units | 2,451 | 100.0% |
Occupancy by Ownership by Household Size in Commerce
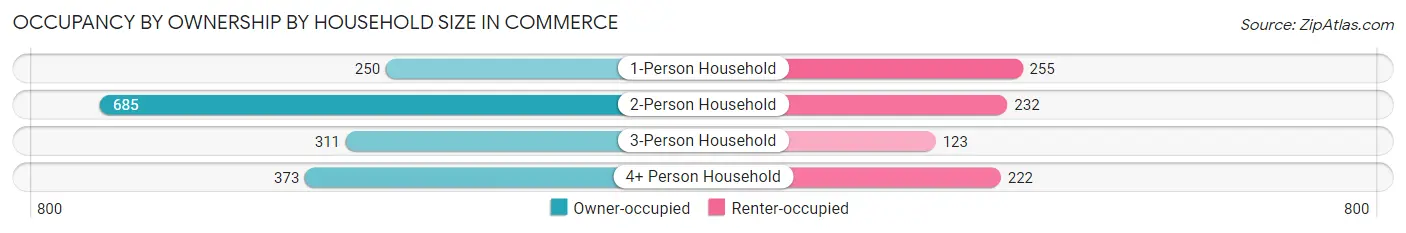
| Household Size | Owner-occupied | Renter-occupied |
| 1-Person Household | 250 (49.5%) | 255 (50.5%) |
| 2-Person Household | 685 (74.7%) | 232 (25.3%) |
| 3-Person Household | 311 (71.7%) | 123 (28.3%) |
| 4+ Person Household | 373 (62.7%) | 222 (37.3%) |
| Total Housing Units | 1,619 (66.0%) | 832 (34.0%) |
Occupancy by Educational Attainment in Commerce
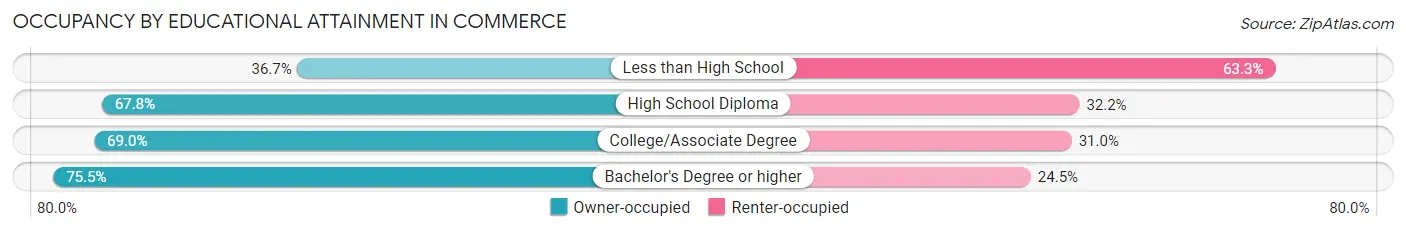
| Household Size | Owner-occupied | Renter-occupied |
| Less than High School | 105 (36.7%) | 181 (63.3%) |
| High School Diploma | 618 (67.8%) | 294 (32.2%) |
| College/Associate Degree | 527 (69.0%) | 237 (31.0%) |
| Bachelor's Degree or higher | 369 (75.5%) | 120 (24.5%) |
Occupancy by Age of Householder in Commerce
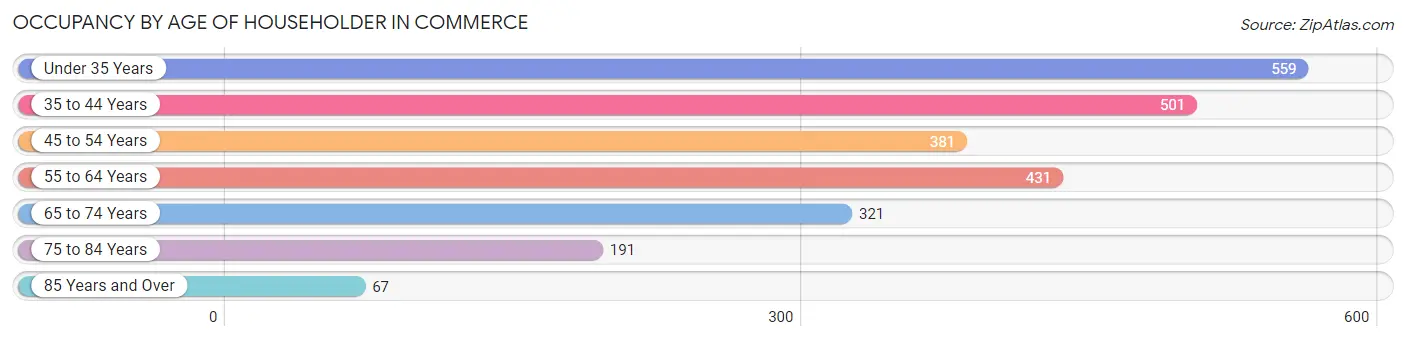
| Age Bracket | # Households | % Households |
| Under 35 Years | 559 | 22.8% |
| 35 to 44 Years | 501 | 20.4% |
| 45 to 54 Years | 381 | 15.5% |
| 55 to 64 Years | 431 | 17.6% |
| 65 to 74 Years | 321 | 13.1% |
| 75 to 84 Years | 191 | 7.8% |
| 85 Years and Over | 67 | 2.7% |
| Total | 2,451 | 100.0% |
Housing Finances in Commerce
Median Income by Occupancy in Commerce
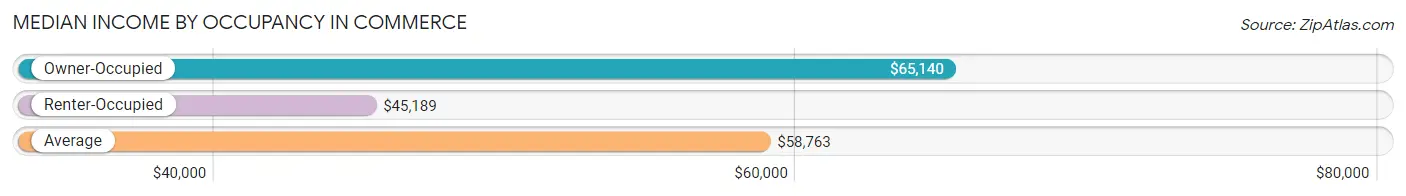
| Occupancy Type | # Households | Median Income |
| Owner-Occupied | 1,619 (66.0%) | $65,140 |
| Renter-Occupied | 832 (34.0%) | $45,189 |
| Average | 2,451 (100.0%) | $58,763 |
Occupancy by Householder Income Bracket in Commerce
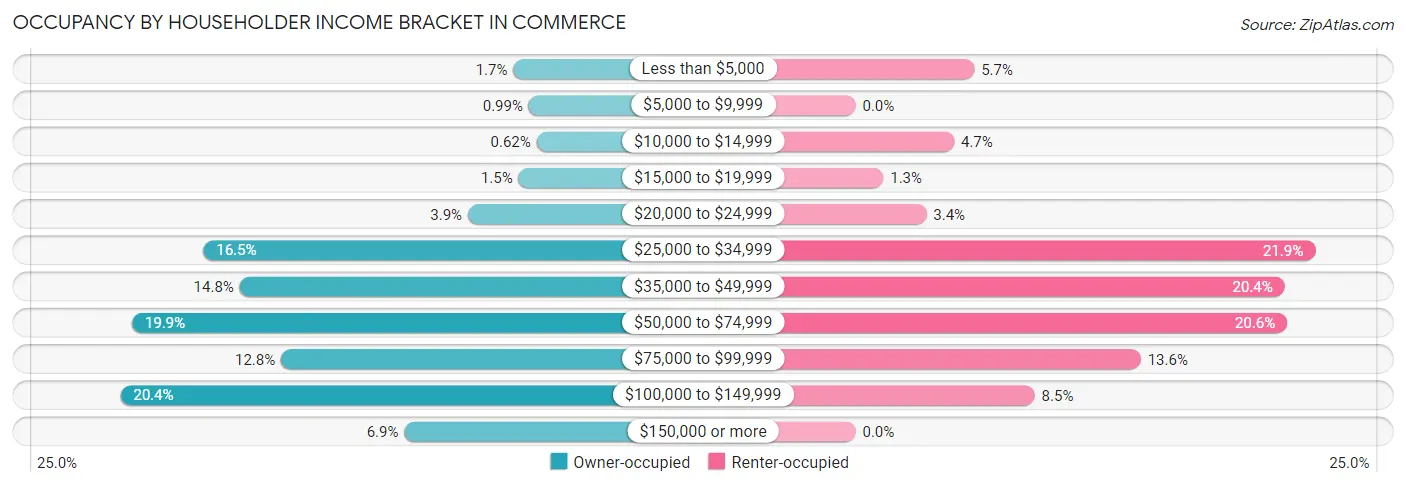
| Income Bracket | Owner-occupied | Renter-occupied |
| Less than $5,000 | 28 (1.7%) | 47 (5.7%) |
| $5,000 to $9,999 | 16 (1.0%) | 0 (0.0%) |
| $10,000 to $14,999 | 10 (0.6%) | 39 (4.7%) |
| $15,000 to $19,999 | 24 (1.5%) | 11 (1.3%) |
| $20,000 to $24,999 | 63 (3.9%) | 28 (3.4%) |
| $25,000 to $34,999 | 267 (16.5%) | 182 (21.9%) |
| $35,000 to $49,999 | 239 (14.8%) | 170 (20.4%) |
| $50,000 to $74,999 | 322 (19.9%) | 171 (20.5%) |
| $75,000 to $99,999 | 207 (12.8%) | 113 (13.6%) |
| $100,000 to $149,999 | 331 (20.4%) | 71 (8.5%) |
| $150,000 or more | 112 (6.9%) | 0 (0.0%) |
| Total | 1,619 (100.0%) | 832 (100.0%) |
Monthly Housing Cost Tiers in Commerce
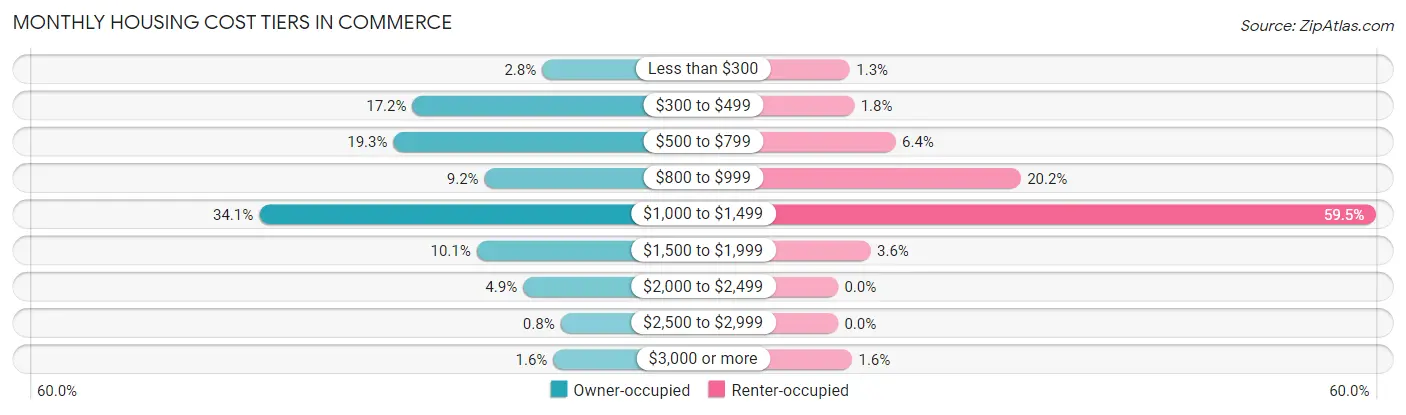
| Monthly Cost | Owner-occupied | Renter-occupied |
| Less than $300 | 46 (2.8%) | 11 (1.3%) |
| $300 to $499 | 278 (17.2%) | 15 (1.8%) |
| $500 to $799 | 312 (19.3%) | 53 (6.4%) |
| $800 to $999 | 149 (9.2%) | 168 (20.2%) |
| $1,000 to $1,499 | 552 (34.1%) | 495 (59.5%) |
| $1,500 to $1,999 | 163 (10.1%) | 30 (3.6%) |
| $2,000 to $2,499 | 80 (4.9%) | 0 (0.0%) |
| $2,500 to $2,999 | 13 (0.8%) | 0 (0.0%) |
| $3,000 or more | 26 (1.6%) | 13 (1.6%) |
| Total | 1,619 (100.0%) | 832 (100.0%) |
Physical Housing Characteristics in Commerce
Housing Structures in Commerce
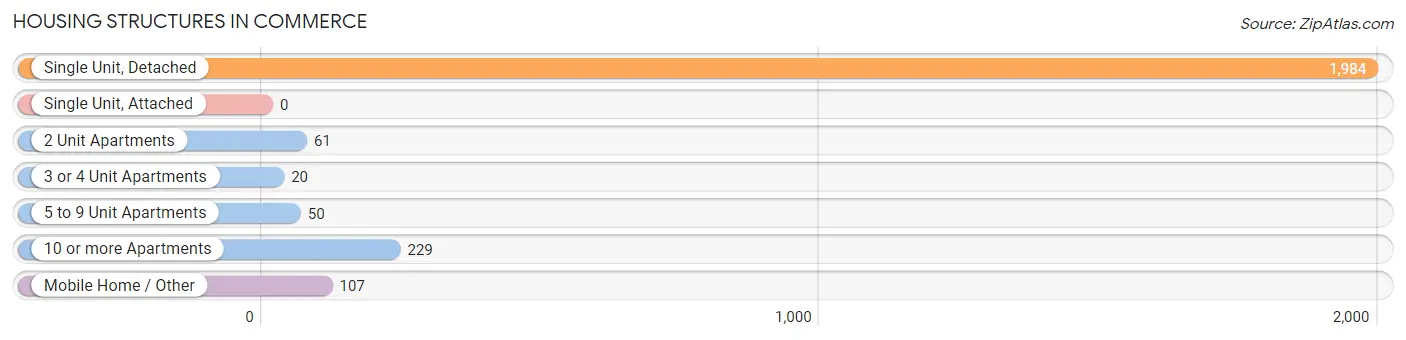
| Structure Type | # Housing Units | % Housing Units |
| Single Unit, Detached | 1,984 | 80.9% |
| Single Unit, Attached | 0 | 0.0% |
| 2 Unit Apartments | 61 | 2.5% |
| 3 or 4 Unit Apartments | 20 | 0.8% |
| 5 to 9 Unit Apartments | 50 | 2.0% |
| 10 or more Apartments | 229 | 9.3% |
| Mobile Home / Other | 107 | 4.4% |
| Total | 2,451 | 100.0% |
Housing Structures by Occupancy in Commerce
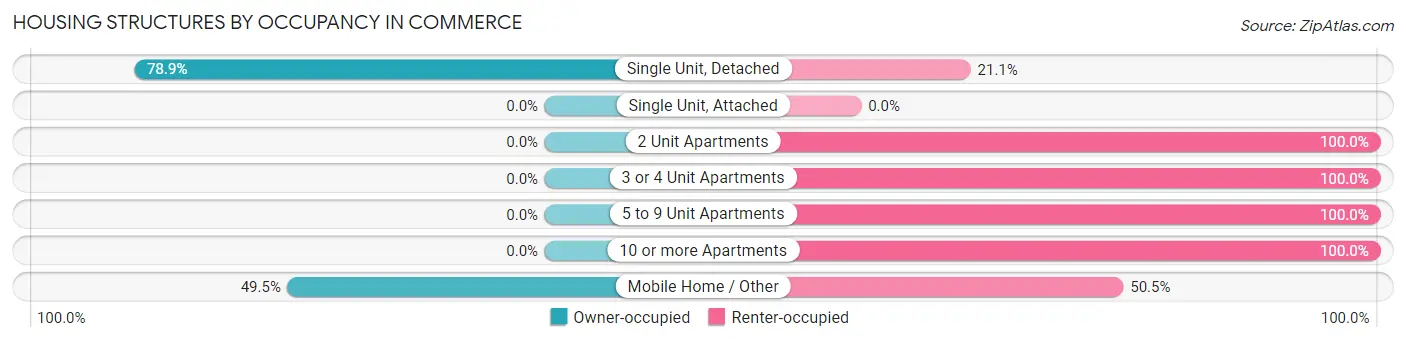
| Structure Type | Owner-occupied | Renter-occupied |
| Single Unit, Detached | 1,566 (78.9%) | 418 (21.1%) |
| Single Unit, Attached | 0 (0.0%) | 0 (0.0%) |
| 2 Unit Apartments | 0 (0.0%) | 61 (100.0%) |
| 3 or 4 Unit Apartments | 0 (0.0%) | 20 (100.0%) |
| 5 to 9 Unit Apartments | 0 (0.0%) | 50 (100.0%) |
| 10 or more Apartments | 0 (0.0%) | 229 (100.0%) |
| Mobile Home / Other | 53 (49.5%) | 54 (50.5%) |
| Total | 1,619 (66.0%) | 832 (34.0%) |
Housing Structures by Number of Rooms in Commerce
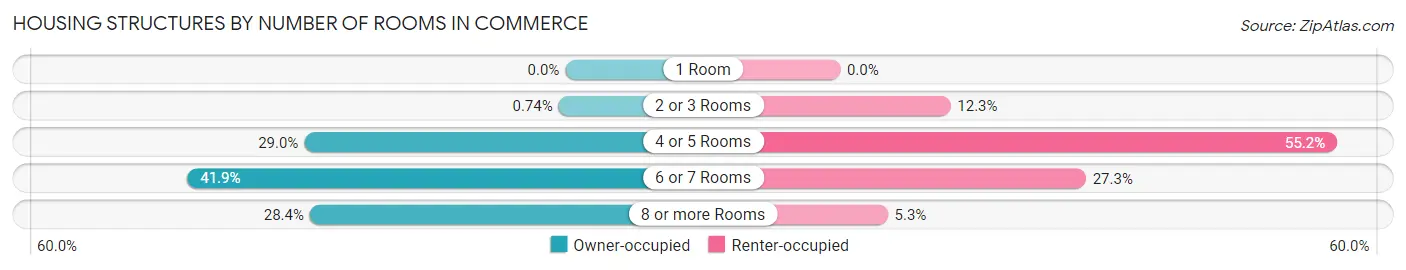
| Number of Rooms | Owner-occupied | Renter-occupied |
| 1 Room | 0 (0.0%) | 0 (0.0%) |
| 2 or 3 Rooms | 12 (0.7%) | 102 (12.3%) |
| 4 or 5 Rooms | 469 (29.0%) | 459 (55.2%) |
| 6 or 7 Rooms | 679 (41.9%) | 227 (27.3%) |
| 8 or more Rooms | 459 (28.3%) | 44 (5.3%) |
| Total | 1,619 (100.0%) | 832 (100.0%) |
Housing Structure by Heating Type in Commerce
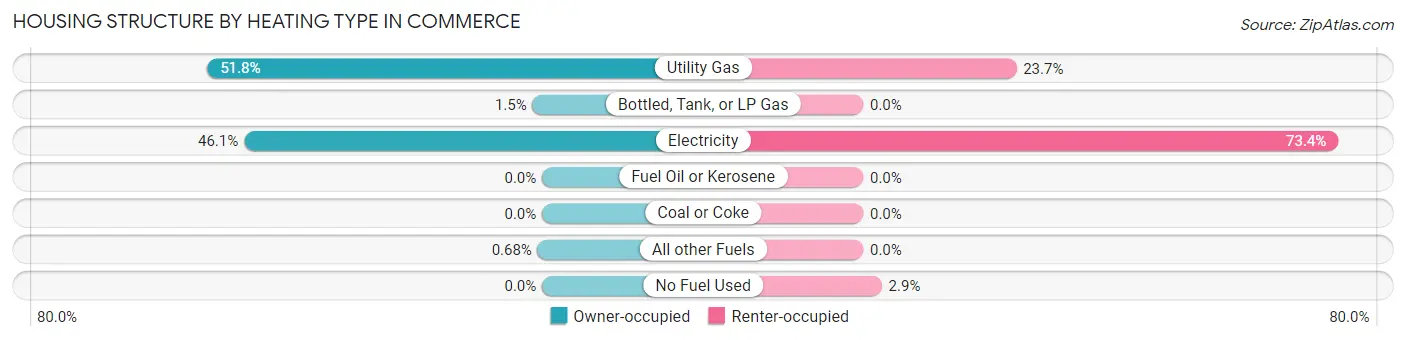
| Heating Type | Owner-occupied | Renter-occupied |
| Utility Gas | 838 (51.8%) | 197 (23.7%) |
| Bottled, Tank, or LP Gas | 24 (1.5%) | 0 (0.0%) |
| Electricity | 746 (46.1%) | 611 (73.4%) |
| Fuel Oil or Kerosene | 0 (0.0%) | 0 (0.0%) |
| Coal or Coke | 0 (0.0%) | 0 (0.0%) |
| All other Fuels | 11 (0.7%) | 0 (0.0%) |
| No Fuel Used | 0 (0.0%) | 24 (2.9%) |
| Total | 1,619 (100.0%) | 832 (100.0%) |
Household Vehicle Usage in Commerce
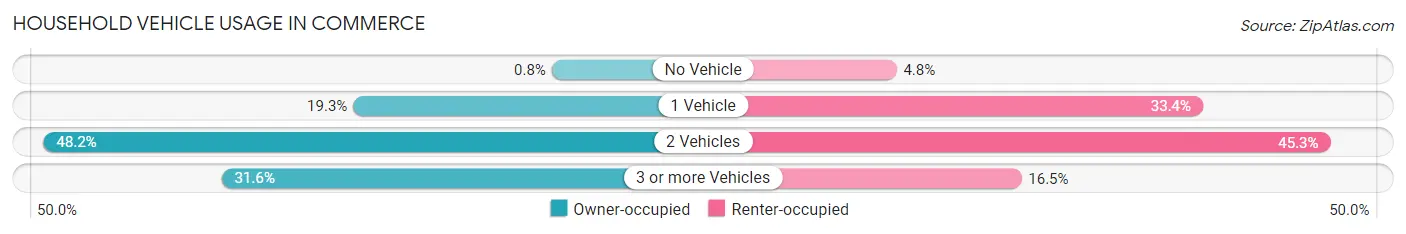
| Vehicles per Household | Owner-occupied | Renter-occupied |
| No Vehicle | 13 (0.8%) | 40 (4.8%) |
| 1 Vehicle | 313 (19.3%) | 278 (33.4%) |
| 2 Vehicles | 781 (48.2%) | 377 (45.3%) |
| 3 or more Vehicles | 512 (31.6%) | 137 (16.5%) |
| Total | 1,619 (100.0%) | 832 (100.0%) |
Real Estate & Mortgages in Commerce
Real Estate and Mortgage Overview in Commerce
| Characteristic | Without Mortgage | With Mortgage |
| Housing Units | 676 | 943 |
| Median Property Value | $231,500 | $210,800 |
| Median Household Income | $38,614 | $76 |
| Monthly Housing Costs | $516 | $26 |
| Real Estate Taxes | $1,805 | $85 |
Property Value by Mortgage Status in Commerce
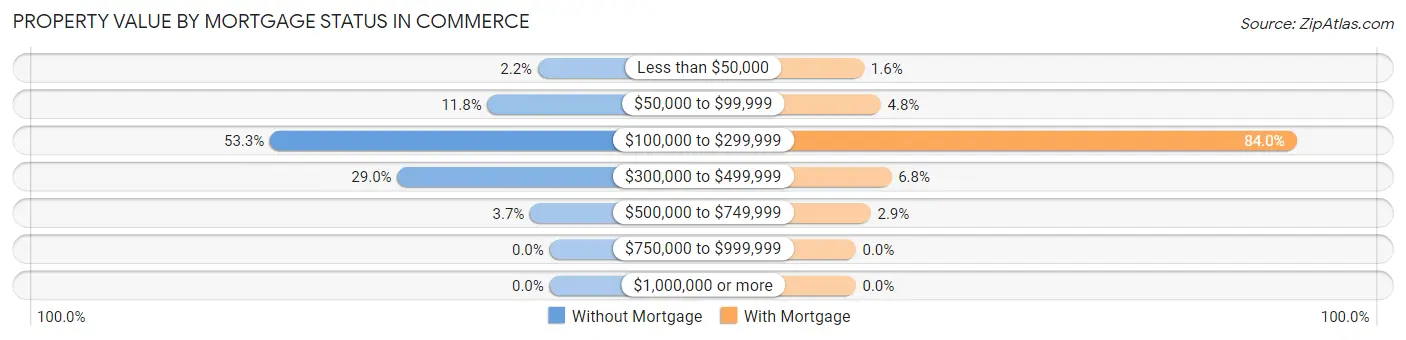
| Property Value | Without Mortgage | With Mortgage |
| Less than $50,000 | 15 (2.2%) | 15 (1.6%) |
| $50,000 to $99,999 | 80 (11.8%) | 45 (4.8%) |
| $100,000 to $299,999 | 360 (53.2%) | 792 (84.0%) |
| $300,000 to $499,999 | 196 (29.0%) | 64 (6.8%) |
| $500,000 to $749,999 | 25 (3.7%) | 27 (2.9%) |
| $750,000 to $999,999 | 0 (0.0%) | 0 (0.0%) |
| $1,000,000 or more | 0 (0.0%) | 0 (0.0%) |
| Total | 676 (100.0%) | 943 (100.0%) |
Household Income by Mortgage Status in Commerce
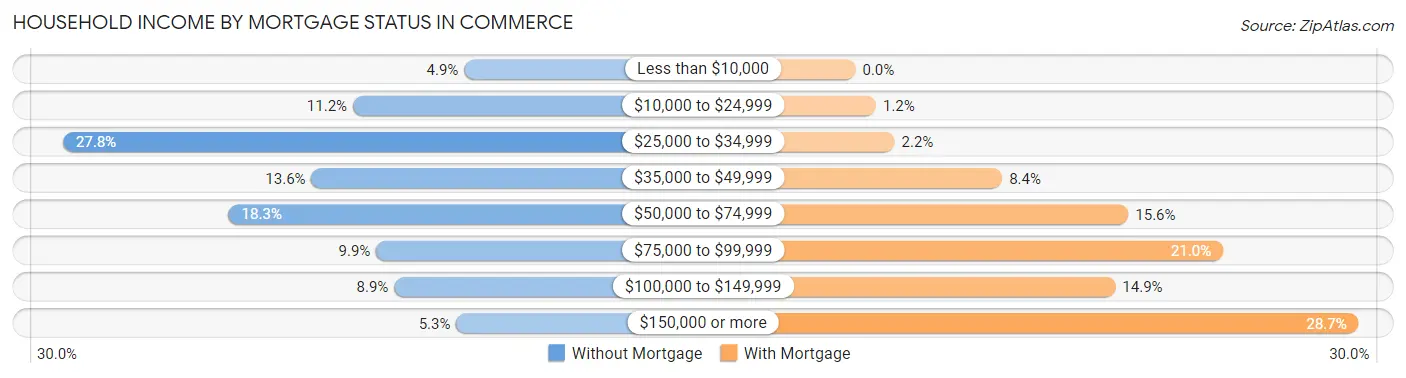
| Household Income | Without Mortgage | With Mortgage |
| Less than $10,000 | 33 (4.9%) | 0 (0.0%) |
| $10,000 to $24,999 | 76 (11.2%) | 11 (1.2%) |
| $25,000 to $34,999 | 188 (27.8%) | 21 (2.2%) |
| $35,000 to $49,999 | 92 (13.6%) | 79 (8.4%) |
| $50,000 to $74,999 | 124 (18.3%) | 147 (15.6%) |
| $75,000 to $99,999 | 67 (9.9%) | 198 (21.0%) |
| $100,000 to $149,999 | 60 (8.9%) | 140 (14.8%) |
| $150,000 or more | 36 (5.3%) | 271 (28.7%) |
| Total | 676 (100.0%) | 943 (100.0%) |
Property Value to Household Income Ratio in Commerce
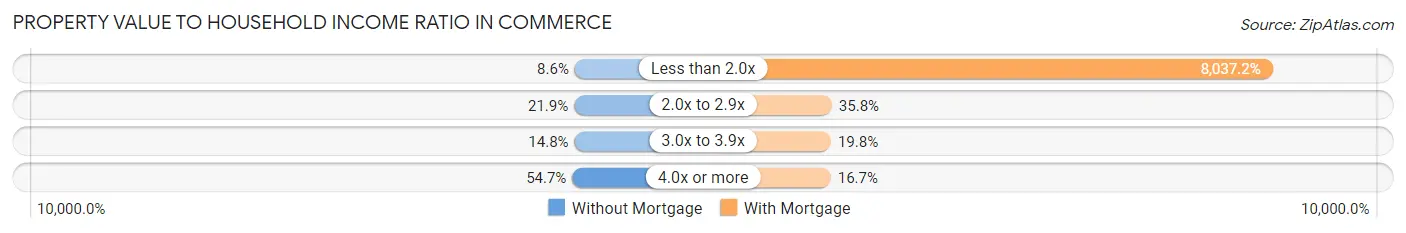
| Value-to-Income Ratio | Without Mortgage | With Mortgage |
| Less than 2.0x | 58 (8.6%) | 75,791 (8,037.2%) |
| 2.0x to 2.9x | 148 (21.9%) | 338 (35.8%) |
| 3.0x to 3.9x | 100 (14.8%) | 187 (19.8%) |
| 4.0x or more | 370 (54.7%) | 157 (16.7%) |
| Total | 676 (100.0%) | 943 (100.0%) |
Real Estate Taxes by Mortgage Status in Commerce
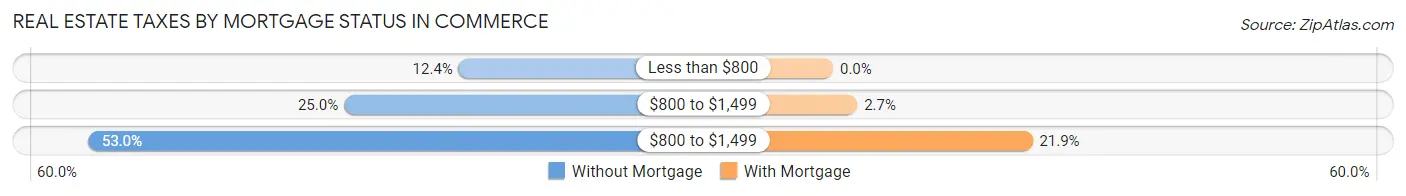
| Property Taxes | Without Mortgage | With Mortgage |
| Less than $800 | 84 (12.4%) | 0 (0.0%) |
| $800 to $1,499 | 169 (25.0%) | 25 (2.6%) |
| $800 to $1,499 | 358 (53.0%) | 206 (21.8%) |
| Total | 676 (100.0%) | 943 (100.0%) |
Health & Disability in Commerce
Health Insurance Coverage by Age in Commerce
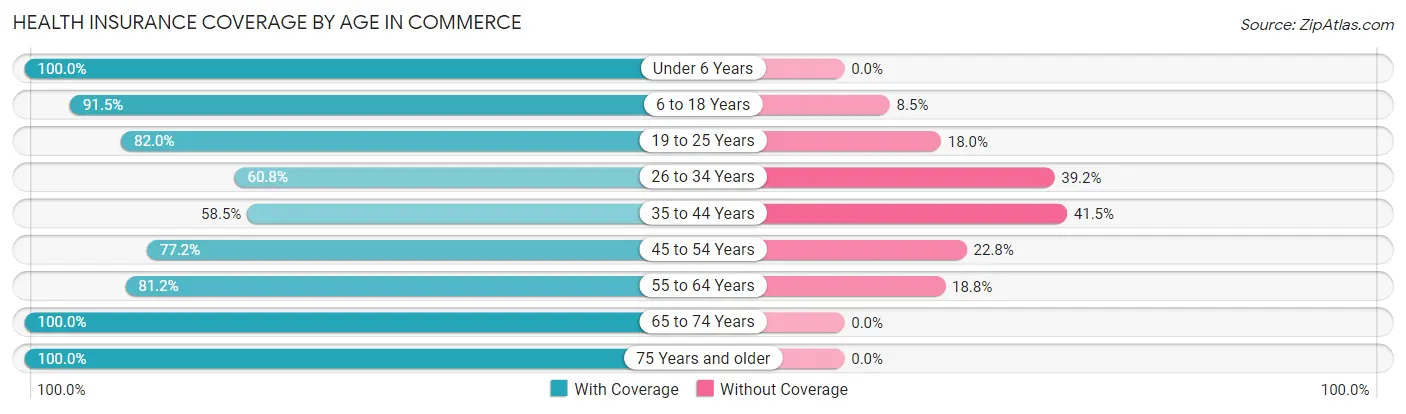
| Age Bracket | With Coverage | Without Coverage |
| Under 6 Years | 634 (100.0%) | 0 (0.0%) |
| 6 to 18 Years | 1,396 (91.5%) | 129 (8.5%) |
| 19 to 25 Years | 378 (82.0%) | 83 (18.0%) |
| 26 to 34 Years | 665 (60.8%) | 428 (39.2%) |
| 35 to 44 Years | 657 (58.5%) | 466 (41.5%) |
| 45 to 54 Years | 521 (77.2%) | 154 (22.8%) |
| 55 to 64 Years | 545 (81.2%) | 126 (18.8%) |
| 65 to 74 Years | 515 (100.0%) | 0 (0.0%) |
| 75 Years and older | 453 (100.0%) | 0 (0.0%) |
| Total | 5,764 (80.6%) | 1,386 (19.4%) |
Health Insurance Coverage by Citizenship Status in Commerce
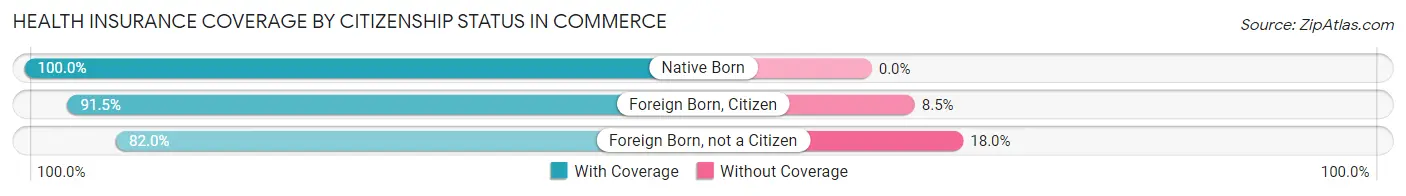
| Citizenship Status | With Coverage | Without Coverage |
| Native Born | 634 (100.0%) | 0 (0.0%) |
| Foreign Born, Citizen | 1,396 (91.5%) | 129 (8.5%) |
| Foreign Born, not a Citizen | 378 (82.0%) | 83 (18.0%) |
Health Insurance Coverage by Household Income in Commerce
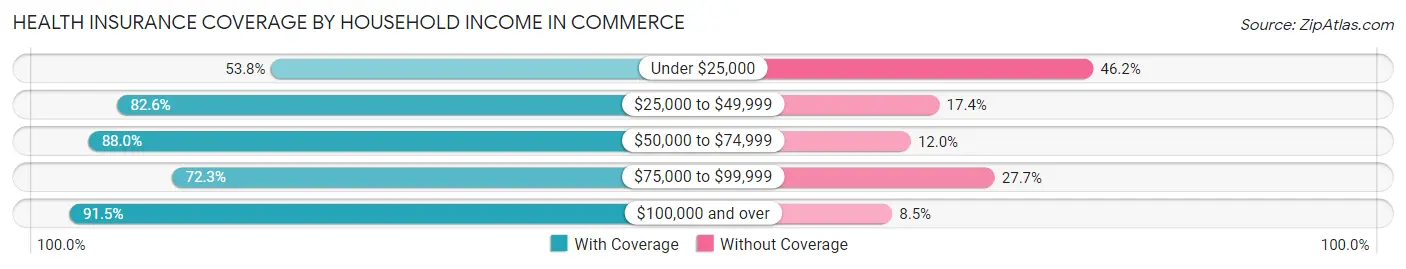
| Household Income | With Coverage | Without Coverage |
| Under $25,000 | 478 (53.8%) | 411 (46.2%) |
| $25,000 to $49,999 | 1,495 (82.6%) | 315 (17.4%) |
| $50,000 to $74,999 | 1,274 (88.0%) | 174 (12.0%) |
| $75,000 to $99,999 | 865 (72.3%) | 332 (27.7%) |
| $100,000 and over | 1,652 (91.5%) | 154 (8.5%) |
Public vs Private Health Insurance Coverage by Age in Commerce
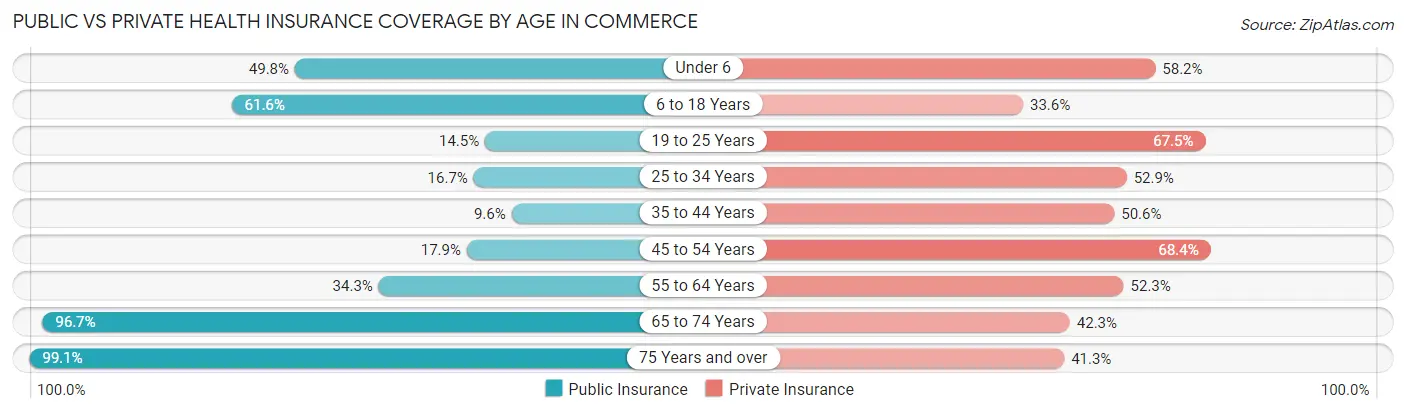
| Age Bracket | Public Insurance | Private Insurance |
| Under 6 | 316 (49.8%) | 369 (58.2%) |
| 6 to 18 Years | 939 (61.6%) | 513 (33.6%) |
| 19 to 25 Years | 67 (14.5%) | 311 (67.5%) |
| 25 to 34 Years | 182 (16.7%) | 578 (52.9%) |
| 35 to 44 Years | 108 (9.6%) | 568 (50.6%) |
| 45 to 54 Years | 121 (17.9%) | 462 (68.4%) |
| 55 to 64 Years | 230 (34.3%) | 351 (52.3%) |
| 65 to 74 Years | 498 (96.7%) | 218 (42.3%) |
| 75 Years and over | 449 (99.1%) | 187 (41.3%) |
| Total | 2,910 (40.7%) | 3,557 (49.7%) |
Disability Status by Sex by Age in Commerce
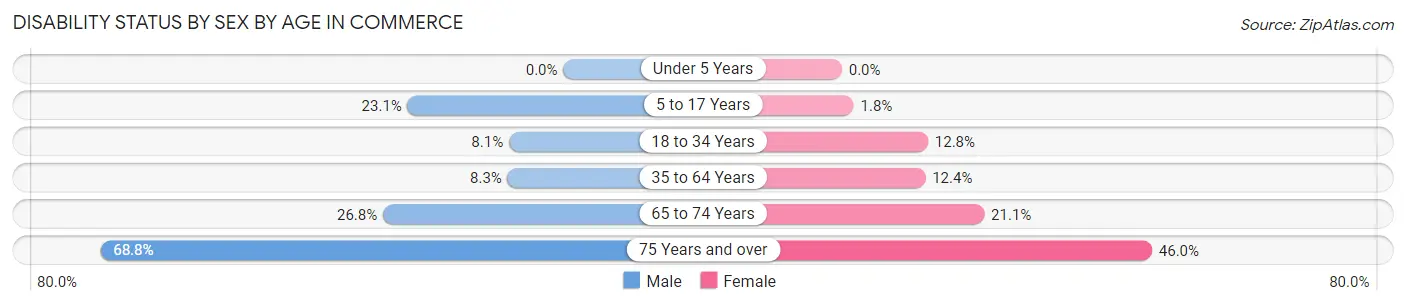
| Age Bracket | Male | Female |
| Under 5 Years | 0 (0.0%) | 0 (0.0%) |
| 5 to 17 Years | 224 (23.1%) | 10 (1.8%) |
| 18 to 34 Years | 54 (8.1%) | 115 (12.8%) |
| 35 to 64 Years | 102 (8.3%) | 153 (12.4%) |
| 65 to 74 Years | 53 (26.8%) | 67 (21.1%) |
| 75 Years and over | 77 (68.8%) | 157 (46.0%) |
Disability Class by Sex by Age in Commerce
Disability Class: Hearing Difficulty
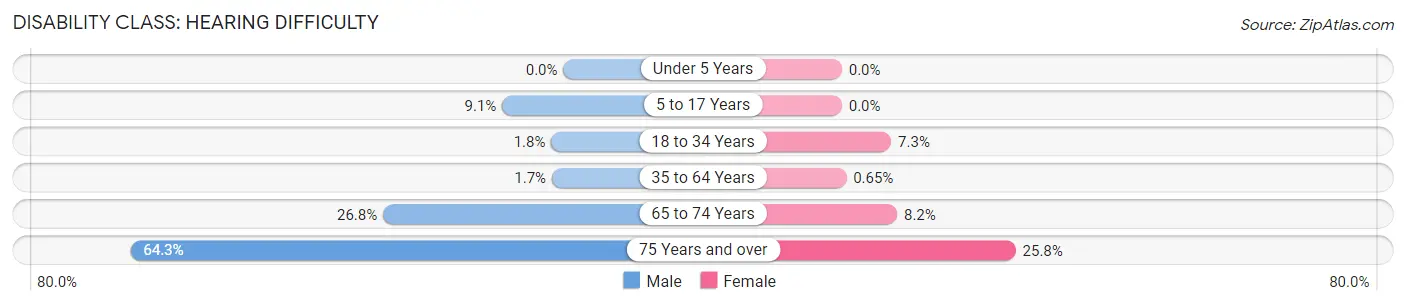
| Age Bracket | Male | Female |
| Under 5 Years | 0 (0.0%) | 0 (0.0%) |
| 5 to 17 Years | 88 (9.1%) | 0 (0.0%) |
| 18 to 34 Years | 12 (1.8%) | 66 (7.3%) |
| 35 to 64 Years | 21 (1.7%) | 8 (0.6%) |
| 65 to 74 Years | 53 (26.8%) | 26 (8.2%) |
| 75 Years and over | 72 (64.3%) | 88 (25.8%) |
Disability Class: Vision Difficulty
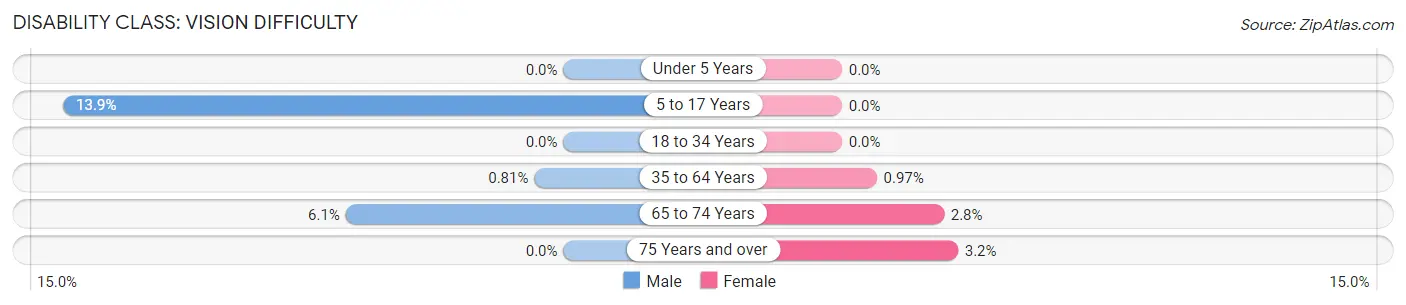
| Age Bracket | Male | Female |
| Under 5 Years | 0 (0.0%) | 0 (0.0%) |
| 5 to 17 Years | 135 (13.9%) | 0 (0.0%) |
| 18 to 34 Years | 0 (0.0%) | 0 (0.0%) |
| 35 to 64 Years | 10 (0.8%) | 12 (1.0%) |
| 65 to 74 Years | 12 (6.1%) | 9 (2.8%) |
| 75 Years and over | 0 (0.0%) | 11 (3.2%) |
Disability Class: Cognitive Difficulty
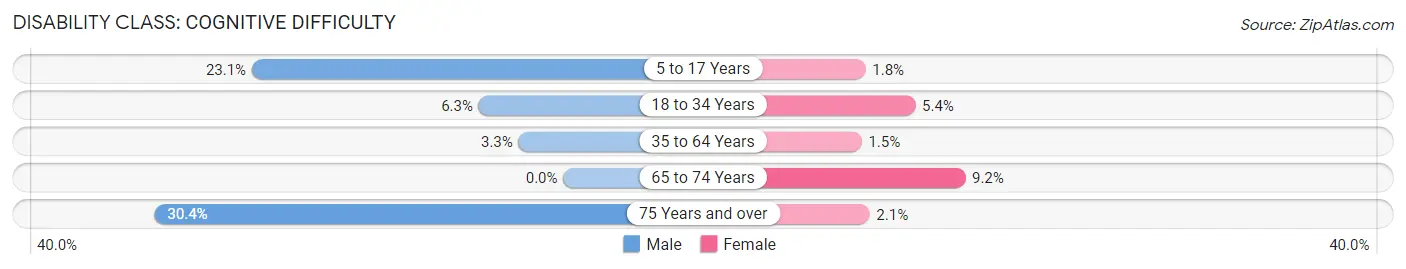
| Age Bracket | Male | Female |
| 5 to 17 Years | 224 (23.1%) | 10 (1.8%) |
| 18 to 34 Years | 42 (6.3%) | 49 (5.4%) |
| 35 to 64 Years | 41 (3.3%) | 18 (1.5%) |
| 65 to 74 Years | 0 (0.0%) | 29 (9.1%) |
| 75 Years and over | 34 (30.4%) | 7 (2.1%) |
Disability Class: Ambulatory Difficulty
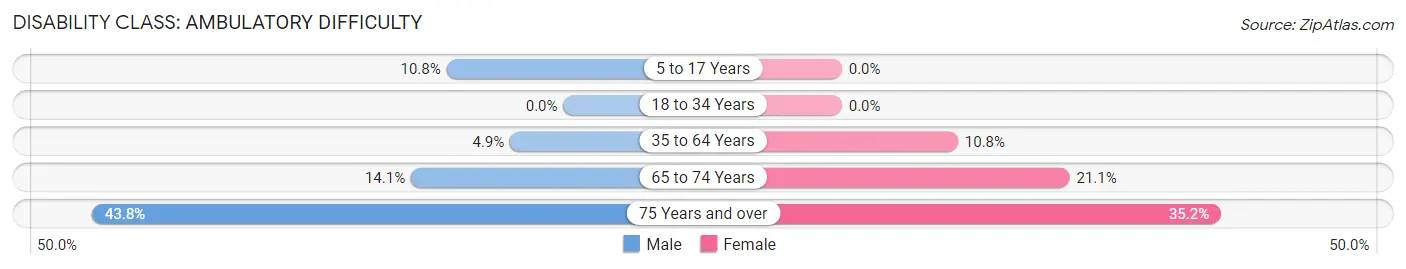
| Age Bracket | Male | Female |
| 5 to 17 Years | 105 (10.8%) | 0 (0.0%) |
| 18 to 34 Years | 0 (0.0%) | 0 (0.0%) |
| 35 to 64 Years | 61 (4.9%) | 133 (10.8%) |
| 65 to 74 Years | 28 (14.1%) | 67 (21.1%) |
| 75 Years and over | 49 (43.8%) | 120 (35.2%) |
Disability Class: Self-Care Difficulty
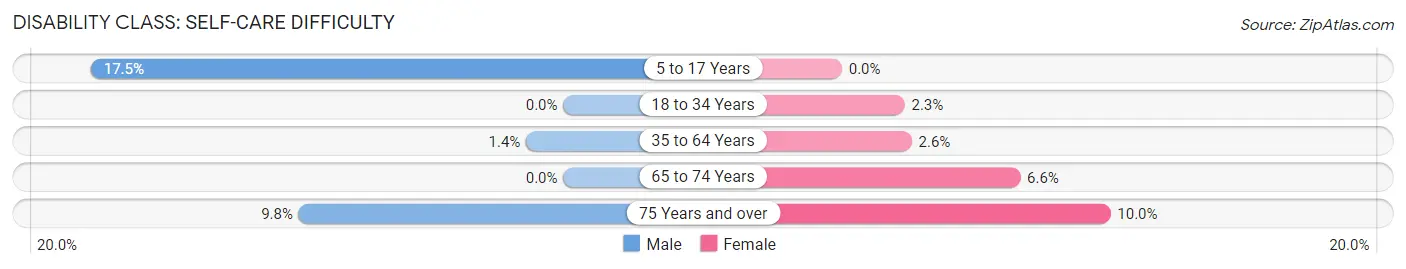
| Age Bracket | Male | Female |
| 5 to 17 Years | 170 (17.5%) | 0 (0.0%) |
| 18 to 34 Years | 0 (0.0%) | 21 (2.3%) |
| 35 to 64 Years | 17 (1.4%) | 32 (2.6%) |
| 65 to 74 Years | 0 (0.0%) | 21 (6.6%) |
| 75 Years and over | 11 (9.8%) | 34 (10.0%) |
Technology Access in Commerce
Computing Device Access in Commerce
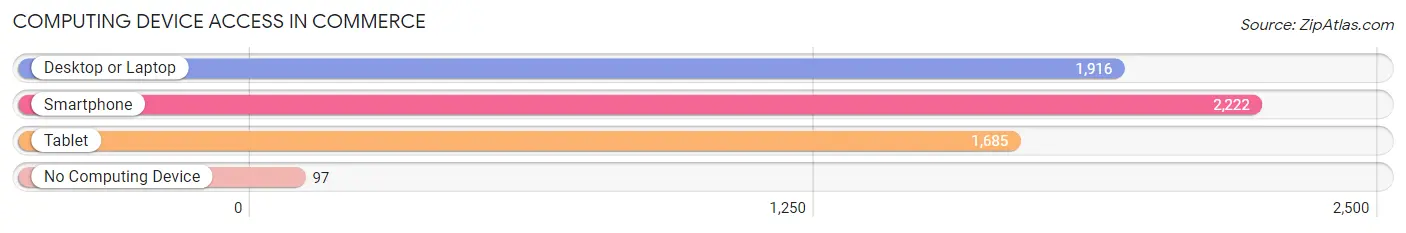
| Device Type | # Households | % Households |
| Desktop or Laptop | 1,916 | 78.2% |
| Smartphone | 2,222 | 90.7% |
| Tablet | 1,685 | 68.8% |
| No Computing Device | 97 | 4.0% |
| Total | 2,451 | 100.0% |
Internet Access in Commerce
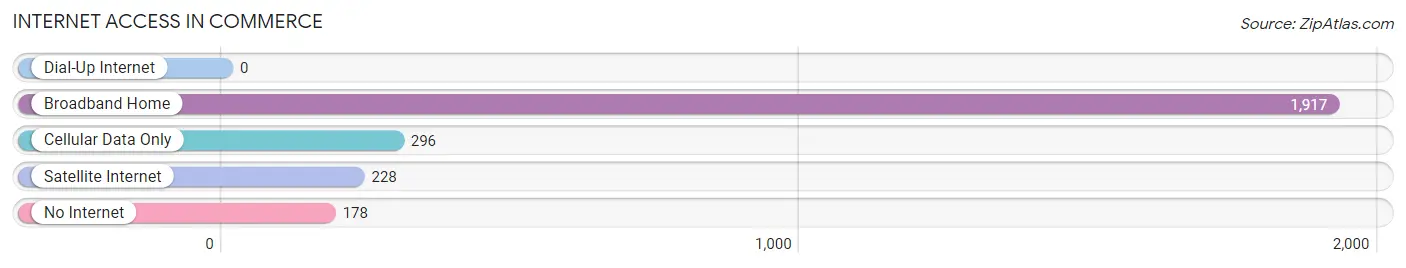
| Internet Type | # Households | % Households |
| Dial-Up Internet | 0 | 0.0% |
| Broadband Home | 1,917 | 78.2% |
| Cellular Data Only | 296 | 12.1% |
| Satellite Internet | 228 | 9.3% |
| No Internet | 178 | 7.3% |
| Total | 2,451 | 100.0% |
Commerce Summary
Commerce
Commerce is the exchange of goods and services between two or more parties. It is an important part of the economy of Georgia, as it is the primary way that goods and services are exchanged. Georgia has a long history of commerce, with the earliest evidence of trade occurring in the Neolithic period. The state has a diverse economy, with a variety of industries and sectors. The most important sectors are agriculture, manufacturing, and services.
Agriculture is the largest sector of the economy, accounting for about one-third of the state’s GDP. Georgia is a major producer of cotton, peanuts, pecans, and other crops. The state is also a major producer of poultry, eggs, and dairy products.
Manufacturing is the second-largest sector of the economy, accounting for about one-fifth of the state’s GDP. Georgia is home to a number of major manufacturing companies, including Coca-Cola, Delta Air Lines, and Georgia-Pacific. The state is also a major producer of textiles, furniture, and other products.
Services are the third-largest sector of the economy, accounting for about one-sixth of the state’s GDP. Georgia is home to a number of major service industries, including banking, finance, insurance, and real estate. The state is also a major center for tourism, with a number of popular attractions, such as the Georgia Aquarium and Stone Mountain Park.
Georgia has a number of major ports, including the Port of Savannah and the Port of Brunswick. These ports are important for the state’s economy, as they are used to export goods and services to other countries.
Georgia also has a number of major airports, including Hartsfield-Jackson Atlanta International Airport and Savannah/Hilton Head International Airport. These airports are important for the state’s economy, as they are used to transport people and goods to and from the state.
Georgia has a number of major highways, including Interstate 75, Interstate 85, and Interstate 95. These highways are important for the state’s economy, as they are used to transport people and goods to and from the state.
Georgia has a number of major railroads, including the Norfolk Southern Railway and the CSX Transportation. These railroads are important for the state’s economy, as they are used to transport people and goods to and from the state.
Georgia has a number of major universities, including the University of Georgia, Georgia Tech, and Emory University. These universities are important for the state’s economy, as they are used to educate the state’s workforce.
Georgia has a number of major cities, including Atlanta, Augusta, Columbus, and Savannah. These cities are important for the state’s economy, as they are used to attract businesses and tourists.
Georgia has a number of major tourist attractions, including the Georgia Aquarium, Stone Mountain Park, and the Atlanta Zoo. These attractions are important for the state’s economy, as they are used to attract tourists to the state.
Georgia has a number of major sports teams, including the Atlanta Braves, Atlanta Falcons, and Atlanta Hawks. These teams are important for the state’s economy, as they are used to attract fans to the state.
Georgia has a number of major media outlets, including the Atlanta Journal-Constitution, WSB-TV, and WXIA-TV. These media outlets are important for the state’s economy, as they are used to inform the public about the state.
Georgia has a number of major industries, including banking, finance, insurance, and real estate. These industries are important for the state’s economy, as they are used to provide jobs and services to the state.
Georgia has a number of major retail stores, including Walmart, Target, and Home Depot. These stores are important for the state’s economy, as they are used to provide goods and services to the state.
Georgia has a number of major corporations, including Coca-Cola, Delta Air Lines, and Georgia-Pacific. These corporations are important for the state’s economy, as they are used to provide jobs and services to the state.
Georgia has a number of major banks, including Bank of America, Wells Fargo, and SunTrust. These banks are important for the state’s economy, as they are used to provide financial services to the state.
Georgia has a number of major stock exchanges, including the New York Stock Exchange and the Nasdaq. These exchanges are important for the state’s economy, as they are used to facilitate the buying and selling of stocks and other securities.
Georgia has a number of major insurance companies, including Allstate, State Farm, and Progressive. These companies are important for the state’s economy, as they are used to provide insurance services to the state.
Georgia has a number of major real estate companies, including Coldwell Banker, Century 21, and Re/Max. These companies are important for the state’s economy, as they are used to provide real estate services to the state.
Georgia has a number of major utilities, including Georgia Power, Georgia Natural Gas, and Georgia EMC. These utilities are important for the state’s economy, as they are used to provide electricity, natural gas, and other services to the state.
Georgia has a number of major transportation companies, including UPS, FedEx, and DHL. These companies are important for the state’s economy, as they are used to transport people and goods to and from the state.
Georgia has a number of major telecommunications companies, including AT&T, Verizon, and Sprint. These companies are important for the state’s economy, as they are used to provide telephone, internet, and other services to the state.
Georgia has a number of major technology companies, including Microsoft, Apple, and Google. These companies are important for the state’s economy, as they are used to provide software, hardware, and other services to the state.
Georgia has a number of major energy companies, including Southern Company, Georgia Power, and Georgia Natural Gas. These companies are important for the state’s economy, as they are used to provide electricity, natural gas, and other services to the state.
Georgia has a number of major health care companies, including Kaiser Permanente, Emory Healthcare, and WellStar Health System. These companies are important for the state’s economy, as they are used to provide health care services to the state.
Georgia has a number of major hospitality companies, including Marriott, Hilton, and Hyatt. These companies are important for the state’s economy, as they are used to provide lodging and other services to the state.
Georgia has a number of major media companies, including Turner Broadcasting, Cox Communications, and The Weather Channel. These companies are important for the state’s economy, as they are used to provide television, radio, and other services to the state.
Georgia has a number of major retail companies, including Walmart, Target, and Home Depot. These companies are important for the state’s economy, as they are used to provide goods and services to the state.
Georgia has a number of major entertainment companies, including AMC Theatres, Regal Cinemas, and Six Flags. These companies are important for the state’s economy, as they are used to provide entertainment services to the state.
Georgia has a number of major food companies, including Coca-Cola, Chick-fil-A, and Waffle House. These companies are important for the state’s economy, as they are used to provide food and beverage services to the state.
Georgia has a number of major transportation companies, including Delta Air Lines, Southwest Airlines, and JetBlue. These companies are important for the state’s economy, as they are used to transport people and goods to and from the state.
Georgia has a number of major construction companies, including Bechtel, Turner Construction, and Brasfield & Gorrie. These companies are important for the state’s economy, as they are used to provide construction services to the state.
Georgia has a number of major financial services companies, including Bank of America, Wells Fargo, and SunTrust. These companies are important for the state’s economy, as they are used to provide financial services to the state.
Georgia has a number of major law firms, including King & Spalding, Alston & Bird, and Troutman Sanders. These firms are important for the state’s economy, as they are used to provide legal services to the state.
Georgia has a number of major consulting firms, including Deloitte, KPMG, and Ernst & Young. These firms are important for the state’s economy, as they are used to provide consulting services to the state.
Georgia has a number of major advertising agencies, including BBDO, Ogilvy & Mather, and Leo Burnett. These agencies are important for the state’s economy, as they are used to provide advertising services to the state.
Georgia has a number of major technology companies, including Microsoft, Apple, and Google. These companies are important for the state’s economy, as they are used to provide software, hardware, and other services to the state.
Georgia has a number of major defense contractors, including Lockheed Martin, Northrop Grumman, and Raytheon. These contractors are important for the state’s economy, as they are used to provide defense services to the state.
Georgia has a number of major energy companies, including Southern Company, Georgia Power, and Georgia Natural Gas. These companies are important for the state’s economy, as they are used to provide electricity, natural gas, and other services to the state.
Georgia has a number of major health care companies, including Kaiser Permanente, Emory Healthcare, and WellStar Health System. These companies are important for the state’s economy, as they are used to provide health care services to the state.
Georgia has a number of major hospitality companies, including Marriott, Hilton, and Hyatt. These companies are important for the state’s economy, as they are used to provide lodging and other services to the state.
Georgia has a number of major media companies, including Turner Broadcasting, Cox Communications, and The Weather Channel. These companies are important for the state’s economy, as they are used to provide television, radio, and other services to the state.
Georgia has a number of major retail companies, including Walmart, Target, and Home Depot. These companies are important for the state’s economy, as they are used to provide goods and services to the state.
Georgia has a number of major entertainment companies, including AMC Theatres, Regal Cinemas, and Six Flags. These companies are important for the state’s economy, as they are used to provide entertainment services to the state.
Georgia has a number of major food companies, including Coca-Cola, Chick-fil-A, and Waffle House. These companies are important for the state’s economy, as they are used to provide food and beverage services to the state.
Georgia has a number of major transportation companies, including Delta Air Lines, Southwest Airlines, and JetBlue. These companies are important for the state’s economy, as they are used to transport people and goods to and from the state.
Georgia has a number of major construction companies, including Bechtel, Turner Construction, and Brasfield & Gorrie. These companies are important for the state’s economy, as they are used to provide construction services to the state.
Georgia has a number of major financial services companies, including Bank of America, Wells Fargo, and SunTrust. These companies are important for
Common Questions
What is Per Capita Income in Commerce?
Per Capita income in Commerce is $23,269.
What is the Median Family Income in Commerce?
Median Family Income in Commerce is $66,468.
What is the Median Household income in Commerce?
Median Household Income in Commerce is $58,763.
What is Income or Wage Gap in Commerce?
Income or Wage Gap in Commerce is 5.1%.
Women in Commerce earn 94.9 cents for every dollar earned by a man.
What is Inequality or Gini Index in Commerce?
Inequality or Gini Index in Commerce is 0.37.
What is the Total Population of Commerce?
Total Population of Commerce is 7,391.
What is the Total Male Population of Commerce?
Total Male Population of Commerce is 3,510.
What is the Total Female Population of Commerce?
Total Female Population of Commerce is 3,881.
What is the Ratio of Males per 100 Females in Commerce?
There are 90.44 Males per 100 Females in Commerce.
What is the Ratio of Females per 100 Males in Commerce?
There are 110.57 Females per 100 Males in Commerce.
What is the Median Population Age in Commerce?
Median Population Age in Commerce is 34.8 Years.
What is the Average Family Size in Commerce
Average Family Size in Commerce is 3.5 People.
What is the Average Household Size in Commerce
Average Household Size in Commerce is 2.9 People.
How Large is the Labor Force in Commerce?
There are 3,244 People in the Labor Forcein in Commerce.
What is the Percentage of People in the Labor Force in Commerce?
57.7% of People are in the Labor Force in Commerce.
What is the Unemployment Rate in Commerce?
Unemployment Rate in Commerce is 0.2%.