Clermont, GA Map & Demographics
Clermont Map
Clermont Overview
$44,240
PER CAPITA INCOME
$137,500
AVG FAMILY INCOME
$96,875
AVG HOUSEHOLD INCOME
31.7%
WAGE / INCOME GAP [ % ]
68.3¢/ $1
WAGE / INCOME GAP [ $ ]
0.39
INEQUALITY / GINI INDEX
1,092
TOTAL POPULATION
551
MALE POPULATION
541
FEMALE POPULATION
101.85
MALES / 100 FEMALES
98.19
FEMALES / 100 MALES
41.2
MEDIAN AGE
3.1
AVG FAMILY SIZE
2.7
AVG HOUSEHOLD SIZE
639
LABOR FORCE [ PEOPLE ]
72.4%
PERCENT IN LABOR FORCE
1.9%
UNEMPLOYMENT RATE
Clermont Zip Codes
Income in Clermont
Income Overview in Clermont
Per Capita Income in Clermont is $44,240, while median incomes of families and households are $137,500 and $96,875 respectively.
| Characteristic | Number | Measure |
| Per Capita Income | 1,092 | $44,240 |
| Median Family Income | 314 | $137,500 |
| Mean Family Income | 314 | $130,512 |
| Median Household Income | 398 | $96,875 |
| Mean Household Income | 398 | $117,202 |
| Income Deficit | 314 | $0 |
| Wage / Income Gap (%) | 1,092 | 31.67% |
| Wage / Income Gap ($) | 1,092 | 68.33¢ per $1 |
| Gini / Inequality Index | 1,092 | 0.39 |
Earnings by Sex in Clermont
Average Earnings in Clermont are $51,518, $63,295 for men and $43,250 for women, a difference of 31.7%.
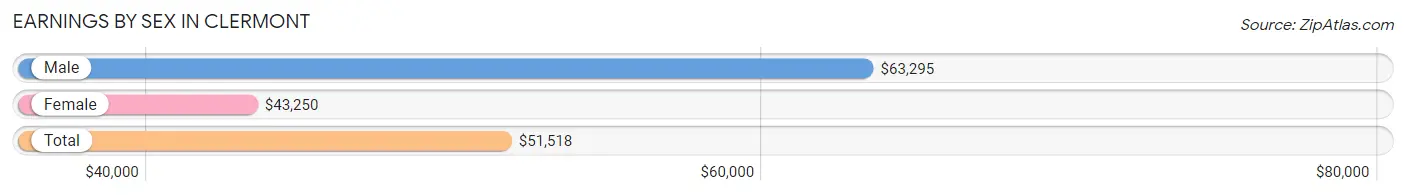
| Sex | Number | Average Earnings |
| Male | 355 (54.2%) | $63,295 |
| Female | 300 (45.8%) | $43,250 |
| Total | 655 (100.0%) | $51,518 |
Earnings by Sex by Income Bracket in Clermont
The most common earnings brackets in Clermont are $100,000+ for men (83 | 23.4%) and $65,000 to $74,999 for women (42 | 14.0%).
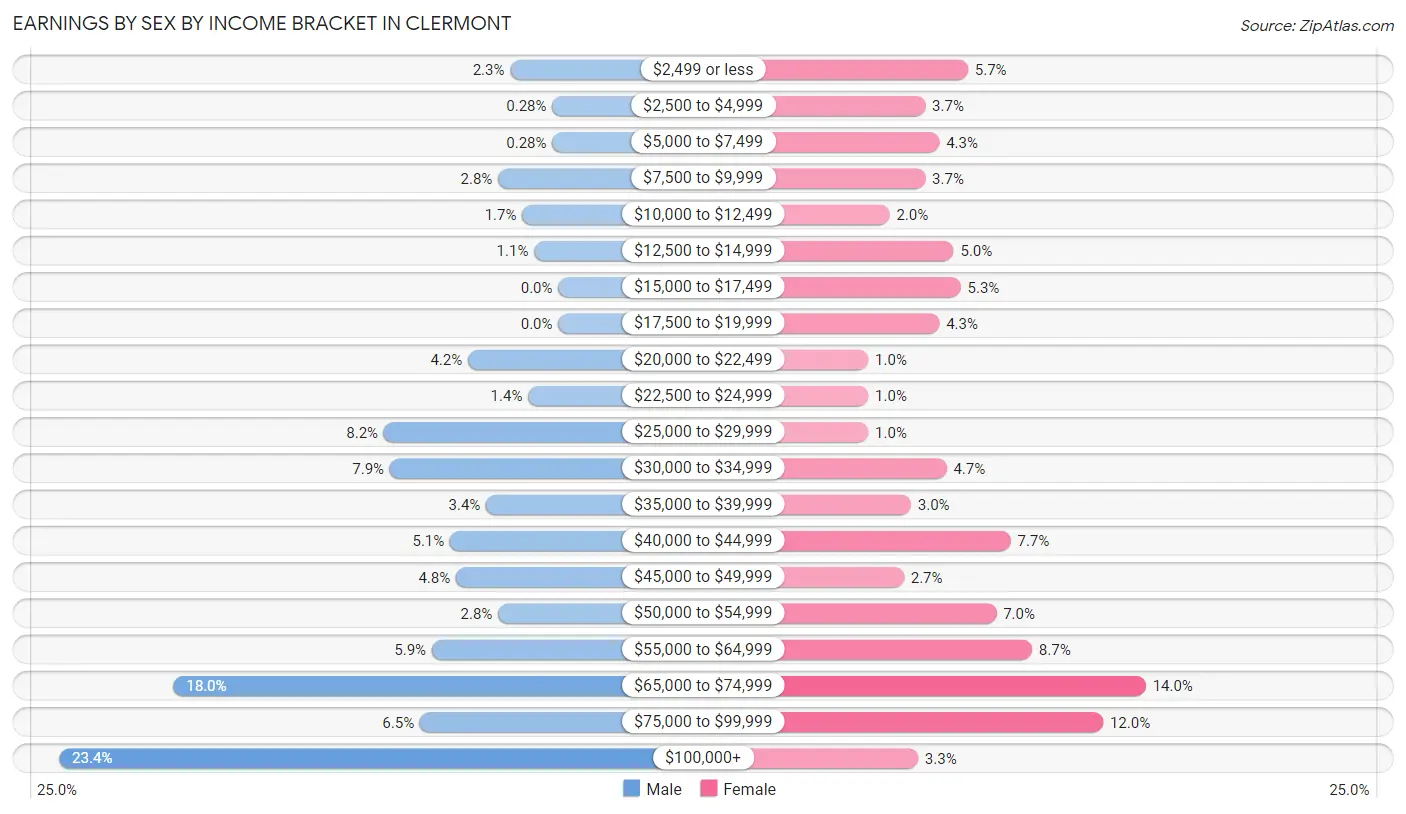
| Income | Male | Female |
| $2,499 or less | 8 (2.2%) | 17 (5.7%) |
| $2,500 to $4,999 | 1 (0.3%) | 11 (3.7%) |
| $5,000 to $7,499 | 1 (0.3%) | 13 (4.3%) |
| $7,500 to $9,999 | 10 (2.8%) | 11 (3.7%) |
| $10,000 to $12,499 | 6 (1.7%) | 6 (2.0%) |
| $12,500 to $14,999 | 4 (1.1%) | 15 (5.0%) |
| $15,000 to $17,499 | 0 (0.0%) | 16 (5.3%) |
| $17,500 to $19,999 | 0 (0.0%) | 13 (4.3%) |
| $20,000 to $22,499 | 15 (4.2%) | 3 (1.0%) |
| $22,500 to $24,999 | 5 (1.4%) | 3 (1.0%) |
| $25,000 to $29,999 | 29 (8.2%) | 3 (1.0%) |
| $30,000 to $34,999 | 28 (7.9%) | 14 (4.7%) |
| $35,000 to $39,999 | 12 (3.4%) | 9 (3.0%) |
| $40,000 to $44,999 | 18 (5.1%) | 23 (7.7%) |
| $45,000 to $49,999 | 17 (4.8%) | 8 (2.7%) |
| $50,000 to $54,999 | 10 (2.8%) | 21 (7.0%) |
| $55,000 to $64,999 | 21 (5.9%) | 26 (8.7%) |
| $65,000 to $74,999 | 64 (18.0%) | 42 (14.0%) |
| $75,000 to $99,999 | 23 (6.5%) | 36 (12.0%) |
| $100,000+ | 83 (23.4%) | 10 (3.3%) |
| Total | 355 (100.0%) | 300 (100.0%) |
Earnings by Sex by Educational Attainment in Clermont
Average earnings in Clermont are $70,102 for men and $53,625 for women, a difference of 23.5%. Men with an educational attainment of graduate degree enjoy the highest average annual earnings of $105,469, while those with college or associate's degree education earn the least with $53,750. Women with an educational attainment of graduate degree earn the most with the average annual earnings of $73,654, while those with less than high school education have the smallest earnings of $43,750.
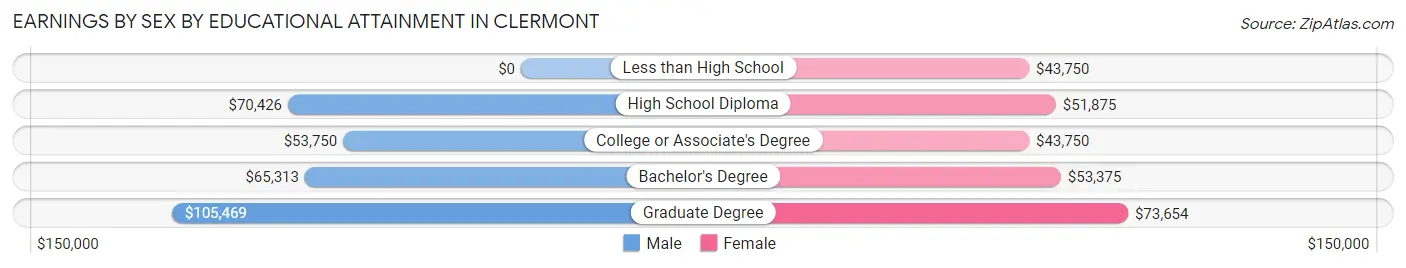
| Educational Attainment | Male Income | Female Income |
| Less than High School | - | - |
| High School Diploma | $70,426 | $51,875 |
| College or Associate's Degree | $53,750 | $43,750 |
| Bachelor's Degree | $65,313 | $53,375 |
| Graduate Degree | $105,469 | $73,654 |
| Total | $70,102 | $53,625 |
Family Income in Clermont
Family Income Brackets in Clermont
According to the Clermont family income data, there are 93 families falling into the $100,000 to $149,999 income range, which is the most common income bracket and makes up 29.6% of all families.
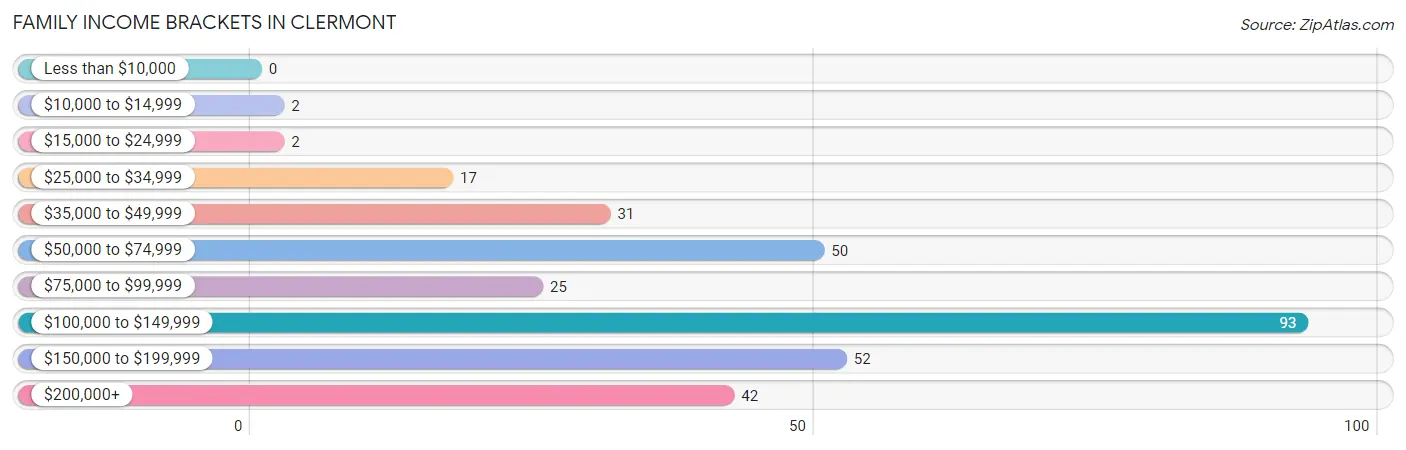
| Income Bracket | # Families | % Families |
| Less than $10,000 | 0 | 0.0% |
| $10,000 to $14,999 | 2 | 0.6% |
| $15,000 to $24,999 | 2 | 0.6% |
| $25,000 to $34,999 | 17 | 5.4% |
| $35,000 to $49,999 | 31 | 9.9% |
| $50,000 to $74,999 | 50 | 15.9% |
| $75,000 to $99,999 | 25 | 8.0% |
| $100,000 to $149,999 | 93 | 29.6% |
| $150,000 to $199,999 | 52 | 16.6% |
| $200,000+ | 42 | 13.4% |
Family Income by Famaliy Size in Clermont
5-person families (27 | 8.6%) account for the highest median family income in Clermont with $238,250 per family, while 2-person families (166 | 52.9%) have the highest median income of $62,000 per family member.
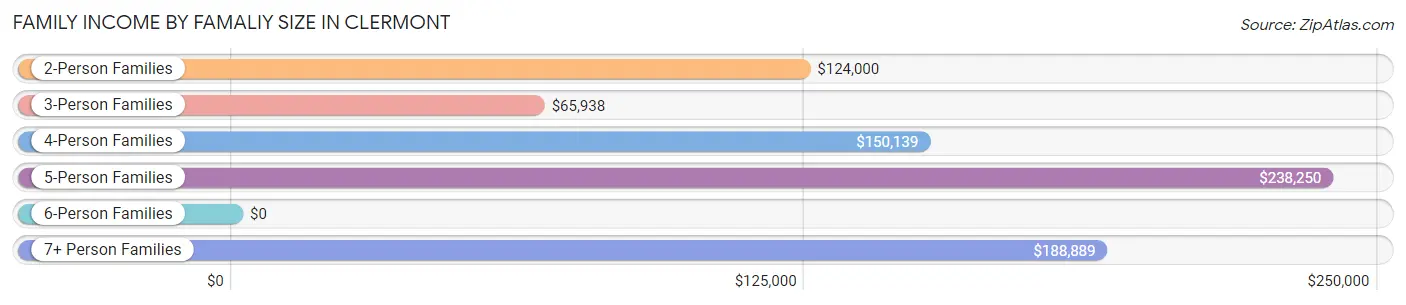
| Income Bracket | # Families | Median Income |
| 2-Person Families | 166 (52.9%) | $124,000 |
| 3-Person Families | 26 (8.3%) | $65,938 |
| 4-Person Families | 77 (24.5%) | $150,139 |
| 5-Person Families | 27 (8.6%) | $238,250 |
| 6-Person Families | 2 (0.6%) | $0 |
| 7+ Person Families | 16 (5.1%) | $188,889 |
| Total | 314 (100.0%) | $137,500 |
Family Income by Number of Earners in Clermont
The median family income in Clermont is $137,500, with families comprising 3+ earners (53) having the highest median family income of $189,861, while families with 1 earner (88) have the lowest median family income of $61,875, accounting for 16.9% and 28.0% of families, respectively.
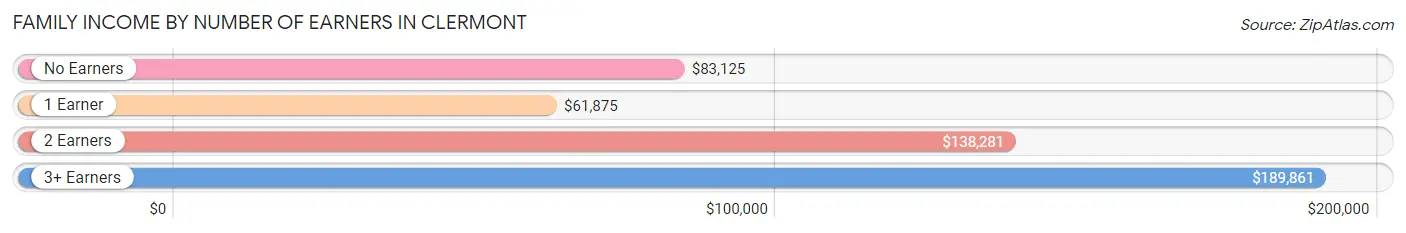
| Number of Earners | # Families | Median Income |
| No Earners | 17 (5.4%) | $83,125 |
| 1 Earner | 88 (28.0%) | $61,875 |
| 2 Earners | 156 (49.7%) | $138,281 |
| 3+ Earners | 53 (16.9%) | $189,861 |
| Total | 314 (100.0%) | $137,500 |
Household Income in Clermont
Household Income Brackets in Clermont
With 95 households falling in the category, the $100,000 to $149,999 income range is the most frequent in Clermont, accounting for 23.9% of all households. In contrast, only 2 households (0.5%) fall into the less than $10,000 income bracket, making it the least populous group.
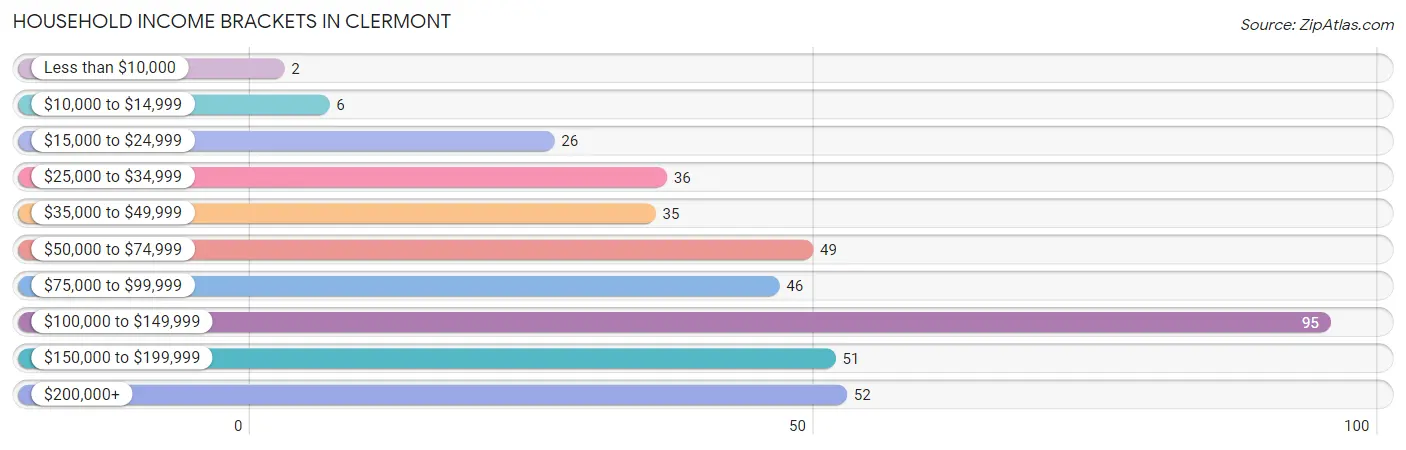
| Income Bracket | # Households | % Households |
| Less than $10,000 | 2 | 0.5% |
| $10,000 to $14,999 | 6 | 1.5% |
| $15,000 to $24,999 | 26 | 6.5% |
| $25,000 to $34,999 | 36 | 9.0% |
| $35,000 to $49,999 | 35 | 8.8% |
| $50,000 to $74,999 | 49 | 12.3% |
| $75,000 to $99,999 | 46 | 11.6% |
| $100,000 to $149,999 | 95 | 23.9% |
| $150,000 to $199,999 | 51 | 12.8% |
| $200,000+ | 52 | 13.1% |
Household Income by Householder Age in Clermont
The median household income in Clermont is $96,875, with the highest median household income of $137,819 found in the 45 to 64 years age bracket for the primary householder. A total of 192 households (48.2%) fall into this category. Meanwhile, the 15 to 24 years age bracket for the primary householder has the lowest median household income of $0, with 17 households (4.3%) in this group.
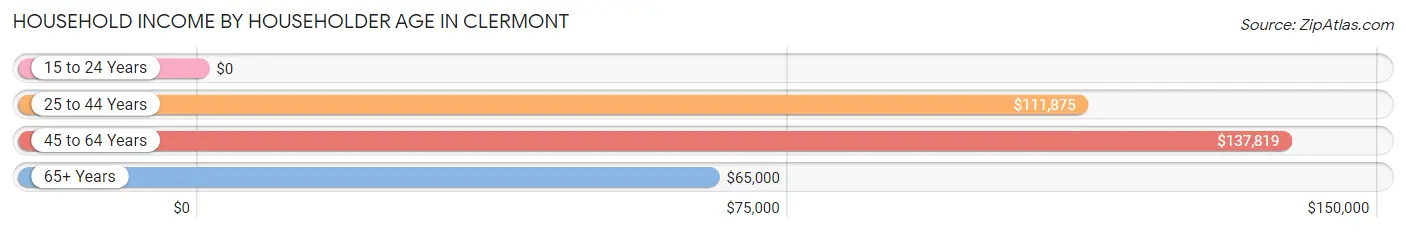
| Income Bracket | # Households | Median Income |
| 15 to 24 Years | 17 (4.3%) | $0 |
| 25 to 44 Years | 117 (29.4%) | $111,875 |
| 45 to 64 Years | 192 (48.2%) | $137,819 |
| 65+ Years | 72 (18.1%) | $65,000 |
| Total | 398 (100.0%) | $96,875 |
Poverty in Clermont
Income Below Poverty by Sex and Age in Clermont
With 4.9% poverty level for males and 12.0% for females among the residents of Clermont, under 5 year old males and 5 year old females are the most vulnerable to poverty, with 8 males (42.1%) and 2 females (100.0%) in their respective age groups living below the poverty level.
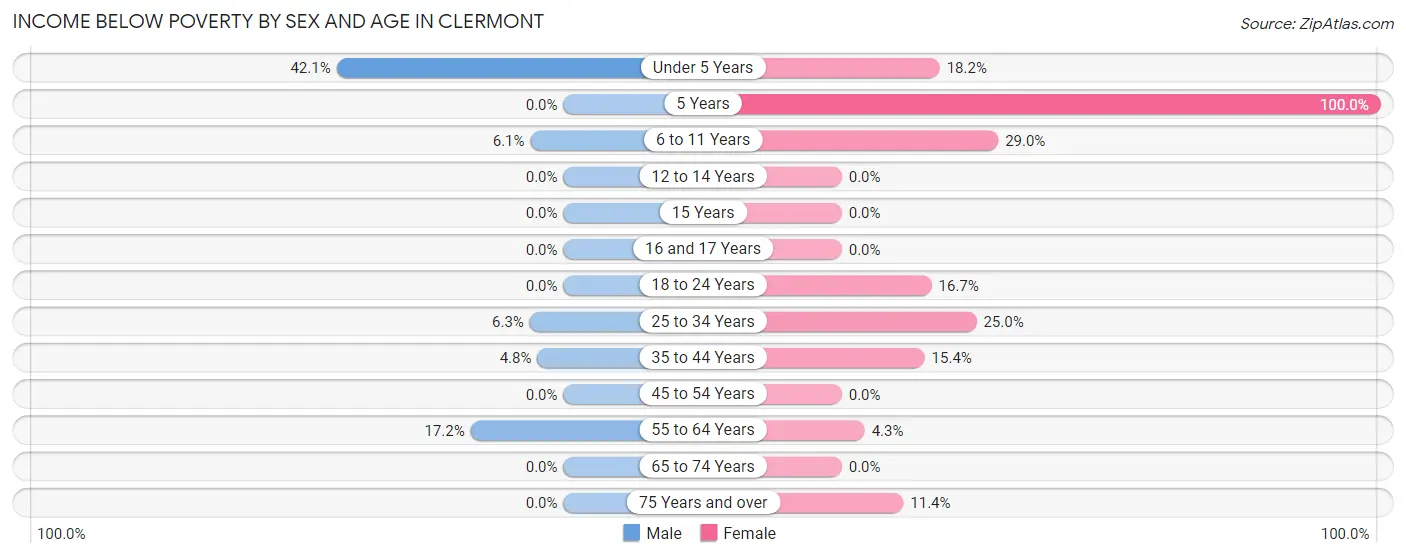
| Age Bracket | Male | Female |
| Under 5 Years | 8 (42.1%) | 10 (18.2%) |
| 5 Years | 0 (0.0%) | 2 (100.0%) |
| 6 to 11 Years | 3 (6.1%) | 9 (29.0%) |
| 12 to 14 Years | 0 (0.0%) | 0 (0.0%) |
| 15 Years | 0 (0.0%) | 0 (0.0%) |
| 16 and 17 Years | 0 (0.0%) | 0 (0.0%) |
| 18 to 24 Years | 0 (0.0%) | 11 (16.7%) |
| 25 to 34 Years | 3 (6.2%) | 17 (25.0%) |
| 35 to 44 Years | 3 (4.8%) | 10 (15.4%) |
| 45 to 54 Years | 0 (0.0%) | 0 (0.0%) |
| 55 to 64 Years | 10 (17.2%) | 2 (4.3%) |
| 65 to 74 Years | 0 (0.0%) | 0 (0.0%) |
| 75 Years and over | 0 (0.0%) | 4 (11.4%) |
| Total | 27 (4.9%) | 65 (12.0%) |
Income Above Poverty by Sex and Age in Clermont
According to the poverty statistics in Clermont, males aged 5 years and females aged 12 to 14 years are the age groups that are most secure financially, with 100.0% of males and 100.0% of females in these age groups living above the poverty line.
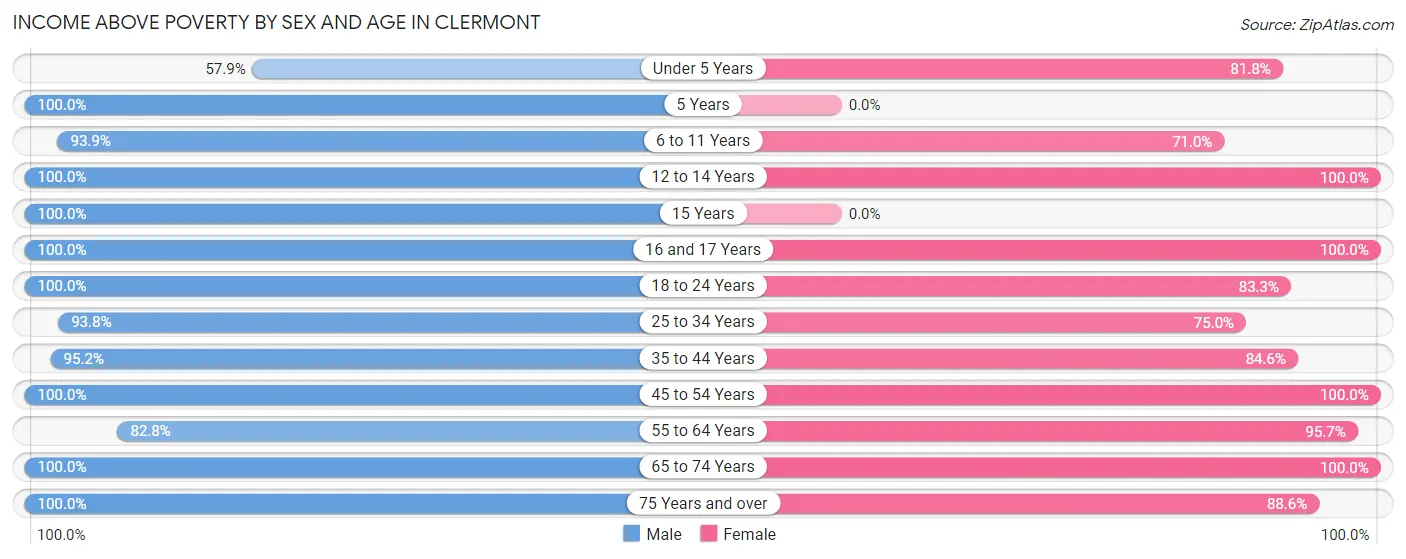
| Age Bracket | Male | Female |
| Under 5 Years | 11 (57.9%) | 45 (81.8%) |
| 5 Years | 14 (100.0%) | 0 (0.0%) |
| 6 to 11 Years | 46 (93.9%) | 22 (71.0%) |
| 12 to 14 Years | 25 (100.0%) | 4 (100.0%) |
| 15 Years | 7 (100.0%) | 0 (0.0%) |
| 16 and 17 Years | 16 (100.0%) | 17 (100.0%) |
| 18 to 24 Years | 62 (100.0%) | 55 (83.3%) |
| 25 to 34 Years | 45 (93.8%) | 51 (75.0%) |
| 35 to 44 Years | 59 (95.2%) | 55 (84.6%) |
| 45 to 54 Years | 116 (100.0%) | 116 (100.0%) |
| 55 to 64 Years | 48 (82.8%) | 45 (95.7%) |
| 65 to 74 Years | 56 (100.0%) | 35 (100.0%) |
| 75 Years and over | 16 (100.0%) | 31 (88.6%) |
| Total | 521 (95.1%) | 476 (88.0%) |
Income Below Poverty Among Married-Couple Families in Clermont
The poverty statistics for married-couple families in Clermont show that 1.9% or 5 of the total 262 families live below the poverty line. Families with 3 or 4 children have the highest poverty rate of 25.0%, comprising of 5 families. On the other hand, families with no children have the lowest poverty rate of 0.0%, which includes 0 families.
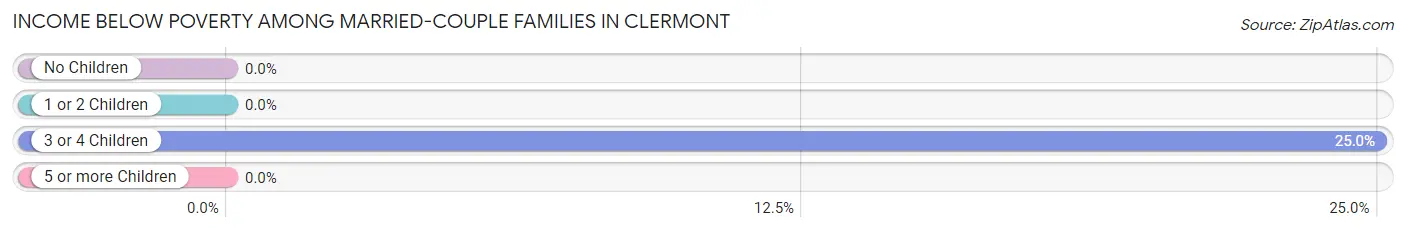
| Children | Above Poverty | Below Poverty |
| No Children | 169 (100.0%) | 0 (0.0%) |
| 1 or 2 Children | 70 (100.0%) | 0 (0.0%) |
| 3 or 4 Children | 15 (75.0%) | 5 (25.0%) |
| 5 or more Children | 3 (100.0%) | 0 (0.0%) |
| Total | 257 (98.1%) | 5 (1.9%) |
Income Below Poverty Among Single-Parent Households in Clermont
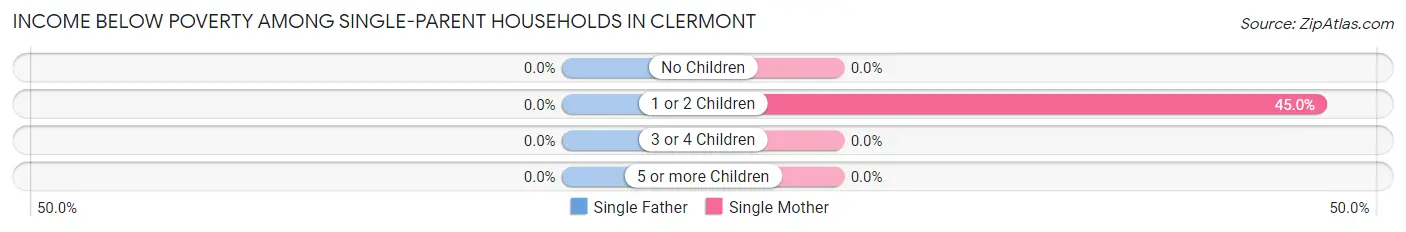
| Children | Single Father | Single Mother |
| No Children | 0 (0.0%) | 0 (0.0%) |
| 1 or 2 Children | 0 (0.0%) | 9 (45.0%) |
| 3 or 4 Children | 0 (0.0%) | 0 (0.0%) |
| 5 or more Children | 0 (0.0%) | 0 (0.0%) |
| Total | 0 (0.0%) | 9 (36.0%) |
Income Below Poverty Among Married-Couple vs Single-Parent Households in Clermont
The poverty data for Clermont shows that 5 of the married-couple family households (1.9%) and 9 of the single-parent households (17.3%) are living below the poverty level. Within the married-couple family households, those with 3 or 4 children have the highest poverty rate, with 5 households (25.0%) falling below the poverty line. Among the single-parent households, those with 1 or 2 children have the highest poverty rate, with 9 household (19.2%) living below poverty.
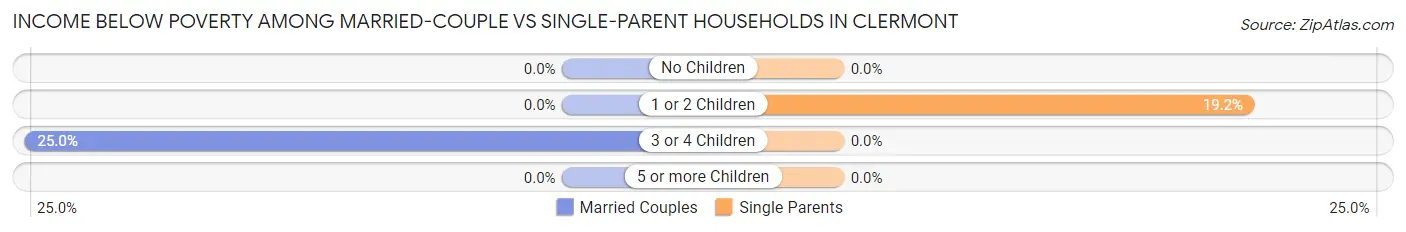
| Children | Married-Couple Families | Single-Parent Households |
| No Children | 0 (0.0%) | 0 (0.0%) |
| 1 or 2 Children | 0 (0.0%) | 9 (19.2%) |
| 3 or 4 Children | 5 (25.0%) | 0 (0.0%) |
| 5 or more Children | 0 (0.0%) | 0 (0.0%) |
| Total | 5 (1.9%) | 9 (17.3%) |
Race in Clermont
The most populous races in Clermont are White / Caucasian (1,060 | 97.1%), Hispanic or Latino (46 | 4.2%), and Some other Race (18 | 1.7%).
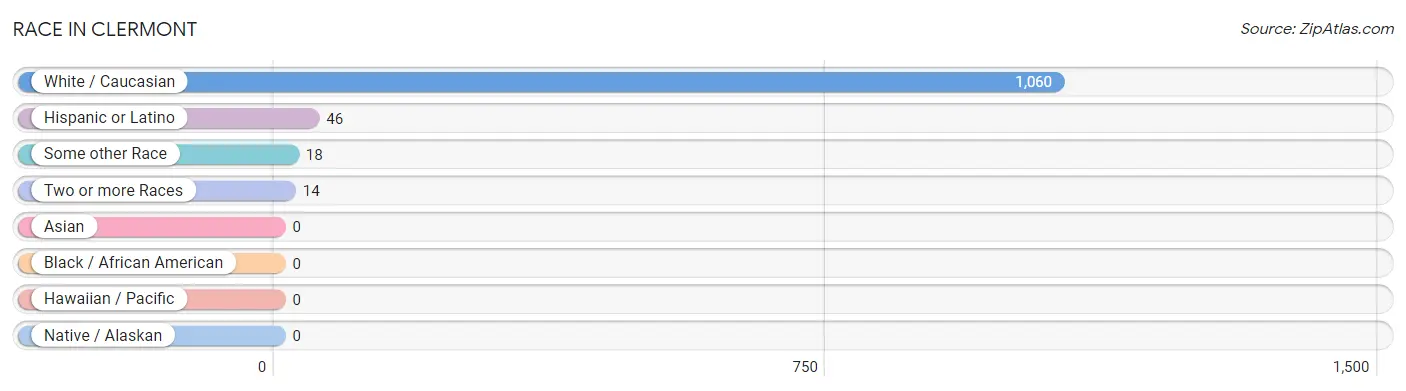
| Race | # Population | % Population |
| Asian | 0 | 0.0% |
| Black / African American | 0 | 0.0% |
| Hawaiian / Pacific | 0 | 0.0% |
| Hispanic or Latino | 46 | 4.2% |
| Native / Alaskan | 0 | 0.0% |
| White / Caucasian | 1,060 | 97.1% |
| Two or more Races | 14 | 1.3% |
| Some other Race | 18 | 1.7% |
| Total | 1,092 | 100.0% |
Ancestry in Clermont
The most populous ancestries reported in Clermont are English (140 | 12.8%), German (108 | 9.9%), American (88 | 8.1%), Irish (69 | 6.3%), and Mexican (46 | 4.2%), together accounting for 41.3% of all Clermont residents.
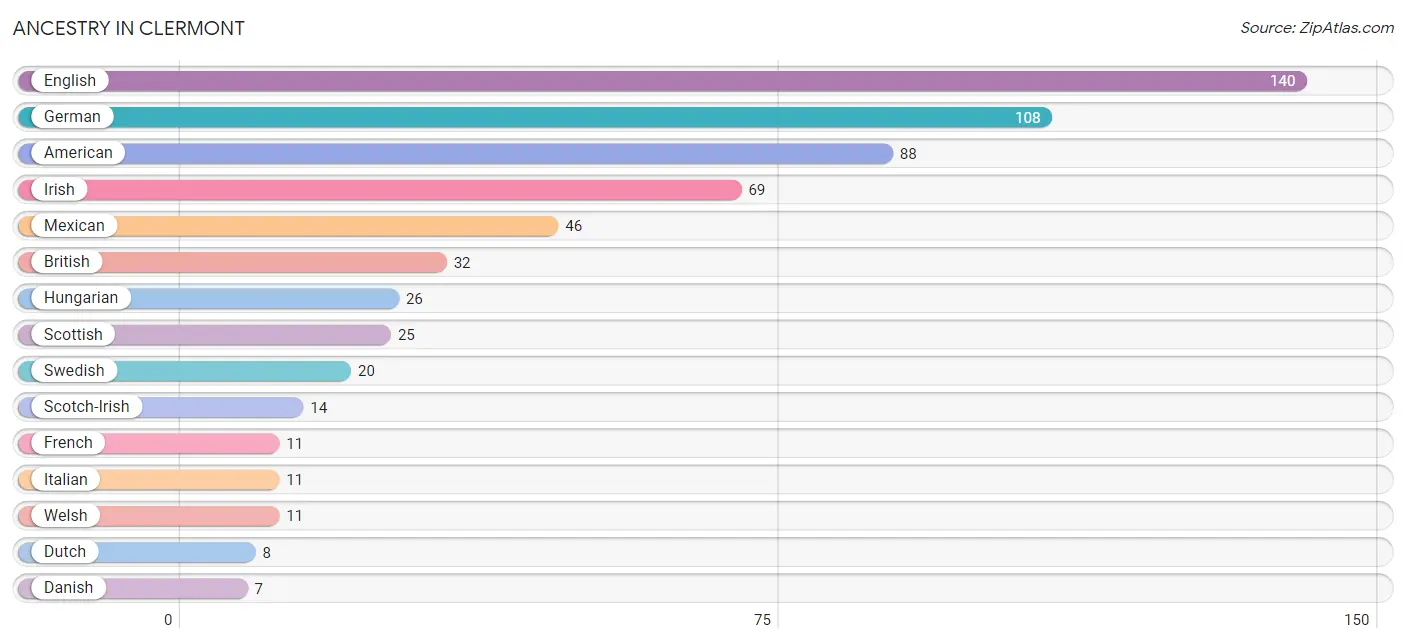
| Ancestry | # Population | % Population |
| American | 88 | 8.1% |
| Armenian | 2 | 0.2% |
| Belgian | 2 | 0.2% |
| British | 32 | 2.9% |
| Danish | 7 | 0.6% |
| Dutch | 8 | 0.7% |
| English | 140 | 12.8% |
| European | 5 | 0.5% |
| Finnish | 2 | 0.2% |
| French | 11 | 1.0% |
| German | 108 | 9.9% |
| Hungarian | 26 | 2.4% |
| Irish | 69 | 6.3% |
| Italian | 11 | 1.0% |
| Mexican | 46 | 4.2% |
| Northern European | 2 | 0.2% |
| Portuguese | 2 | 0.2% |
| Scotch-Irish | 14 | 1.3% |
| Scottish | 25 | 2.3% |
| Swedish | 20 | 1.8% |
| Welsh | 11 | 1.0% | View All 21 Rows |
Immigrants in Clermont
The most numerous immigrant groups reported in Clermont came from Central America (18 | 1.7%), Latin America (18 | 1.7%), and Mexico (18 | 1.7%), together accounting for 5.0% of all Clermont residents.
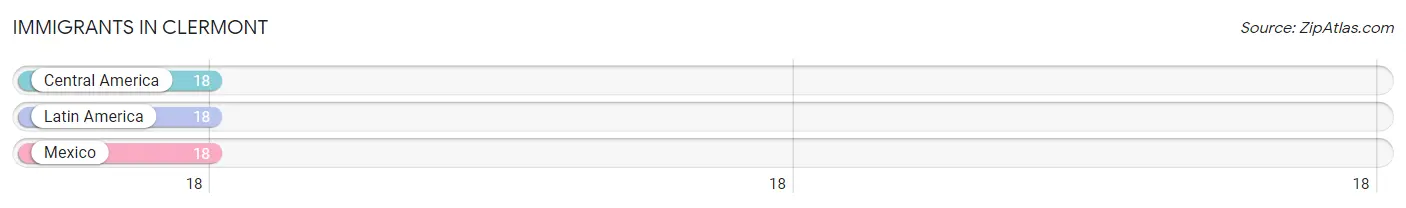
| Immigration Origin | # Population | % Population |
| Central America | 18 | 1.7% |
| Latin America | 18 | 1.7% |
| Mexico | 18 | 1.7% | View All 3 Rows |
Sex and Age in Clermont
Sex and Age in Clermont
The most populous age groups in Clermont are 50 to 54 Years (83 | 15.1%) for men and 45 to 49 Years (69 | 12.8%) for women.
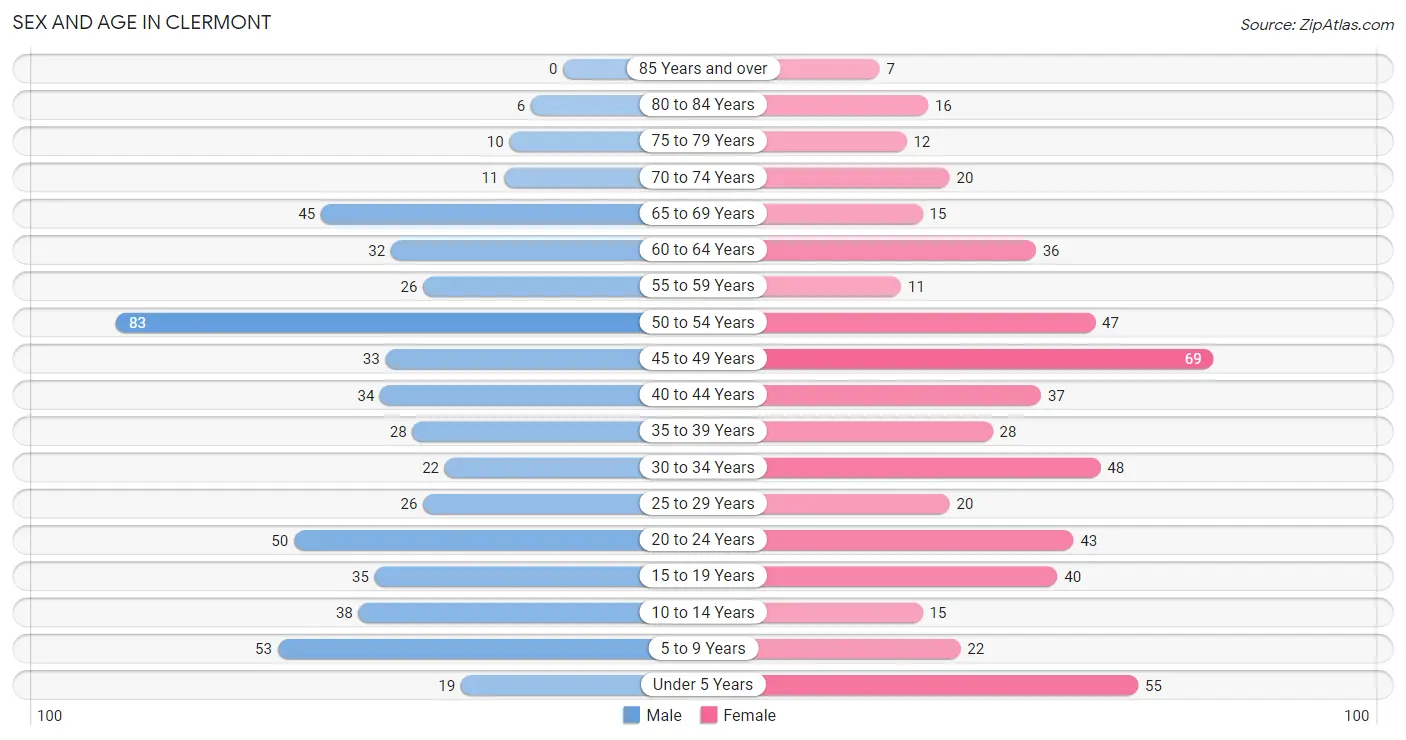
| Age Bracket | Male | Female |
| Under 5 Years | 19 (3.5%) | 55 (10.2%) |
| 5 to 9 Years | 53 (9.6%) | 22 (4.1%) |
| 10 to 14 Years | 38 (6.9%) | 15 (2.8%) |
| 15 to 19 Years | 35 (6.4%) | 40 (7.4%) |
| 20 to 24 Years | 50 (9.1%) | 43 (8.0%) |
| 25 to 29 Years | 26 (4.7%) | 20 (3.7%) |
| 30 to 34 Years | 22 (4.0%) | 48 (8.9%) |
| 35 to 39 Years | 28 (5.1%) | 28 (5.2%) |
| 40 to 44 Years | 34 (6.2%) | 37 (6.8%) |
| 45 to 49 Years | 33 (6.0%) | 69 (12.8%) |
| 50 to 54 Years | 83 (15.1%) | 47 (8.7%) |
| 55 to 59 Years | 26 (4.7%) | 11 (2.0%) |
| 60 to 64 Years | 32 (5.8%) | 36 (6.7%) |
| 65 to 69 Years | 45 (8.2%) | 15 (2.8%) |
| 70 to 74 Years | 11 (2.0%) | 20 (3.7%) |
| 75 to 79 Years | 10 (1.8%) | 12 (2.2%) |
| 80 to 84 Years | 6 (1.1%) | 16 (3.0%) |
| 85 Years and over | 0 (0.0%) | 7 (1.3%) |
| Total | 551 (100.0%) | 541 (100.0%) |
Families and Households in Clermont
Median Family Size in Clermont
The median family size in Clermont is 3.08 persons per family, with married-couple families (262 | 83.4%) accounting for the largest median family size of 3.16 persons per family. On the other hand, single male/father families (27 | 8.6%) represent the smallest median family size with 2.59 persons per family.
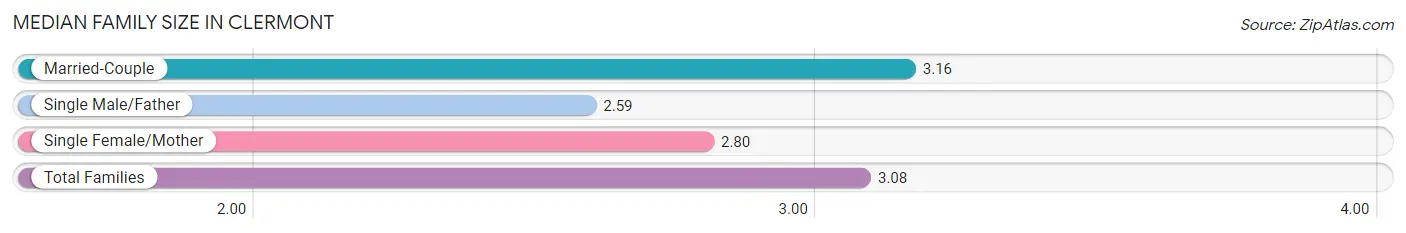
| Family Type | # Families | Family Size |
| Married-Couple | 262 (83.4%) | 3.16 |
| Single Male/Father | 27 (8.6%) | 2.59 |
| Single Female/Mother | 25 (8.0%) | 2.80 |
| Total Families | 314 (100.0%) | 3.08 |
Median Household Size in Clermont
The median household size in Clermont is 2.74 persons per household, with married-couple households (262 | 65.8%) accounting for the largest median household size of 3.22 persons per household. non-family households (84 | 21.1%) represent the smallest median household size with 1.11 persons per household.
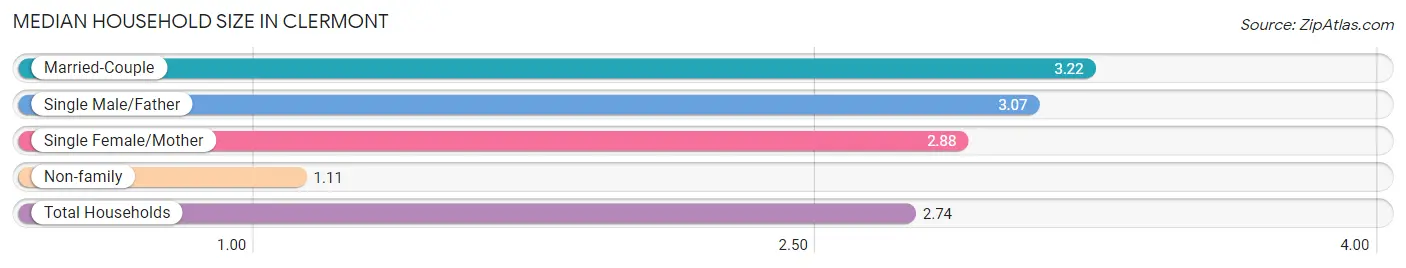
| Household Type | # Households | Household Size |
| Married-Couple | 262 (65.8%) | 3.22 |
| Single Male/Father | 27 (6.8%) | 3.07 |
| Single Female/Mother | 25 (6.3%) | 2.88 |
| Non-family | 84 (21.1%) | 1.11 |
| Total Households | 398 (100.0%) | 2.74 |
Household Size by Marriage Status in Clermont
Out of a total of 398 households in Clermont, 314 (78.9%) are family households, while 84 (21.1%) are nonfamily households. The most numerous type of family households are 2-person households, comprising 164, and the most common type of nonfamily households are 1-person households, comprising 75.
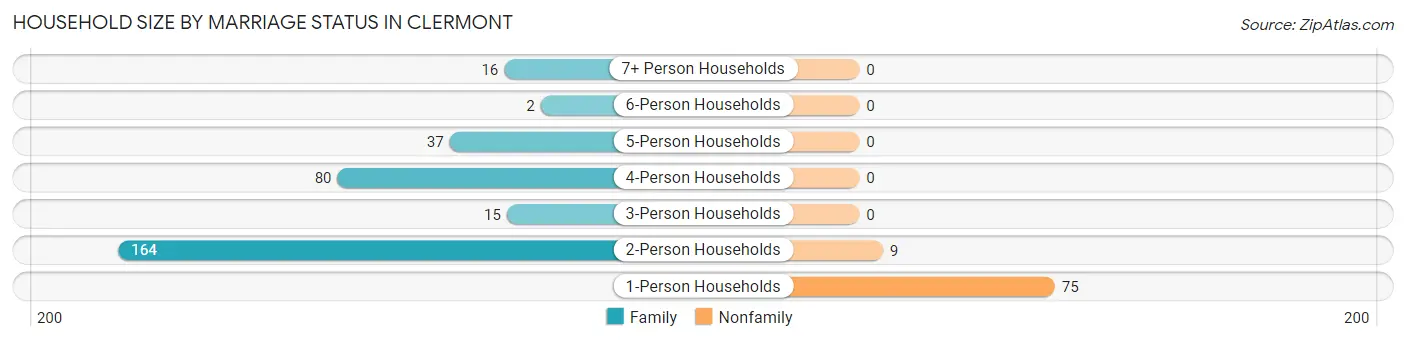
| Household Size | Family Households | Nonfamily Households |
| 1-Person Households | - | 75 (18.8%) |
| 2-Person Households | 164 (41.2%) | 9 (2.3%) |
| 3-Person Households | 15 (3.8%) | 0 (0.0%) |
| 4-Person Households | 80 (20.1%) | 0 (0.0%) |
| 5-Person Households | 37 (9.3%) | 0 (0.0%) |
| 6-Person Households | 2 (0.5%) | 0 (0.0%) |
| 7+ Person Households | 16 (4.0%) | 0 (0.0%) |
| Total | 314 (78.9%) | 84 (21.1%) |
Female Fertility in Clermont
Fertility by Age in Clermont
Average fertility rate in Clermont is 37.0 births per 1,000 women. Women in the age bracket of 20 to 34 years have the highest fertility rate with 99.0 births per 1,000 women. Women in the age bracket of 20 to 34 years acount for 100.0% of all women with births.
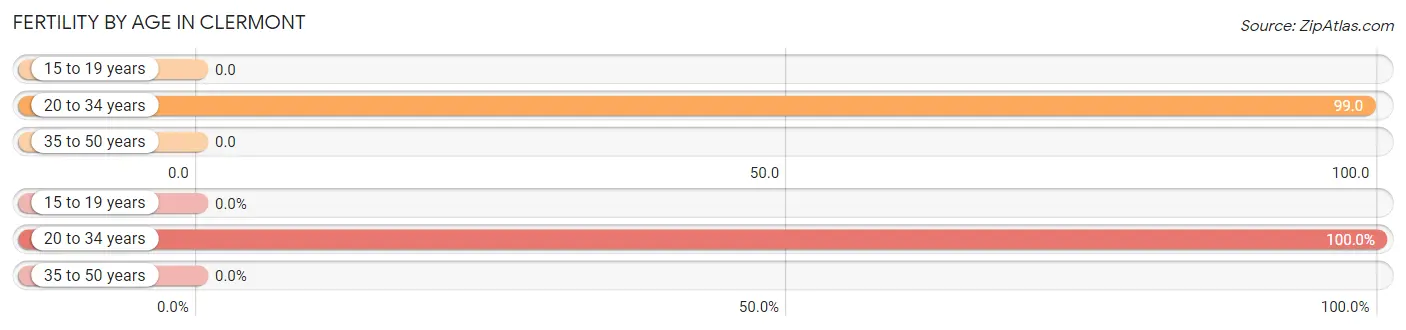
| Age Bracket | Women with Births | Births / 1,000 Women |
| 15 to 19 years | 0 (0.0%) | 0.0 |
| 20 to 34 years | 11 (100.0%) | 99.0 |
| 35 to 50 years | 0 (0.0%) | 0.0 |
| Total | 11 (100.0%) | 37.0 |
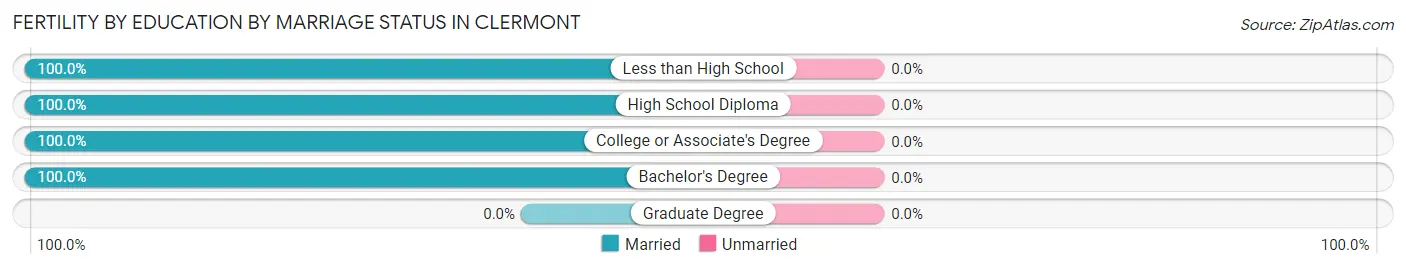
Fertility by Age by Marriage Status in Clermont
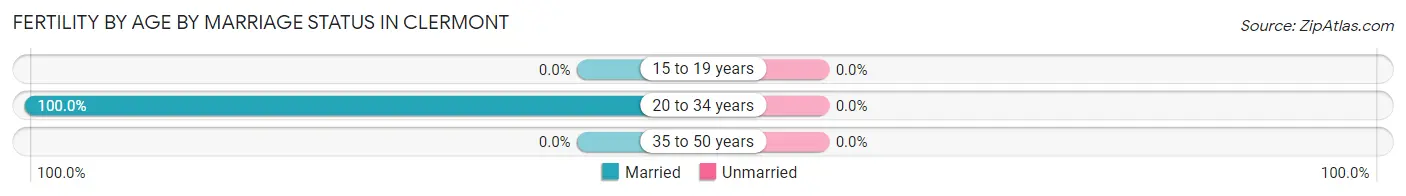
| Age Bracket | Married | Unmarried |
| 15 to 19 years | 0 (0.0%) | 0 (0.0%) |
| 20 to 34 years | 11 (100.0%) | 0 (0.0%) |
| 35 to 50 years | 0 (0.0%) | 0 (0.0%) |
| Total | 11 (100.0%) | 0 (0.0%) |
Fertility by Education in Clermont
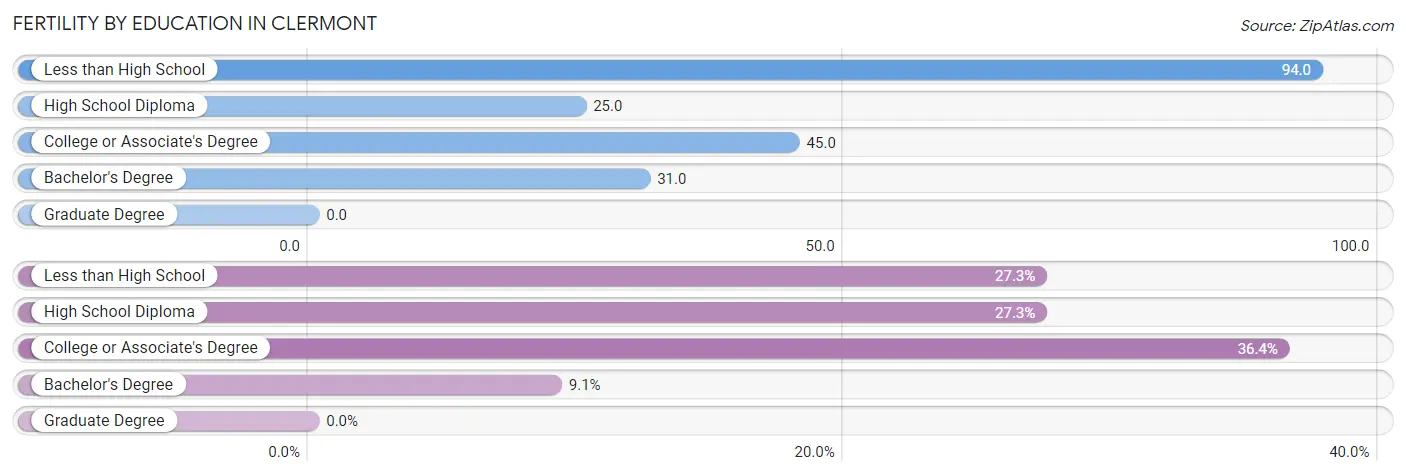
| Educational Attainment | Women with Births | Births / 1,000 Women |
| Less than High School | 3 (27.3%) | 94.0 |
| High School Diploma | 3 (27.3%) | 25.0 |
| College or Associate's Degree | 4 (36.4%) | 45.0 |
| Bachelor's Degree | 1 (9.1%) | 31.0 |
| Graduate Degree | 0 (0.0%) | 0.0 |
| Total | 11 (100.0%) | 37.0 |
Fertility by Education by Marriage Status in Clermont
| Educational Attainment | Married | Unmarried |
| Less than High School | 3 (100.0%) | 0 (0.0%) |
| High School Diploma | 3 (100.0%) | 0 (0.0%) |
| College or Associate's Degree | 4 (100.0%) | 0 (0.0%) |
| Bachelor's Degree | 1 (100.0%) | 0 (0.0%) |
| Graduate Degree | 0 (0.0%) | 0 (0.0%) |
| Total | 11 (100.0%) | 0 (0.0%) |
Employment Characteristics in Clermont
Employment by Class of Employer in Clermont
Among the 623 employed individuals in Clermont, private company employees (457 | 73.4%), self-employed (incorporated) (44 | 7.1%), and local government employees (38 | 6.1%) make up the most common classes of employment.
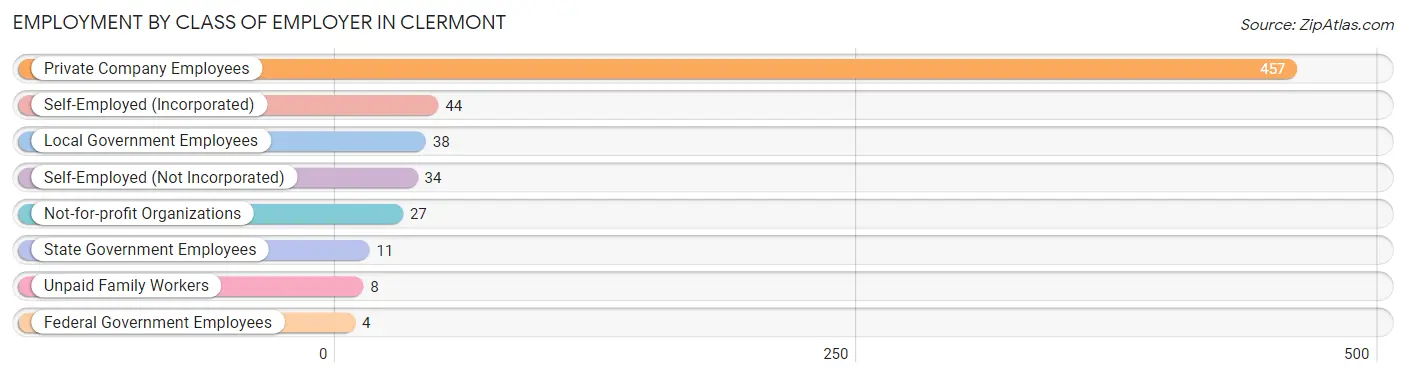
| Employer Class | # Employees | % Employees |
| Private Company Employees | 457 | 73.4% |
| Self-Employed (Incorporated) | 44 | 7.1% |
| Self-Employed (Not Incorporated) | 34 | 5.5% |
| Not-for-profit Organizations | 27 | 4.3% |
| Local Government Employees | 38 | 6.1% |
| State Government Employees | 11 | 1.8% |
| Federal Government Employees | 4 | 0.6% |
| Unpaid Family Workers | 8 | 1.3% |
| Total | 623 | 100.0% |
Employment Status by Age in Clermont
According to the labor force statistics for Clermont, out of the total population over 16 years of age (883), 72.4% or 639 individuals are in the labor force, with 1.9% or 12 of them unemployed. The age group with the highest labor force participation rate is 20 to 24 years, with 93.5% or 87 individuals in the labor force. Within the labor force, the 20 to 24 years age range has the highest percentage of unemployed individuals, with 11.5% or 10 of them being unemployed.
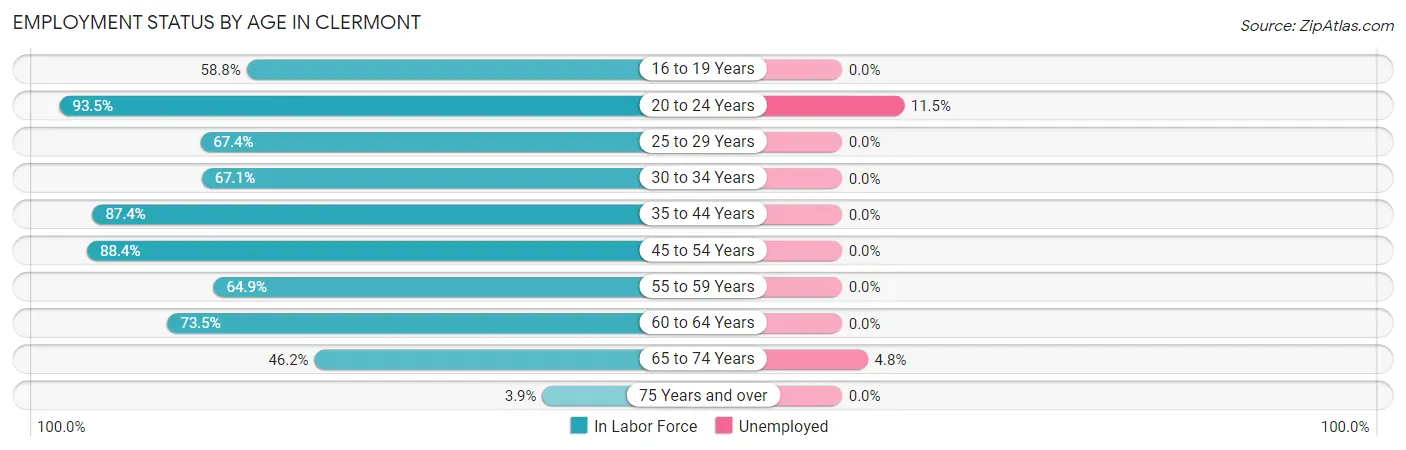
| Age Bracket | In Labor Force | Unemployed |
| 16 to 19 Years | 40 (58.8%) | 0 (0.0%) |
| 20 to 24 Years | 87 (93.5%) | 10 (11.5%) |
| 25 to 29 Years | 31 (67.4%) | 0 (0.0%) |
| 30 to 34 Years | 47 (67.1%) | 0 (0.0%) |
| 35 to 44 Years | 111 (87.4%) | 0 (0.0%) |
| 45 to 54 Years | 205 (88.4%) | 0 (0.0%) |
| 55 to 59 Years | 24 (64.9%) | 0 (0.0%) |
| 60 to 64 Years | 50 (73.5%) | 0 (0.0%) |
| 65 to 74 Years | 42 (46.2%) | 2 (4.8%) |
| 75 Years and over | 2 (3.9%) | 0 (0.0%) |
| Total | 639 (72.4%) | 12 (1.9%) |
Employment Status by Educational Attainment in Clermont
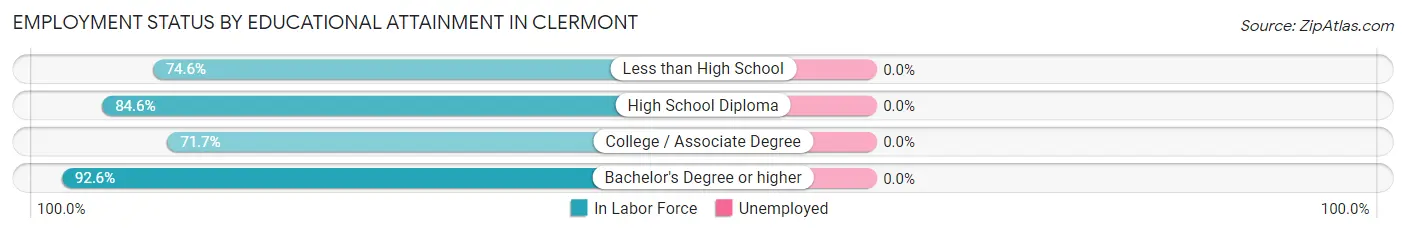
| Educational Attainment | In Labor Force | Unemployed |
| Less than High School | 50 (74.6%) | 0 (0.0%) |
| High School Diploma | 198 (84.6%) | 0 (0.0%) |
| College / Associate Degree | 132 (71.7%) | 0 (0.0%) |
| Bachelor's Degree or higher | 88 (92.6%) | 0 (0.0%) |
| Total | 468 (80.7%) | 0 (0.0%) |
Employment Occupations by Sex in Clermont
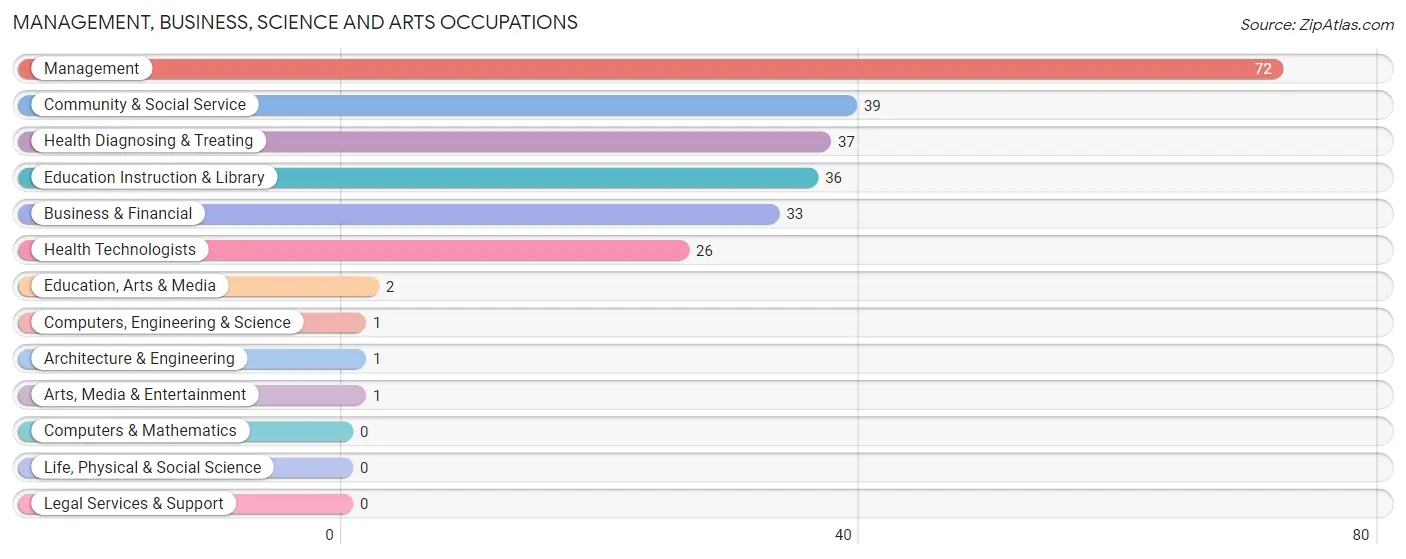
Management, Business, Science and Arts Occupations
The most common Management, Business, Science and Arts occupations in Clermont are Management (72 | 11.5%), Community & Social Service (39 | 6.2%), Health Diagnosing & Treating (37 | 5.9%), Education Instruction & Library (36 | 5.7%), and Business & Financial (33 | 5.3%).
Management, Business, Science and Arts Occupations by Sex
Within the Management, Business, Science and Arts occupations in Clermont, the most male-oriented occupations are Computers, Engineering & Science (100.0%), Architecture & Engineering (100.0%), and Management (76.4%), while the most female-oriented occupations are Education, Arts & Media (100.0%), Arts, Media & Entertainment (100.0%), and Health Diagnosing & Treating (78.4%).
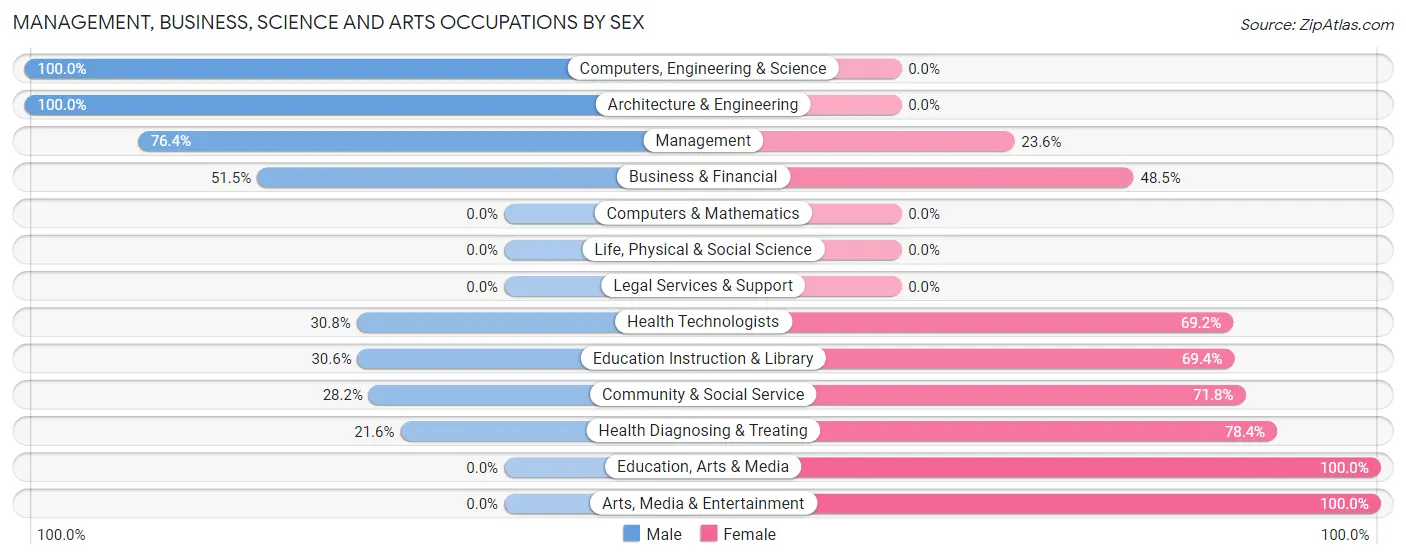
| Occupation | Male | Female |
| Management | 55 (76.4%) | 17 (23.6%) |
| Business & Financial | 17 (51.5%) | 16 (48.5%) |
| Computers, Engineering & Science | 1 (100.0%) | 0 (0.0%) |
| Computers & Mathematics | 0 (0.0%) | 0 (0.0%) |
| Architecture & Engineering | 1 (100.0%) | 0 (0.0%) |
| Life, Physical & Social Science | 0 (0.0%) | 0 (0.0%) |
| Community & Social Service | 11 (28.2%) | 28 (71.8%) |
| Education, Arts & Media | 0 (0.0%) | 2 (100.0%) |
| Legal Services & Support | 0 (0.0%) | 0 (0.0%) |
| Education Instruction & Library | 11 (30.6%) | 25 (69.4%) |
| Arts, Media & Entertainment | 0 (0.0%) | 1 (100.0%) |
| Health Diagnosing & Treating | 8 (21.6%) | 29 (78.4%) |
| Health Technologists | 8 (30.8%) | 18 (69.2%) |
| Total (Category) | 92 (50.5%) | 90 (49.4%) |
| Total (Overall) | 337 (53.7%) | 290 (46.3%) |
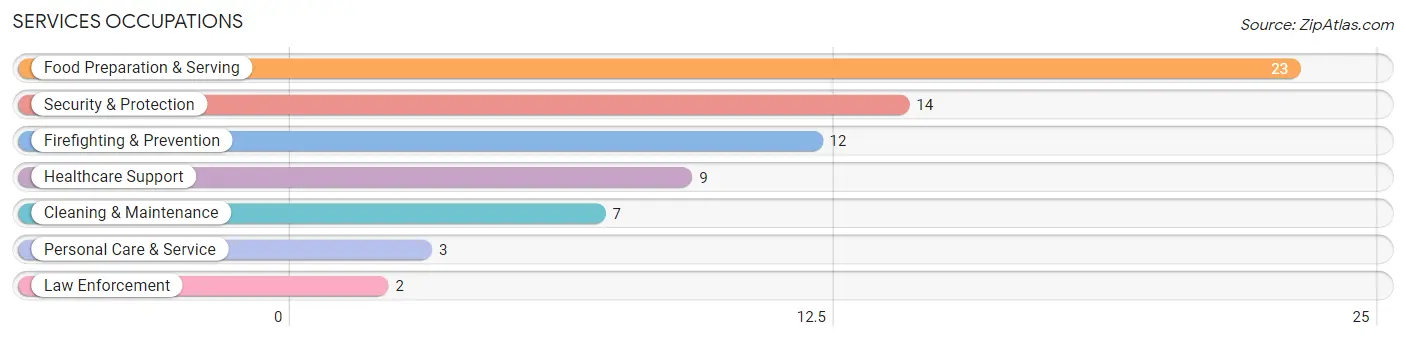
Services Occupations
The most common Services occupations in Clermont are Food Preparation & Serving (23 | 3.7%), Security & Protection (14 | 2.2%), Firefighting & Prevention (12 | 1.9%), Healthcare Support (9 | 1.4%), and Cleaning & Maintenance (7 | 1.1%).
Services Occupations by Sex
Within the Services occupations in Clermont, the most male-oriented occupations are Law Enforcement (100.0%), Personal Care & Service (100.0%), and Security & Protection (42.9%), while the most female-oriented occupations are Healthcare Support (100.0%), Food Preparation & Serving (78.3%), and Firefighting & Prevention (66.7%).
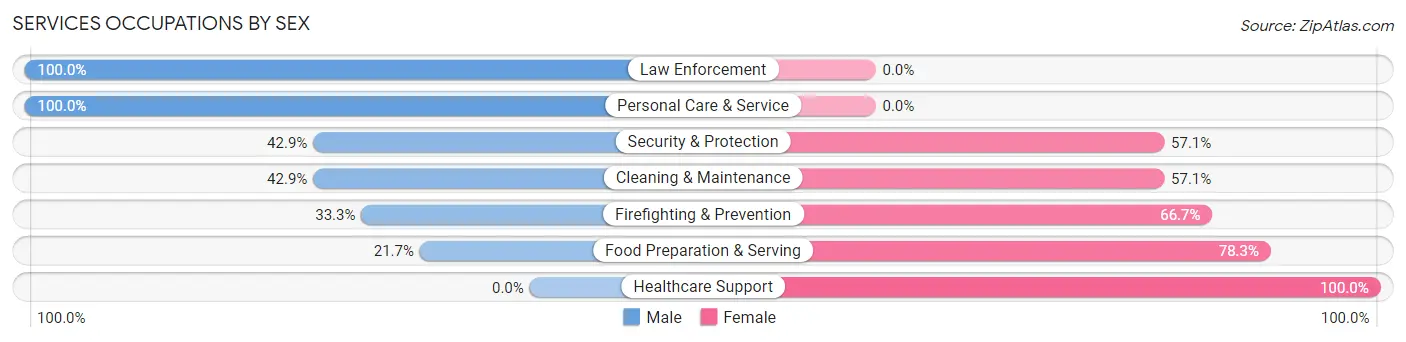
| Occupation | Male | Female |
| Healthcare Support | 0 (0.0%) | 9 (100.0%) |
| Security & Protection | 6 (42.9%) | 8 (57.1%) |
| Firefighting & Prevention | 4 (33.3%) | 8 (66.7%) |
| Law Enforcement | 2 (100.0%) | 0 (0.0%) |
| Food Preparation & Serving | 5 (21.7%) | 18 (78.3%) |
| Cleaning & Maintenance | 3 (42.9%) | 4 (57.1%) |
| Personal Care & Service | 3 (100.0%) | 0 (0.0%) |
| Total (Category) | 17 (30.4%) | 39 (69.6%) |
| Total (Overall) | 337 (53.7%) | 290 (46.3%) |
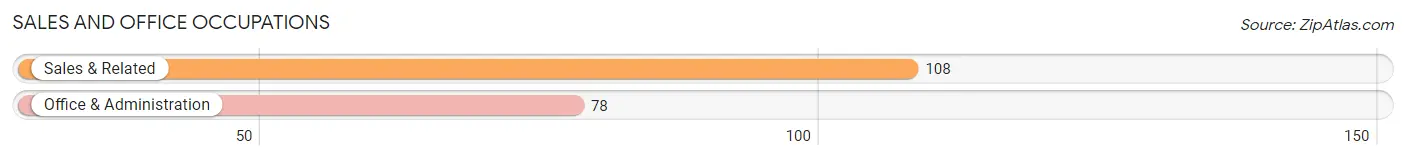
Sales and Office Occupations
The most common Sales and Office occupations in Clermont are Sales & Related (108 | 17.2%), and Office & Administration (78 | 12.4%).
Sales and Office Occupations by Sex
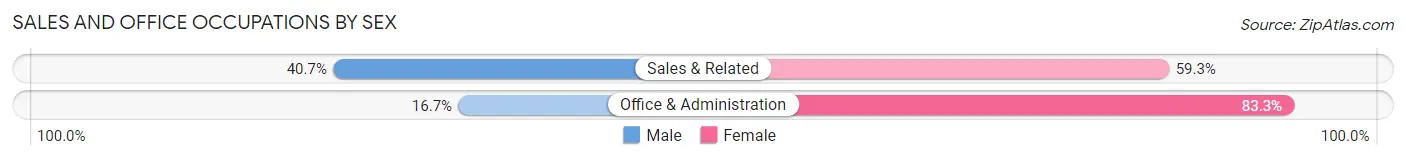
| Occupation | Male | Female |
| Sales & Related | 44 (40.7%) | 64 (59.3%) |
| Office & Administration | 13 (16.7%) | 65 (83.3%) |
| Total (Category) | 57 (30.6%) | 129 (69.4%) |
| Total (Overall) | 337 (53.7%) | 290 (46.3%) |
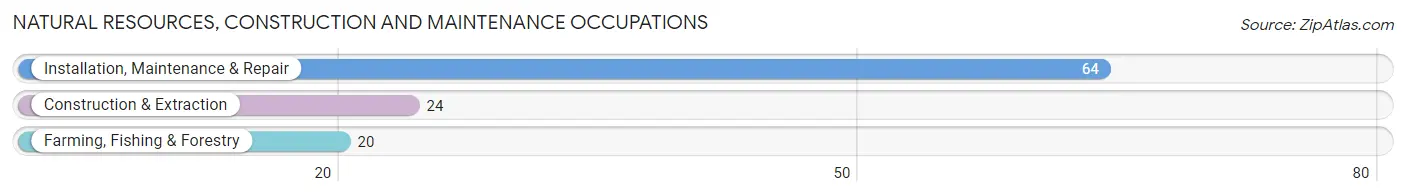
Natural Resources, Construction and Maintenance Occupations
The most common Natural Resources, Construction and Maintenance occupations in Clermont are Installation, Maintenance & Repair (64 | 10.2%), Construction & Extraction (24 | 3.8%), and Farming, Fishing & Forestry (20 | 3.2%).
Natural Resources, Construction and Maintenance Occupations by Sex
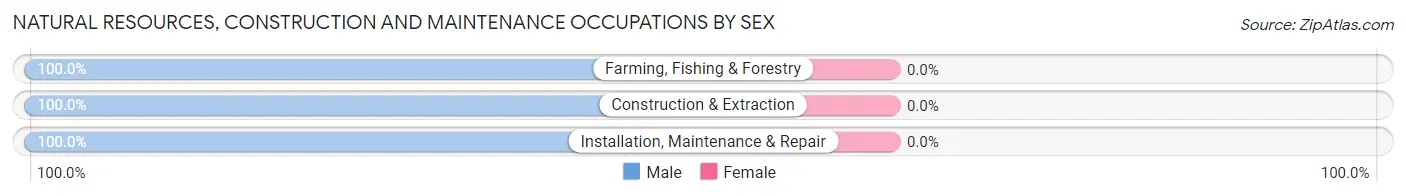
| Occupation | Male | Female |
| Farming, Fishing & Forestry | 20 (100.0%) | 0 (0.0%) |
| Construction & Extraction | 24 (100.0%) | 0 (0.0%) |
| Installation, Maintenance & Repair | 64 (100.0%) | 0 (0.0%) |
| Total (Category) | 108 (100.0%) | 0 (0.0%) |
| Total (Overall) | 337 (53.7%) | 290 (46.3%) |
Production, Transportation and Moving Occupations
The most common Production, Transportation and Moving occupations in Clermont are Production (41 | 6.5%), Transportation (29 | 4.6%), and Material Moving (25 | 4.0%).
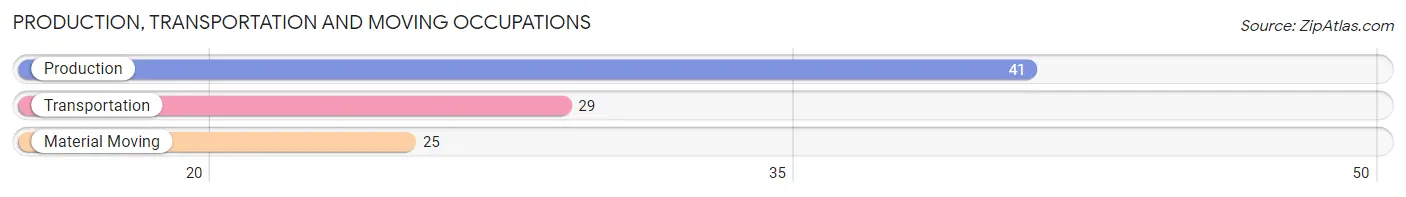
Production, Transportation and Moving Occupations by Sex
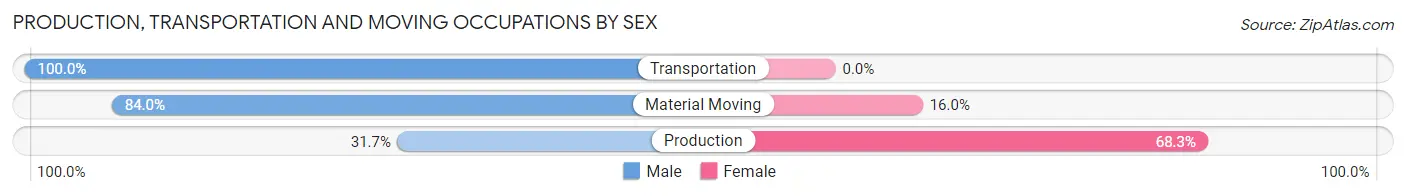
| Occupation | Male | Female |
| Production | 13 (31.7%) | 28 (68.3%) |
| Transportation | 29 (100.0%) | 0 (0.0%) |
| Material Moving | 21 (84.0%) | 4 (16.0%) |
| Total (Category) | 63 (66.3%) | 32 (33.7%) |
| Total (Overall) | 337 (53.7%) | 290 (46.3%) |
Employment Industries by Sex in Clermont
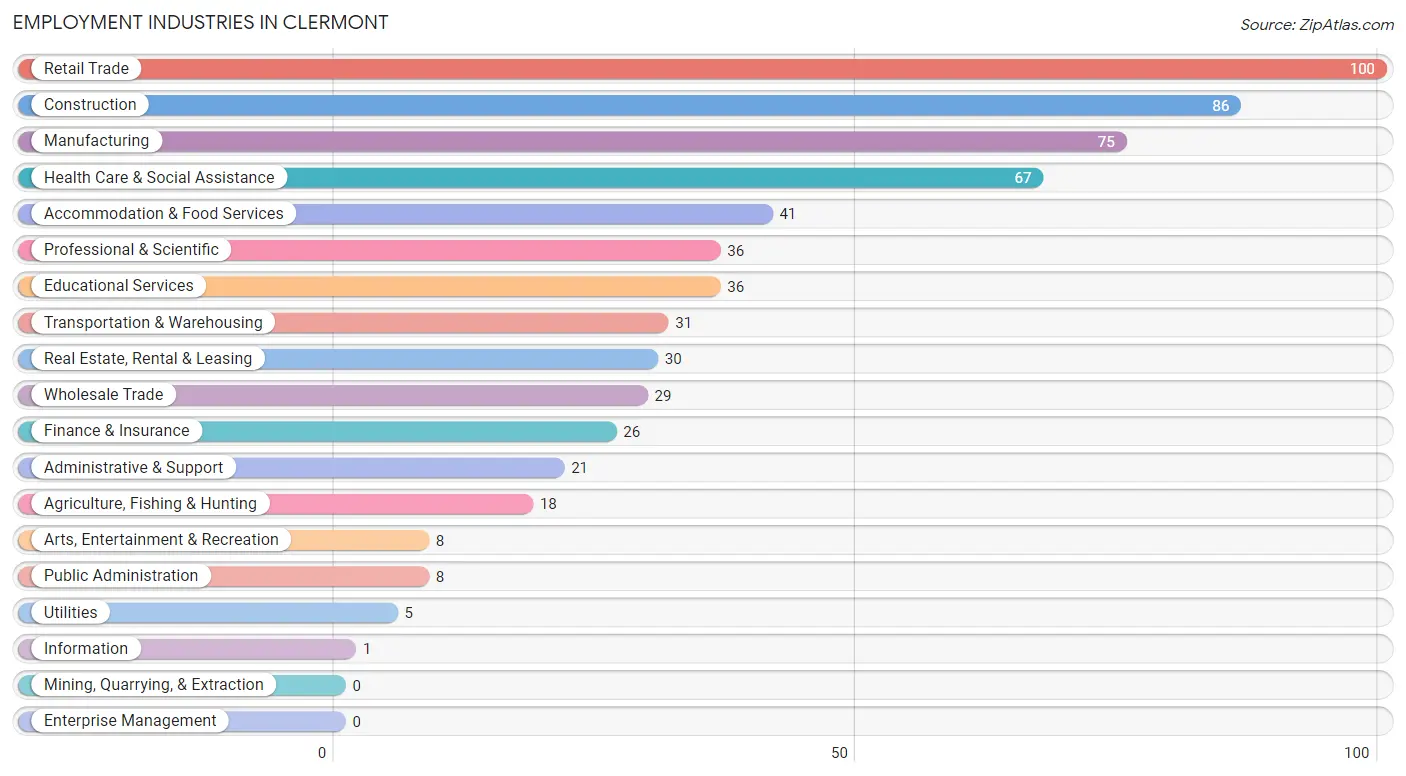
Employment Industries in Clermont
The major employment industries in Clermont include Retail Trade (100 | 16.0%), Construction (86 | 13.7%), Manufacturing (75 | 12.0%), Health Care & Social Assistance (67 | 10.7%), and Accommodation & Food Services (41 | 6.5%).
Employment Industries by Sex in Clermont
The Clermont industries that see more men than women are Construction (100.0%), Utilities (100.0%), and Information (100.0%), whereas the industries that tend to have a higher number of women are Arts, Entertainment & Recreation (100.0%), Health Care & Social Assistance (85.1%), and Accommodation & Food Services (73.2%).
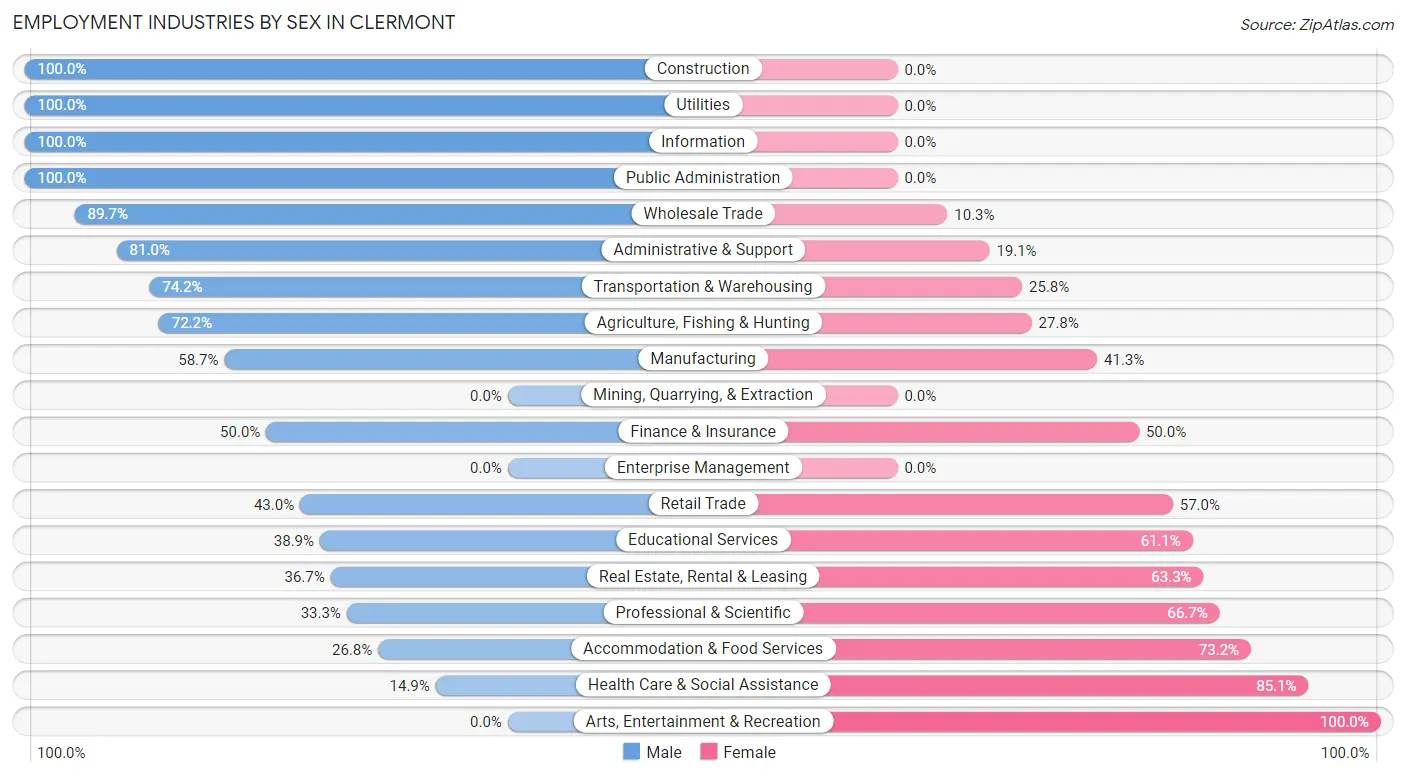
| Industry | Male | Female |
| Agriculture, Fishing & Hunting | 13 (72.2%) | 5 (27.8%) |
| Mining, Quarrying, & Extraction | 0 (0.0%) | 0 (0.0%) |
| Construction | 86 (100.0%) | 0 (0.0%) |
| Manufacturing | 44 (58.7%) | 31 (41.3%) |
| Wholesale Trade | 26 (89.7%) | 3 (10.3%) |
| Retail Trade | 43 (43.0%) | 57 (57.0%) |
| Transportation & Warehousing | 23 (74.2%) | 8 (25.8%) |
| Utilities | 5 (100.0%) | 0 (0.0%) |
| Information | 1 (100.0%) | 0 (0.0%) |
| Finance & Insurance | 13 (50.0%) | 13 (50.0%) |
| Real Estate, Rental & Leasing | 11 (36.7%) | 19 (63.3%) |
| Professional & Scientific | 12 (33.3%) | 24 (66.7%) |
| Enterprise Management | 0 (0.0%) | 0 (0.0%) |
| Administrative & Support | 17 (80.9%) | 4 (19.1%) |
| Educational Services | 14 (38.9%) | 22 (61.1%) |
| Health Care & Social Assistance | 10 (14.9%) | 57 (85.1%) |
| Arts, Entertainment & Recreation | 0 (0.0%) | 8 (100.0%) |
| Accommodation & Food Services | 11 (26.8%) | 30 (73.2%) |
| Public Administration | 8 (100.0%) | 0 (0.0%) |
| Total | 337 (53.7%) | 290 (46.3%) |
Education in Clermont
School Enrollment in Clermont
The most common levels of schooling among the 279 students in Clermont are college / undergraduate (75 | 26.9%), elementary school (52 | 18.6%), and middle school (51 | 18.3%).
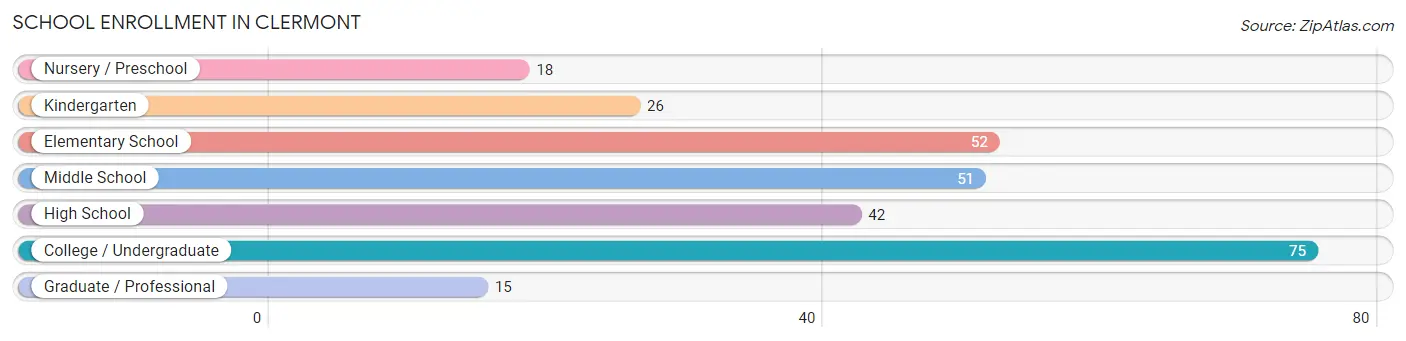
| School Level | # Students | % Students |
| Nursery / Preschool | 18 | 6.5% |
| Kindergarten | 26 | 9.3% |
| Elementary School | 52 | 18.6% |
| Middle School | 51 | 18.3% |
| High School | 42 | 15.0% |
| College / Undergraduate | 75 | 26.9% |
| Graduate / Professional | 15 | 5.4% |
| Total | 279 | 100.0% |
School Enrollment by Age by Funding Source in Clermont
Out of a total of 279 students who are enrolled in schools in Clermont, 57 (20.4%) attend a private institution, while the remaining 222 (79.6%) are enrolled in public schools. The age group of 20 to 24 year olds has the highest likelihood of being enrolled in private schools, with 25 (56.8% in the age bracket) enrolled. Conversely, the age group of 10 to 14 year olds has the lowest likelihood of being enrolled in a private school, with 53 (100.0% in the age bracket) attending a public institution.
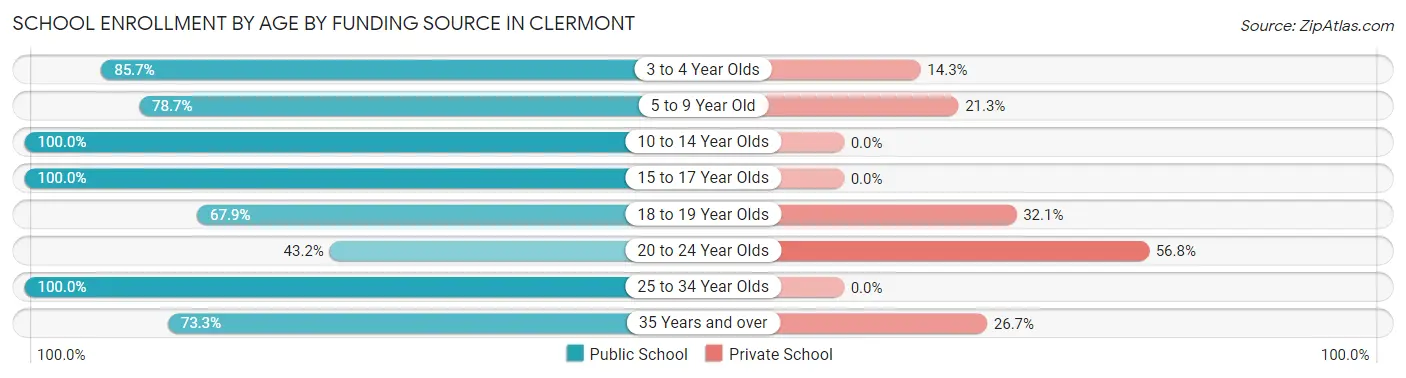
| Age Bracket | Public School | Private School |
| 3 to 4 Year Olds | 18 (85.7%) | 3 (14.3%) |
| 5 to 9 Year Old | 59 (78.7%) | 16 (21.3%) |
| 10 to 14 Year Olds | 53 (100.0%) | 0 (0.0%) |
| 15 to 17 Year Olds | 40 (100.0%) | 0 (0.0%) |
| 18 to 19 Year Olds | 19 (67.9%) | 9 (32.1%) |
| 20 to 24 Year Olds | 19 (43.2%) | 25 (56.8%) |
| 25 to 34 Year Olds | 3 (100.0%) | 0 (0.0%) |
| 35 Years and over | 11 (73.3%) | 4 (26.7%) |
| Total | 222 (79.6%) | 57 (20.4%) |
Educational Attainment by Field of Study in Clermont
Science & technology (40 | 30.3%), business (35 | 26.5%), education (22 | 16.7%), liberal arts & history (6 | 4.5%), and bio, nature & agricultural (4 | 3.0%) are the most common fields of study among 132 individuals in Clermont who have obtained a bachelor's degree or higher.
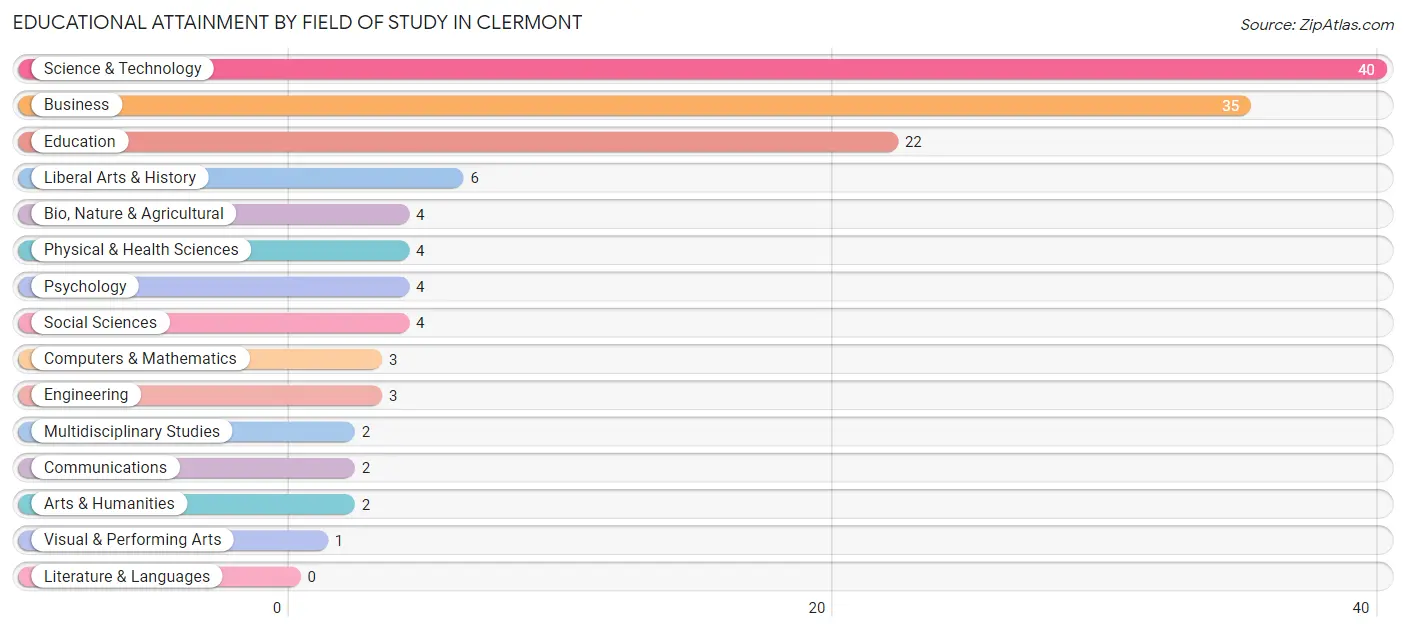
| Field of Study | # Graduates | % Graduates |
| Computers & Mathematics | 3 | 2.3% |
| Bio, Nature & Agricultural | 4 | 3.0% |
| Physical & Health Sciences | 4 | 3.0% |
| Psychology | 4 | 3.0% |
| Social Sciences | 4 | 3.0% |
| Engineering | 3 | 2.3% |
| Multidisciplinary Studies | 2 | 1.5% |
| Science & Technology | 40 | 30.3% |
| Business | 35 | 26.5% |
| Education | 22 | 16.7% |
| Literature & Languages | 0 | 0.0% |
| Liberal Arts & History | 6 | 4.5% |
| Visual & Performing Arts | 1 | 0.8% |
| Communications | 2 | 1.5% |
| Arts & Humanities | 2 | 1.5% |
| Total | 132 | 100.0% |
Transportation & Commute in Clermont
Vehicle Availability by Sex in Clermont
The most prevalent vehicle ownership categories in Clermont are males with 2 vehicles (106, accounting for 31.8%) and females with 2 vehicles (60, making up 36.5%).
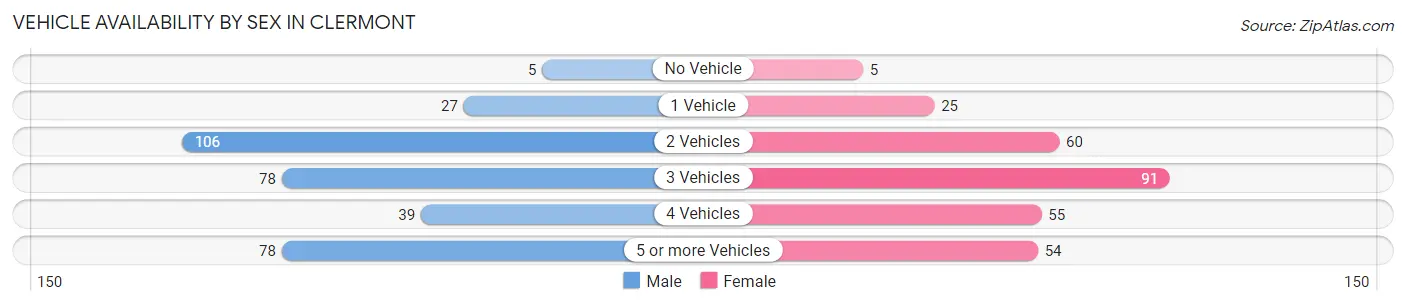
| Vehicles Available | Male | Female |
| No Vehicle | 5 (1.5%) | 5 (1.7%) |
| 1 Vehicle | 27 (8.1%) | 25 (8.6%) |
| 2 Vehicles | 106 (31.8%) | 60 (20.7%) |
| 3 Vehicles | 78 (23.4%) | 91 (31.4%) |
| 4 Vehicles | 39 (11.7%) | 55 (19.0%) |
| 5 or more Vehicles | 78 (23.4%) | 54 (18.6%) |
| Total | 333 (100.0%) | 290 (100.0%) |
Commute Time in Clermont
The most frequently occuring commute durations in Clermont are 30 to 34 minutes (196 commuters, 33.7%), 20 to 24 minutes (140 commuters, 24.1%), and 45 to 59 minutes (99 commuters, 17.0%).
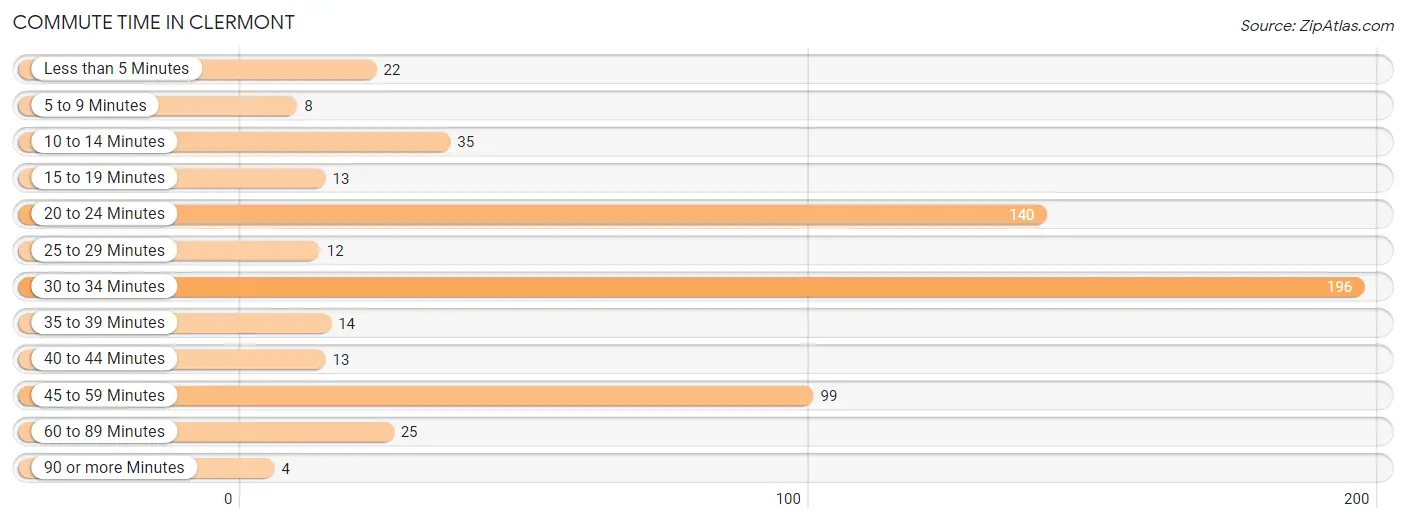
| Commute Time | # Commuters | % Commuters |
| Less than 5 Minutes | 22 | 3.8% |
| 5 to 9 Minutes | 8 | 1.4% |
| 10 to 14 Minutes | 35 | 6.0% |
| 15 to 19 Minutes | 13 | 2.2% |
| 20 to 24 Minutes | 140 | 24.1% |
| 25 to 29 Minutes | 12 | 2.1% |
| 30 to 34 Minutes | 196 | 33.7% |
| 35 to 39 Minutes | 14 | 2.4% |
| 40 to 44 Minutes | 13 | 2.2% |
| 45 to 59 Minutes | 99 | 17.0% |
| 60 to 89 Minutes | 25 | 4.3% |
| 90 or more Minutes | 4 | 0.7% |
Commute Time by Sex in Clermont
The most common commute times in Clermont are 30 to 34 minutes (111 commuters, 36.9%) for males and 20 to 24 minutes (97 commuters, 34.6%) for females.
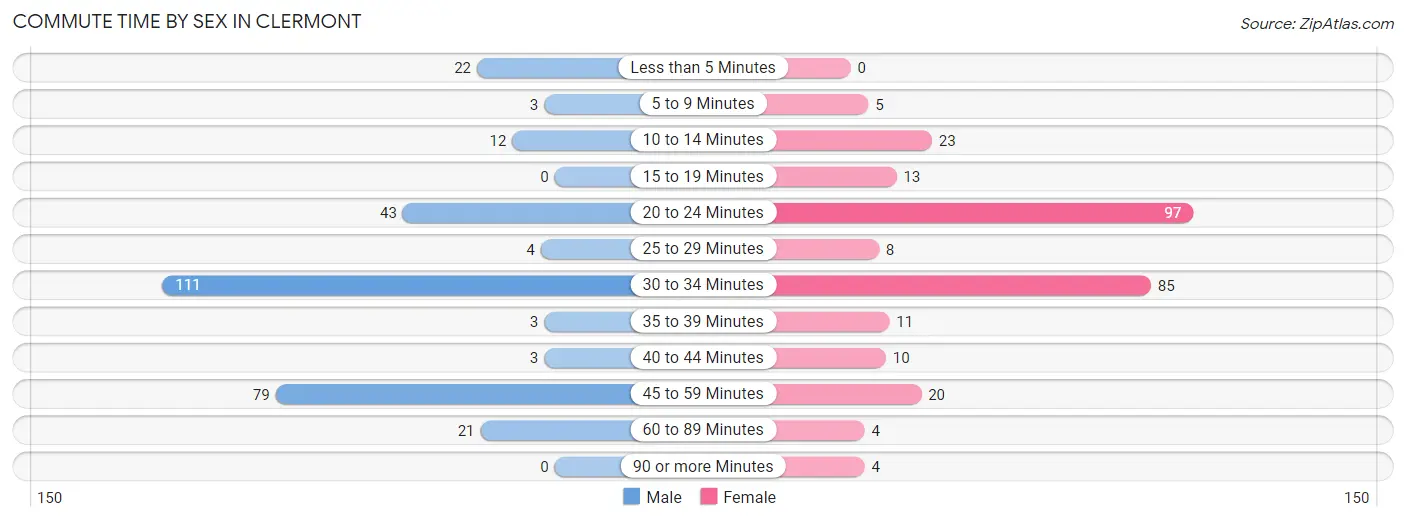
| Commute Time | Male | Female |
| Less than 5 Minutes | 22 (7.3%) | 0 (0.0%) |
| 5 to 9 Minutes | 3 (1.0%) | 5 (1.8%) |
| 10 to 14 Minutes | 12 (4.0%) | 23 (8.2%) |
| 15 to 19 Minutes | 0 (0.0%) | 13 (4.6%) |
| 20 to 24 Minutes | 43 (14.3%) | 97 (34.6%) |
| 25 to 29 Minutes | 4 (1.3%) | 8 (2.9%) |
| 30 to 34 Minutes | 111 (36.9%) | 85 (30.4%) |
| 35 to 39 Minutes | 3 (1.0%) | 11 (3.9%) |
| 40 to 44 Minutes | 3 (1.0%) | 10 (3.6%) |
| 45 to 59 Minutes | 79 (26.3%) | 20 (7.1%) |
| 60 to 89 Minutes | 21 (7.0%) | 4 (1.4%) |
| 90 or more Minutes | 0 (0.0%) | 4 (1.4%) |
Time of Departure to Work by Sex in Clermont
The most frequent times of departure to work in Clermont are 7:00 AM to 7:29 AM (55, 18.3%) for males and 7:00 AM to 7:29 AM (96, 34.3%) for females.
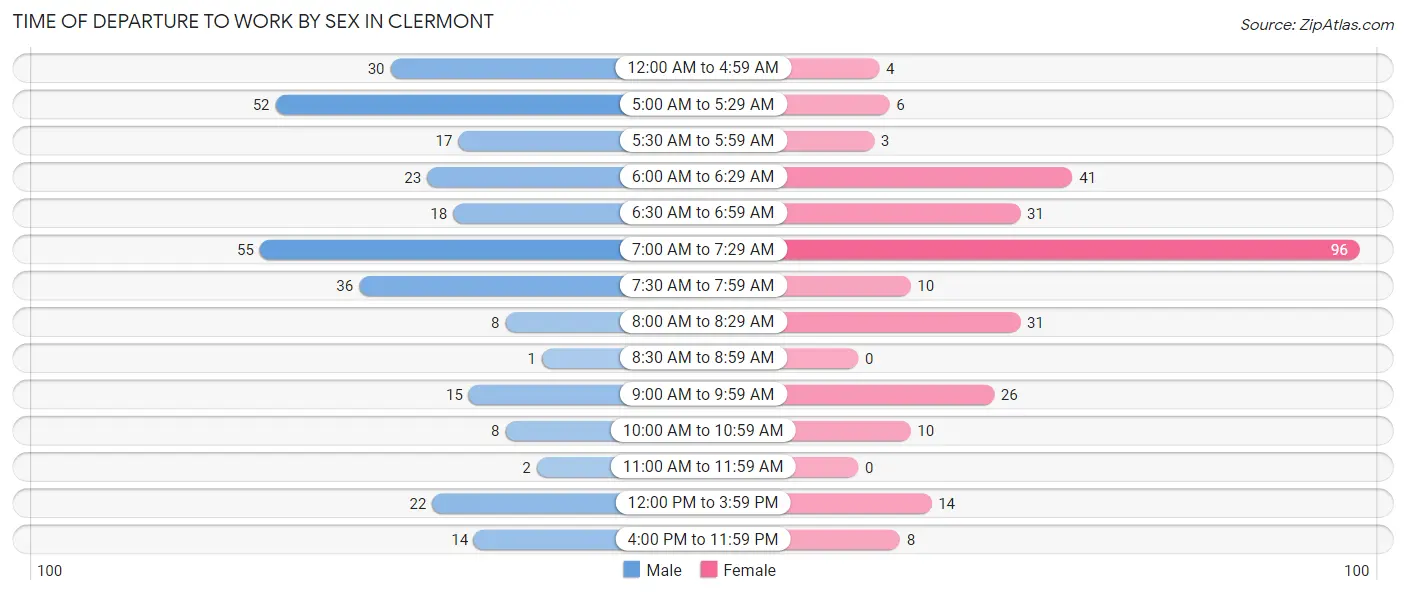
| Time of Departure | Male | Female |
| 12:00 AM to 4:59 AM | 30 (10.0%) | 4 (1.4%) |
| 5:00 AM to 5:29 AM | 52 (17.3%) | 6 (2.1%) |
| 5:30 AM to 5:59 AM | 17 (5.7%) | 3 (1.1%) |
| 6:00 AM to 6:29 AM | 23 (7.6%) | 41 (14.6%) |
| 6:30 AM to 6:59 AM | 18 (6.0%) | 31 (11.1%) |
| 7:00 AM to 7:29 AM | 55 (18.3%) | 96 (34.3%) |
| 7:30 AM to 7:59 AM | 36 (12.0%) | 10 (3.6%) |
| 8:00 AM to 8:29 AM | 8 (2.7%) | 31 (11.1%) |
| 8:30 AM to 8:59 AM | 1 (0.3%) | 0 (0.0%) |
| 9:00 AM to 9:59 AM | 15 (5.0%) | 26 (9.3%) |
| 10:00 AM to 10:59 AM | 8 (2.7%) | 10 (3.6%) |
| 11:00 AM to 11:59 AM | 2 (0.7%) | 0 (0.0%) |
| 12:00 PM to 3:59 PM | 22 (7.3%) | 14 (5.0%) |
| 4:00 PM to 11:59 PM | 14 (4.6%) | 8 (2.9%) |
| Total | 301 (100.0%) | 280 (100.0%) |
Housing Occupancy in Clermont
Occupancy by Ownership in Clermont
Of the total 398 dwellings in Clermont, owner-occupied units account for 346 (86.9%), while renter-occupied units make up 52 (13.1%).
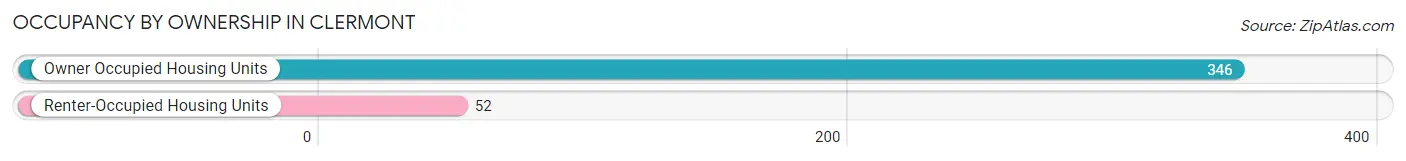
| Occupancy | # Housing Units | % Housing Units |
| Owner Occupied Housing Units | 346 | 86.9% |
| Renter-Occupied Housing Units | 52 | 13.1% |
| Total Occupied Housing Units | 398 | 100.0% |
Occupancy by Household Size in Clermont
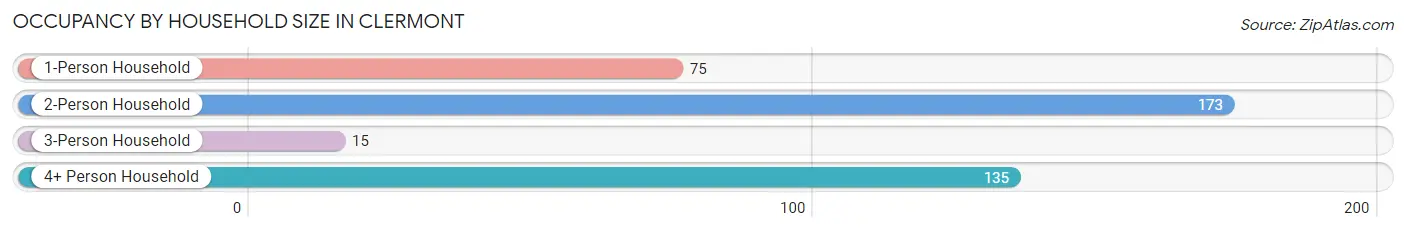
| Household Size | # Housing Units | % Housing Units |
| 1-Person Household | 75 | 18.8% |
| 2-Person Household | 173 | 43.5% |
| 3-Person Household | 15 | 3.8% |
| 4+ Person Household | 135 | 33.9% |
| Total Housing Units | 398 | 100.0% |
Occupancy by Ownership by Household Size in Clermont
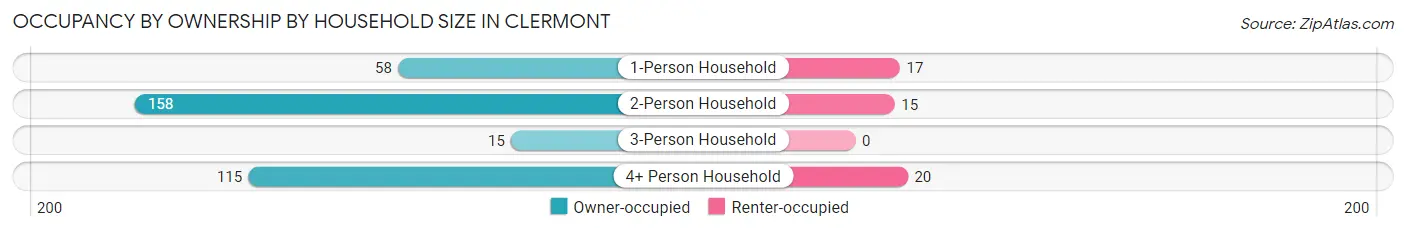
| Household Size | Owner-occupied | Renter-occupied |
| 1-Person Household | 58 (77.3%) | 17 (22.7%) |
| 2-Person Household | 158 (91.3%) | 15 (8.7%) |
| 3-Person Household | 15 (100.0%) | 0 (0.0%) |
| 4+ Person Household | 115 (85.2%) | 20 (14.8%) |
| Total Housing Units | 346 (86.9%) | 52 (13.1%) |
Occupancy by Educational Attainment in Clermont
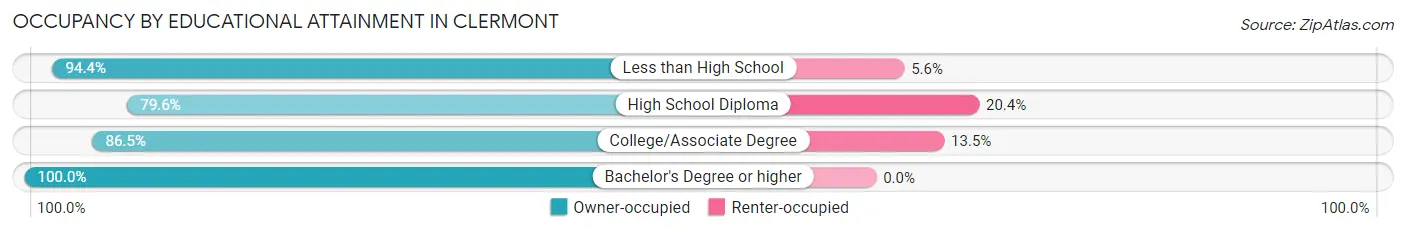
| Household Size | Owner-occupied | Renter-occupied |
| Less than High School | 34 (94.4%) | 2 (5.6%) |
| High School Diploma | 121 (79.6%) | 31 (20.4%) |
| College/Associate Degree | 122 (86.5%) | 19 (13.5%) |
| Bachelor's Degree or higher | 69 (100.0%) | 0 (0.0%) |
Occupancy by Age of Householder in Clermont
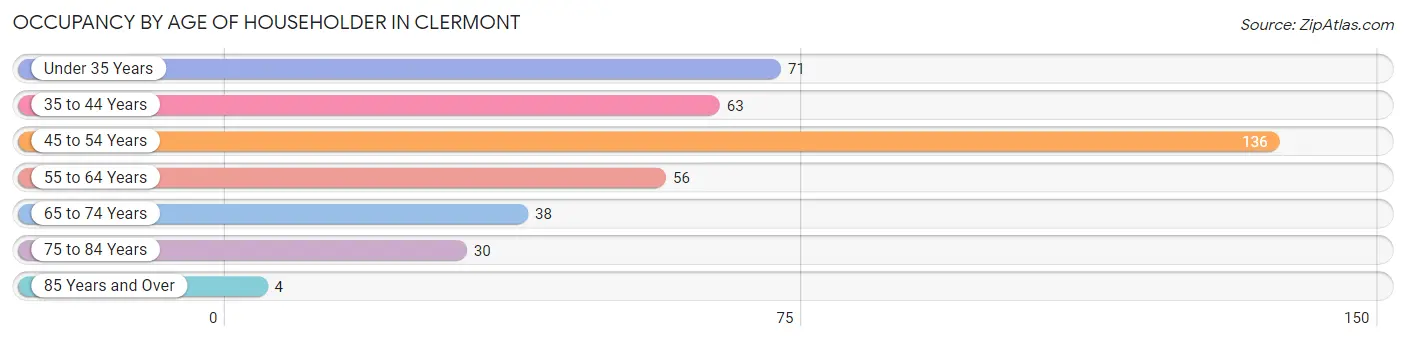
| Age Bracket | # Households | % Households |
| Under 35 Years | 71 | 17.8% |
| 35 to 44 Years | 63 | 15.8% |
| 45 to 54 Years | 136 | 34.2% |
| 55 to 64 Years | 56 | 14.1% |
| 65 to 74 Years | 38 | 9.6% |
| 75 to 84 Years | 30 | 7.5% |
| 85 Years and Over | 4 | 1.0% |
| Total | 398 | 100.0% |
Housing Finances in Clermont
Median Income by Occupancy in Clermont
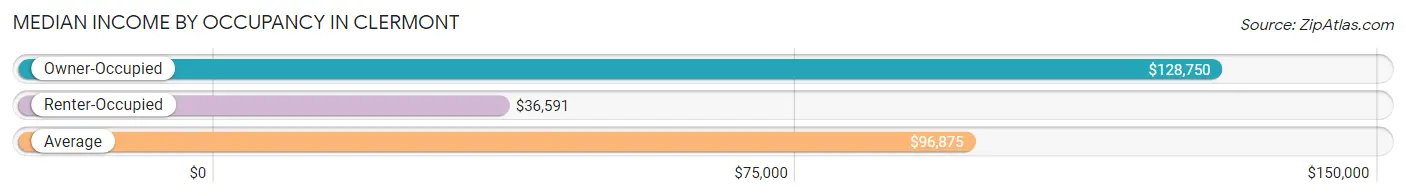
| Occupancy Type | # Households | Median Income |
| Owner-Occupied | 346 (86.9%) | $128,750 |
| Renter-Occupied | 52 (13.1%) | $36,591 |
| Average | 398 (100.0%) | $96,875 |
Occupancy by Householder Income Bracket in Clermont
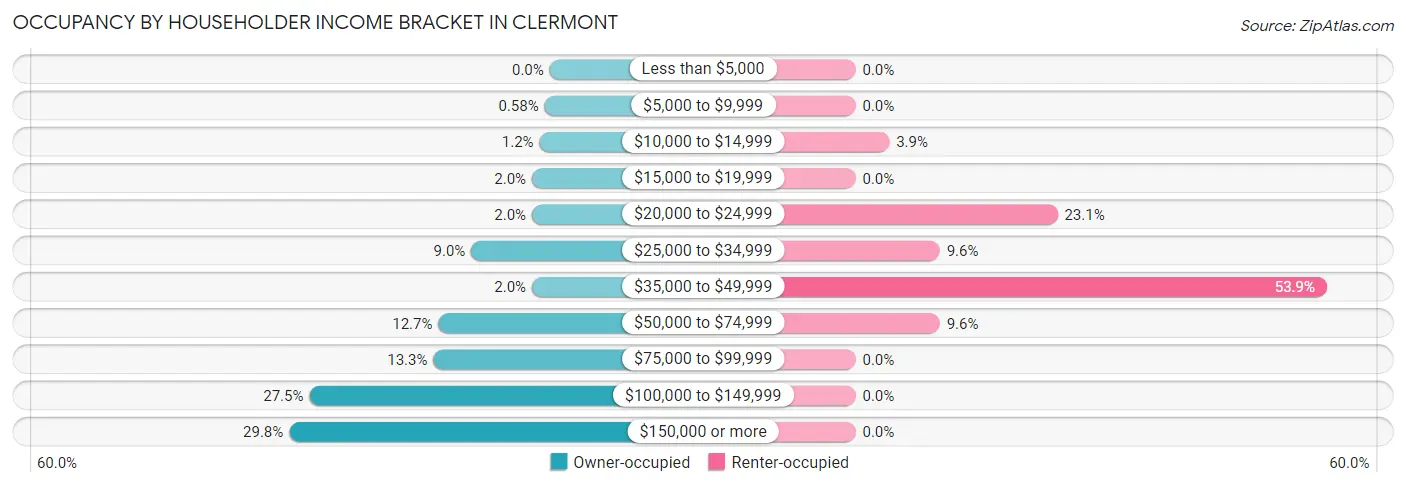
| Income Bracket | Owner-occupied | Renter-occupied |
| Less than $5,000 | 0 (0.0%) | 0 (0.0%) |
| $5,000 to $9,999 | 2 (0.6%) | 0 (0.0%) |
| $10,000 to $14,999 | 4 (1.2%) | 2 (3.8%) |
| $15,000 to $19,999 | 7 (2.0%) | 0 (0.0%) |
| $20,000 to $24,999 | 7 (2.0%) | 12 (23.1%) |
| $25,000 to $34,999 | 31 (9.0%) | 5 (9.6%) |
| $35,000 to $49,999 | 7 (2.0%) | 28 (53.8%) |
| $50,000 to $74,999 | 44 (12.7%) | 5 (9.6%) |
| $75,000 to $99,999 | 46 (13.3%) | 0 (0.0%) |
| $100,000 to $149,999 | 95 (27.5%) | 0 (0.0%) |
| $150,000 or more | 103 (29.8%) | 0 (0.0%) |
| Total | 346 (100.0%) | 52 (100.0%) |
Monthly Housing Cost Tiers in Clermont
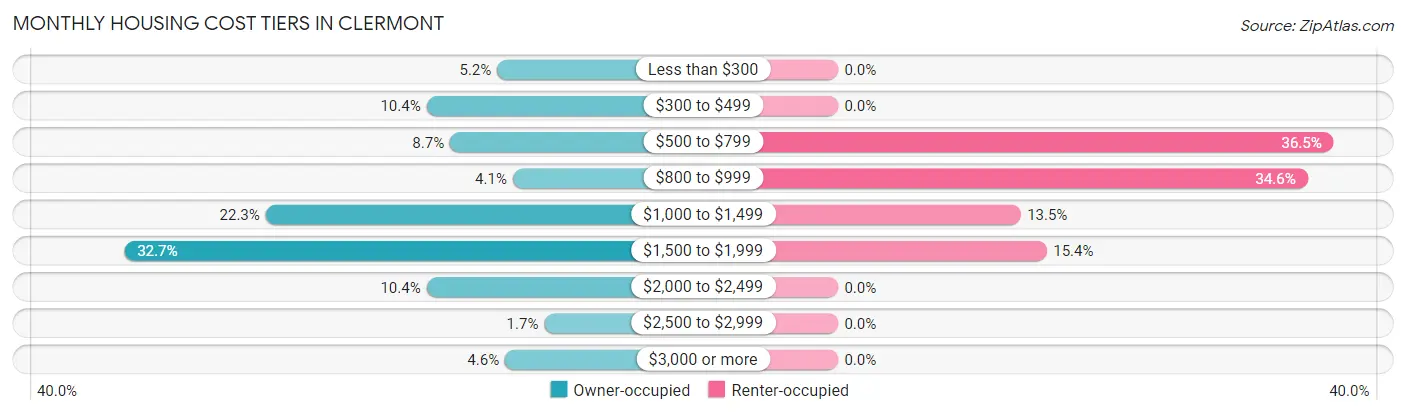
| Monthly Cost | Owner-occupied | Renter-occupied |
| Less than $300 | 18 (5.2%) | 0 (0.0%) |
| $300 to $499 | 36 (10.4%) | 0 (0.0%) |
| $500 to $799 | 30 (8.7%) | 19 (36.5%) |
| $800 to $999 | 14 (4.1%) | 18 (34.6%) |
| $1,000 to $1,499 | 77 (22.3%) | 7 (13.5%) |
| $1,500 to $1,999 | 113 (32.7%) | 8 (15.4%) |
| $2,000 to $2,499 | 36 (10.4%) | 0 (0.0%) |
| $2,500 to $2,999 | 6 (1.7%) | 0 (0.0%) |
| $3,000 or more | 16 (4.6%) | 0 (0.0%) |
| Total | 346 (100.0%) | 52 (100.0%) |
Physical Housing Characteristics in Clermont
Housing Structures in Clermont
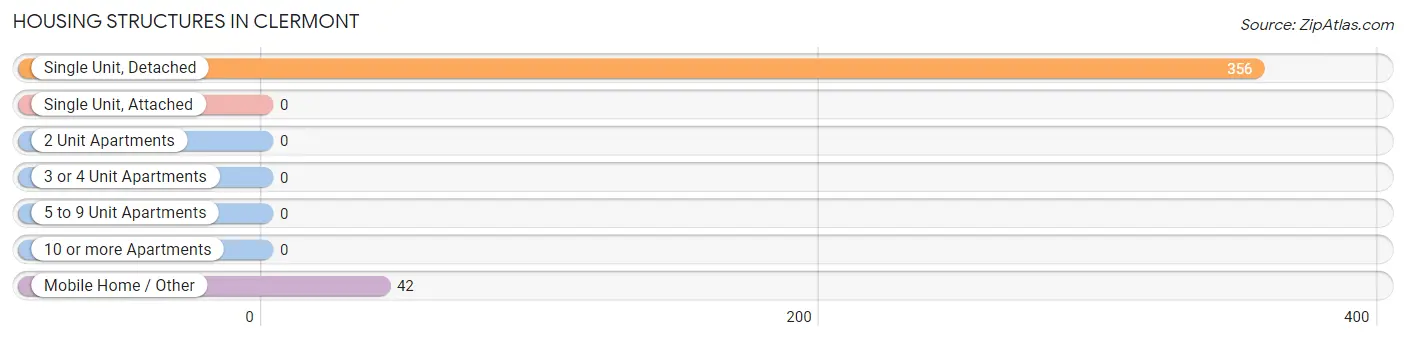
| Structure Type | # Housing Units | % Housing Units |
| Single Unit, Detached | 356 | 89.4% |
| Single Unit, Attached | 0 | 0.0% |
| 2 Unit Apartments | 0 | 0.0% |
| 3 or 4 Unit Apartments | 0 | 0.0% |
| 5 to 9 Unit Apartments | 0 | 0.0% |
| 10 or more Apartments | 0 | 0.0% |
| Mobile Home / Other | 42 | 10.5% |
| Total | 398 | 100.0% |
Housing Structures by Occupancy in Clermont
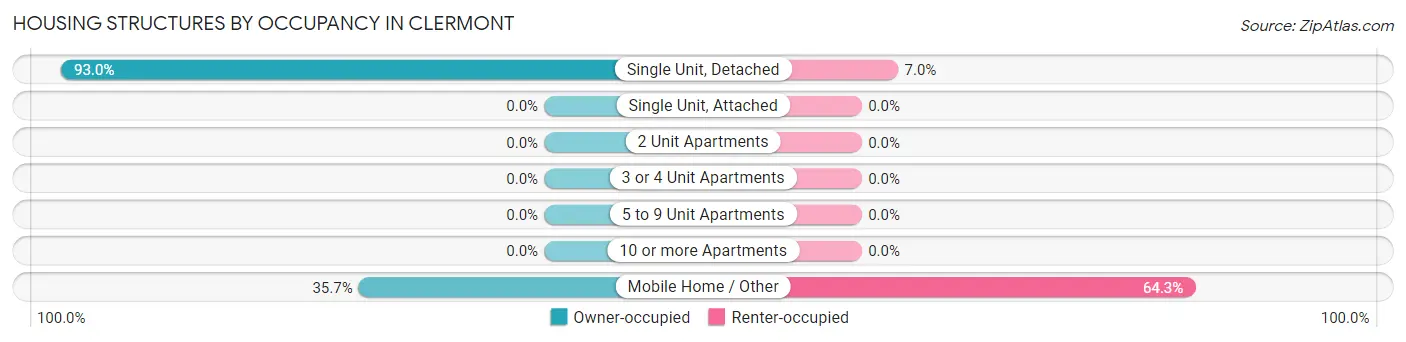
| Structure Type | Owner-occupied | Renter-occupied |
| Single Unit, Detached | 331 (93.0%) | 25 (7.0%) |
| Single Unit, Attached | 0 (0.0%) | 0 (0.0%) |
| 2 Unit Apartments | 0 (0.0%) | 0 (0.0%) |
| 3 or 4 Unit Apartments | 0 (0.0%) | 0 (0.0%) |
| 5 to 9 Unit Apartments | 0 (0.0%) | 0 (0.0%) |
| 10 or more Apartments | 0 (0.0%) | 0 (0.0%) |
| Mobile Home / Other | 15 (35.7%) | 27 (64.3%) |
| Total | 346 (86.9%) | 52 (13.1%) |
Housing Structures by Number of Rooms in Clermont
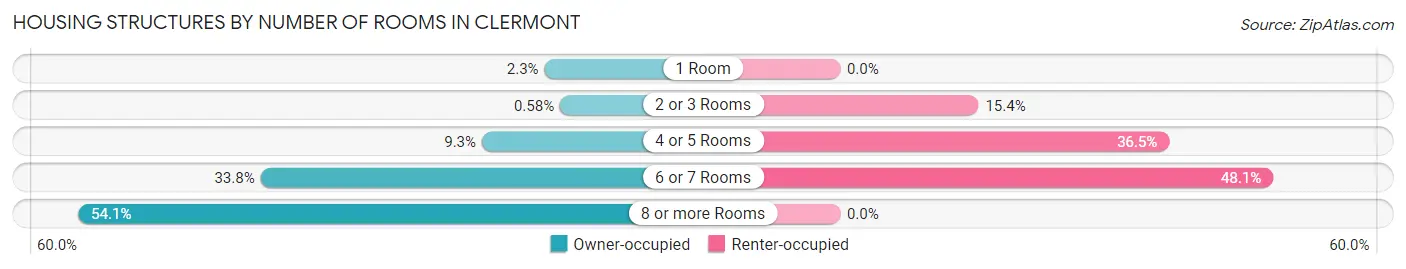
| Number of Rooms | Owner-occupied | Renter-occupied |
| 1 Room | 8 (2.3%) | 0 (0.0%) |
| 2 or 3 Rooms | 2 (0.6%) | 8 (15.4%) |
| 4 or 5 Rooms | 32 (9.2%) | 19 (36.5%) |
| 6 or 7 Rooms | 117 (33.8%) | 25 (48.1%) |
| 8 or more Rooms | 187 (54.0%) | 0 (0.0%) |
| Total | 346 (100.0%) | 52 (100.0%) |
Housing Structure by Heating Type in Clermont
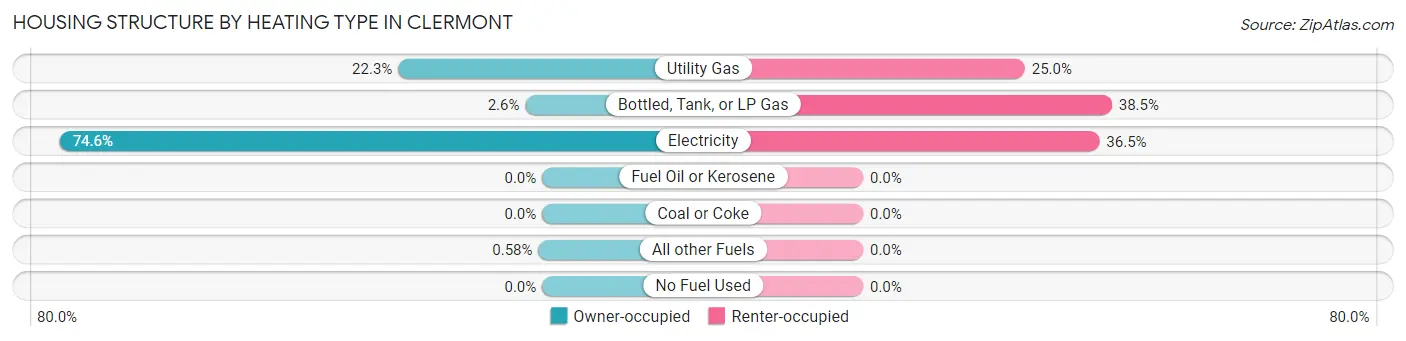
| Heating Type | Owner-occupied | Renter-occupied |
| Utility Gas | 77 (22.3%) | 13 (25.0%) |
| Bottled, Tank, or LP Gas | 9 (2.6%) | 20 (38.5%) |
| Electricity | 258 (74.6%) | 19 (36.5%) |
| Fuel Oil or Kerosene | 0 (0.0%) | 0 (0.0%) |
| Coal or Coke | 0 (0.0%) | 0 (0.0%) |
| All other Fuels | 2 (0.6%) | 0 (0.0%) |
| No Fuel Used | 0 (0.0%) | 0 (0.0%) |
| Total | 346 (100.0%) | 52 (100.0%) |
Household Vehicle Usage in Clermont
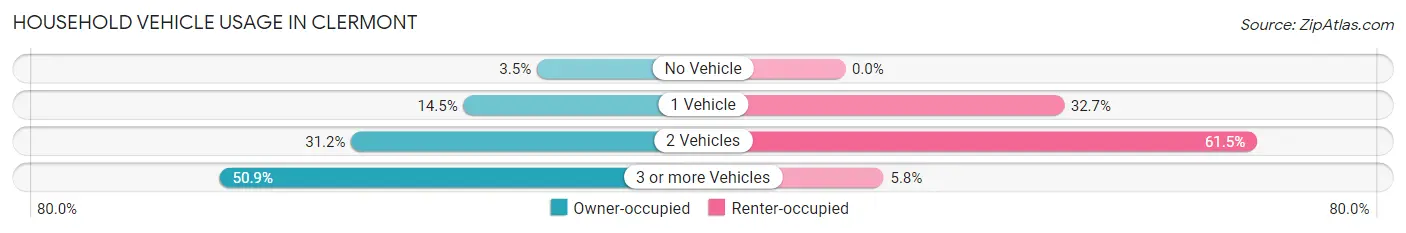
| Vehicles per Household | Owner-occupied | Renter-occupied |
| No Vehicle | 12 (3.5%) | 0 (0.0%) |
| 1 Vehicle | 50 (14.4%) | 17 (32.7%) |
| 2 Vehicles | 108 (31.2%) | 32 (61.5%) |
| 3 or more Vehicles | 176 (50.9%) | 3 (5.8%) |
| Total | 346 (100.0%) | 52 (100.0%) |
Real Estate & Mortgages in Clermont
Real Estate and Mortgage Overview in Clermont
| Characteristic | Without Mortgage | With Mortgage |
| Housing Units | 85 | 261 |
| Median Property Value | $255,000 | $277,100 |
| Median Household Income | $69,583 | $88 |
| Monthly Housing Costs | $459 | $15 |
| Real Estate Taxes | $1,284 | $0 |
Property Value by Mortgage Status in Clermont
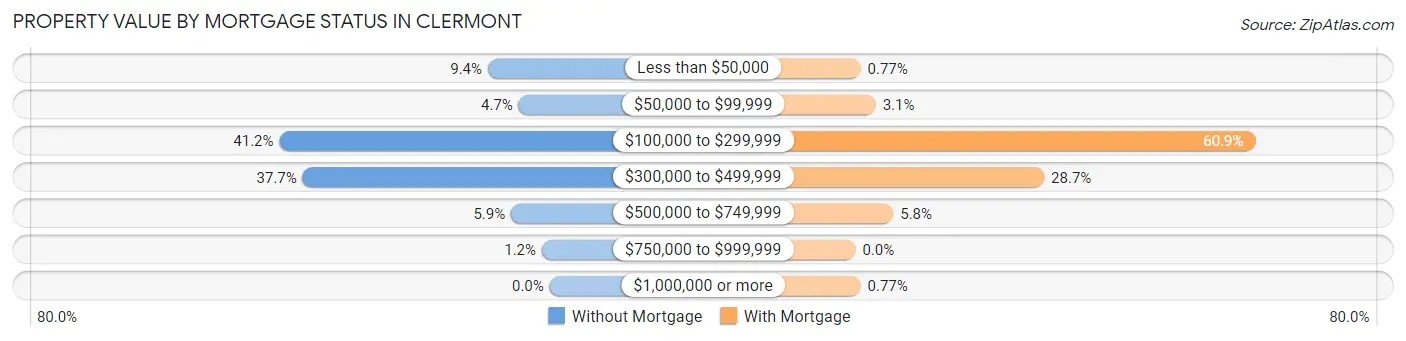
| Property Value | Without Mortgage | With Mortgage |
| Less than $50,000 | 8 (9.4%) | 2 (0.8%) |
| $50,000 to $99,999 | 4 (4.7%) | 8 (3.1%) |
| $100,000 to $299,999 | 35 (41.2%) | 159 (60.9%) |
| $300,000 to $499,999 | 32 (37.7%) | 75 (28.7%) |
| $500,000 to $749,999 | 5 (5.9%) | 15 (5.8%) |
| $750,000 to $999,999 | 1 (1.2%) | 0 (0.0%) |
| $1,000,000 or more | 0 (0.0%) | 2 (0.8%) |
| Total | 85 (100.0%) | 261 (100.0%) |
Household Income by Mortgage Status in Clermont
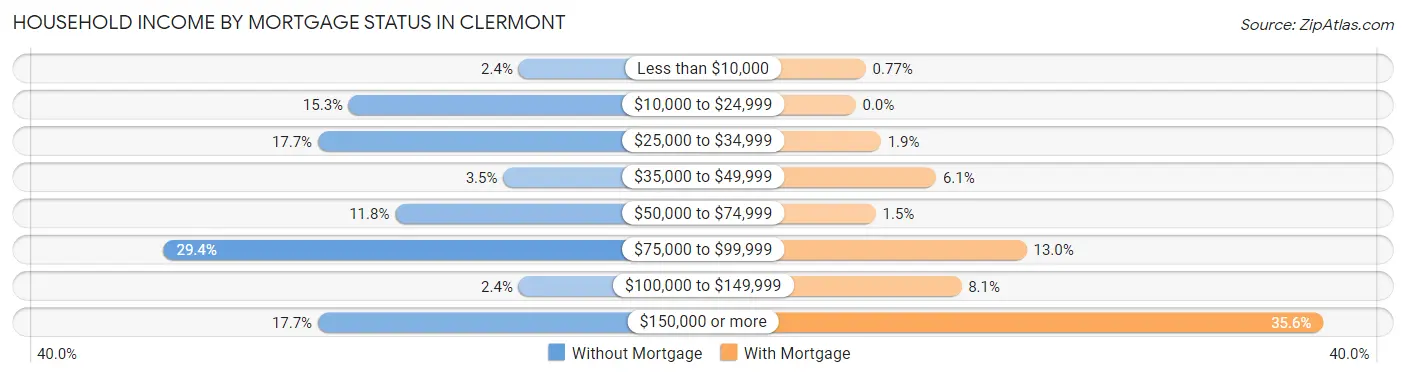
| Household Income | Without Mortgage | With Mortgage |
| Less than $10,000 | 2 (2.4%) | 2 (0.8%) |
| $10,000 to $24,999 | 13 (15.3%) | 0 (0.0%) |
| $25,000 to $34,999 | 15 (17.6%) | 5 (1.9%) |
| $35,000 to $49,999 | 3 (3.5%) | 16 (6.1%) |
| $50,000 to $74,999 | 10 (11.8%) | 4 (1.5%) |
| $75,000 to $99,999 | 25 (29.4%) | 34 (13.0%) |
| $100,000 to $149,999 | 2 (2.4%) | 21 (8.1%) |
| $150,000 or more | 15 (17.6%) | 93 (35.6%) |
| Total | 85 (100.0%) | 261 (100.0%) |
Property Value to Household Income Ratio in Clermont
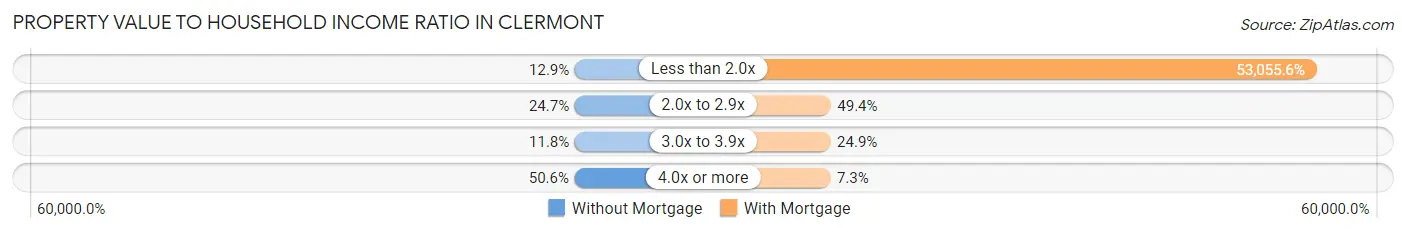
| Value-to-Income Ratio | Without Mortgage | With Mortgage |
| Less than 2.0x | 11 (12.9%) | 138,475 (53,055.6%) |
| 2.0x to 2.9x | 21 (24.7%) | 129 (49.4%) |
| 3.0x to 3.9x | 10 (11.8%) | 65 (24.9%) |
| 4.0x or more | 43 (50.6%) | 19 (7.3%) |
| Total | 85 (100.0%) | 261 (100.0%) |
Real Estate Taxes by Mortgage Status in Clermont
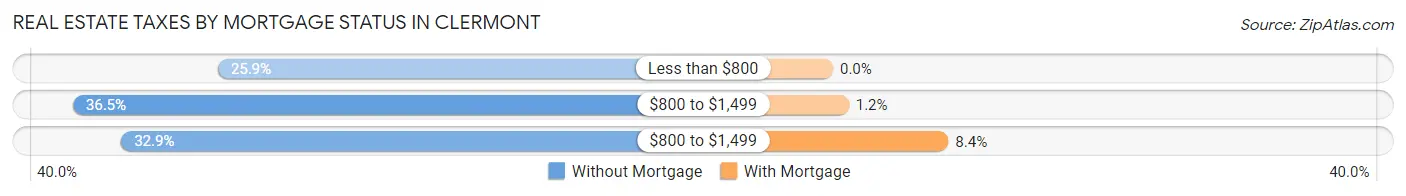
| Property Taxes | Without Mortgage | With Mortgage |
| Less than $800 | 22 (25.9%) | 0 (0.0%) |
| $800 to $1,499 | 31 (36.5%) | 3 (1.1%) |
| $800 to $1,499 | 28 (32.9%) | 22 (8.4%) |
| Total | 85 (100.0%) | 261 (100.0%) |
Health & Disability in Clermont
Health Insurance Coverage by Age in Clermont
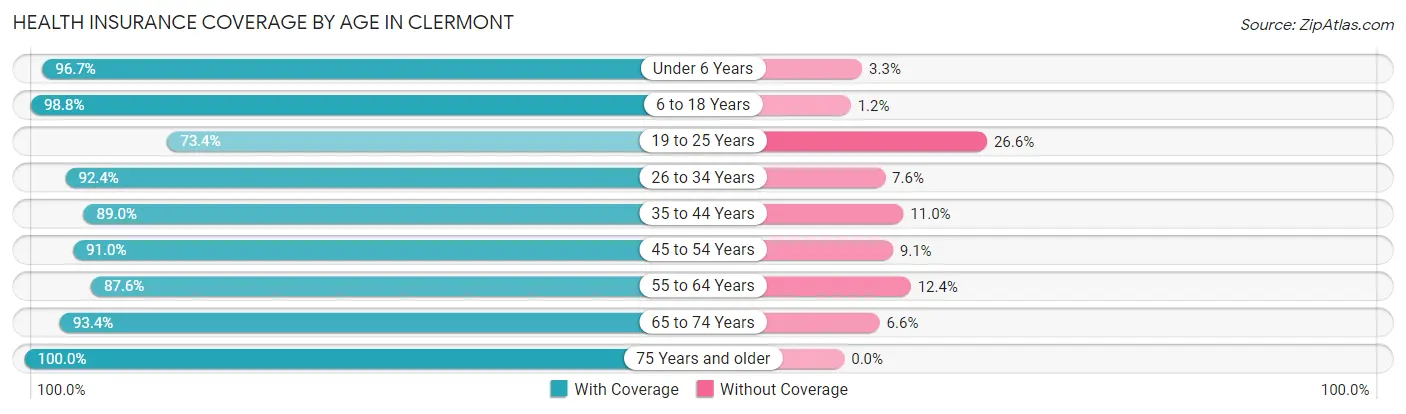
| Age Bracket | With Coverage | Without Coverage |
| Under 6 Years | 87 (96.7%) | 3 (3.3%) |
| 6 to 18 Years | 165 (98.8%) | 2 (1.2%) |
| 19 to 25 Years | 91 (73.4%) | 33 (26.6%) |
| 26 to 34 Years | 97 (92.4%) | 8 (7.6%) |
| 35 to 44 Years | 113 (89.0%) | 14 (11.0%) |
| 45 to 54 Years | 211 (90.9%) | 21 (9.0%) |
| 55 to 64 Years | 92 (87.6%) | 13 (12.4%) |
| 65 to 74 Years | 85 (93.4%) | 6 (6.6%) |
| 75 Years and older | 51 (100.0%) | 0 (0.0%) |
| Total | 992 (90.8%) | 100 (9.2%) |
Health Insurance Coverage by Citizenship Status in Clermont
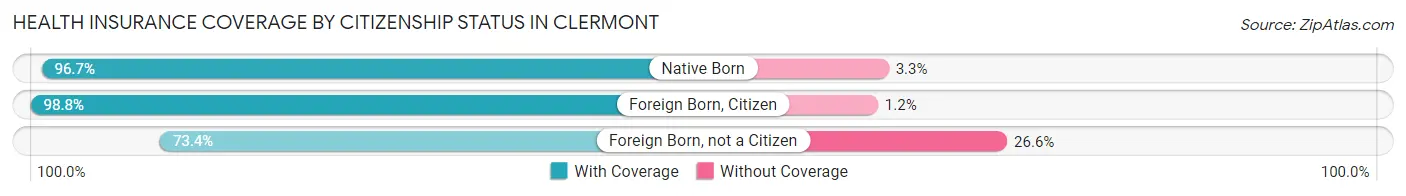
| Citizenship Status | With Coverage | Without Coverage |
| Native Born | 87 (96.7%) | 3 (3.3%) |
| Foreign Born, Citizen | 165 (98.8%) | 2 (1.2%) |
| Foreign Born, not a Citizen | 91 (73.4%) | 33 (26.6%) |
Health Insurance Coverage by Household Income in Clermont
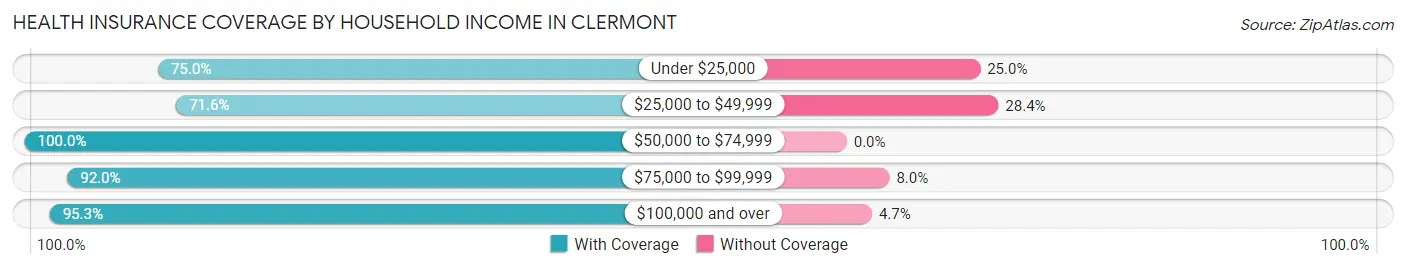
| Household Income | With Coverage | Without Coverage |
| Under $25,000 | 36 (75.0%) | 12 (25.0%) |
| $25,000 to $49,999 | 126 (71.6%) | 50 (28.4%) |
| $50,000 to $74,999 | 132 (100.0%) | 0 (0.0%) |
| $75,000 to $99,999 | 92 (92.0%) | 8 (8.0%) |
| $100,000 and over | 606 (95.3%) | 30 (4.7%) |
Public vs Private Health Insurance Coverage by Age in Clermont
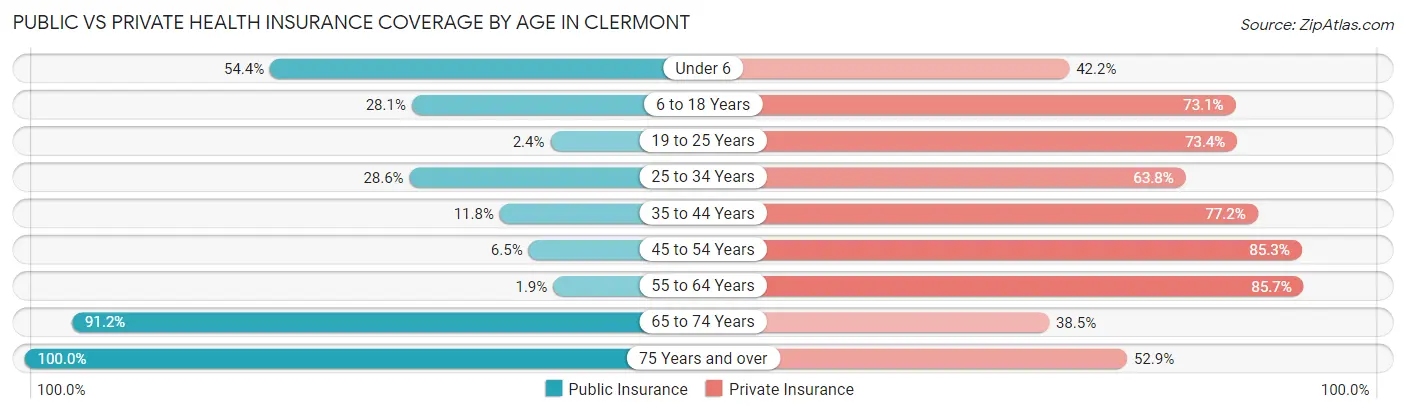
| Age Bracket | Public Insurance | Private Insurance |
| Under 6 | 49 (54.4%) | 38 (42.2%) |
| 6 to 18 Years | 47 (28.1%) | 122 (73.1%) |
| 19 to 25 Years | 3 (2.4%) | 91 (73.4%) |
| 25 to 34 Years | 30 (28.6%) | 67 (63.8%) |
| 35 to 44 Years | 15 (11.8%) | 98 (77.2%) |
| 45 to 54 Years | 15 (6.5%) | 198 (85.3%) |
| 55 to 64 Years | 2 (1.9%) | 90 (85.7%) |
| 65 to 74 Years | 83 (91.2%) | 35 (38.5%) |
| 75 Years and over | 51 (100.0%) | 27 (52.9%) |
| Total | 295 (27.0%) | 766 (70.2%) |
Disability Status by Sex by Age in Clermont
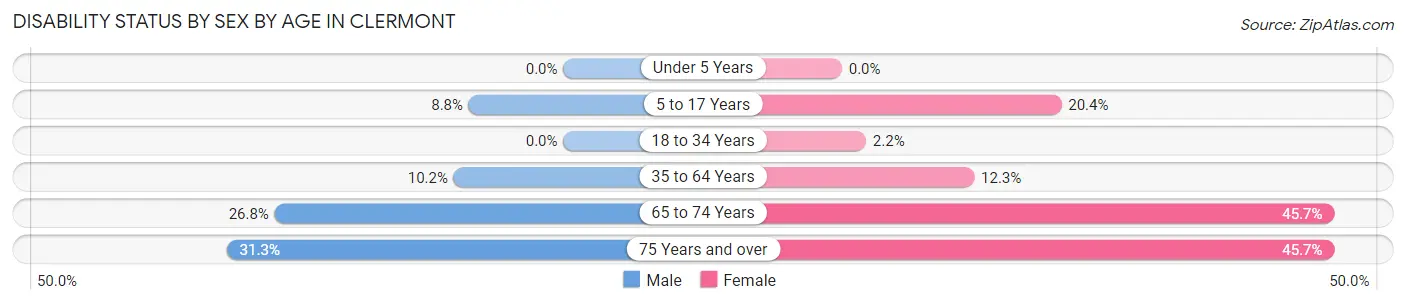
| Age Bracket | Male | Female |
| Under 5 Years | 0 (0.0%) | 0 (0.0%) |
| 5 to 17 Years | 10 (8.8%) | 11 (20.4%) |
| 18 to 34 Years | 0 (0.0%) | 3 (2.2%) |
| 35 to 64 Years | 24 (10.2%) | 28 (12.3%) |
| 65 to 74 Years | 15 (26.8%) | 16 (45.7%) |
| 75 Years and over | 5 (31.2%) | 16 (45.7%) |
Disability Class by Sex by Age in Clermont
Disability Class: Hearing Difficulty
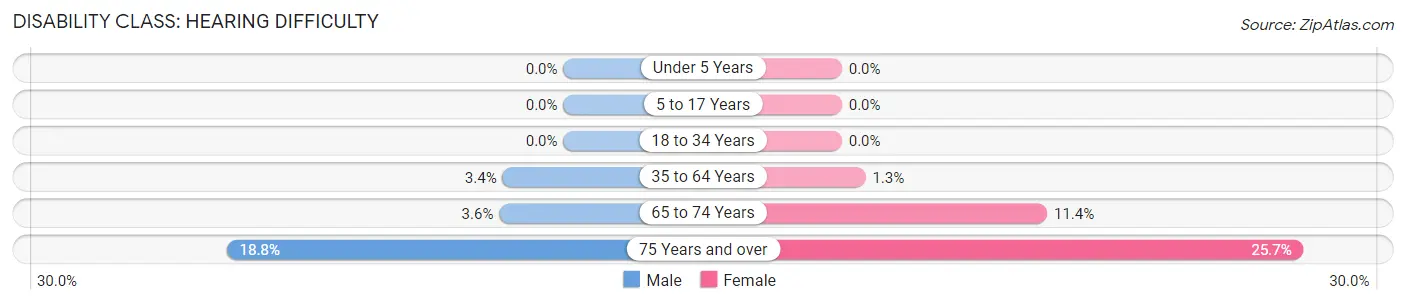
| Age Bracket | Male | Female |
| Under 5 Years | 0 (0.0%) | 0 (0.0%) |
| 5 to 17 Years | 0 (0.0%) | 0 (0.0%) |
| 18 to 34 Years | 0 (0.0%) | 0 (0.0%) |
| 35 to 64 Years | 8 (3.4%) | 3 (1.3%) |
| 65 to 74 Years | 2 (3.6%) | 4 (11.4%) |
| 75 Years and over | 3 (18.8%) | 9 (25.7%) |
Disability Class: Vision Difficulty
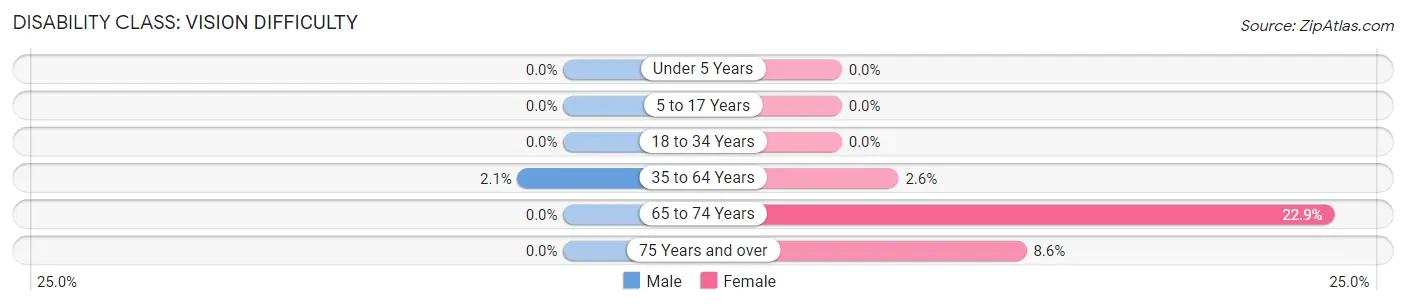
| Age Bracket | Male | Female |
| Under 5 Years | 0 (0.0%) | 0 (0.0%) |
| 5 to 17 Years | 0 (0.0%) | 0 (0.0%) |
| 18 to 34 Years | 0 (0.0%) | 0 (0.0%) |
| 35 to 64 Years | 5 (2.1%) | 6 (2.6%) |
| 65 to 74 Years | 0 (0.0%) | 8 (22.9%) |
| 75 Years and over | 0 (0.0%) | 3 (8.6%) |
Disability Class: Cognitive Difficulty
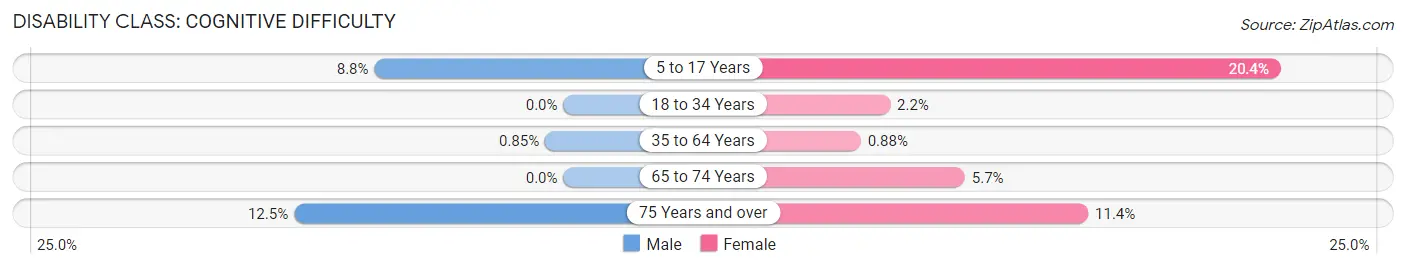
| Age Bracket | Male | Female |
| 5 to 17 Years | 10 (8.8%) | 11 (20.4%) |
| 18 to 34 Years | 0 (0.0%) | 3 (2.2%) |
| 35 to 64 Years | 2 (0.9%) | 2 (0.9%) |
| 65 to 74 Years | 0 (0.0%) | 2 (5.7%) |
| 75 Years and over | 2 (12.5%) | 4 (11.4%) |
Disability Class: Ambulatory Difficulty
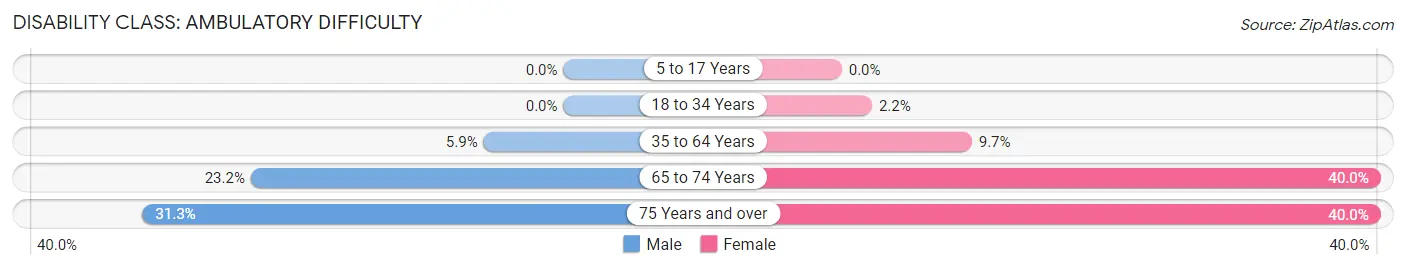
| Age Bracket | Male | Female |
| 5 to 17 Years | 0 (0.0%) | 0 (0.0%) |
| 18 to 34 Years | 0 (0.0%) | 3 (2.2%) |
| 35 to 64 Years | 14 (5.9%) | 22 (9.7%) |
| 65 to 74 Years | 13 (23.2%) | 14 (40.0%) |
| 75 Years and over | 5 (31.2%) | 14 (40.0%) |
Disability Class: Self-Care Difficulty
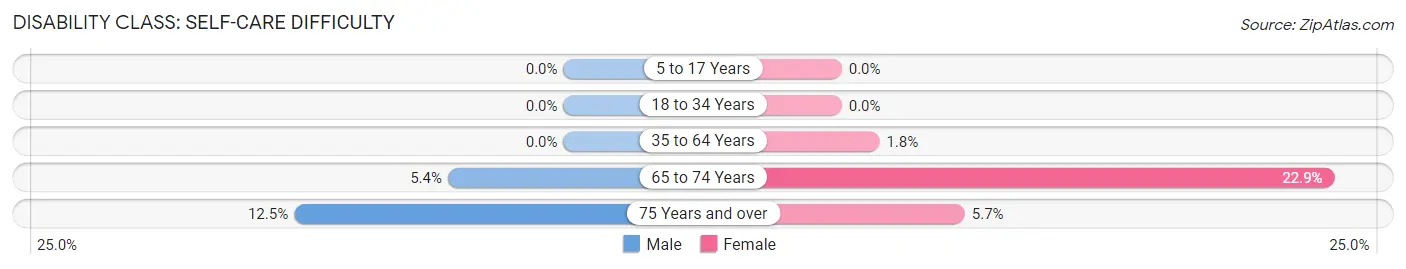
| Age Bracket | Male | Female |
| 5 to 17 Years | 0 (0.0%) | 0 (0.0%) |
| 18 to 34 Years | 0 (0.0%) | 0 (0.0%) |
| 35 to 64 Years | 0 (0.0%) | 4 (1.8%) |
| 65 to 74 Years | 3 (5.4%) | 8 (22.9%) |
| 75 Years and over | 2 (12.5%) | 2 (5.7%) |
Technology Access in Clermont
Computing Device Access in Clermont
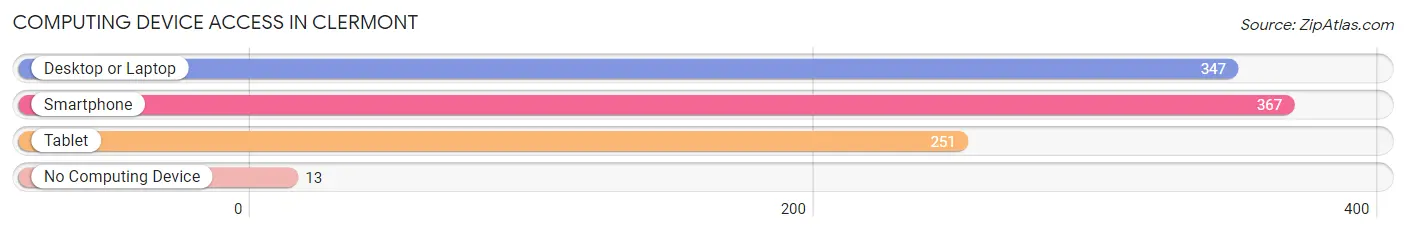
| Device Type | # Households | % Households |
| Desktop or Laptop | 347 | 87.2% |
| Smartphone | 367 | 92.2% |
| Tablet | 251 | 63.1% |
| No Computing Device | 13 | 3.3% |
| Total | 398 | 100.0% |
Internet Access in Clermont
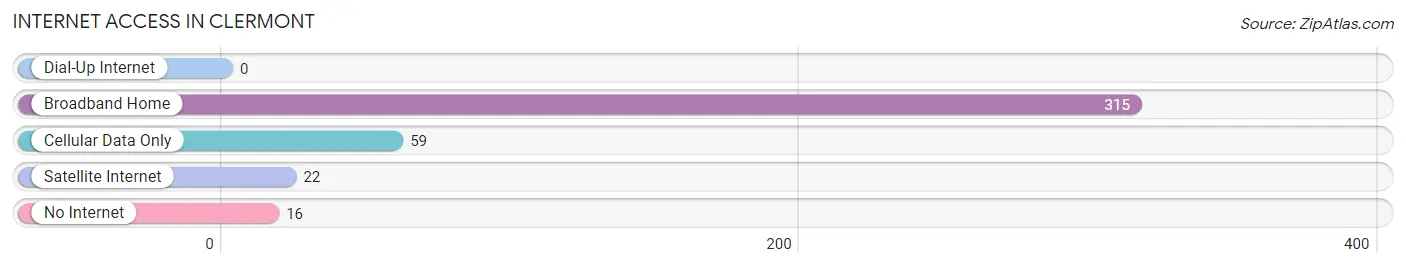
| Internet Type | # Households | % Households |
| Dial-Up Internet | 0 | 0.0% |
| Broadband Home | 315 | 79.1% |
| Cellular Data Only | 59 | 14.8% |
| Satellite Internet | 22 | 5.5% |
| No Internet | 16 | 4.0% |
| Total | 398 | 100.0% |
Clermont Summary
Clermont is a small city located in Hall County, Georgia, United States. It is situated in the foothills of the Blue Ridge Mountains, approximately 50 miles northeast of Atlanta. The city has a population of approximately 1,500 people and covers an area of 1.2 square miles.
History
Clermont was founded in 1838 by a group of settlers from North Carolina. The city was named after Clermont, New York, the hometown of one of the settlers. The city was incorporated in 1887 and was the first city in Hall County to be incorporated.
In the late 19th century, Clermont was a thriving agricultural community. The city was known for its production of cotton, corn, and tobacco. The city also had a thriving lumber industry, with several sawmills located in the area.
In the early 20th century, Clermont experienced a period of growth and development. The city was home to several businesses, including a cotton mill, a furniture factory, and a brickyard. The city also had a thriving tourism industry, with several hotels and resorts located in the area.
Geography
Clermont is located in the foothills of the Blue Ridge Mountains in northern Georgia. The city is situated at an elevation of 1,000 feet above sea level. The city is located approximately 50 miles northeast of Atlanta and is bordered by the cities of Gainesville and Flowery Branch.
The city is located in a humid subtropical climate zone and experiences hot, humid summers and mild winters. The average annual temperature is around 70 degrees Fahrenheit. The average annual precipitation is around 50 inches.
Economy
Clermont’s economy is largely based on agriculture and tourism. The city is home to several farms, which produce a variety of crops, including cotton, corn, and tobacco. The city also has a thriving tourism industry, with several hotels and resorts located in the area.
The city is also home to several manufacturing companies, including a furniture factory and a brickyard. The city is also home to several retail stores, restaurants, and other businesses.
Demographics
As of the 2010 census, Clermont had a population of 1,500 people. The racial makeup of the city was 87.3% White, 8.7% African American, 0.7% Native American, 0.3% Asian, and 2.7% from other races. The median household income was $37,500 and the median family income was $45,000.
Conclusion
Clermont is a small city located in Hall County, Georgia, United States. It is situated in the foothills of the Blue Ridge Mountains, approximately 50 miles northeast of Atlanta. The city has a population of approximately 1,500 people and covers an area of 1.2 square miles. The city’s economy is largely based on agriculture and tourism. The city is home to several farms, which produce a variety of crops, including cotton, corn, and tobacco. The city also has a thriving tourism industry, with several hotels and resorts located in the area. As of the 2010 census, Clermont had a population of 1,500 people. The racial makeup of the city was 87.3% White, 8.7% African American, 0.7% Native American, 0.3% Asian, and 2.7% from other races. The median household income was $37,500 and the median family income was $45,000.
Common Questions
What is Per Capita Income in Clermont?
Per Capita income in Clermont is $44,240.
What is the Median Family Income in Clermont?
Median Family Income in Clermont is $137,500.
What is the Median Household income in Clermont?
Median Household Income in Clermont is $96,875.
What is Income or Wage Gap in Clermont?
Income or Wage Gap in Clermont is 31.7%.
Women in Clermont earn 68.3 cents for every dollar earned by a man.
What is Inequality or Gini Index in Clermont?
Inequality or Gini Index in Clermont is 0.39.
What is the Total Population of Clermont?
Total Population of Clermont is 1,092.
What is the Total Male Population of Clermont?
Total Male Population of Clermont is 551.
What is the Total Female Population of Clermont?
Total Female Population of Clermont is 541.
What is the Ratio of Males per 100 Females in Clermont?
There are 101.85 Males per 100 Females in Clermont.
What is the Ratio of Females per 100 Males in Clermont?
There are 98.19 Females per 100 Males in Clermont.
What is the Median Population Age in Clermont?
Median Population Age in Clermont is 41.2 Years.
What is the Average Family Size in Clermont
Average Family Size in Clermont is 3.1 People.
What is the Average Household Size in Clermont
Average Household Size in Clermont is 2.7 People.
How Large is the Labor Force in Clermont?
There are 639 People in the Labor Forcein in Clermont.
What is the Percentage of People in the Labor Force in Clermont?
72.4% of People are in the Labor Force in Clermont.
What is the Unemployment Rate in Clermont?
Unemployment Rate in Clermont is 1.9%.