Clayton, GA Map & Demographics
Clayton Map
Clayton Overview
$32,003
PER CAPITA INCOME
$63,452
AVG FAMILY INCOME
$56,369
AVG HOUSEHOLD INCOME
32.6%
WAGE / INCOME GAP [ % ]
67.4¢/ $1
WAGE / INCOME GAP [ $ ]
0.48
INEQUALITY / GINI INDEX
2,277
TOTAL POPULATION
1,150
MALE POPULATION
1,127
FEMALE POPULATION
102.04
MALES / 100 FEMALES
98.00
FEMALES / 100 MALES
39.6
MEDIAN AGE
3.2
AVG FAMILY SIZE
2.8
AVG HOUSEHOLD SIZE
1,072
LABOR FORCE [ PEOPLE ]
54.6%
PERCENT IN LABOR FORCE
5.7%
UNEMPLOYMENT RATE
Clayton Zip Codes
Clayton Area Codes
Income in Clayton
Income Overview in Clayton
Per Capita Income in Clayton is $32,003, while median incomes of families and households are $63,452 and $56,369 respectively.
| Characteristic | Number | Measure |
| Per Capita Income | 2,277 | $32,003 |
| Median Family Income | 492 | $63,452 |
| Mean Family Income | 492 | $86,616 |
| Median Household Income | 779 | $56,369 |
| Mean Household Income | 779 | $83,802 |
| Income Deficit | 492 | $0 |
| Wage / Income Gap (%) | 2,277 | 32.63% |
| Wage / Income Gap ($) | 2,277 | 67.37¢ per $1 |
| Gini / Inequality Index | 2,277 | 0.48 |
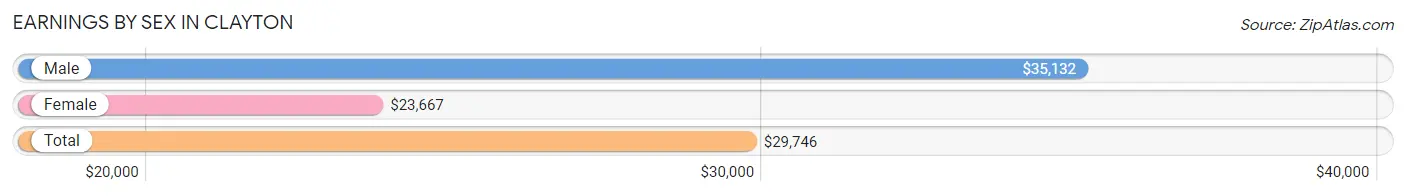
Earnings by Sex in Clayton
Average Earnings in Clayton are $29,746, $35,132 for men and $23,667 for women, a difference of 32.6%.
| Sex | Number | Average Earnings |
| Male | 572 (52.4%) | $35,132 |
| Female | 520 (47.6%) | $23,667 |
| Total | 1,092 (100.0%) | $29,746 |
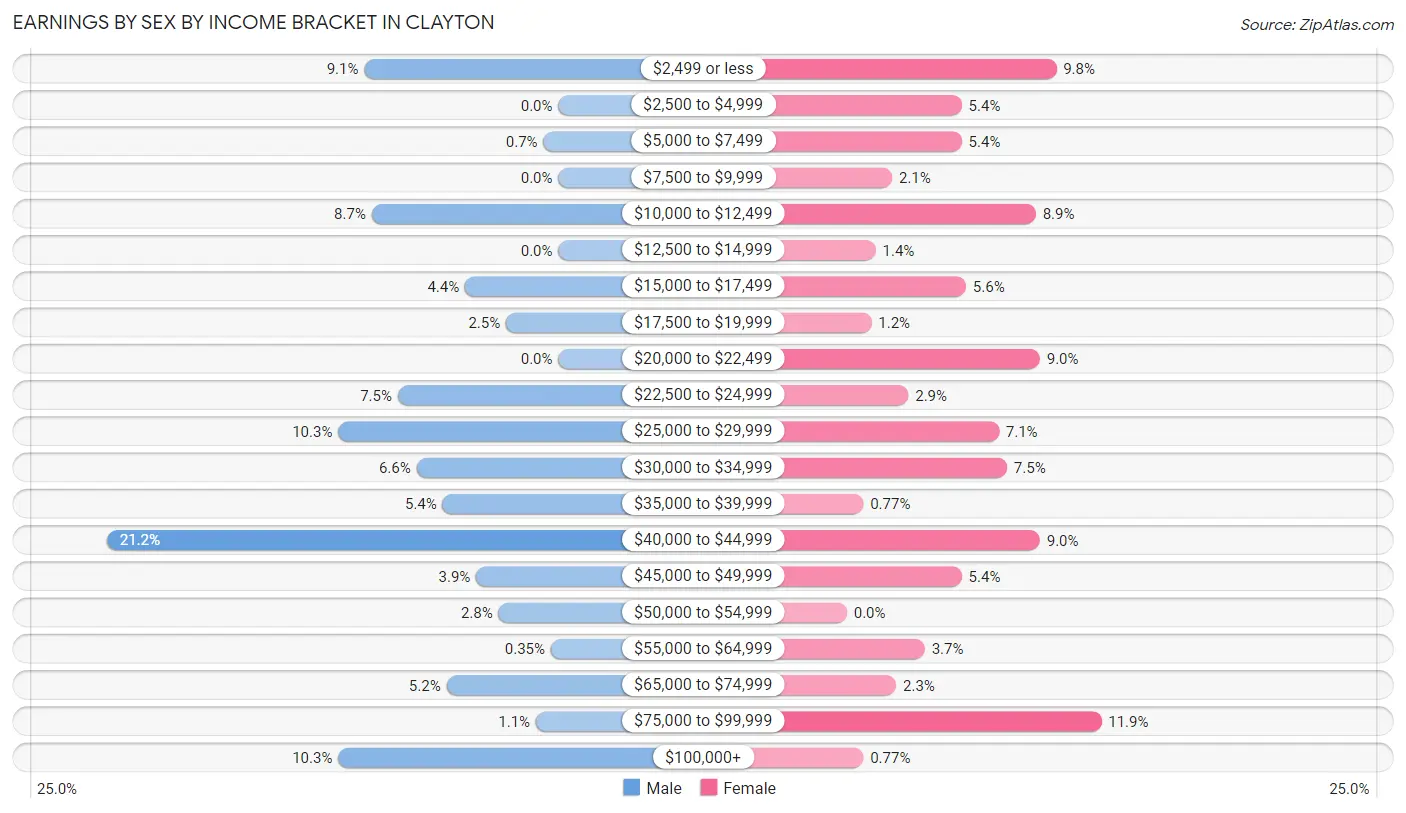
Earnings by Sex by Income Bracket in Clayton
The most common earnings brackets in Clayton are $40,000 to $44,999 for men (121 | 21.1%) and $75,000 to $99,999 for women (62 | 11.9%).
| Income | Male | Female |
| $2,499 or less | 52 (9.1%) | 51 (9.8%) |
| $2,500 to $4,999 | 0 (0.0%) | 28 (5.4%) |
| $5,000 to $7,499 | 4 (0.7%) | 28 (5.4%) |
| $7,500 to $9,999 | 0 (0.0%) | 11 (2.1%) |
| $10,000 to $12,499 | 50 (8.7%) | 46 (8.8%) |
| $12,500 to $14,999 | 0 (0.0%) | 7 (1.3%) |
| $15,000 to $17,499 | 25 (4.4%) | 29 (5.6%) |
| $17,500 to $19,999 | 14 (2.5%) | 6 (1.1%) |
| $20,000 to $22,499 | 0 (0.0%) | 47 (9.0%) |
| $22,500 to $24,999 | 43 (7.5%) | 15 (2.9%) |
| $25,000 to $29,999 | 59 (10.3%) | 37 (7.1%) |
| $30,000 to $34,999 | 38 (6.6%) | 39 (7.5%) |
| $35,000 to $39,999 | 31 (5.4%) | 4 (0.8%) |
| $40,000 to $44,999 | 121 (21.1%) | 47 (9.0%) |
| $45,000 to $49,999 | 22 (3.8%) | 28 (5.4%) |
| $50,000 to $54,999 | 16 (2.8%) | 0 (0.0%) |
| $55,000 to $64,999 | 2 (0.4%) | 19 (3.6%) |
| $65,000 to $74,999 | 30 (5.2%) | 12 (2.3%) |
| $75,000 to $99,999 | 6 (1.1%) | 62 (11.9%) |
| $100,000+ | 59 (10.3%) | 4 (0.8%) |
| Total | 572 (100.0%) | 520 (100.0%) |
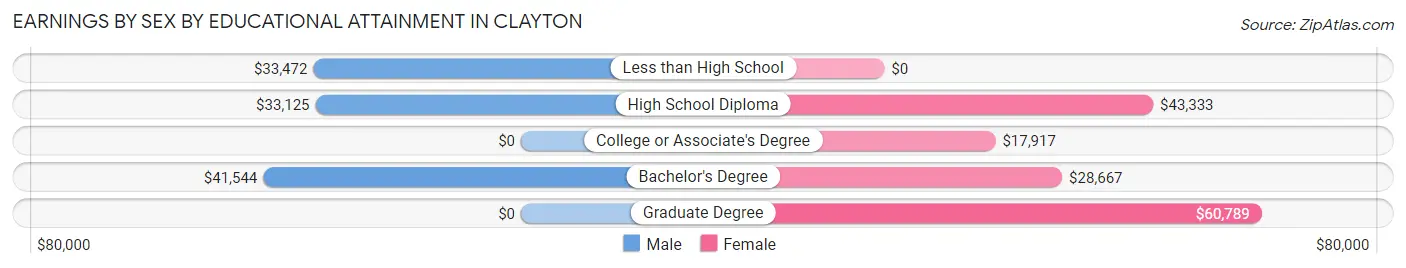
Earnings by Sex by Educational Attainment in Clayton
Average earnings in Clayton are $37,604 for men and $28,750 for women, a difference of 23.5%. Men with an educational attainment of bachelor's degree enjoy the highest average annual earnings of $41,544, while those with high school diploma education earn the least with $33,125. Women with an educational attainment of graduate degree earn the most with the average annual earnings of $60,789, while those with college or associate's degree education have the smallest earnings of $17,917.
| Educational Attainment | Male Income | Female Income |
| Less than High School | $33,472 | $0 |
| High School Diploma | $33,125 | $43,333 |
| College or Associate's Degree | - | - |
| Bachelor's Degree | $41,544 | $28,667 |
| Graduate Degree | - | - |
| Total | $37,604 | $28,750 |
Family Income in Clayton
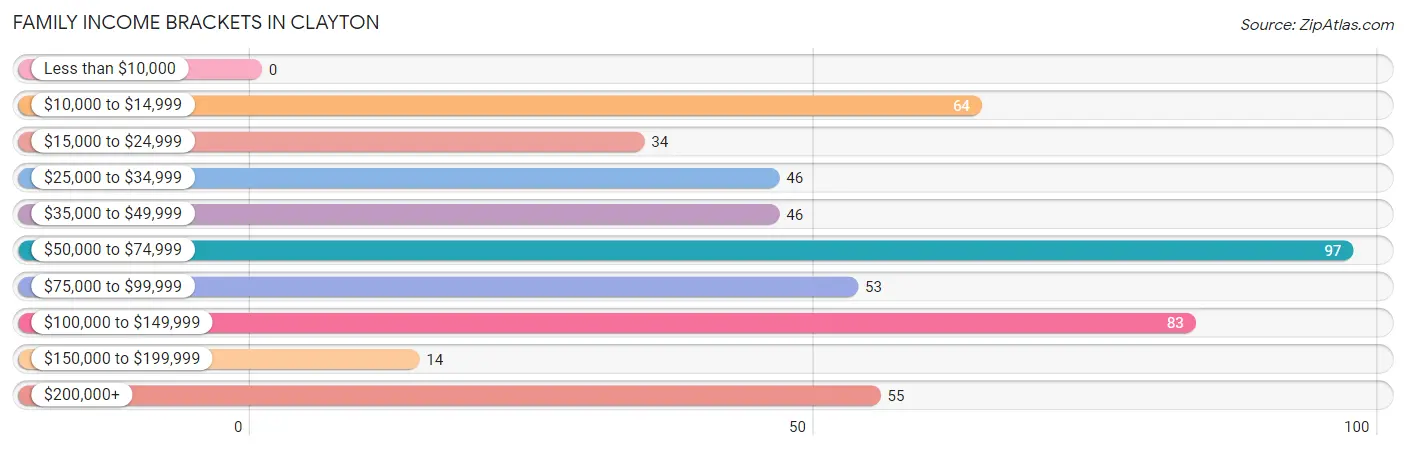
Family Income Brackets in Clayton
According to the Clayton family income data, there are 97 families falling into the $50,000 to $74,999 income range, which is the most common income bracket and makes up 19.7% of all families.
| Income Bracket | # Families | % Families |
| Less than $10,000 | 0 | 0.0% |
| $10,000 to $14,999 | 64 | 13.0% |
| $15,000 to $24,999 | 34 | 6.9% |
| $25,000 to $34,999 | 46 | 9.3% |
| $35,000 to $49,999 | 46 | 9.3% |
| $50,000 to $74,999 | 97 | 19.7% |
| $75,000 to $99,999 | 53 | 10.8% |
| $100,000 to $149,999 | 83 | 16.9% |
| $150,000 to $199,999 | 14 | 2.8% |
| $200,000+ | 55 | 11.2% |
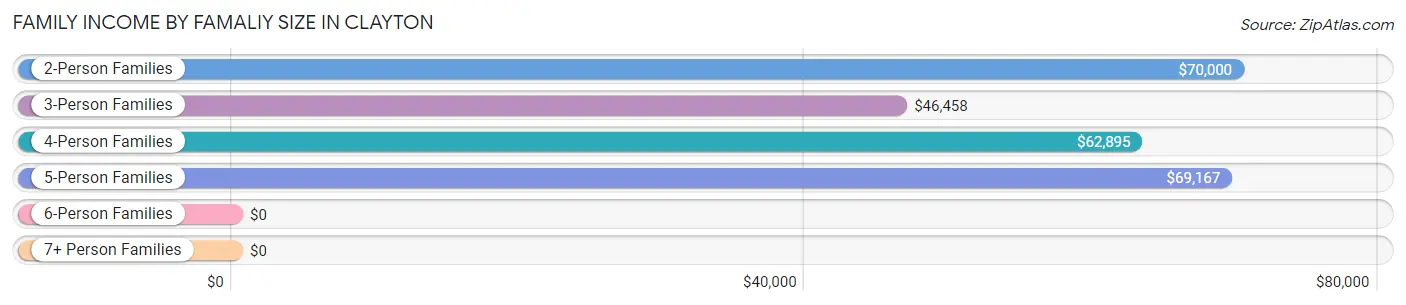
Family Income by Famaliy Size in Clayton
2-person families (288 | 58.5%) account for the highest median family income in Clayton with $70,000 per family, while 2-person families (288 | 58.5%) have the highest median income of $35,000 per family member.
| Income Bracket | # Families | Median Income |
| 2-Person Families | 288 (58.5%) | $70,000 |
| 3-Person Families | 102 (20.7%) | $46,458 |
| 4-Person Families | 80 (16.3%) | $62,895 |
| 5-Person Families | 14 (2.9%) | $69,167 |
| 6-Person Families | 0 (0.0%) | $0 |
| 7+ Person Families | 8 (1.6%) | $0 |
| Total | 492 (100.0%) | $63,452 |
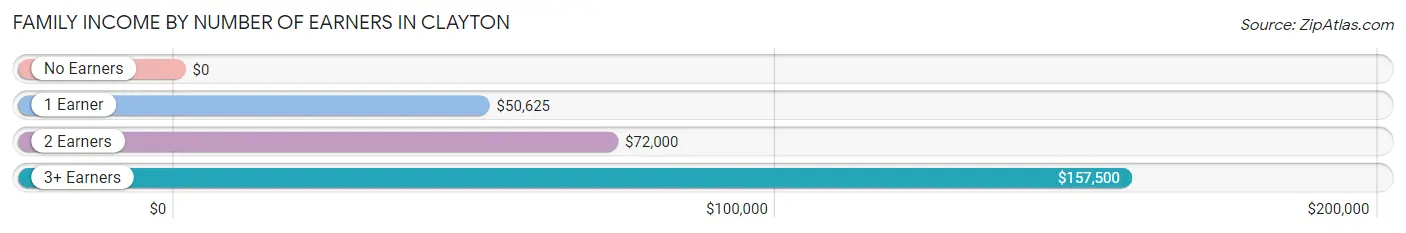
Family Income by Number of Earners in Clayton
| Number of Earners | # Families | Median Income |
| No Earners | 154 (31.3%) | $0 |
| 1 Earner | 130 (26.4%) | $50,625 |
| 2 Earners | 158 (32.1%) | $72,000 |
| 3+ Earners | 50 (10.2%) | $157,500 |
| Total | 492 (100.0%) | $63,452 |
Household Income in Clayton
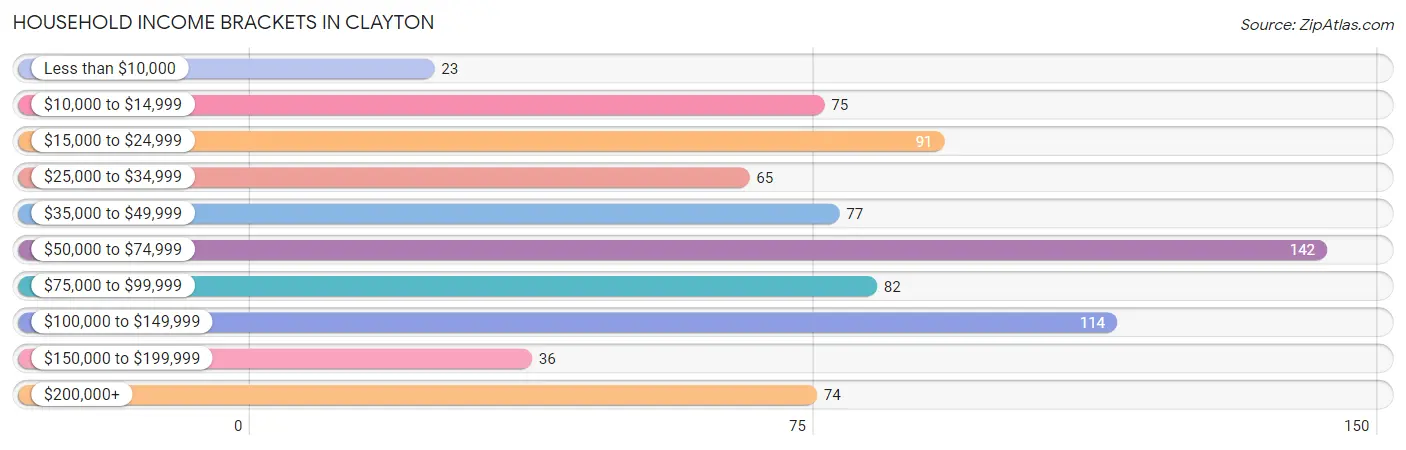
Household Income Brackets in Clayton
With 142 households falling in the category, the $50,000 to $74,999 income range is the most frequent in Clayton, accounting for 18.2% of all households. In contrast, only 23 households (2.9%) fall into the less than $10,000 income bracket, making it the least populous group.
| Income Bracket | # Households | % Households |
| Less than $10,000 | 23 | 3.0% |
| $10,000 to $14,999 | 75 | 9.6% |
| $15,000 to $24,999 | 91 | 11.7% |
| $25,000 to $34,999 | 65 | 8.3% |
| $35,000 to $49,999 | 77 | 9.9% |
| $50,000 to $74,999 | 142 | 18.2% |
| $75,000 to $99,999 | 82 | 10.5% |
| $100,000 to $149,999 | 114 | 14.6% |
| $150,000 to $199,999 | 36 | 4.6% |
| $200,000+ | 74 | 9.5% |
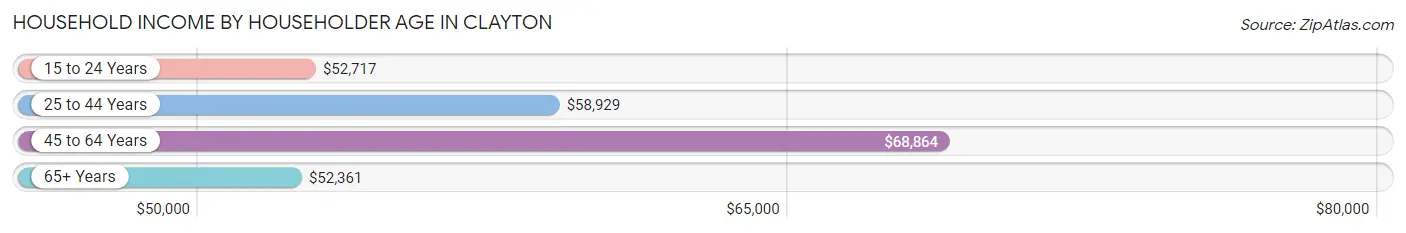
Household Income by Householder Age in Clayton
The median household income in Clayton is $56,369, with the highest median household income of $68,864 found in the 45 to 64 years age bracket for the primary householder. A total of 288 households (37.0%) fall into this category. Meanwhile, the 65+ years age bracket for the primary householder has the lowest median household income of $52,361, with 285 households (36.6%) in this group.
| Income Bracket | # Households | Median Income |
| 15 to 24 Years | 60 (7.7%) | $52,717 |
| 25 to 44 Years | 146 (18.7%) | $58,929 |
| 45 to 64 Years | 288 (37.0%) | $68,864 |
| 65+ Years | 285 (36.6%) | $52,361 |
| Total | 779 (100.0%) | $56,369 |
Poverty in Clayton
Income Below Poverty by Sex and Age in Clayton
With 15.6% poverty level for males and 15.3% for females among the residents of Clayton, 18 to 24 year old males and under 5 year old females are the most vulnerable to poverty, with 38 males (32.8%) and 38 females (52.8%) in their respective age groups living below the poverty level.
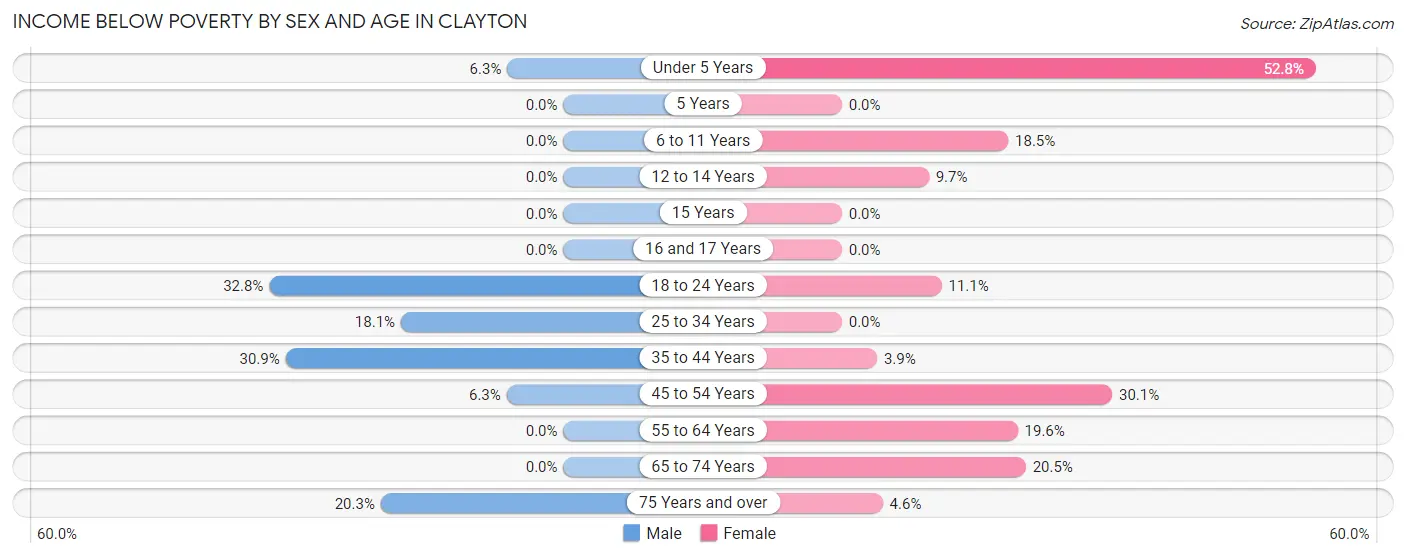
| Age Bracket | Male | Female |
| Under 5 Years | 2 (6.2%) | 38 (52.8%) |
| 5 Years | 0 (0.0%) | 0 (0.0%) |
| 6 to 11 Years | 0 (0.0%) | 5 (18.5%) |
| 12 to 14 Years | 0 (0.0%) | 3 (9.7%) |
| 15 Years | 0 (0.0%) | 0 (0.0%) |
| 16 and 17 Years | 0 (0.0%) | 0 (0.0%) |
| 18 to 24 Years | 38 (32.8%) | 19 (11.1%) |
| 25 to 34 Years | 53 (18.1%) | 0 (0.0%) |
| 35 to 44 Years | 43 (30.9%) | 4 (3.9%) |
| 45 to 54 Years | 6 (6.3%) | 31 (30.1%) |
| 55 to 64 Years | 0 (0.0%) | 37 (19.6%) |
| 65 to 74 Years | 0 (0.0%) | 17 (20.5%) |
| 75 Years and over | 24 (20.3%) | 8 (4.5%) |
| Total | 166 (15.6%) | 162 (15.3%) |
Income Above Poverty by Sex and Age in Clayton
According to the poverty statistics in Clayton, males aged 6 to 11 years and females aged 15 years are the age groups that are most secure financially, with 100.0% of males and 100.0% of females in these age groups living above the poverty line.
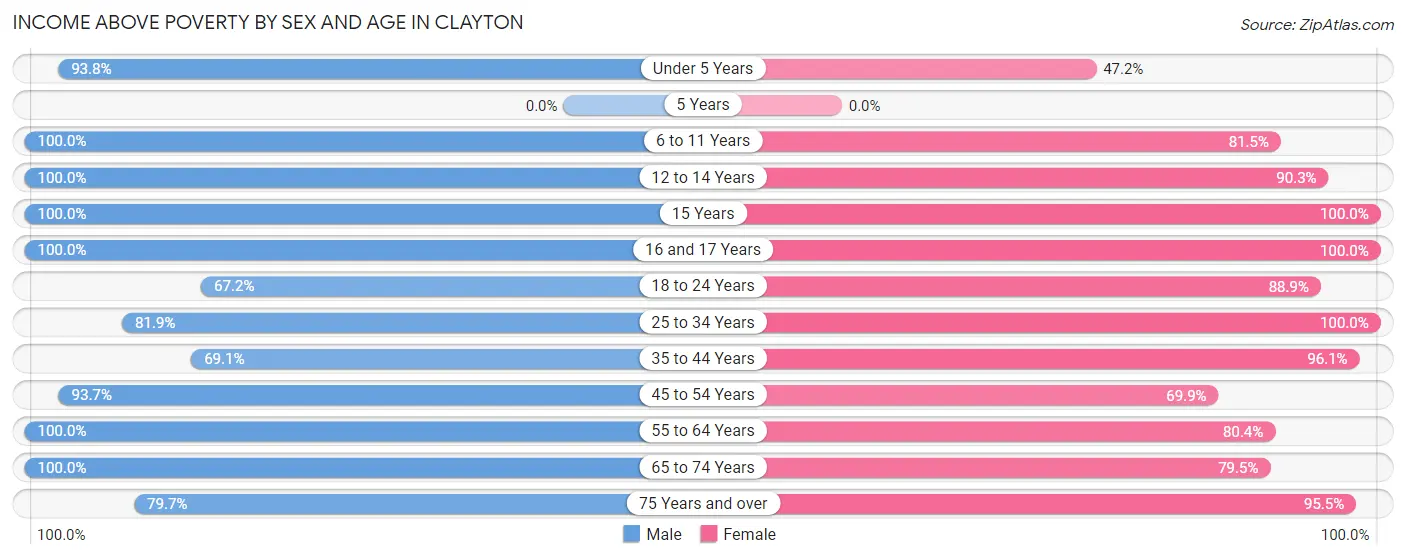
| Age Bracket | Male | Female |
| Under 5 Years | 30 (93.8%) | 34 (47.2%) |
| 5 Years | 0 (0.0%) | 0 (0.0%) |
| 6 to 11 Years | 31 (100.0%) | 22 (81.5%) |
| 12 to 14 Years | 24 (100.0%) | 28 (90.3%) |
| 15 Years | 10 (100.0%) | 7 (100.0%) |
| 16 and 17 Years | 5 (100.0%) | 5 (100.0%) |
| 18 to 24 Years | 78 (67.2%) | 152 (88.9%) |
| 25 to 34 Years | 240 (81.9%) | 95 (100.0%) |
| 35 to 44 Years | 96 (69.1%) | 98 (96.1%) |
| 45 to 54 Years | 89 (93.7%) | 72 (69.9%) |
| 55 to 64 Years | 138 (100.0%) | 152 (80.4%) |
| 65 to 74 Years | 66 (100.0%) | 66 (79.5%) |
| 75 Years and over | 94 (79.7%) | 168 (95.5%) |
| Total | 901 (84.4%) | 899 (84.7%) |
Income Below Poverty Among Married-Couple Families in Clayton
The poverty statistics for married-couple families in Clayton show that 9.2% or 34 of the total 368 families live below the poverty line. Families with 1 or 2 children have the highest poverty rate of 23.9%, comprising of 16 families. On the other hand, families with no children have the lowest poverty rate of 5.9%, which includes 17 families.
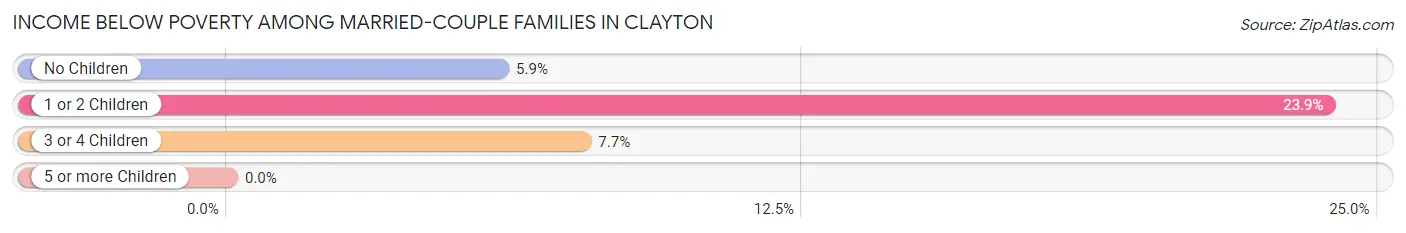
| Children | Above Poverty | Below Poverty |
| No Children | 271 (94.1%) | 17 (5.9%) |
| 1 or 2 Children | 51 (76.1%) | 16 (23.9%) |
| 3 or 4 Children | 12 (92.3%) | 1 (7.7%) |
| 5 or more Children | 0 (0.0%) | 0 (0.0%) |
| Total | 334 (90.8%) | 34 (9.2%) |
Income Below Poverty Among Single-Parent Households in Clayton
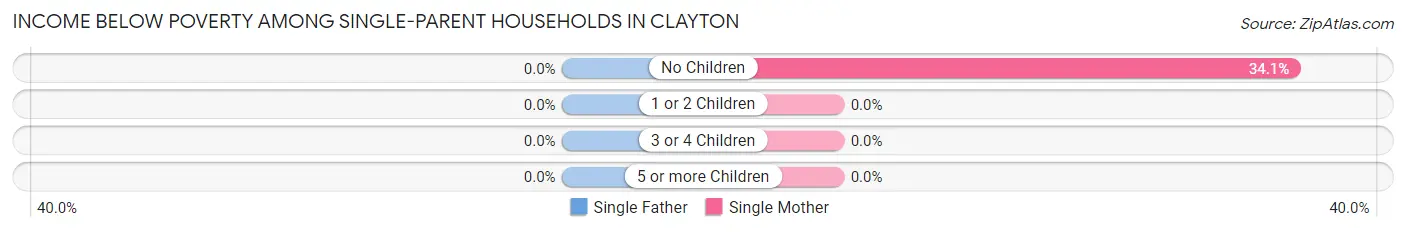
| Children | Single Father | Single Mother |
| No Children | 0 (0.0%) | 31 (34.1%) |
| 1 or 2 Children | 0 (0.0%) | 0 (0.0%) |
| 3 or 4 Children | 0 (0.0%) | 0 (0.0%) |
| 5 or more Children | 0 (0.0%) | 0 (0.0%) |
| Total | 0 (0.0%) | 31 (25.0%) |
Income Below Poverty Among Married-Couple vs Single-Parent Households in Clayton
The poverty data for Clayton shows that 34 of the married-couple family households (9.2%) and 31 of the single-parent households (25.0%) are living below the poverty level. Within the married-couple family households, those with 1 or 2 children have the highest poverty rate, with 16 households (23.9%) falling below the poverty line. Among the single-parent households, those with no children have the highest poverty rate, with 31 household (34.1%) living below poverty.
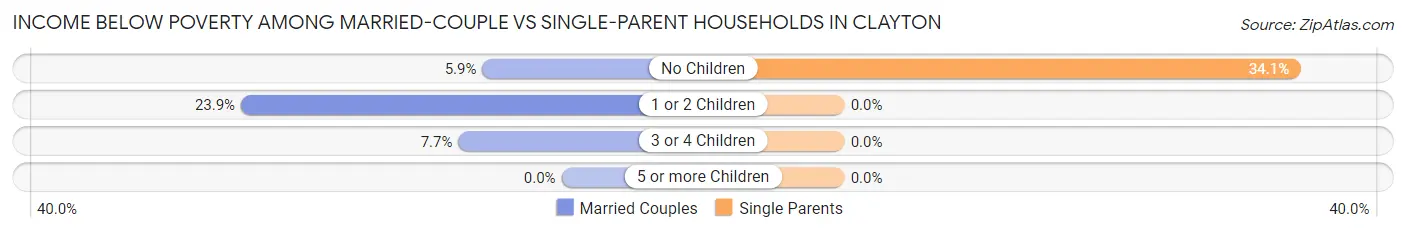
| Children | Married-Couple Families | Single-Parent Households |
| No Children | 17 (5.9%) | 31 (34.1%) |
| 1 or 2 Children | 16 (23.9%) | 0 (0.0%) |
| 3 or 4 Children | 1 (7.7%) | 0 (0.0%) |
| 5 or more Children | 0 (0.0%) | 0 (0.0%) |
| Total | 34 (9.2%) | 31 (25.0%) |
Race in Clayton
The most populous races in Clayton are White / Caucasian (1,935 | 85.0%), Hispanic or Latino (281 | 12.3%), and Some other Race (251 | 11.0%).
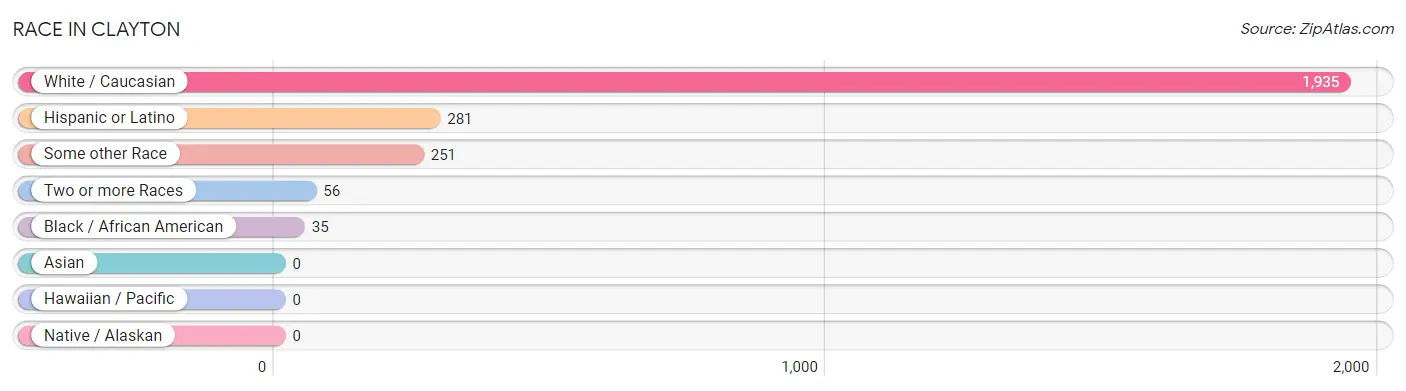
| Race | # Population | % Population |
| Asian | 0 | 0.0% |
| Black / African American | 35 | 1.5% |
| Hawaiian / Pacific | 0 | 0.0% |
| Hispanic or Latino | 281 | 12.3% |
| Native / Alaskan | 0 | 0.0% |
| White / Caucasian | 1,935 | 85.0% |
| Two or more Races | 56 | 2.5% |
| Some other Race | 251 | 11.0% |
| Total | 2,277 | 100.0% |
Ancestry in Clayton
The most populous ancestries reported in Clayton are English (314 | 13.8%), Mexican (281 | 12.3%), American (261 | 11.5%), Irish (194 | 8.5%), and German (169 | 7.4%), together accounting for 53.5% of all Clayton residents.
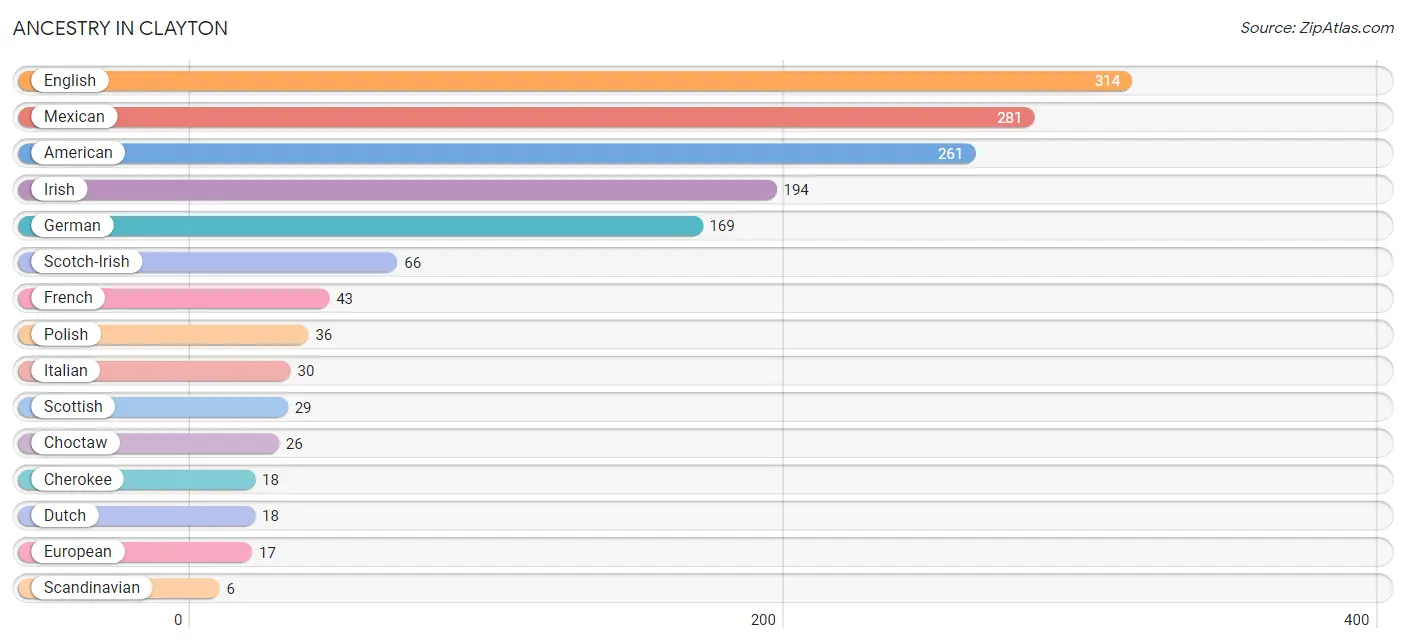
| Ancestry | # Population | % Population |
| American | 261 | 11.5% |
| Cherokee | 18 | 0.8% |
| Choctaw | 26 | 1.1% |
| Dutch | 18 | 0.8% |
| English | 314 | 13.8% |
| European | 17 | 0.7% |
| French | 43 | 1.9% |
| French American Indian | 4 | 0.2% |
| German | 169 | 7.4% |
| Greek | 4 | 0.2% |
| Irish | 194 | 8.5% |
| Italian | 30 | 1.3% |
| Mexican | 281 | 12.3% |
| Norwegian | 5 | 0.2% |
| Polish | 36 | 1.6% |
| Scandinavian | 6 | 0.3% |
| Scotch-Irish | 66 | 2.9% |
| Scottish | 29 | 1.3% | View All 18 Rows |
Immigrants in Clayton
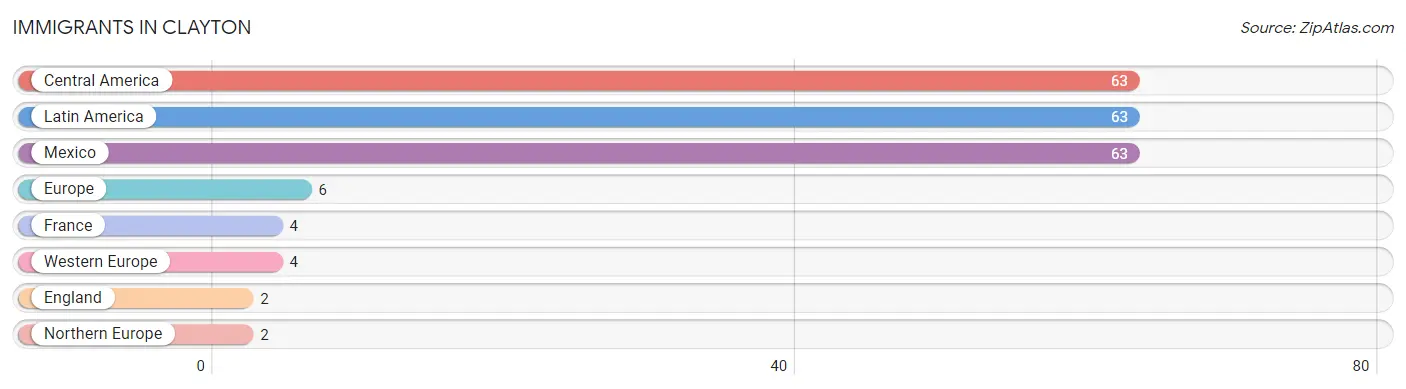
The most numerous immigrant groups reported in Clayton came from Central America (63 | 2.8%), Latin America (63 | 2.8%), Mexico (63 | 2.8%), Europe (6 | 0.3%), and France (4 | 0.2%), together accounting for 8.7% of all Clayton residents.
| Immigration Origin | # Population | % Population |
| Central America | 63 | 2.8% |
| England | 2 | 0.1% |
| Europe | 6 | 0.3% |
| France | 4 | 0.2% |
| Latin America | 63 | 2.8% |
| Mexico | 63 | 2.8% |
| Northern Europe | 2 | 0.1% |
| Western Europe | 4 | 0.2% | View All 8 Rows |
Sex and Age in Clayton
Sex and Age in Clayton
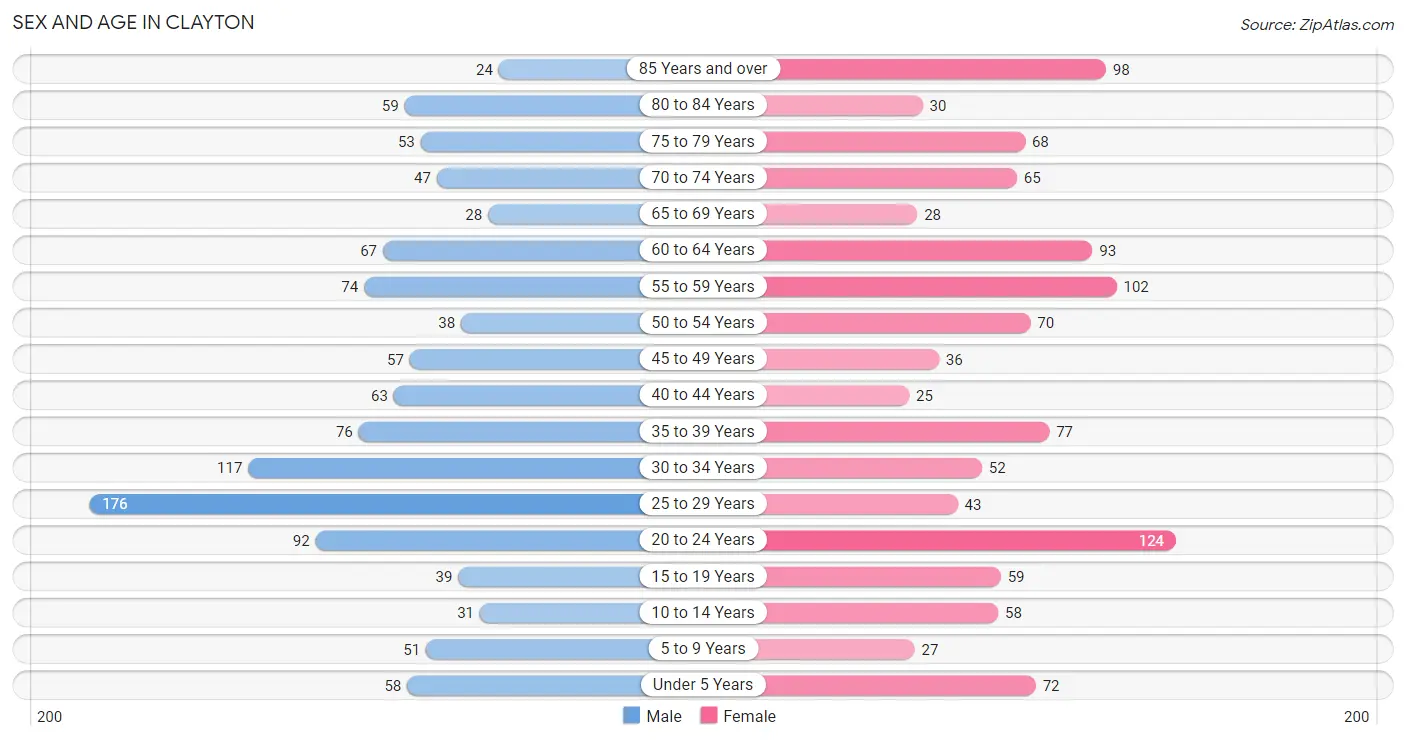
The most populous age groups in Clayton are 25 to 29 Years (176 | 15.3%) for men and 20 to 24 Years (124 | 11.0%) for women.
| Age Bracket | Male | Female |
| Under 5 Years | 58 (5.0%) | 72 (6.4%) |
| 5 to 9 Years | 51 (4.4%) | 27 (2.4%) |
| 10 to 14 Years | 31 (2.7%) | 58 (5.1%) |
| 15 to 19 Years | 39 (3.4%) | 59 (5.2%) |
| 20 to 24 Years | 92 (8.0%) | 124 (11.0%) |
| 25 to 29 Years | 176 (15.3%) | 43 (3.8%) |
| 30 to 34 Years | 117 (10.2%) | 52 (4.6%) |
| 35 to 39 Years | 76 (6.6%) | 77 (6.8%) |
| 40 to 44 Years | 63 (5.5%) | 25 (2.2%) |
| 45 to 49 Years | 57 (5.0%) | 36 (3.2%) |
| 50 to 54 Years | 38 (3.3%) | 70 (6.2%) |
| 55 to 59 Years | 74 (6.4%) | 102 (9.0%) |
| 60 to 64 Years | 67 (5.8%) | 93 (8.3%) |
| 65 to 69 Years | 28 (2.4%) | 28 (2.5%) |
| 70 to 74 Years | 47 (4.1%) | 65 (5.8%) |
| 75 to 79 Years | 53 (4.6%) | 68 (6.0%) |
| 80 to 84 Years | 59 (5.1%) | 30 (2.7%) |
| 85 Years and over | 24 (2.1%) | 98 (8.7%) |
| Total | 1,150 (100.0%) | 1,127 (100.0%) |
Families and Households in Clayton
Median Family Size in Clayton
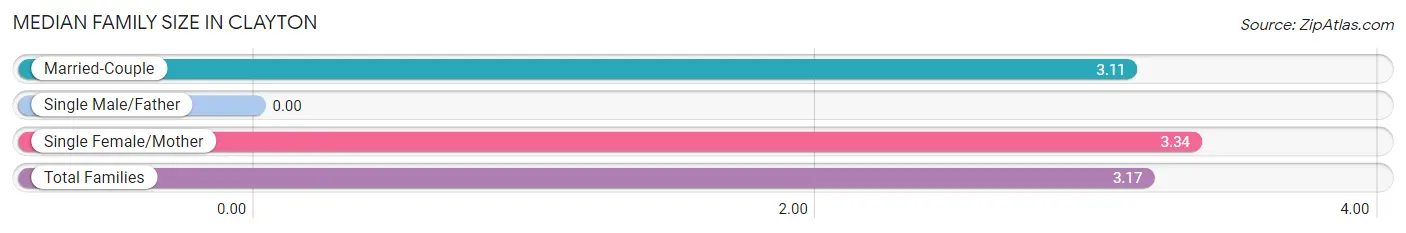
| Family Type | # Families | Family Size |
| Married-Couple | 368 (74.8%) | 3.11 |
| Single Male/Father | 0 (0.0%) | - |
| Single Female/Mother | 124 (25.2%) | 3.34 |
| Total Families | 492 (100.0%) | 3.17 |
Median Household Size in Clayton
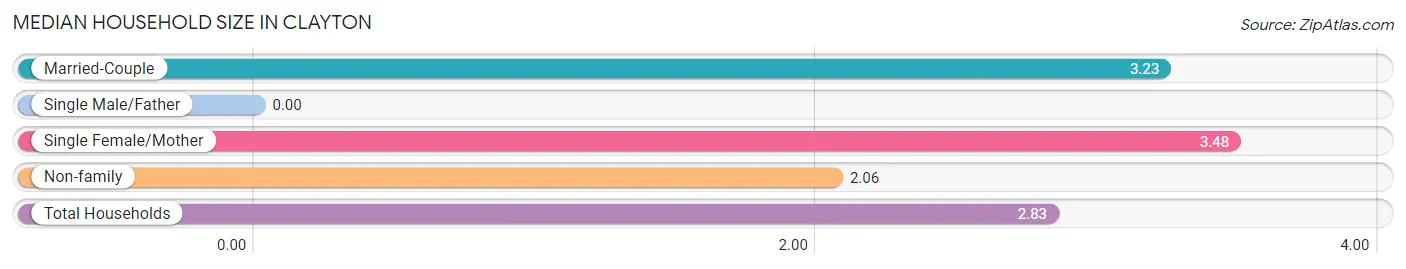
| Household Type | # Households | Household Size |
| Married-Couple | 368 (47.2%) | 3.23 |
| Single Male/Father | 0 (0.0%) | - |
| Single Female/Mother | 124 (15.9%) | 3.48 |
| Non-family | 287 (36.8%) | 2.06 |
| Total Households | 779 (100.0%) | 2.83 |
Household Size by Marriage Status in Clayton
Out of a total of 779 households in Clayton, 492 (63.2%) are family households, while 287 (36.8%) are nonfamily households. The most numerous type of family households are 2-person households, comprising 277, and the most common type of nonfamily households are 1-person households, comprising 187.
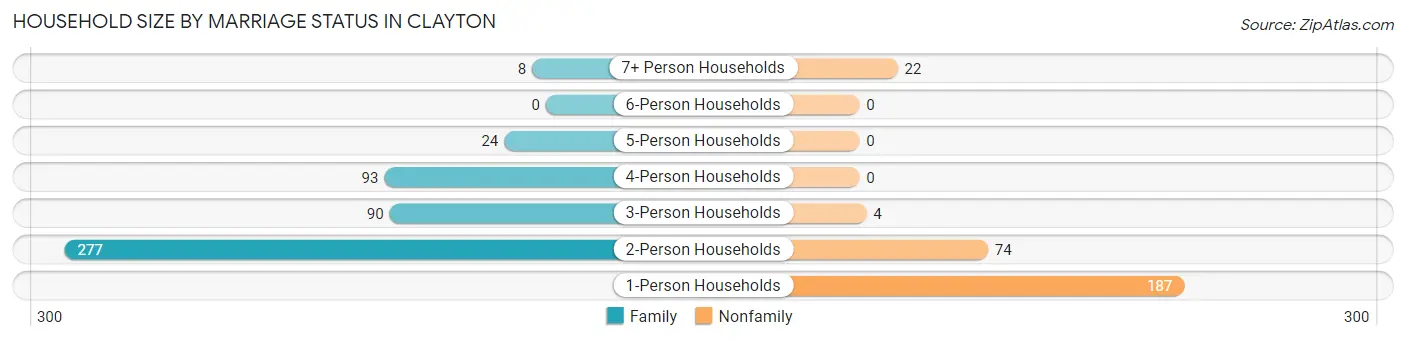
| Household Size | Family Households | Nonfamily Households |
| 1-Person Households | - | 187 (24.0%) |
| 2-Person Households | 277 (35.6%) | 74 (9.5%) |
| 3-Person Households | 90 (11.6%) | 4 (0.5%) |
| 4-Person Households | 93 (11.9%) | 0 (0.0%) |
| 5-Person Households | 24 (3.1%) | 0 (0.0%) |
| 6-Person Households | 0 (0.0%) | 0 (0.0%) |
| 7+ Person Households | 8 (1.0%) | 22 (2.8%) |
| Total | 492 (63.2%) | 287 (36.8%) |
Female Fertility in Clayton
Fertility by Age in Clayton
Average fertility rate in Clayton is 55.0 births per 1,000 women. Women in the age bracket of 15 to 19 years have the highest fertility rate with 271.0 births per 1,000 women. Women in the age bracket of 15 to 19 years acount for 69.6% of all women with births.
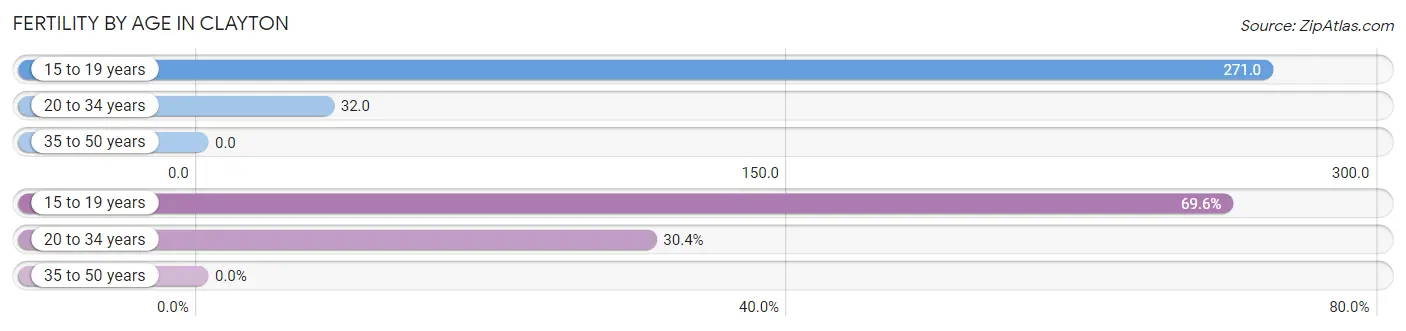
| Age Bracket | Women with Births | Births / 1,000 Women |
| 15 to 19 years | 16 (69.6%) | 271.0 |
| 20 to 34 years | 7 (30.4%) | 32.0 |
| 35 to 50 years | 0 (0.0%) | 0.0 |
| Total | 23 (100.0%) | 55.0 |
Fertility by Age by Marriage Status in Clayton
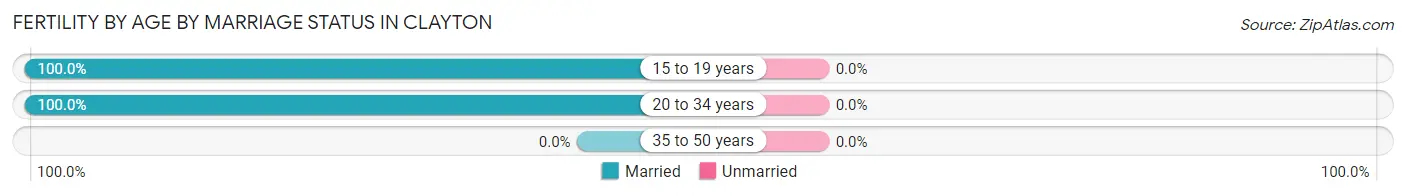
| Age Bracket | Married | Unmarried |
| 15 to 19 years | 16 (100.0%) | 0 (0.0%) |
| 20 to 34 years | 7 (100.0%) | 0 (0.0%) |
| 35 to 50 years | 0 (0.0%) | 0 (0.0%) |
| Total | 23 (100.0%) | 0 (0.0%) |
Fertility by Education in Clayton
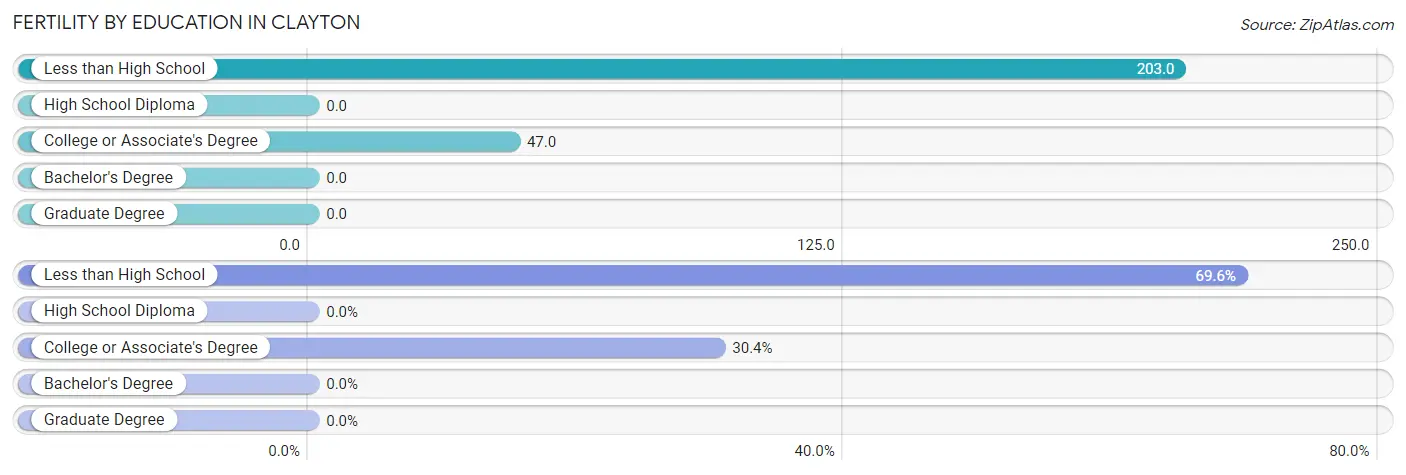
| Educational Attainment | Women with Births | Births / 1,000 Women |
| Less than High School | 16 (69.6%) | 203.0 |
| High School Diploma | 0 (0.0%) | 0.0 |
| College or Associate's Degree | 7 (30.4%) | 47.0 |
| Bachelor's Degree | 0 (0.0%) | 0.0 |
| Graduate Degree | 0 (0.0%) | 0.0 |
| Total | 23 (100.0%) | 55.0 |
Fertility by Education by Marriage Status in Clayton
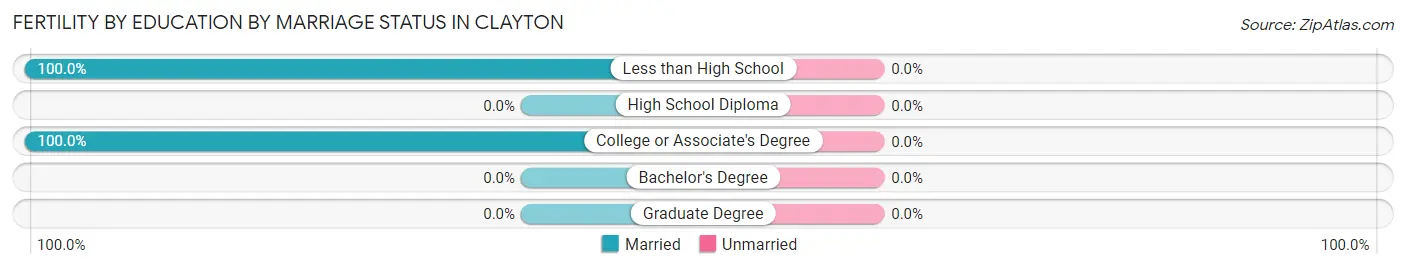
| Educational Attainment | Married | Unmarried |
| Less than High School | 16 (100.0%) | 0 (0.0%) |
| High School Diploma | 0 (0.0%) | 0 (0.0%) |
| College or Associate's Degree | 7 (100.0%) | 0 (0.0%) |
| Bachelor's Degree | 0 (0.0%) | 0 (0.0%) |
| Graduate Degree | 0 (0.0%) | 0 (0.0%) |
| Total | 23 (100.0%) | 0 (0.0%) |
Employment Characteristics in Clayton
Employment by Class of Employer in Clayton
Among the 1,010 employed individuals in Clayton, private company employees (713 | 70.6%), self-employed (not incorporated) (131 | 13.0%), and local government employees (70 | 6.9%) make up the most common classes of employment.
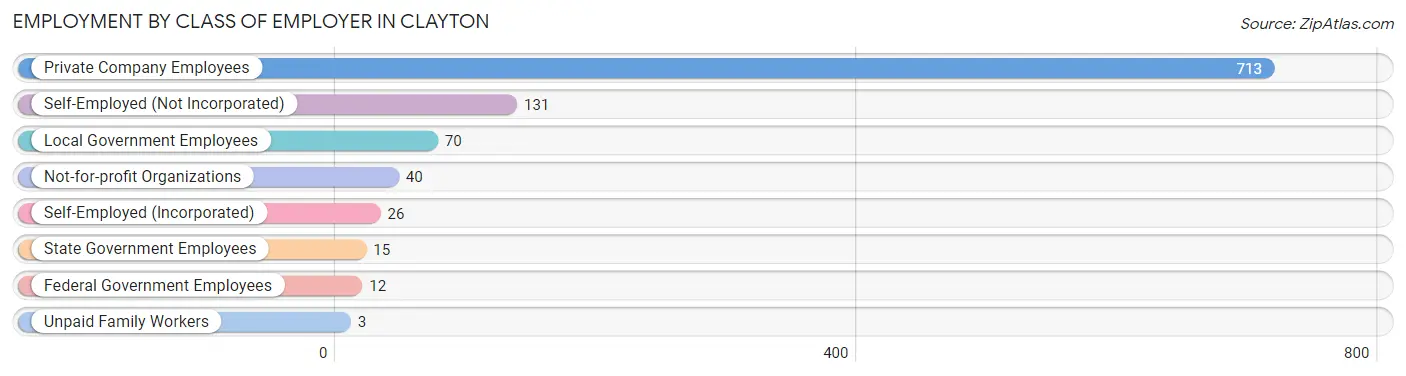
| Employer Class | # Employees | % Employees |
| Private Company Employees | 713 | 70.6% |
| Self-Employed (Incorporated) | 26 | 2.6% |
| Self-Employed (Not Incorporated) | 131 | 13.0% |
| Not-for-profit Organizations | 40 | 4.0% |
| Local Government Employees | 70 | 6.9% |
| State Government Employees | 15 | 1.5% |
| Federal Government Employees | 12 | 1.2% |
| Unpaid Family Workers | 3 | 0.3% |
| Total | 1,010 | 100.0% |
Employment Status by Age in Clayton
According to the labor force statistics for Clayton, out of the total population over 16 years of age (1,963), 54.6% or 1,072 individuals are in the labor force, with 5.7% or 61 of them unemployed. The age group with the highest labor force participation rate is 20 to 24 years, with 100.0% or 216 individuals in the labor force. Within the labor force, the 75 years and over age range has the highest percentage of unemployed individuals, with 54.5% or 6 of them being unemployed.
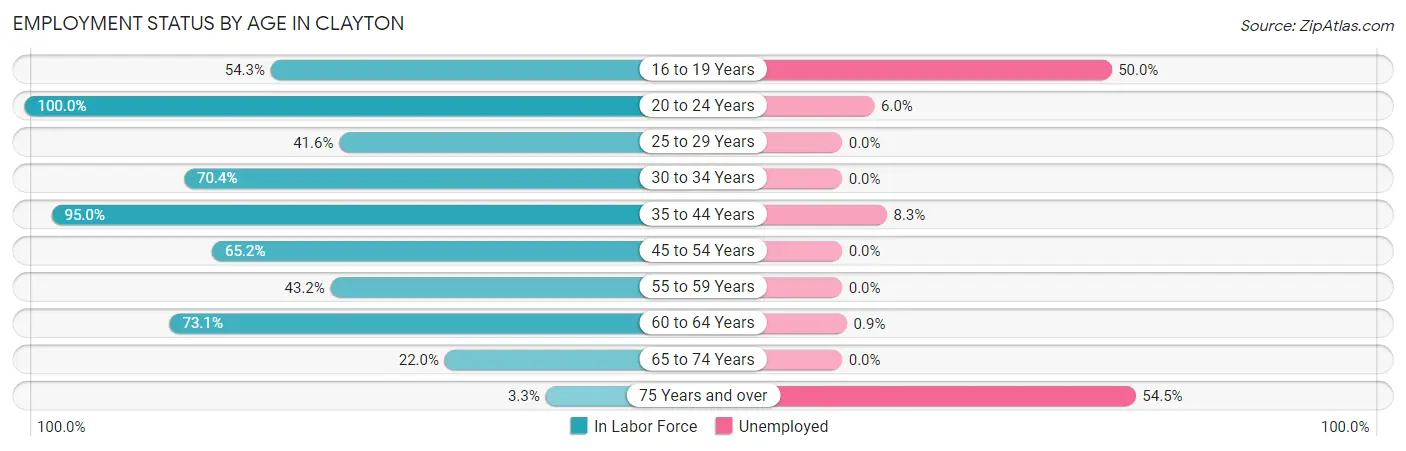
| Age Bracket | In Labor Force | Unemployed |
| 16 to 19 Years | 44 (54.3%) | 22 (50.0%) |
| 20 to 24 Years | 216 (100.0%) | 13 (6.0%) |
| 25 to 29 Years | 91 (41.6%) | 0 (0.0%) |
| 30 to 34 Years | 119 (70.4%) | 0 (0.0%) |
| 35 to 44 Years | 229 (95.0%) | 19 (8.3%) |
| 45 to 54 Years | 131 (65.2%) | 0 (0.0%) |
| 55 to 59 Years | 76 (43.2%) | 0 (0.0%) |
| 60 to 64 Years | 117 (73.1%) | 1 (0.9%) |
| 65 to 74 Years | 37 (22.0%) | 0 (0.0%) |
| 75 Years and over | 11 (3.3%) | 6 (54.5%) |
| Total | 1,072 (54.6%) | 61 (5.7%) |
Employment Status by Educational Attainment in Clayton
According to labor force statistics for Clayton, 65.4% of individuals (763) out of the total population between 25 and 64 years of age (1,166) are in the labor force, with 2.6% or 20 of them being unemployed. The group with the highest labor force participation rate are those with the educational attainment of bachelor's degree or higher, with 78.1% or 200 individuals in the labor force. Within the labor force, individuals with high school diploma education have the highest percentage of unemployment, with 6.3% or 20 of them being unemployed.
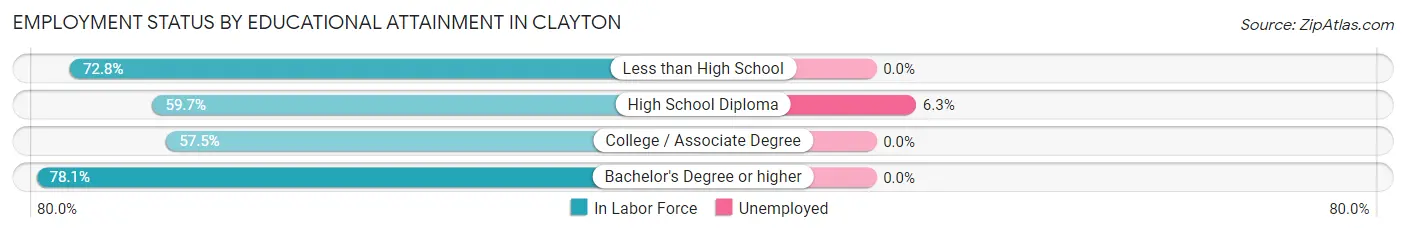
| Educational Attainment | In Labor Force | Unemployed |
| Less than High School | 134 (72.8%) | 0 (0.0%) |
| High School Diploma | 318 (59.7%) | 34 (6.3%) |
| College / Associate Degree | 111 (57.5%) | 0 (0.0%) |
| Bachelor's Degree or higher | 200 (78.1%) | 0 (0.0%) |
| Total | 763 (65.4%) | 30 (2.6%) |
Employment Occupations by Sex in Clayton
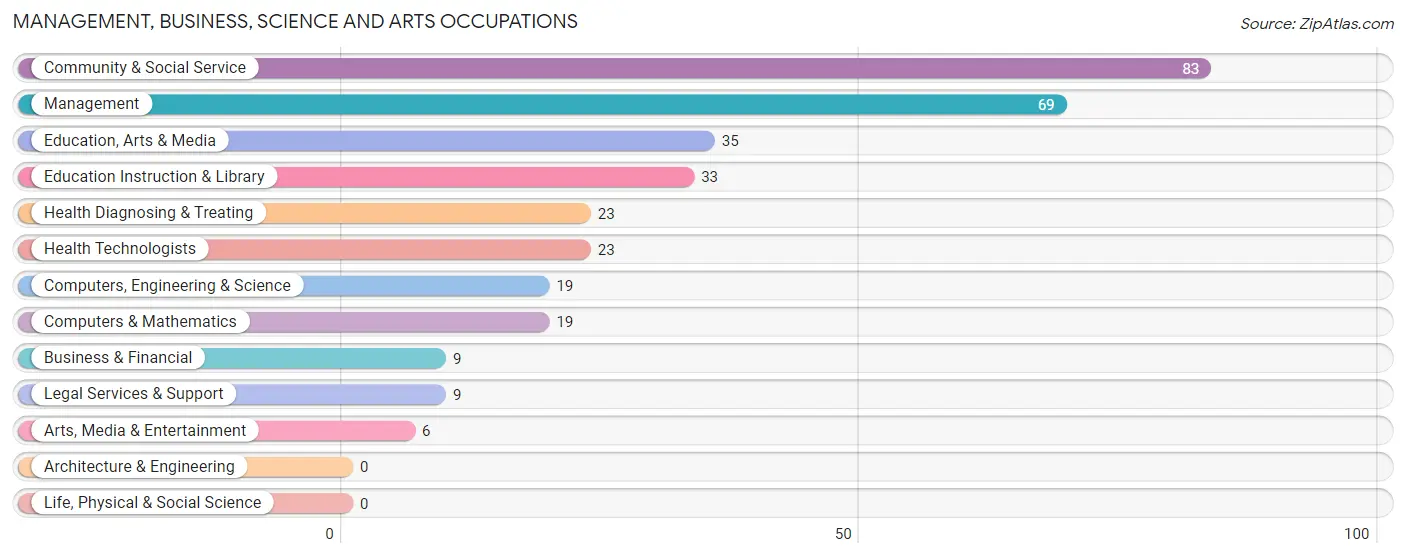
Management, Business, Science and Arts Occupations
The most common Management, Business, Science and Arts occupations in Clayton are Community & Social Service (83 | 8.2%), Management (69 | 6.8%), Education, Arts & Media (35 | 3.5%), Education Instruction & Library (33 | 3.3%), and Health Diagnosing & Treating (23 | 2.3%).
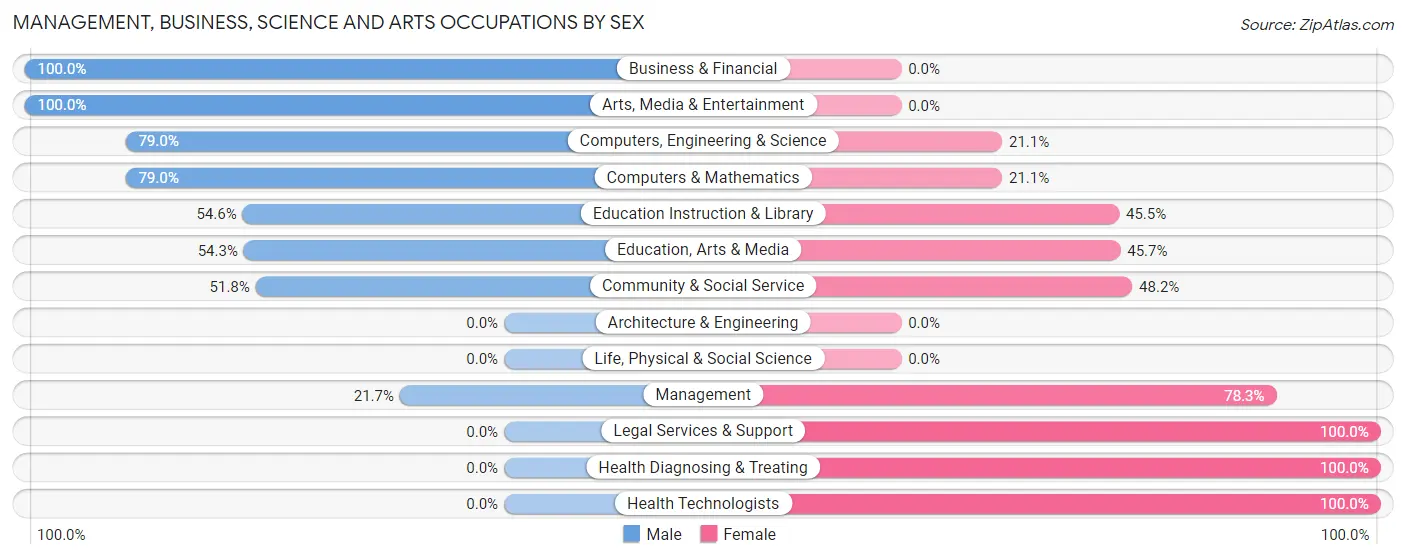
Management, Business, Science and Arts Occupations by Sex
Within the Management, Business, Science and Arts occupations in Clayton, the most male-oriented occupations are Business & Financial (100.0%), Arts, Media & Entertainment (100.0%), and Computers, Engineering & Science (78.9%), while the most female-oriented occupations are Legal Services & Support (100.0%), Health Diagnosing & Treating (100.0%), and Health Technologists (100.0%).
| Occupation | Male | Female |
| Management | 15 (21.7%) | 54 (78.3%) |
| Business & Financial | 9 (100.0%) | 0 (0.0%) |
| Computers, Engineering & Science | 15 (78.9%) | 4 (21.0%) |
| Computers & Mathematics | 15 (78.9%) | 4 (21.0%) |
| Architecture & Engineering | 0 (0.0%) | 0 (0.0%) |
| Life, Physical & Social Science | 0 (0.0%) | 0 (0.0%) |
| Community & Social Service | 43 (51.8%) | 40 (48.2%) |
| Education, Arts & Media | 19 (54.3%) | 16 (45.7%) |
| Legal Services & Support | 0 (0.0%) | 9 (100.0%) |
| Education Instruction & Library | 18 (54.5%) | 15 (45.5%) |
| Arts, Media & Entertainment | 6 (100.0%) | 0 (0.0%) |
| Health Diagnosing & Treating | 0 (0.0%) | 23 (100.0%) |
| Health Technologists | 0 (0.0%) | 23 (100.0%) |
| Total (Category) | 82 (40.4%) | 121 (59.6%) |
| Total (Overall) | 535 (53.0%) | 475 (47.0%) |
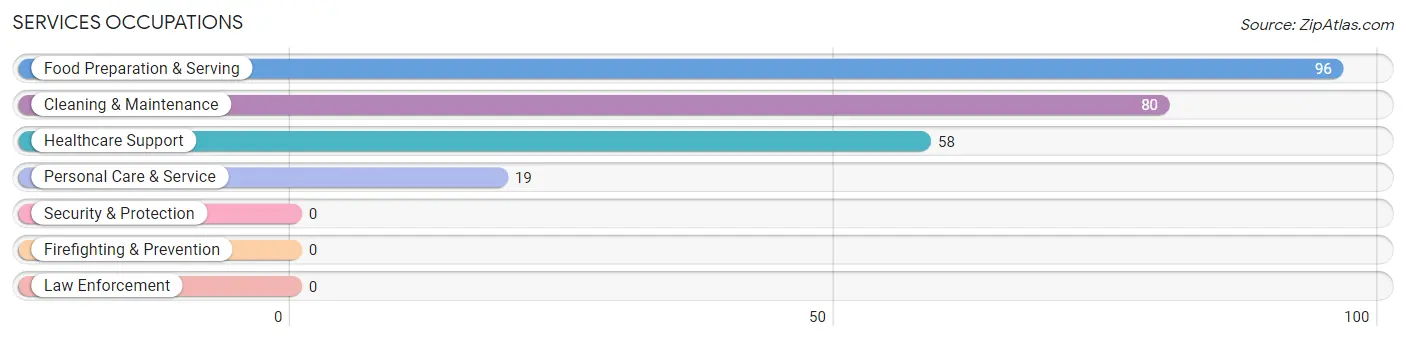
Services Occupations
The most common Services occupations in Clayton are Food Preparation & Serving (96 | 9.5%), Cleaning & Maintenance (80 | 7.9%), Healthcare Support (58 | 5.7%), and Personal Care & Service (19 | 1.9%).
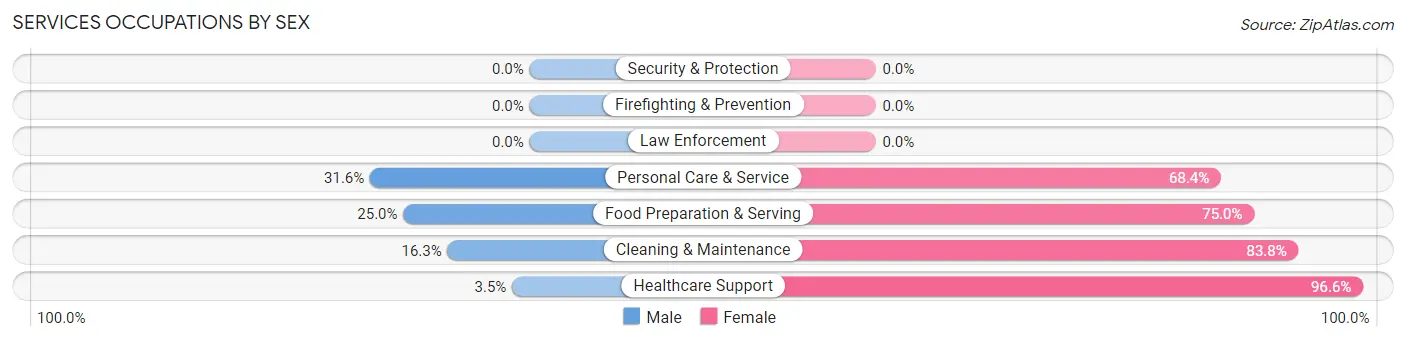
Services Occupations by Sex
Within the Services occupations in Clayton, the most male-oriented occupations are Personal Care & Service (31.6%), Food Preparation & Serving (25.0%), and Cleaning & Maintenance (16.3%), while the most female-oriented occupations are Healthcare Support (96.6%), Cleaning & Maintenance (83.8%), and Food Preparation & Serving (75.0%).
| Occupation | Male | Female |
| Healthcare Support | 2 (3.5%) | 56 (96.6%) |
| Security & Protection | 0 (0.0%) | 0 (0.0%) |
| Firefighting & Prevention | 0 (0.0%) | 0 (0.0%) |
| Law Enforcement | 0 (0.0%) | 0 (0.0%) |
| Food Preparation & Serving | 24 (25.0%) | 72 (75.0%) |
| Cleaning & Maintenance | 13 (16.3%) | 67 (83.8%) |
| Personal Care & Service | 6 (31.6%) | 13 (68.4%) |
| Total (Category) | 45 (17.8%) | 208 (82.2%) |
| Total (Overall) | 535 (53.0%) | 475 (47.0%) |
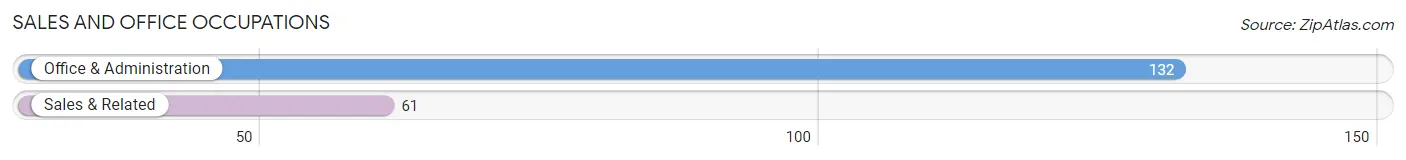
Sales and Office Occupations
The most common Sales and Office occupations in Clayton are Office & Administration (132 | 13.1%), and Sales & Related (61 | 6.0%).
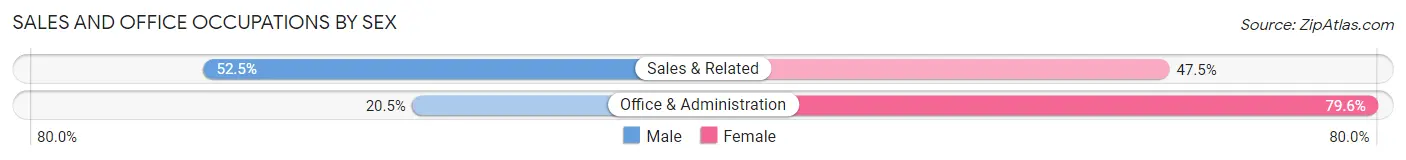
Sales and Office Occupations by Sex
| Occupation | Male | Female |
| Sales & Related | 32 (52.5%) | 29 (47.5%) |
| Office & Administration | 27 (20.4%) | 105 (79.5%) |
| Total (Category) | 59 (30.6%) | 134 (69.4%) |
| Total (Overall) | 535 (53.0%) | 475 (47.0%) |
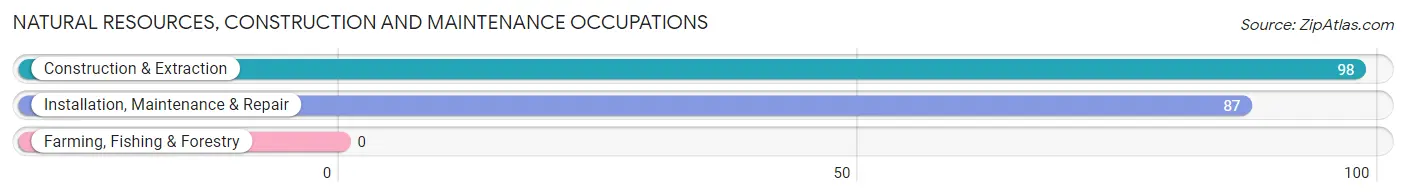
Natural Resources, Construction and Maintenance Occupations
The most common Natural Resources, Construction and Maintenance occupations in Clayton are Construction & Extraction (98 | 9.7%), and Installation, Maintenance & Repair (87 | 8.6%).
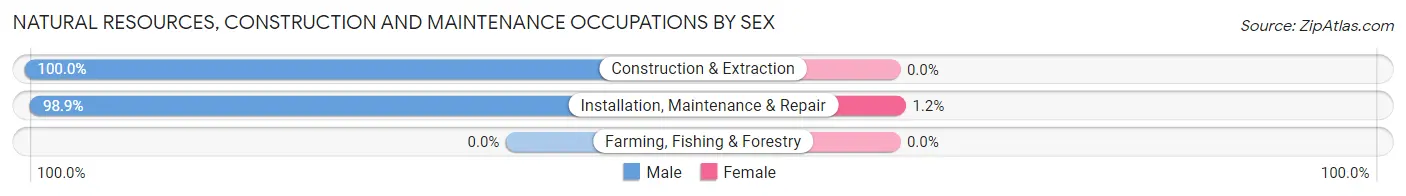
Natural Resources, Construction and Maintenance Occupations by Sex
| Occupation | Male | Female |
| Farming, Fishing & Forestry | 0 (0.0%) | 0 (0.0%) |
| Construction & Extraction | 98 (100.0%) | 0 (0.0%) |
| Installation, Maintenance & Repair | 86 (98.9%) | 1 (1.1%) |
| Total (Category) | 184 (99.5%) | 1 (0.5%) |
| Total (Overall) | 535 (53.0%) | 475 (47.0%) |
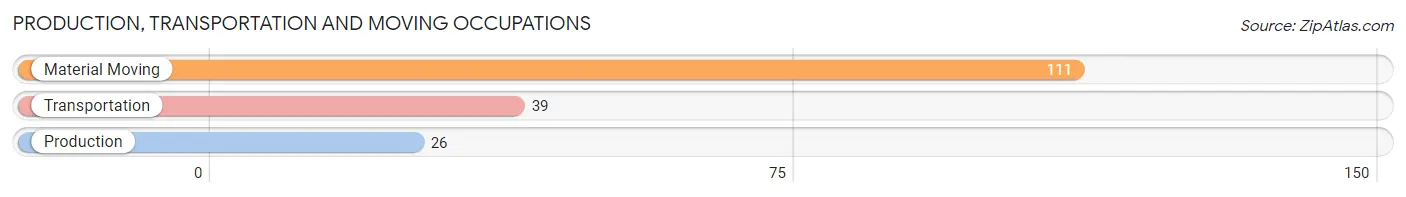
Production, Transportation and Moving Occupations
The most common Production, Transportation and Moving occupations in Clayton are Material Moving (111 | 11.0%), Transportation (39 | 3.9%), and Production (26 | 2.6%).
Production, Transportation and Moving Occupations by Sex
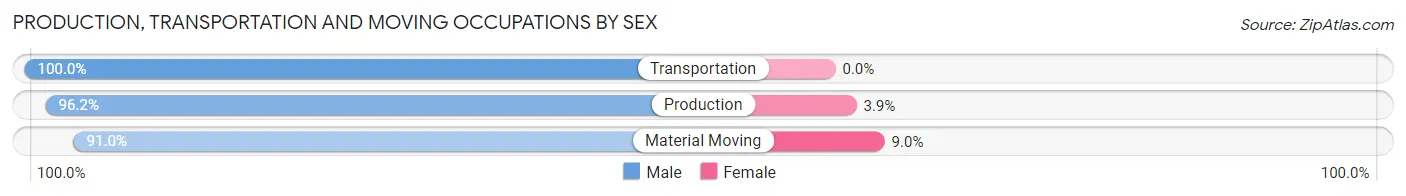
| Occupation | Male | Female |
| Production | 25 (96.2%) | 1 (3.8%) |
| Transportation | 39 (100.0%) | 0 (0.0%) |
| Material Moving | 101 (91.0%) | 10 (9.0%) |
| Total (Category) | 165 (93.8%) | 11 (6.2%) |
| Total (Overall) | 535 (53.0%) | 475 (47.0%) |
Employment Industries by Sex in Clayton
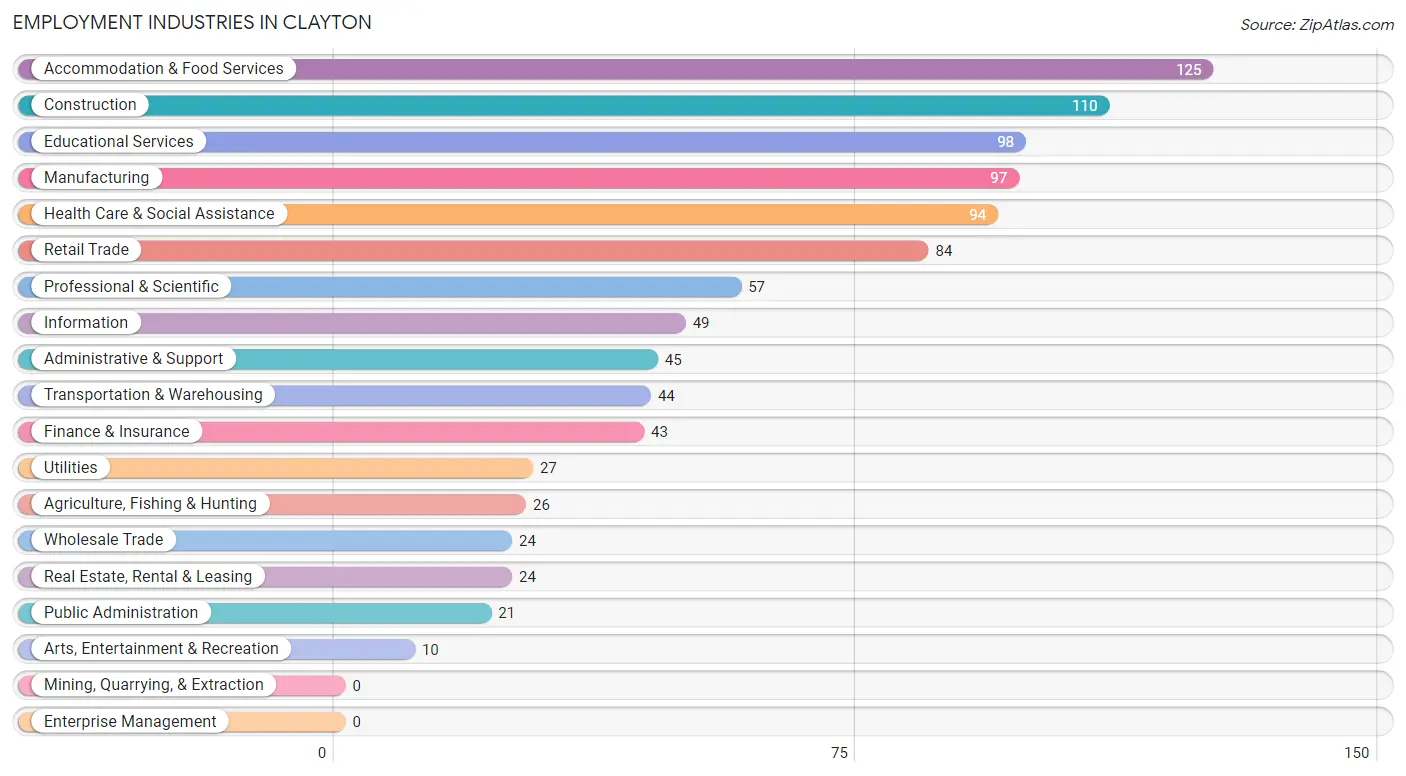
Employment Industries in Clayton
The major employment industries in Clayton include Accommodation & Food Services (125 | 12.4%), Construction (110 | 10.9%), Educational Services (98 | 9.7%), Manufacturing (97 | 9.6%), and Health Care & Social Assistance (94 | 9.3%).
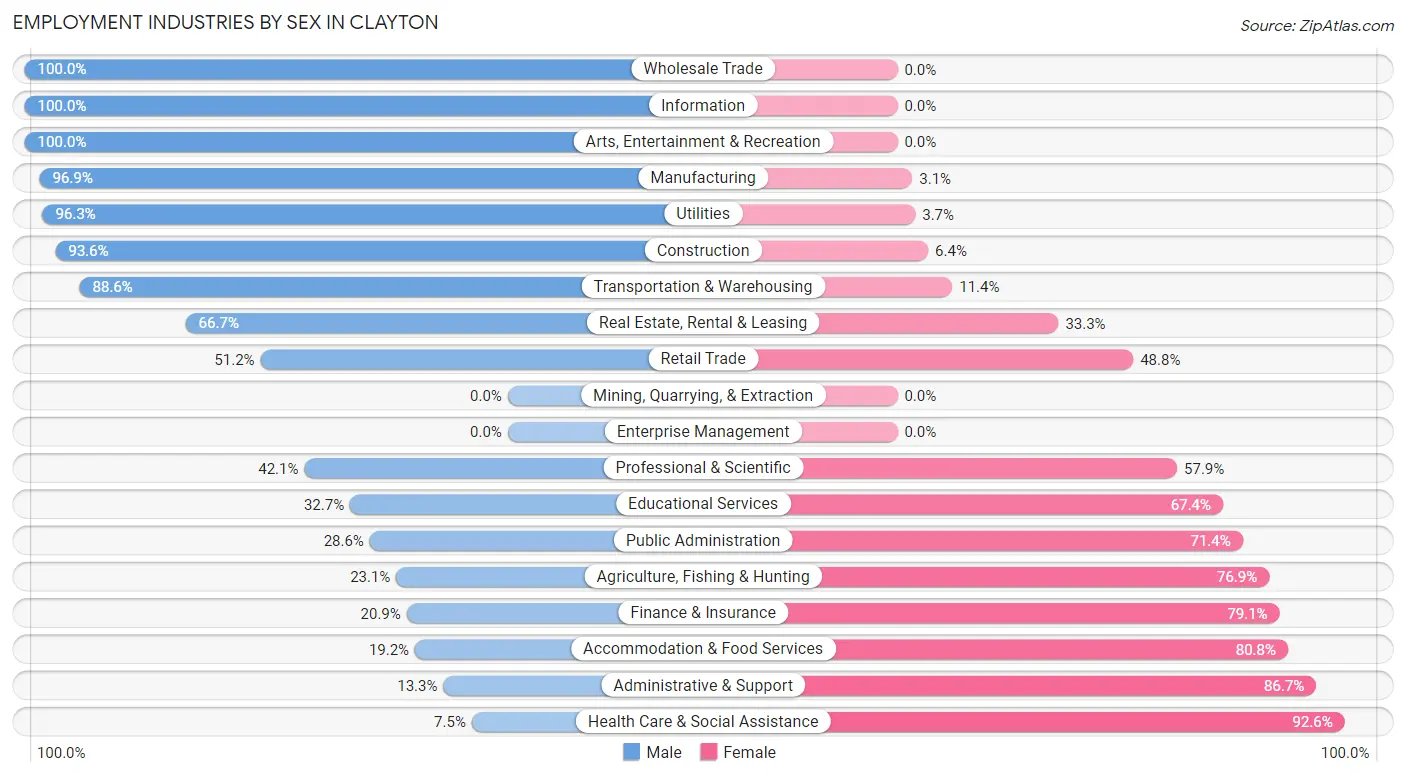
Employment Industries by Sex in Clayton
The Clayton industries that see more men than women are Wholesale Trade (100.0%), Information (100.0%), and Arts, Entertainment & Recreation (100.0%), whereas the industries that tend to have a higher number of women are Health Care & Social Assistance (92.5%), Administrative & Support (86.7%), and Accommodation & Food Services (80.8%).
| Industry | Male | Female |
| Agriculture, Fishing & Hunting | 6 (23.1%) | 20 (76.9%) |
| Mining, Quarrying, & Extraction | 0 (0.0%) | 0 (0.0%) |
| Construction | 103 (93.6%) | 7 (6.4%) |
| Manufacturing | 94 (96.9%) | 3 (3.1%) |
| Wholesale Trade | 24 (100.0%) | 0 (0.0%) |
| Retail Trade | 43 (51.2%) | 41 (48.8%) |
| Transportation & Warehousing | 39 (88.6%) | 5 (11.4%) |
| Utilities | 26 (96.3%) | 1 (3.7%) |
| Information | 49 (100.0%) | 0 (0.0%) |
| Finance & Insurance | 9 (20.9%) | 34 (79.1%) |
| Real Estate, Rental & Leasing | 16 (66.7%) | 8 (33.3%) |
| Professional & Scientific | 24 (42.1%) | 33 (57.9%) |
| Enterprise Management | 0 (0.0%) | 0 (0.0%) |
| Administrative & Support | 6 (13.3%) | 39 (86.7%) |
| Educational Services | 32 (32.7%) | 66 (67.3%) |
| Health Care & Social Assistance | 7 (7.4%) | 87 (92.5%) |
| Arts, Entertainment & Recreation | 10 (100.0%) | 0 (0.0%) |
| Accommodation & Food Services | 24 (19.2%) | 101 (80.8%) |
| Public Administration | 6 (28.6%) | 15 (71.4%) |
| Total | 535 (53.0%) | 475 (47.0%) |
Education in Clayton
School Enrollment in Clayton
The most common levels of schooling among the 321 students in Clayton are elementary school (93 | 29.0%), college / undergraduate (84 | 26.2%), and middle school (59 | 18.4%).
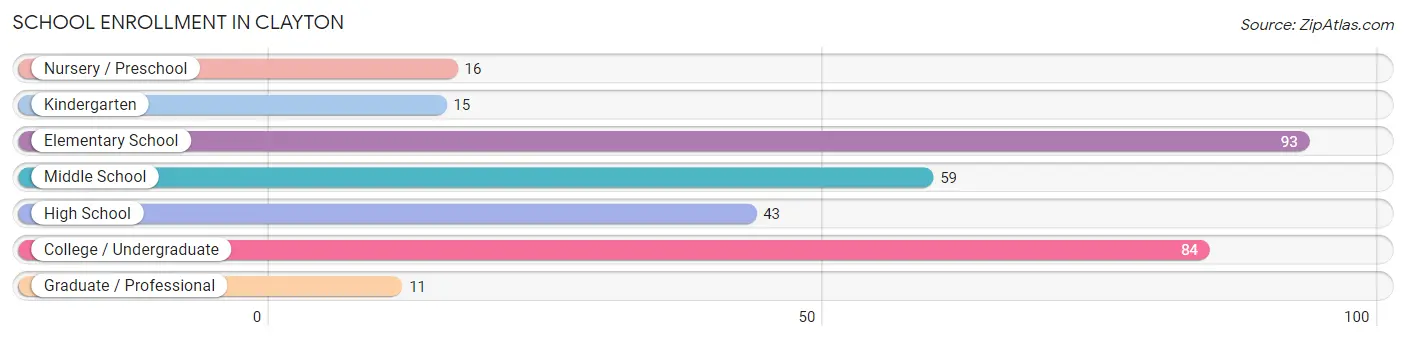
| School Level | # Students | % Students |
| Nursery / Preschool | 16 | 5.0% |
| Kindergarten | 15 | 4.7% |
| Elementary School | 93 | 29.0% |
| Middle School | 59 | 18.4% |
| High School | 43 | 13.4% |
| College / Undergraduate | 84 | 26.2% |
| Graduate / Professional | 11 | 3.4% |
| Total | 321 | 100.0% |
School Enrollment by Age by Funding Source in Clayton
Out of a total of 321 students who are enrolled in schools in Clayton, 21 (6.5%) attend a private institution, while the remaining 300 (93.5%) are enrolled in public schools. The age group of 25 to 34 year olds has the highest likelihood of being enrolled in private schools, with 11 (100.0% in the age bracket) enrolled. Conversely, the age group of 3 to 4 year olds has the lowest likelihood of being enrolled in a private school, with 16 (100.0% in the age bracket) attending a public institution.
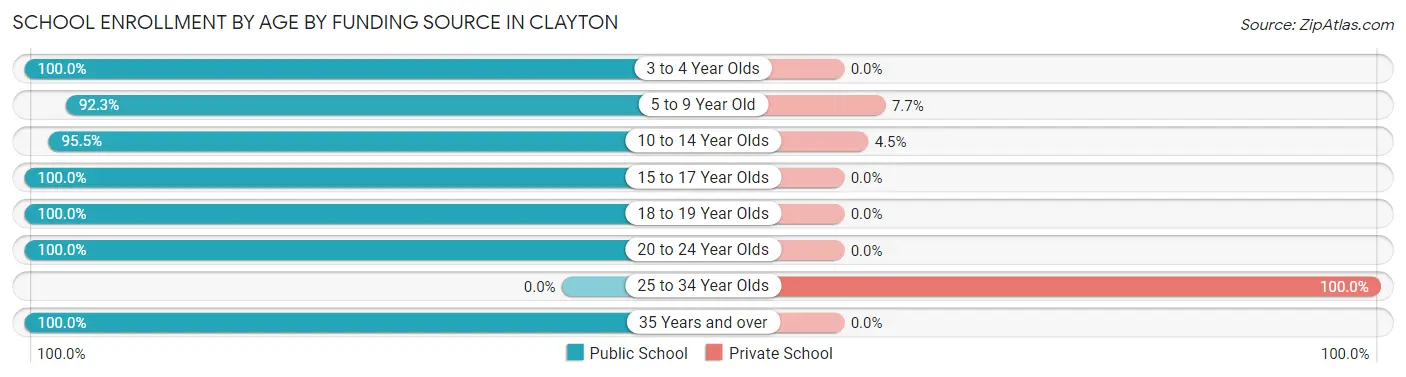
| Age Bracket | Public School | Private School |
| 3 to 4 Year Olds | 16 (100.0%) | 0 (0.0%) |
| 5 to 9 Year Old | 72 (92.3%) | 6 (7.7%) |
| 10 to 14 Year Olds | 85 (95.5%) | 4 (4.5%) |
| 15 to 17 Year Olds | 27 (100.0%) | 0 (0.0%) |
| 18 to 19 Year Olds | 33 (100.0%) | 0 (0.0%) |
| 20 to 24 Year Olds | 65 (100.0%) | 0 (0.0%) |
| 25 to 34 Year Olds | 0 (0.0%) | 11 (100.0%) |
| 35 Years and over | 2 (100.0%) | 0 (0.0%) |
| Total | 300 (93.5%) | 21 (6.5%) |
Educational Attainment by Field of Study in Clayton
Business (77 | 19.9%), education (51 | 13.1%), science & technology (44 | 11.3%), liberal arts & history (40 | 10.3%), and psychology (36 | 9.3%) are the most common fields of study among 388 individuals in Clayton who have obtained a bachelor's degree or higher.
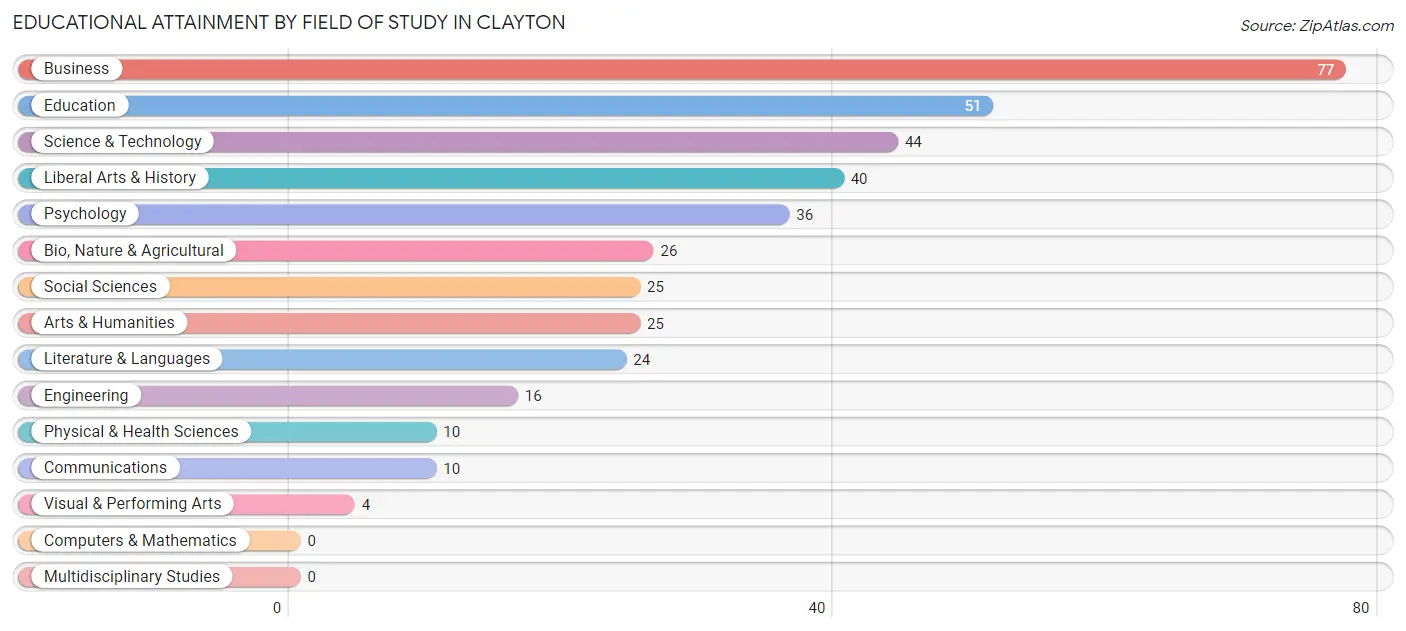
| Field of Study | # Graduates | % Graduates |
| Computers & Mathematics | 0 | 0.0% |
| Bio, Nature & Agricultural | 26 | 6.7% |
| Physical & Health Sciences | 10 | 2.6% |
| Psychology | 36 | 9.3% |
| Social Sciences | 25 | 6.4% |
| Engineering | 16 | 4.1% |
| Multidisciplinary Studies | 0 | 0.0% |
| Science & Technology | 44 | 11.3% |
| Business | 77 | 19.9% |
| Education | 51 | 13.1% |
| Literature & Languages | 24 | 6.2% |
| Liberal Arts & History | 40 | 10.3% |
| Visual & Performing Arts | 4 | 1.0% |
| Communications | 10 | 2.6% |
| Arts & Humanities | 25 | 6.4% |
| Total | 388 | 100.0% |
Transportation & Commute in Clayton
Vehicle Availability by Sex in Clayton
The most prevalent vehicle ownership categories in Clayton are males with 3 vehicles (244, accounting for 45.6%) and females with 3 vehicles (135, making up 51.4%).
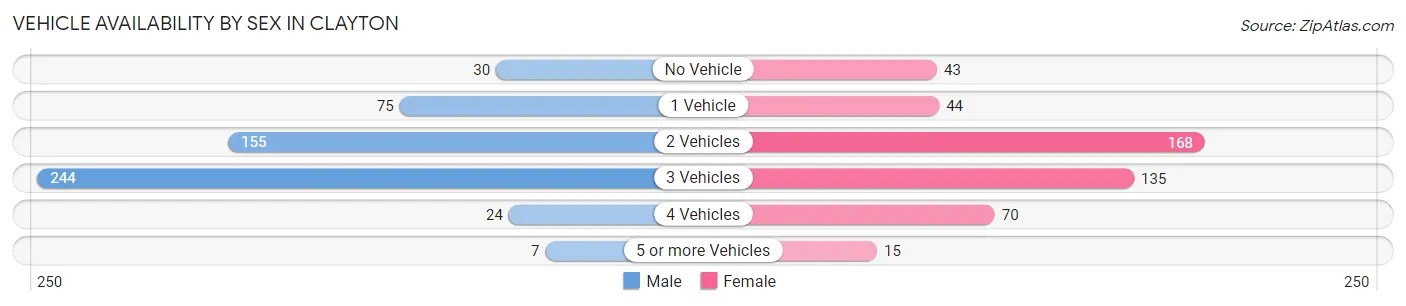
| Vehicles Available | Male | Female |
| No Vehicle | 30 (5.6%) | 43 (9.0%) |
| 1 Vehicle | 75 (14.0%) | 44 (9.3%) |
| 2 Vehicles | 155 (29.0%) | 168 (35.4%) |
| 3 Vehicles | 244 (45.6%) | 135 (28.4%) |
| 4 Vehicles | 24 (4.5%) | 70 (14.7%) |
| 5 or more Vehicles | 7 (1.3%) | 15 (3.2%) |
| Total | 535 (100.0%) | 475 (100.0%) |
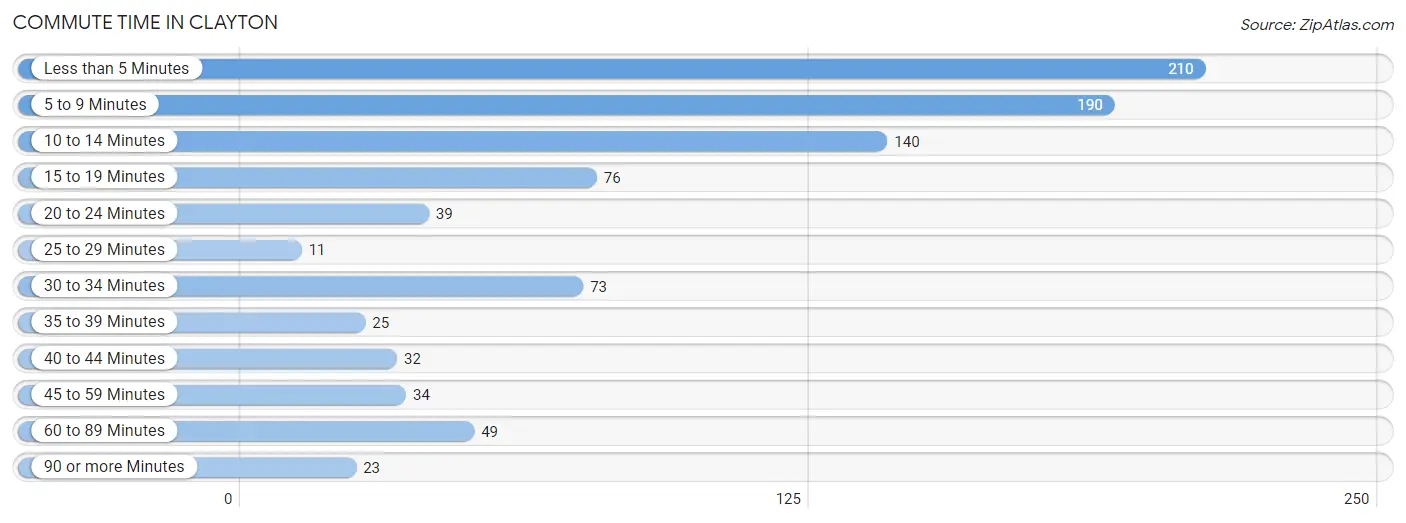
Commute Time in Clayton
The most frequently occuring commute durations in Clayton are less than 5 minutes (210 commuters, 23.3%), 5 to 9 minutes (190 commuters, 21.1%), and 10 to 14 minutes (140 commuters, 15.5%).
| Commute Time | # Commuters | % Commuters |
| Less than 5 Minutes | 210 | 23.3% |
| 5 to 9 Minutes | 190 | 21.1% |
| 10 to 14 Minutes | 140 | 15.5% |
| 15 to 19 Minutes | 76 | 8.4% |
| 20 to 24 Minutes | 39 | 4.3% |
| 25 to 29 Minutes | 11 | 1.2% |
| 30 to 34 Minutes | 73 | 8.1% |
| 35 to 39 Minutes | 25 | 2.8% |
| 40 to 44 Minutes | 32 | 3.5% |
| 45 to 59 Minutes | 34 | 3.8% |
| 60 to 89 Minutes | 49 | 5.4% |
| 90 or more Minutes | 23 | 2.5% |
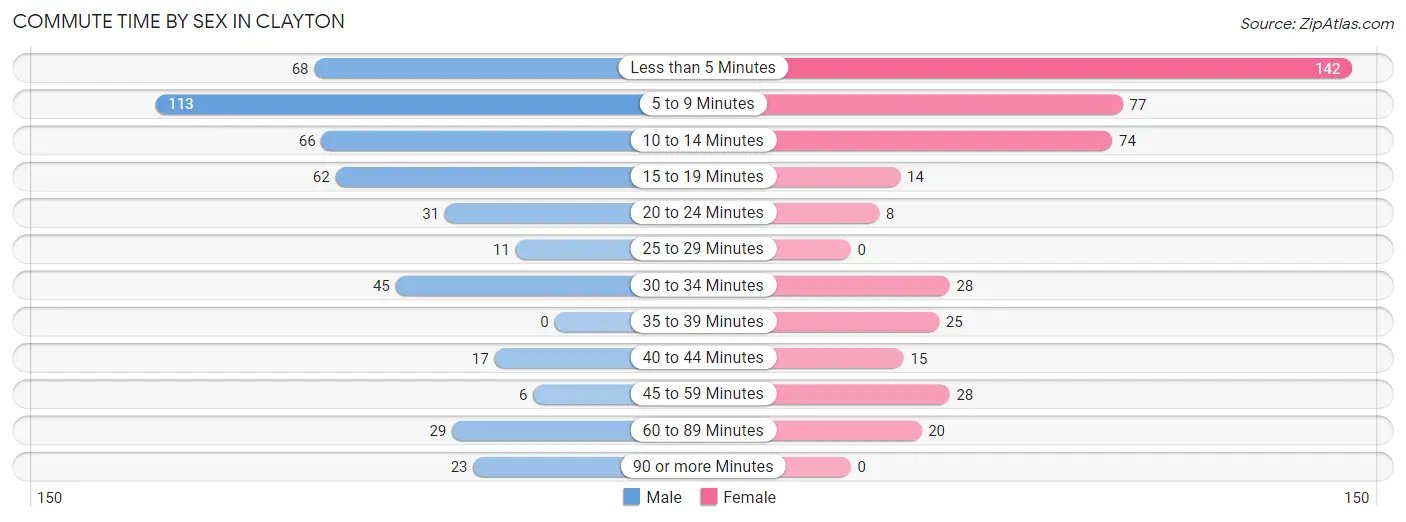
Commute Time by Sex in Clayton
The most common commute times in Clayton are 5 to 9 minutes (113 commuters, 24.0%) for males and less than 5 minutes (142 commuters, 33.0%) for females.
| Commute Time | Male | Female |
| Less than 5 Minutes | 68 (14.4%) | 142 (33.0%) |
| 5 to 9 Minutes | 113 (24.0%) | 77 (17.9%) |
| 10 to 14 Minutes | 66 (14.0%) | 74 (17.2%) |
| 15 to 19 Minutes | 62 (13.2%) | 14 (3.3%) |
| 20 to 24 Minutes | 31 (6.6%) | 8 (1.9%) |
| 25 to 29 Minutes | 11 (2.3%) | 0 (0.0%) |
| 30 to 34 Minutes | 45 (9.6%) | 28 (6.5%) |
| 35 to 39 Minutes | 0 (0.0%) | 25 (5.8%) |
| 40 to 44 Minutes | 17 (3.6%) | 15 (3.5%) |
| 45 to 59 Minutes | 6 (1.3%) | 28 (6.5%) |
| 60 to 89 Minutes | 29 (6.2%) | 20 (4.6%) |
| 90 or more Minutes | 23 (4.9%) | 0 (0.0%) |
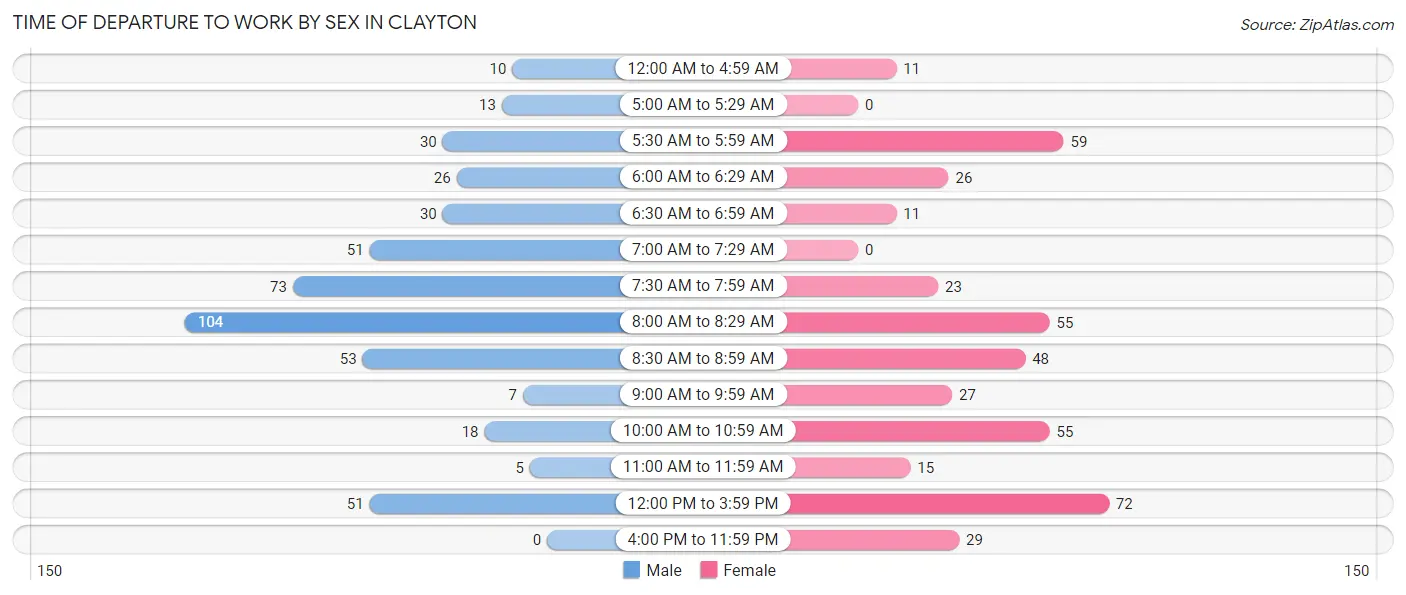
Time of Departure to Work by Sex in Clayton
The most frequent times of departure to work in Clayton are 8:00 AM to 8:29 AM (104, 22.1%) for males and 12:00 PM to 3:59 PM (72, 16.7%) for females.
| Time of Departure | Male | Female |
| 12:00 AM to 4:59 AM | 10 (2.1%) | 11 (2.5%) |
| 5:00 AM to 5:29 AM | 13 (2.8%) | 0 (0.0%) |
| 5:30 AM to 5:59 AM | 30 (6.4%) | 59 (13.7%) |
| 6:00 AM to 6:29 AM | 26 (5.5%) | 26 (6.0%) |
| 6:30 AM to 6:59 AM | 30 (6.4%) | 11 (2.5%) |
| 7:00 AM to 7:29 AM | 51 (10.8%) | 0 (0.0%) |
| 7:30 AM to 7:59 AM | 73 (15.5%) | 23 (5.3%) |
| 8:00 AM to 8:29 AM | 104 (22.1%) | 55 (12.8%) |
| 8:30 AM to 8:59 AM | 53 (11.3%) | 48 (11.1%) |
| 9:00 AM to 9:59 AM | 7 (1.5%) | 27 (6.3%) |
| 10:00 AM to 10:59 AM | 18 (3.8%) | 55 (12.8%) |
| 11:00 AM to 11:59 AM | 5 (1.1%) | 15 (3.5%) |
| 12:00 PM to 3:59 PM | 51 (10.8%) | 72 (16.7%) |
| 4:00 PM to 11:59 PM | 0 (0.0%) | 29 (6.7%) |
| Total | 471 (100.0%) | 431 (100.0%) |
Housing Occupancy in Clayton
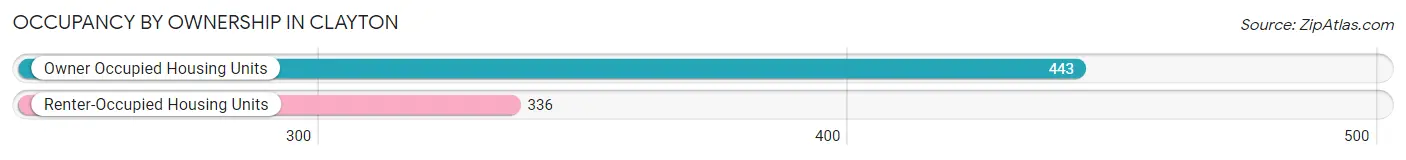
Occupancy by Ownership in Clayton
Of the total 779 dwellings in Clayton, owner-occupied units account for 443 (56.9%), while renter-occupied units make up 336 (43.1%).
| Occupancy | # Housing Units | % Housing Units |
| Owner Occupied Housing Units | 443 | 56.9% |
| Renter-Occupied Housing Units | 336 | 43.1% |
| Total Occupied Housing Units | 779 | 100.0% |
Occupancy by Household Size in Clayton
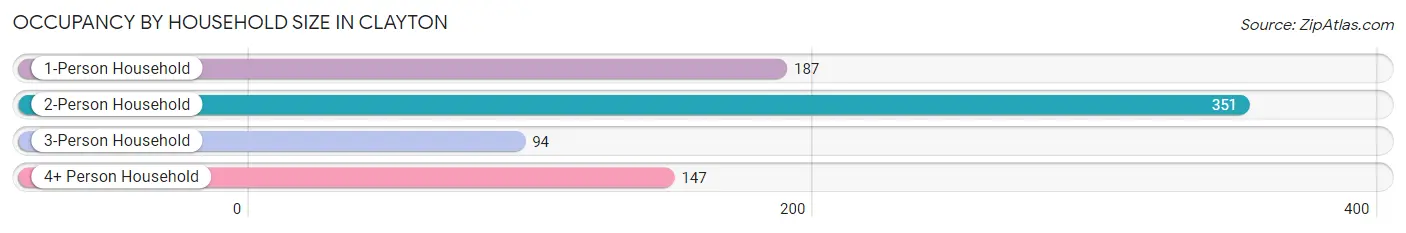
| Household Size | # Housing Units | % Housing Units |
| 1-Person Household | 187 | 24.0% |
| 2-Person Household | 351 | 45.1% |
| 3-Person Household | 94 | 12.1% |
| 4+ Person Household | 147 | 18.9% |
| Total Housing Units | 779 | 100.0% |
Occupancy by Ownership by Household Size in Clayton
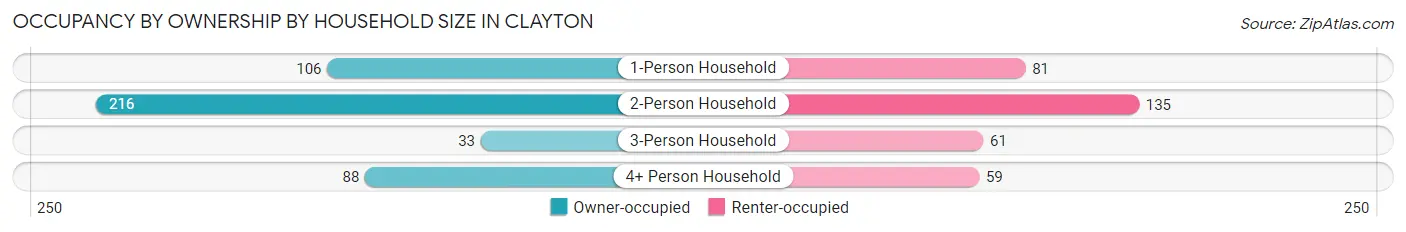
| Household Size | Owner-occupied | Renter-occupied |
| 1-Person Household | 106 (56.7%) | 81 (43.3%) |
| 2-Person Household | 216 (61.5%) | 135 (38.5%) |
| 3-Person Household | 33 (35.1%) | 61 (64.9%) |
| 4+ Person Household | 88 (59.9%) | 59 (40.1%) |
| Total Housing Units | 443 (56.9%) | 336 (43.1%) |
Occupancy by Educational Attainment in Clayton
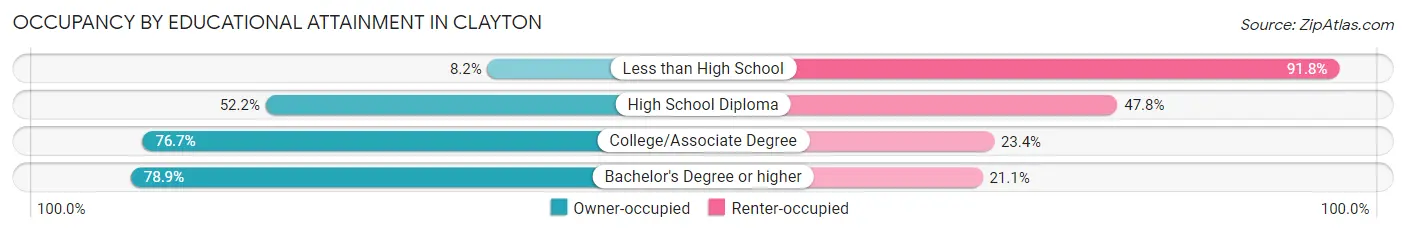
| Household Size | Owner-occupied | Renter-occupied |
| Less than High School | 11 (8.2%) | 123 (91.8%) |
| High School Diploma | 143 (52.2%) | 131 (47.8%) |
| College/Associate Degree | 128 (76.6%) | 39 (23.4%) |
| Bachelor's Degree or higher | 161 (78.9%) | 43 (21.1%) |
Occupancy by Age of Householder in Clayton
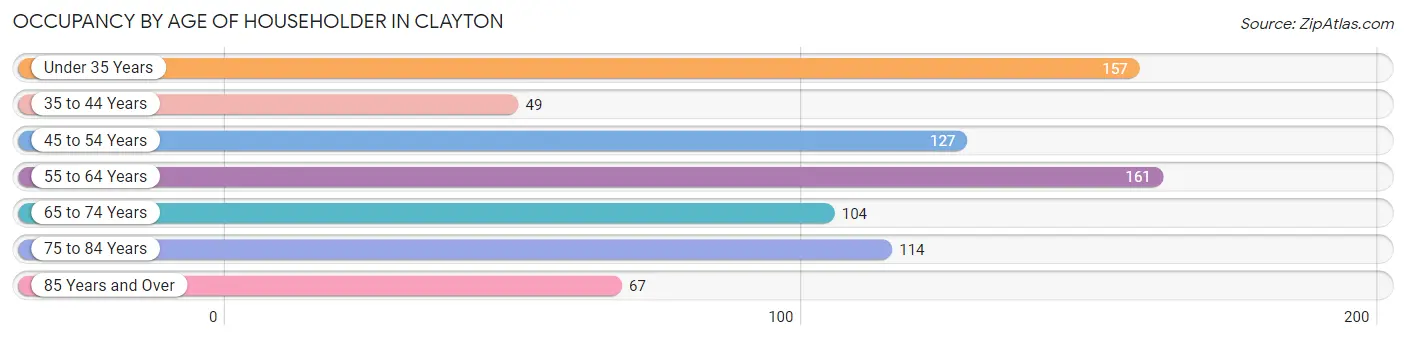
| Age Bracket | # Households | % Households |
| Under 35 Years | 157 | 20.2% |
| 35 to 44 Years | 49 | 6.3% |
| 45 to 54 Years | 127 | 16.3% |
| 55 to 64 Years | 161 | 20.7% |
| 65 to 74 Years | 104 | 13.4% |
| 75 to 84 Years | 114 | 14.6% |
| 85 Years and Over | 67 | 8.6% |
| Total | 779 | 100.0% |
Housing Finances in Clayton
Median Income by Occupancy in Clayton
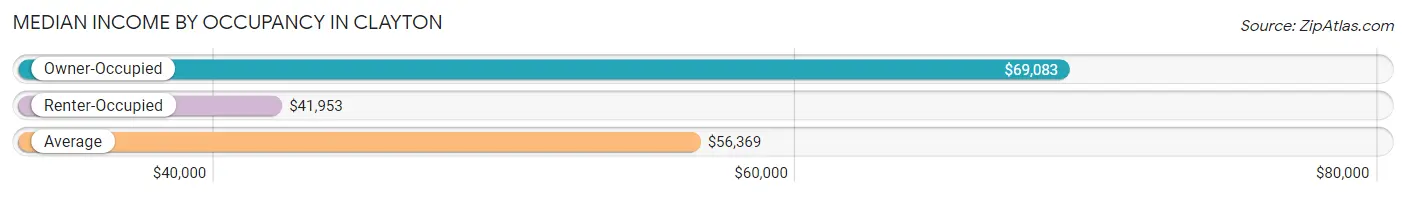
| Occupancy Type | # Households | Median Income |
| Owner-Occupied | 443 (56.9%) | $69,083 |
| Renter-Occupied | 336 (43.1%) | $41,953 |
| Average | 779 (100.0%) | $56,369 |
Occupancy by Householder Income Bracket in Clayton
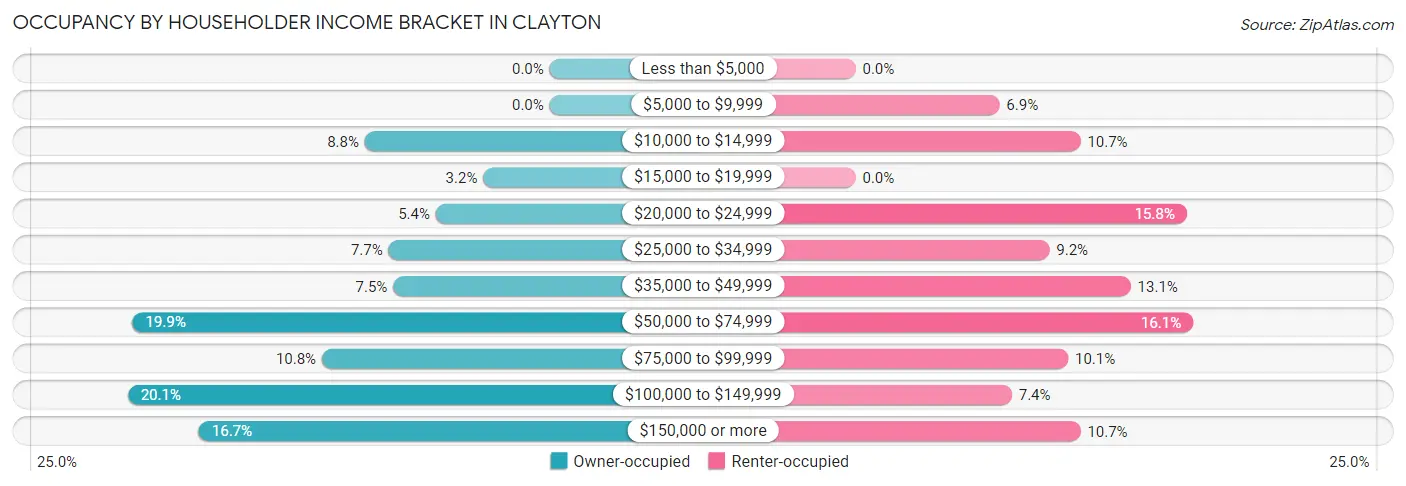
| Income Bracket | Owner-occupied | Renter-occupied |
| Less than $5,000 | 0 (0.0%) | 0 (0.0%) |
| $5,000 to $9,999 | 0 (0.0%) | 23 (6.9%) |
| $10,000 to $14,999 | 39 (8.8%) | 36 (10.7%) |
| $15,000 to $19,999 | 14 (3.2%) | 0 (0.0%) |
| $20,000 to $24,999 | 24 (5.4%) | 53 (15.8%) |
| $25,000 to $34,999 | 34 (7.7%) | 31 (9.2%) |
| $35,000 to $49,999 | 33 (7.4%) | 44 (13.1%) |
| $50,000 to $74,999 | 88 (19.9%) | 54 (16.1%) |
| $75,000 to $99,999 | 48 (10.8%) | 34 (10.1%) |
| $100,000 to $149,999 | 89 (20.1%) | 25 (7.4%) |
| $150,000 or more | 74 (16.7%) | 36 (10.7%) |
| Total | 443 (100.0%) | 336 (100.0%) |
Monthly Housing Cost Tiers in Clayton
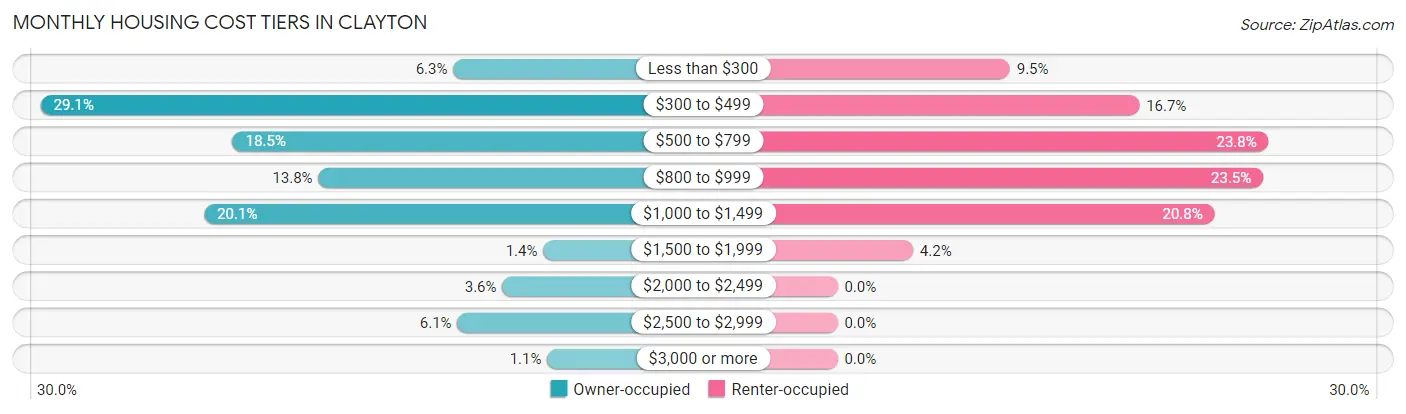
| Monthly Cost | Owner-occupied | Renter-occupied |
| Less than $300 | 28 (6.3%) | 32 (9.5%) |
| $300 to $499 | 129 (29.1%) | 56 (16.7%) |
| $500 to $799 | 82 (18.5%) | 80 (23.8%) |
| $800 to $999 | 61 (13.8%) | 79 (23.5%) |
| $1,000 to $1,499 | 89 (20.1%) | 70 (20.8%) |
| $1,500 to $1,999 | 6 (1.3%) | 14 (4.2%) |
| $2,000 to $2,499 | 16 (3.6%) | 0 (0.0%) |
| $2,500 to $2,999 | 27 (6.1%) | 0 (0.0%) |
| $3,000 or more | 5 (1.1%) | 0 (0.0%) |
| Total | 443 (100.0%) | 336 (100.0%) |
Physical Housing Characteristics in Clayton
Housing Structures in Clayton
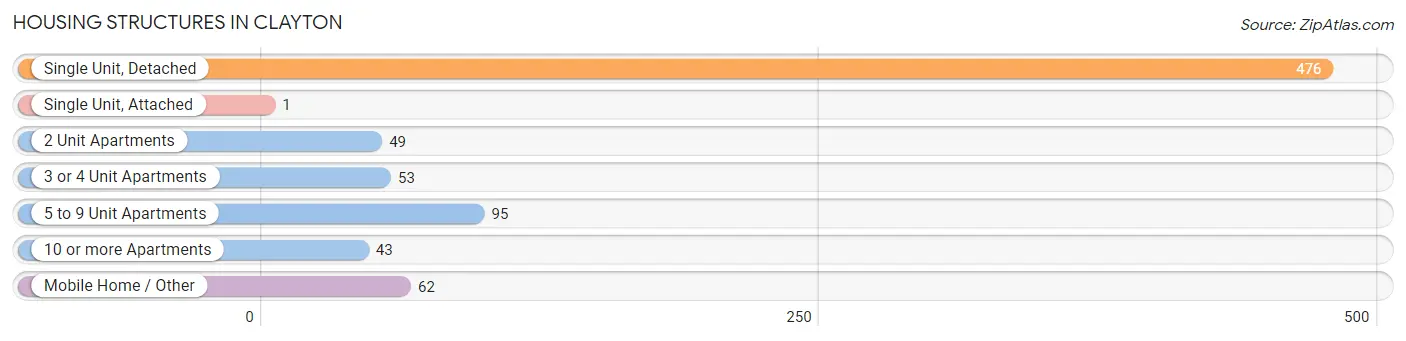
| Structure Type | # Housing Units | % Housing Units |
| Single Unit, Detached | 476 | 61.1% |
| Single Unit, Attached | 1 | 0.1% |
| 2 Unit Apartments | 49 | 6.3% |
| 3 or 4 Unit Apartments | 53 | 6.8% |
| 5 to 9 Unit Apartments | 95 | 12.2% |
| 10 or more Apartments | 43 | 5.5% |
| Mobile Home / Other | 62 | 8.0% |
| Total | 779 | 100.0% |
Housing Structures by Occupancy in Clayton
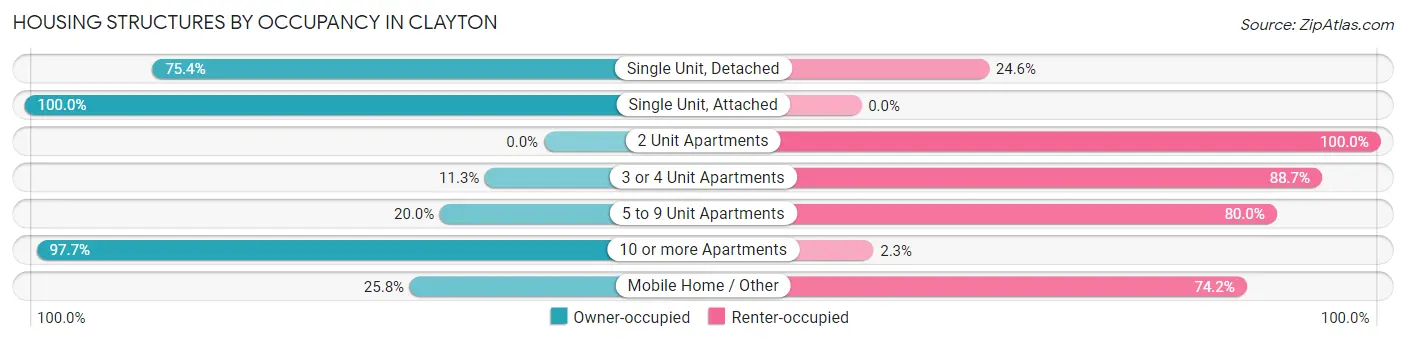
| Structure Type | Owner-occupied | Renter-occupied |
| Single Unit, Detached | 359 (75.4%) | 117 (24.6%) |
| Single Unit, Attached | 1 (100.0%) | 0 (0.0%) |
| 2 Unit Apartments | 0 (0.0%) | 49 (100.0%) |
| 3 or 4 Unit Apartments | 6 (11.3%) | 47 (88.7%) |
| 5 to 9 Unit Apartments | 19 (20.0%) | 76 (80.0%) |
| 10 or more Apartments | 42 (97.7%) | 1 (2.3%) |
| Mobile Home / Other | 16 (25.8%) | 46 (74.2%) |
| Total | 443 (56.9%) | 336 (43.1%) |
Housing Structures by Number of Rooms in Clayton
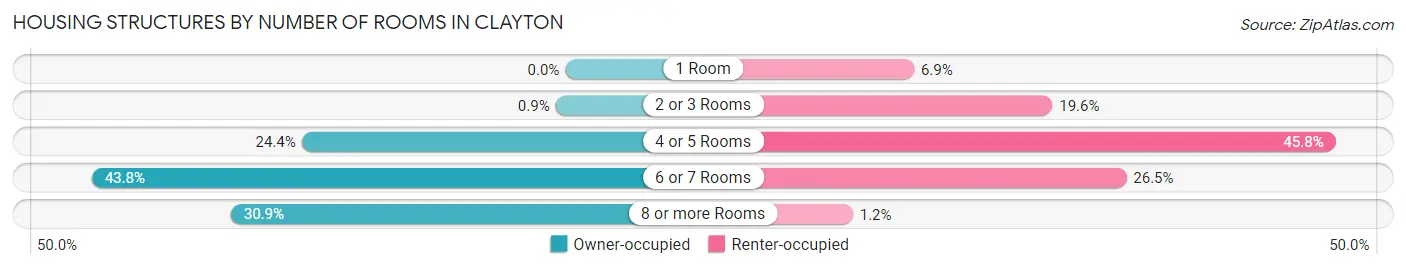
| Number of Rooms | Owner-occupied | Renter-occupied |
| 1 Room | 0 (0.0%) | 23 (6.9%) |
| 2 or 3 Rooms | 4 (0.9%) | 66 (19.6%) |
| 4 or 5 Rooms | 108 (24.4%) | 154 (45.8%) |
| 6 or 7 Rooms | 194 (43.8%) | 89 (26.5%) |
| 8 or more Rooms | 137 (30.9%) | 4 (1.2%) |
| Total | 443 (100.0%) | 336 (100.0%) |
Housing Structure by Heating Type in Clayton
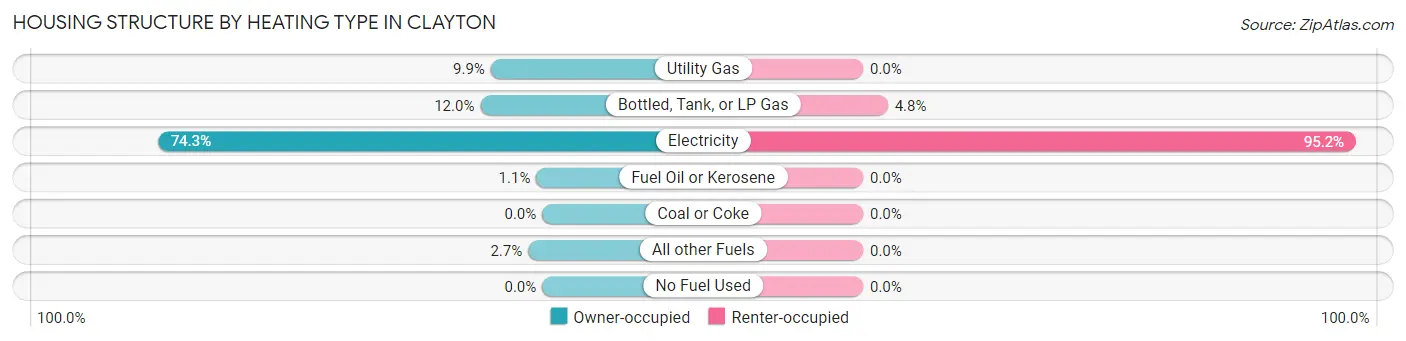
| Heating Type | Owner-occupied | Renter-occupied |
| Utility Gas | 44 (9.9%) | 0 (0.0%) |
| Bottled, Tank, or LP Gas | 53 (12.0%) | 16 (4.8%) |
| Electricity | 329 (74.3%) | 320 (95.2%) |
| Fuel Oil or Kerosene | 5 (1.1%) | 0 (0.0%) |
| Coal or Coke | 0 (0.0%) | 0 (0.0%) |
| All other Fuels | 12 (2.7%) | 0 (0.0%) |
| No Fuel Used | 0 (0.0%) | 0 (0.0%) |
| Total | 443 (100.0%) | 336 (100.0%) |
Household Vehicle Usage in Clayton
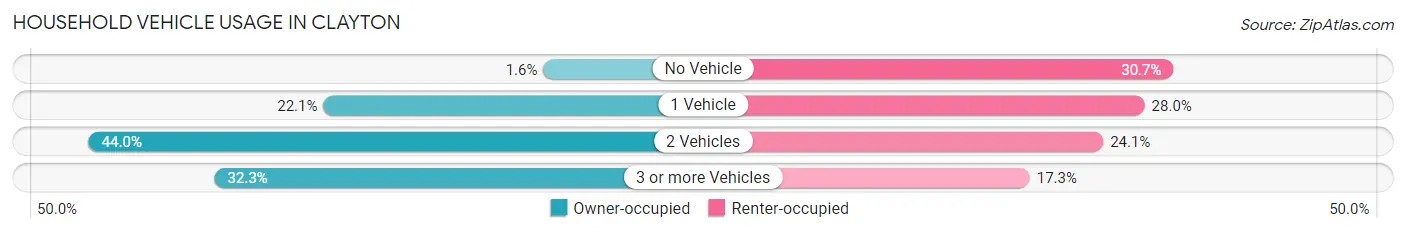
| Vehicles per Household | Owner-occupied | Renter-occupied |
| No Vehicle | 7 (1.6%) | 103 (30.6%) |
| 1 Vehicle | 98 (22.1%) | 94 (28.0%) |
| 2 Vehicles | 195 (44.0%) | 81 (24.1%) |
| 3 or more Vehicles | 143 (32.3%) | 58 (17.3%) |
| Total | 443 (100.0%) | 336 (100.0%) |
Real Estate & Mortgages in Clayton
Real Estate and Mortgage Overview in Clayton
| Characteristic | Without Mortgage | With Mortgage |
| Housing Units | 248 | 195 |
| Median Property Value | $187,500 | $200,800 |
| Median Household Income | $69,375 | $26 |
| Monthly Housing Costs | $406 | $5 |
| Real Estate Taxes | $929 | $5 |
Property Value by Mortgage Status in Clayton
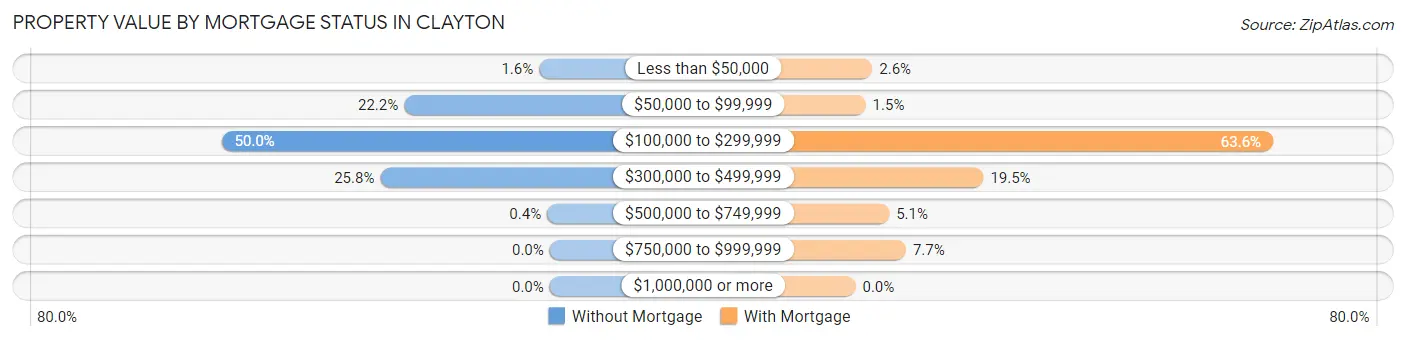
| Property Value | Without Mortgage | With Mortgage |
| Less than $50,000 | 4 (1.6%) | 5 (2.6%) |
| $50,000 to $99,999 | 55 (22.2%) | 3 (1.5%) |
| $100,000 to $299,999 | 124 (50.0%) | 124 (63.6%) |
| $300,000 to $499,999 | 64 (25.8%) | 38 (19.5%) |
| $500,000 to $749,999 | 1 (0.4%) | 10 (5.1%) |
| $750,000 to $999,999 | 0 (0.0%) | 15 (7.7%) |
| $1,000,000 or more | 0 (0.0%) | 0 (0.0%) |
| Total | 248 (100.0%) | 195 (100.0%) |
Household Income by Mortgage Status in Clayton
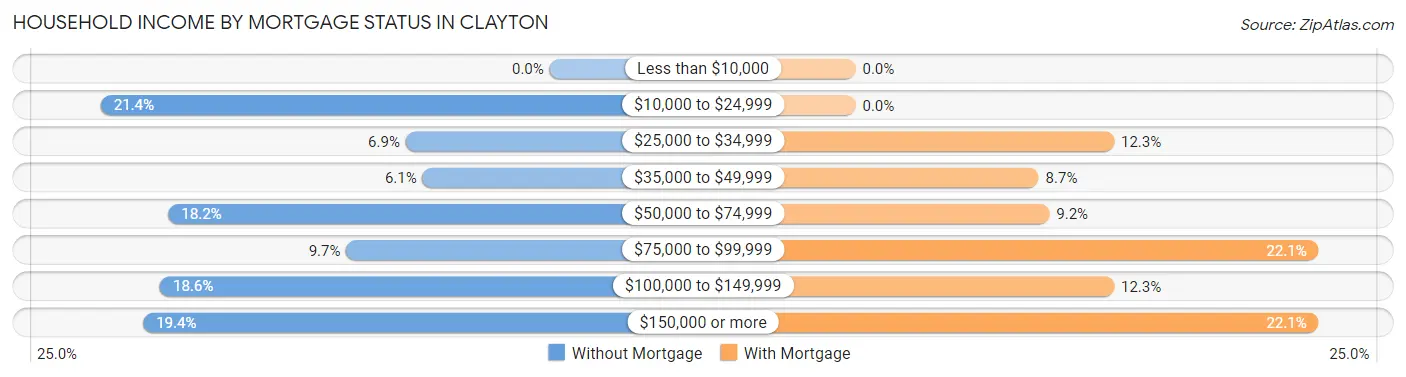
| Household Income | Without Mortgage | With Mortgage |
| Less than $10,000 | 0 (0.0%) | 0 (0.0%) |
| $10,000 to $24,999 | 53 (21.4%) | 0 (0.0%) |
| $25,000 to $34,999 | 17 (6.9%) | 24 (12.3%) |
| $35,000 to $49,999 | 15 (6.0%) | 17 (8.7%) |
| $50,000 to $74,999 | 45 (18.1%) | 18 (9.2%) |
| $75,000 to $99,999 | 24 (9.7%) | 43 (22.1%) |
| $100,000 to $149,999 | 46 (18.5%) | 24 (12.3%) |
| $150,000 or more | 48 (19.4%) | 43 (22.1%) |
| Total | 248 (100.0%) | 195 (100.0%) |
Property Value to Household Income Ratio in Clayton
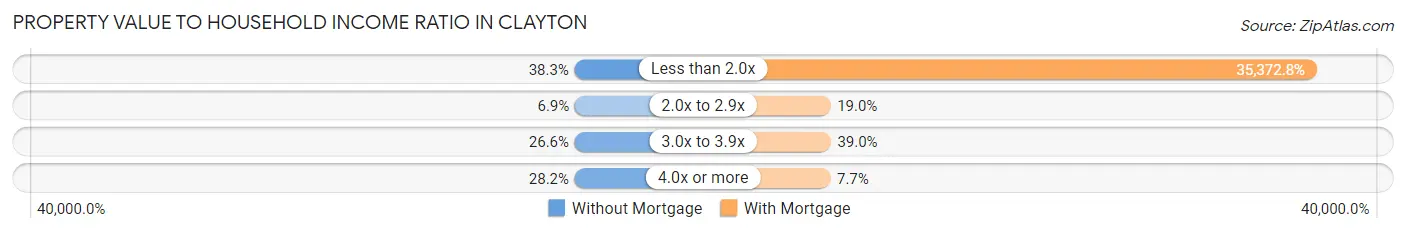
| Value-to-Income Ratio | Without Mortgage | With Mortgage |
| Less than 2.0x | 95 (38.3%) | 68,977 (35,372.8%) |
| 2.0x to 2.9x | 17 (6.9%) | 37 (19.0%) |
| 3.0x to 3.9x | 66 (26.6%) | 76 (39.0%) |
| 4.0x or more | 70 (28.2%) | 15 (7.7%) |
| Total | 248 (100.0%) | 195 (100.0%) |
Real Estate Taxes by Mortgage Status in Clayton
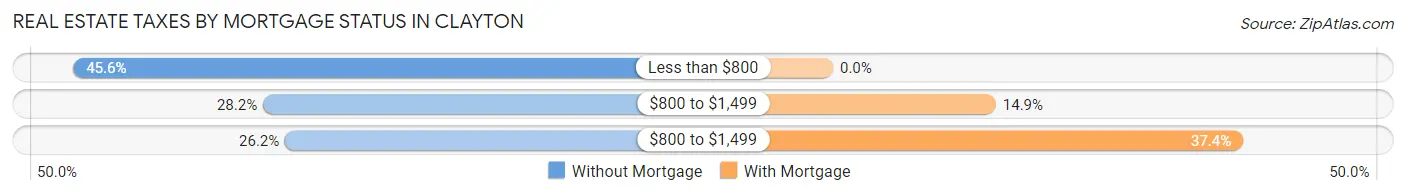
| Property Taxes | Without Mortgage | With Mortgage |
| Less than $800 | 113 (45.6%) | 0 (0.0%) |
| $800 to $1,499 | 70 (28.2%) | 29 (14.9%) |
| $800 to $1,499 | 65 (26.2%) | 73 (37.4%) |
| Total | 248 (100.0%) | 195 (100.0%) |
Health & Disability in Clayton
Health Insurance Coverage by Age in Clayton
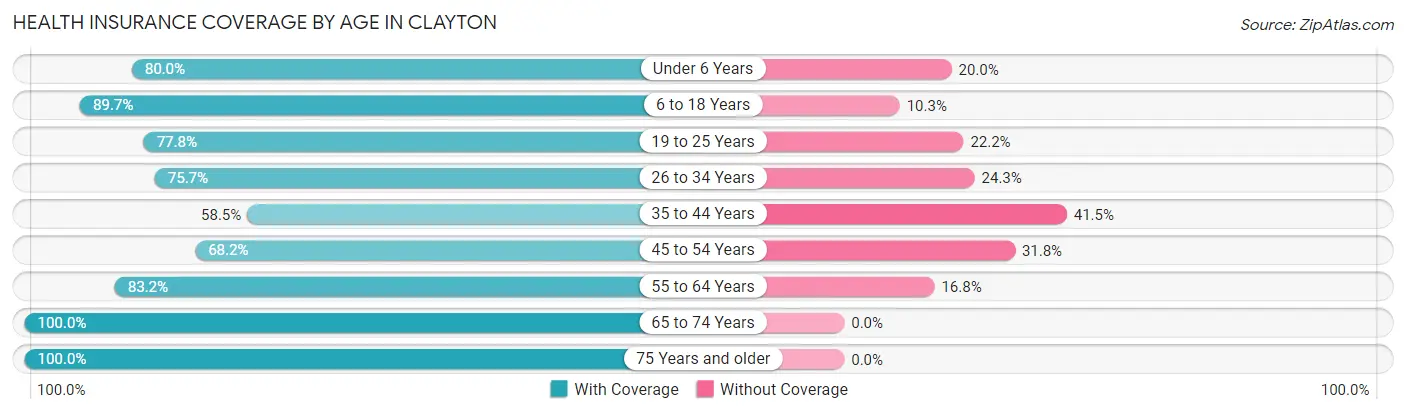
| Age Bracket | With Coverage | Without Coverage |
| Under 6 Years | 104 (80.0%) | 26 (20.0%) |
| 6 to 18 Years | 208 (89.7%) | 24 (10.3%) |
| 19 to 25 Years | 217 (77.8%) | 62 (22.2%) |
| 26 to 34 Years | 271 (75.7%) | 87 (24.3%) |
| 35 to 44 Years | 141 (58.5%) | 100 (41.5%) |
| 45 to 54 Years | 135 (68.2%) | 63 (31.8%) |
| 55 to 64 Years | 272 (83.2%) | 55 (16.8%) |
| 65 to 74 Years | 149 (100.0%) | 0 (0.0%) |
| 75 Years and older | 294 (100.0%) | 0 (0.0%) |
| Total | 1,791 (81.1%) | 417 (18.9%) |
Health Insurance Coverage by Citizenship Status in Clayton
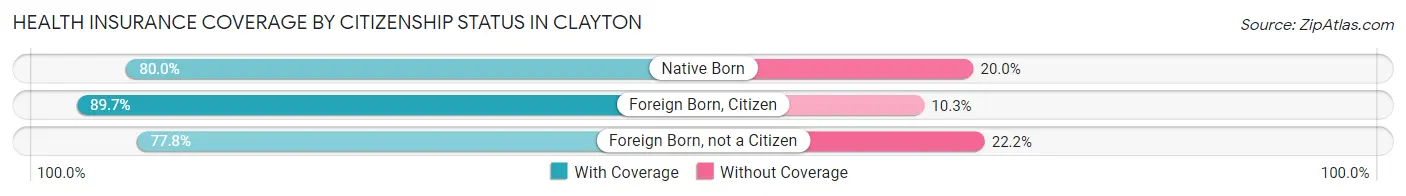
| Citizenship Status | With Coverage | Without Coverage |
| Native Born | 104 (80.0%) | 26 (20.0%) |
| Foreign Born, Citizen | 208 (89.7%) | 24 (10.3%) |
| Foreign Born, not a Citizen | 217 (77.8%) | 62 (22.2%) |
Health Insurance Coverage by Household Income in Clayton
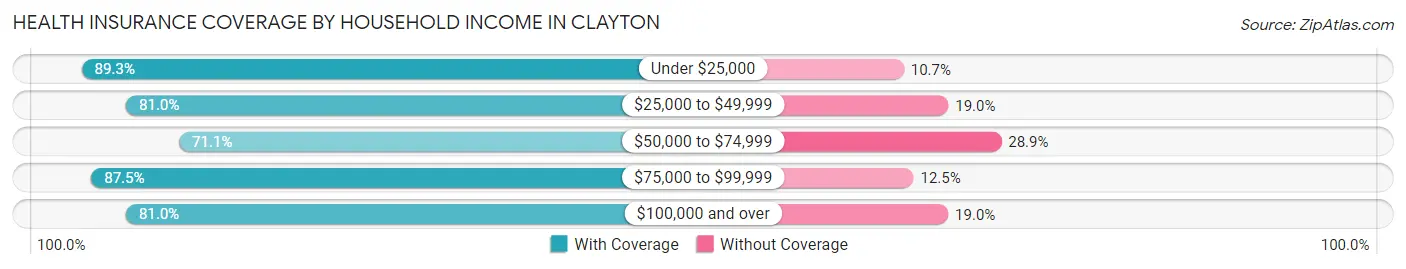
| Household Income | With Coverage | Without Coverage |
| Under $25,000 | 326 (89.3%) | 39 (10.7%) |
| $25,000 to $49,999 | 281 (81.0%) | 66 (19.0%) |
| $50,000 to $74,999 | 329 (71.1%) | 134 (28.9%) |
| $75,000 to $99,999 | 245 (87.5%) | 35 (12.5%) |
| $100,000 and over | 610 (81.0%) | 143 (19.0%) |
Public vs Private Health Insurance Coverage by Age in Clayton
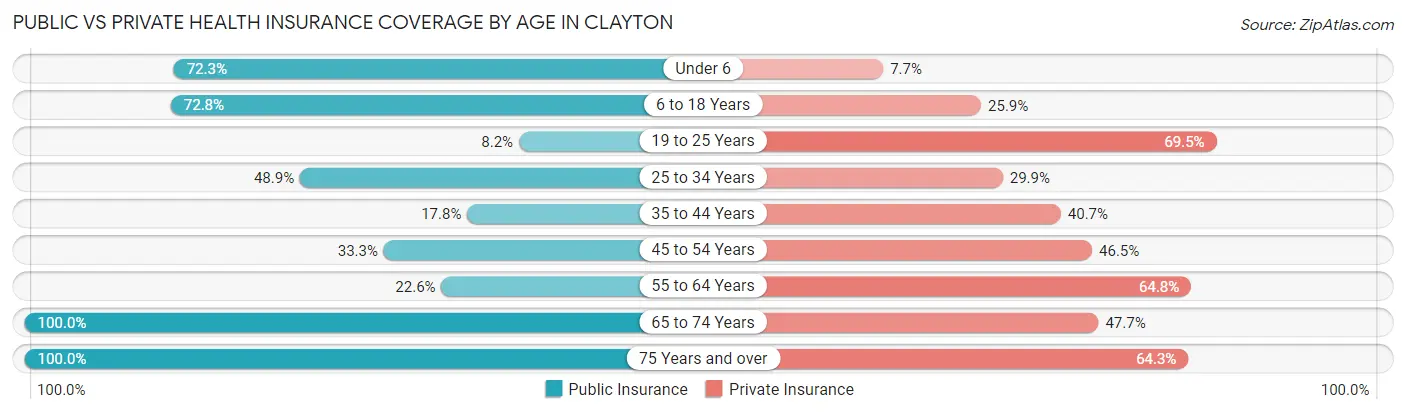
| Age Bracket | Public Insurance | Private Insurance |
| Under 6 | 94 (72.3%) | 10 (7.7%) |
| 6 to 18 Years | 169 (72.8%) | 60 (25.9%) |
| 19 to 25 Years | 23 (8.2%) | 194 (69.5%) |
| 25 to 34 Years | 175 (48.9%) | 107 (29.9%) |
| 35 to 44 Years | 43 (17.8%) | 98 (40.7%) |
| 45 to 54 Years | 66 (33.3%) | 92 (46.5%) |
| 55 to 64 Years | 74 (22.6%) | 212 (64.8%) |
| 65 to 74 Years | 149 (100.0%) | 71 (47.6%) |
| 75 Years and over | 294 (100.0%) | 189 (64.3%) |
| Total | 1,087 (49.2%) | 1,033 (46.8%) |
Disability Status by Sex by Age in Clayton
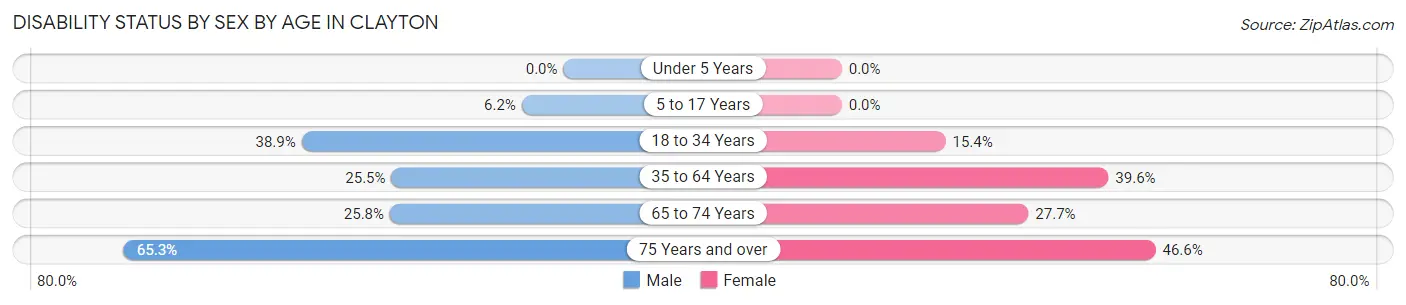
| Age Bracket | Male | Female |
| Under 5 Years | 0 (0.0%) | 0 (0.0%) |
| 5 to 17 Years | 6 (6.2%) | 0 (0.0%) |
| 18 to 34 Years | 159 (38.9%) | 41 (15.4%) |
| 35 to 64 Years | 95 (25.5%) | 156 (39.6%) |
| 65 to 74 Years | 17 (25.8%) | 23 (27.7%) |
| 75 Years and over | 77 (65.2%) | 82 (46.6%) |
Disability Class by Sex by Age in Clayton
Disability Class: Hearing Difficulty
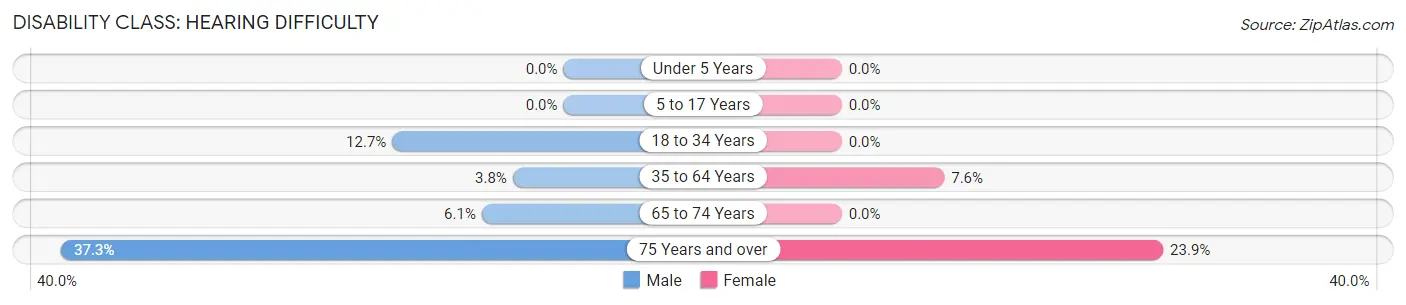
| Age Bracket | Male | Female |
| Under 5 Years | 0 (0.0%) | 0 (0.0%) |
| 5 to 17 Years | 0 (0.0%) | 0 (0.0%) |
| 18 to 34 Years | 52 (12.7%) | 0 (0.0%) |
| 35 to 64 Years | 14 (3.8%) | 30 (7.6%) |
| 65 to 74 Years | 4 (6.1%) | 0 (0.0%) |
| 75 Years and over | 44 (37.3%) | 42 (23.9%) |
Disability Class: Vision Difficulty
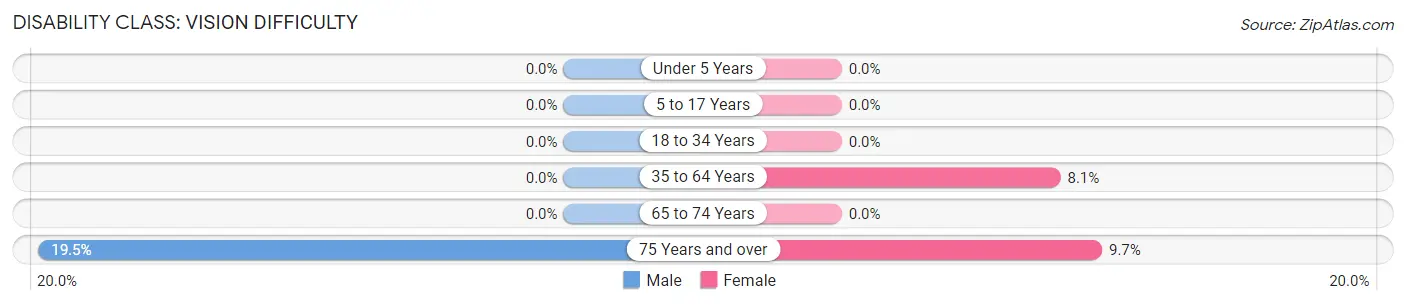
| Age Bracket | Male | Female |
| Under 5 Years | 0 (0.0%) | 0 (0.0%) |
| 5 to 17 Years | 0 (0.0%) | 0 (0.0%) |
| 18 to 34 Years | 0 (0.0%) | 0 (0.0%) |
| 35 to 64 Years | 0 (0.0%) | 32 (8.1%) |
| 65 to 74 Years | 0 (0.0%) | 0 (0.0%) |
| 75 Years and over | 23 (19.5%) | 17 (9.7%) |
Disability Class: Cognitive Difficulty
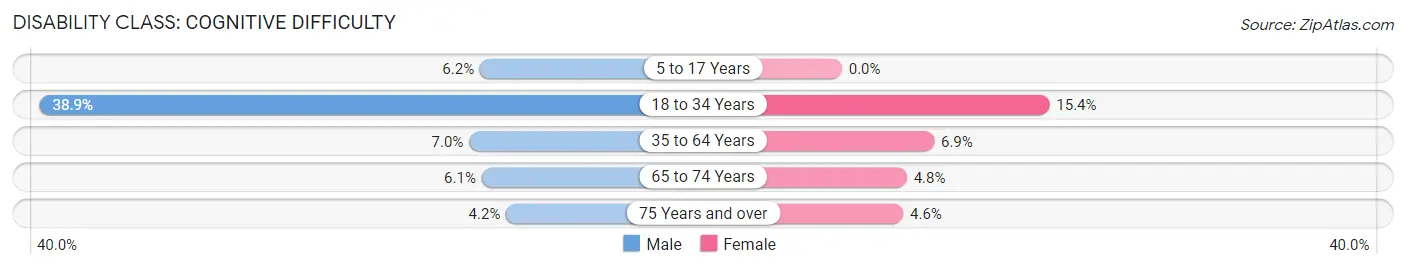
| Age Bracket | Male | Female |
| 5 to 17 Years | 6 (6.2%) | 0 (0.0%) |
| 18 to 34 Years | 159 (38.9%) | 41 (15.4%) |
| 35 to 64 Years | 26 (7.0%) | 27 (6.9%) |
| 65 to 74 Years | 4 (6.1%) | 4 (4.8%) |
| 75 Years and over | 5 (4.2%) | 8 (4.5%) |
Disability Class: Ambulatory Difficulty
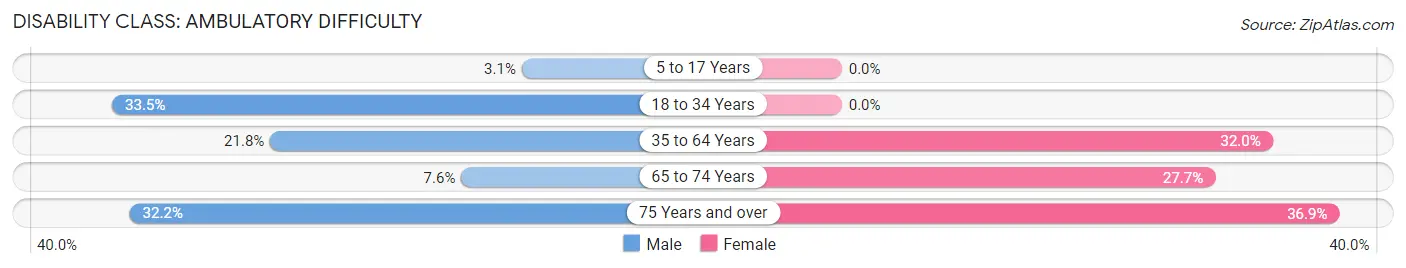
| Age Bracket | Male | Female |
| 5 to 17 Years | 3 (3.1%) | 0 (0.0%) |
| 18 to 34 Years | 137 (33.5%) | 0 (0.0%) |
| 35 to 64 Years | 81 (21.8%) | 126 (32.0%) |
| 65 to 74 Years | 5 (7.6%) | 23 (27.7%) |
| 75 Years and over | 38 (32.2%) | 65 (36.9%) |
Disability Class: Self-Care Difficulty
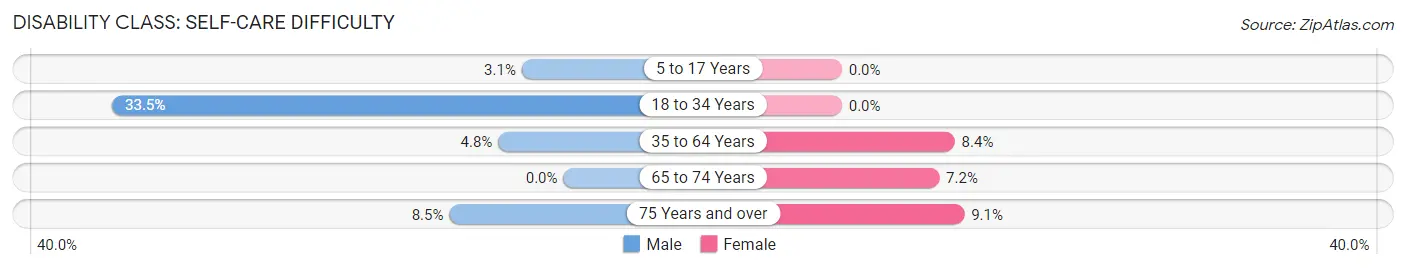
| Age Bracket | Male | Female |
| 5 to 17 Years | 3 (3.1%) | 0 (0.0%) |
| 18 to 34 Years | 137 (33.5%) | 0 (0.0%) |
| 35 to 64 Years | 18 (4.8%) | 33 (8.4%) |
| 65 to 74 Years | 0 (0.0%) | 6 (7.2%) |
| 75 Years and over | 10 (8.5%) | 16 (9.1%) |
Technology Access in Clayton
Computing Device Access in Clayton
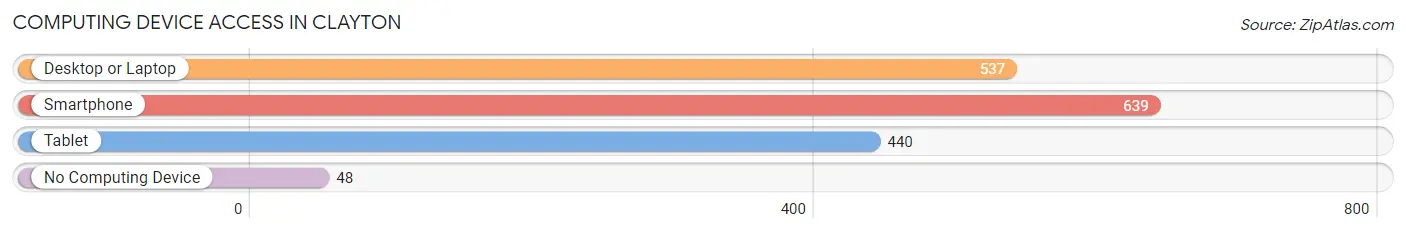
| Device Type | # Households | % Households |
| Desktop or Laptop | 537 | 68.9% |
| Smartphone | 639 | 82.0% |
| Tablet | 440 | 56.5% |
| No Computing Device | 48 | 6.2% |
| Total | 779 | 100.0% |
Internet Access in Clayton
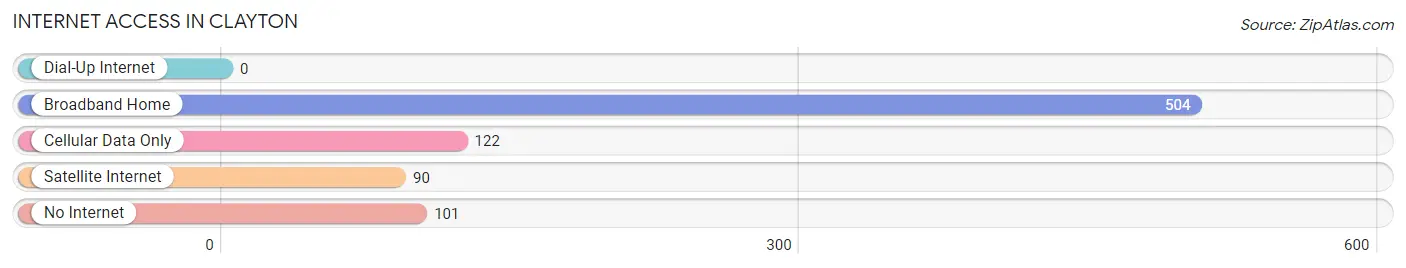
| Internet Type | # Households | % Households |
| Dial-Up Internet | 0 | 0.0% |
| Broadband Home | 504 | 64.7% |
| Cellular Data Only | 122 | 15.7% |
| Satellite Internet | 90 | 11.6% |
| No Internet | 101 | 13.0% |
| Total | 779 | 100.0% |
Clayton Summary
Clayton is a city located in Rabun County, Georgia, United States. The population was 2,019 at the 2010 census. It is the county seat of Rabun County. Clayton is located in the Blue Ridge Mountains, and is a popular tourist destination for its mountain scenery, outdoor activities, and nearby attractions.
History
Clayton was founded in 1821 as the seat of Rabun County. The city was named after Augustin Smith Clayton, a prominent lawyer and politician from Athens, Georgia. The city was incorporated in 1823.
In the late 19th century, Clayton was a popular summer resort for wealthy families from Atlanta and other cities in the South. The city was home to several large hotels, including the Rabun Hotel, which was built in 1887 and burned down in 1915.
In the early 20th century, Clayton was a popular destination for tourists, and the city was home to several large resorts, including the Rabun Hotel, which was built in 1887 and burned down in 1915.
Geography
Clayton is located at 34°53'25" North, 83°25'17" West (34.890278, -83.421389). The city is situated in the Blue Ridge Mountains, and is surrounded by the Chattahoochee National Forest. The city is located at the confluence of the Tallulah and Chattooga Rivers.
The city has a total area of 4 2 square miles all of which is land
Economy
The economy of Clayton is largely based on tourism. The city is home to several resorts, including the Lake Rabun Hotel and the Lake Burton Inn. The city is also home to several restaurants, shops, and other businesses catering to tourists.
The city is also home to several manufacturing companies, including a paper mill and a furniture factory.
Demographics
As of the 2010 census, there were 2,019 people, 845 households, and 545 families residing in the city. The population density was 478.2 people per square mile. There were 945 housing units at an average density of 225.7 per square mile. The racial makeup of the city was 92.2% White, 4.2% African American, 0.4% Native American, 0.7% Asian, 0.1% Pacific Islander, 1.2% from other races, and 1.2% from two or more races. Hispanic or Latino of any race were 3.2% of the population.
There were 845 households, out of which 24.3% had children under the age of 18 living with them, 48.2% were married couples living together, 11.7% had a female householder with no husband present, and 35.2% were non-families. 29.7% of all households were made up of individuals, and 12.2% had someone living alone who was 65 years of age or older. The average household size was 2.35 and the average family size was 2.88.
In the city, the population was spread out, with 21.7% under the age of 18, 8.2% from 18 to 24, 24.2% from 25 to 44, 28.2% from 45 to 64, and 17.7% who were 65 years of age or older. The median age was 41 years. For every 100 females, there were 92.2 males. For every 100 females age 18 and over, there were 88.3 males.
The median income for a household in the city was $30,938, and the median income for a family was $37,500. Males had a median income of $27,500 versus $21,250 for females. The per capita income for the city was $17,845. About 11.2% of families and 14.2% of the population were below the poverty line, including 19.2% of those under age 18 and 11.2% of those age 65 or over.
Common Questions
What is Per Capita Income in Clayton?
Per Capita income in Clayton is $32,003.
What is the Median Family Income in Clayton?
Median Family Income in Clayton is $63,452.
What is the Median Household income in Clayton?
Median Household Income in Clayton is $56,369.
What is Income or Wage Gap in Clayton?
Income or Wage Gap in Clayton is 32.6%.
Women in Clayton earn 67.4 cents for every dollar earned by a man.
What is Inequality or Gini Index in Clayton?
Inequality or Gini Index in Clayton is 0.48.
What is the Total Population of Clayton?
Total Population of Clayton is 2,277.
What is the Total Male Population of Clayton?
Total Male Population of Clayton is 1,150.
What is the Total Female Population of Clayton?
Total Female Population of Clayton is 1,127.
What is the Ratio of Males per 100 Females in Clayton?
There are 102.04 Males per 100 Females in Clayton.
What is the Ratio of Females per 100 Males in Clayton?
There are 98.00 Females per 100 Males in Clayton.
What is the Median Population Age in Clayton?
Median Population Age in Clayton is 39.6 Years.
What is the Average Family Size in Clayton
Average Family Size in Clayton is 3.2 People.
What is the Average Household Size in Clayton
Average Household Size in Clayton is 2.8 People.
How Large is the Labor Force in Clayton?
There are 1,072 People in the Labor Forcein in Clayton.
What is the Percentage of People in the Labor Force in Clayton?
54.6% of People are in the Labor Force in Clayton.
What is the Unemployment Rate in Clayton?
Unemployment Rate in Clayton is 5.7%.