Clarkesville, GA Map & Demographics
Clarkesville Map
Clarkesville Overview
$28,858
PER CAPITA INCOME
$81,029
AVG FAMILY INCOME
$64,848
AVG HOUSEHOLD INCOME
32.1%
WAGE / INCOME GAP [ % ]
67.9¢/ $1
WAGE / INCOME GAP [ $ ]
0.40
INEQUALITY / GINI INDEX
1,885
TOTAL POPULATION
810
MALE POPULATION
1,075
FEMALE POPULATION
75.35
MALES / 100 FEMALES
132.72
FEMALES / 100 MALES
47.4
MEDIAN AGE
3.1
AVG FAMILY SIZE
2.3
AVG HOUSEHOLD SIZE
678
LABOR FORCE [ PEOPLE ]
44.6%
PERCENT IN LABOR FORCE
2.7%
UNEMPLOYMENT RATE
Clarkesville Zip Codes
Income in Clarkesville
Income Overview in Clarkesville
Per Capita Income in Clarkesville is $28,858, while median incomes of families and households are $81,029 and $64,848 respectively.
| Characteristic | Number | Measure |
| Per Capita Income | 1,885 | $28,858 |
| Median Family Income | 440 | $81,029 |
| Mean Family Income | 440 | $88,475 |
| Median Household Income | 775 | $64,848 |
| Mean Household Income | 775 | $69,451 |
| Income Deficit | 440 | $0 |
| Wage / Income Gap (%) | 1,885 | 32.05% |
| Wage / Income Gap ($) | 1,885 | 67.95¢ per $1 |
| Gini / Inequality Index | 1,885 | 0.40 |
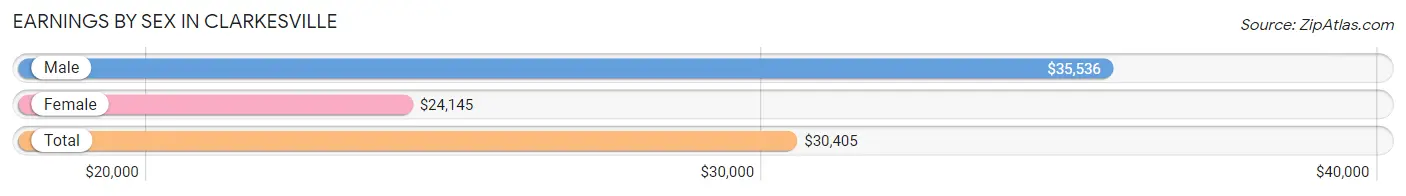
Earnings by Sex in Clarkesville
Average Earnings in Clarkesville are $30,405, $35,536 for men and $24,145 for women, a difference of 32.1%.
| Sex | Number | Average Earnings |
| Male | 389 (51.9%) | $35,536 |
| Female | 361 (48.1%) | $24,145 |
| Total | 750 (100.0%) | $30,405 |
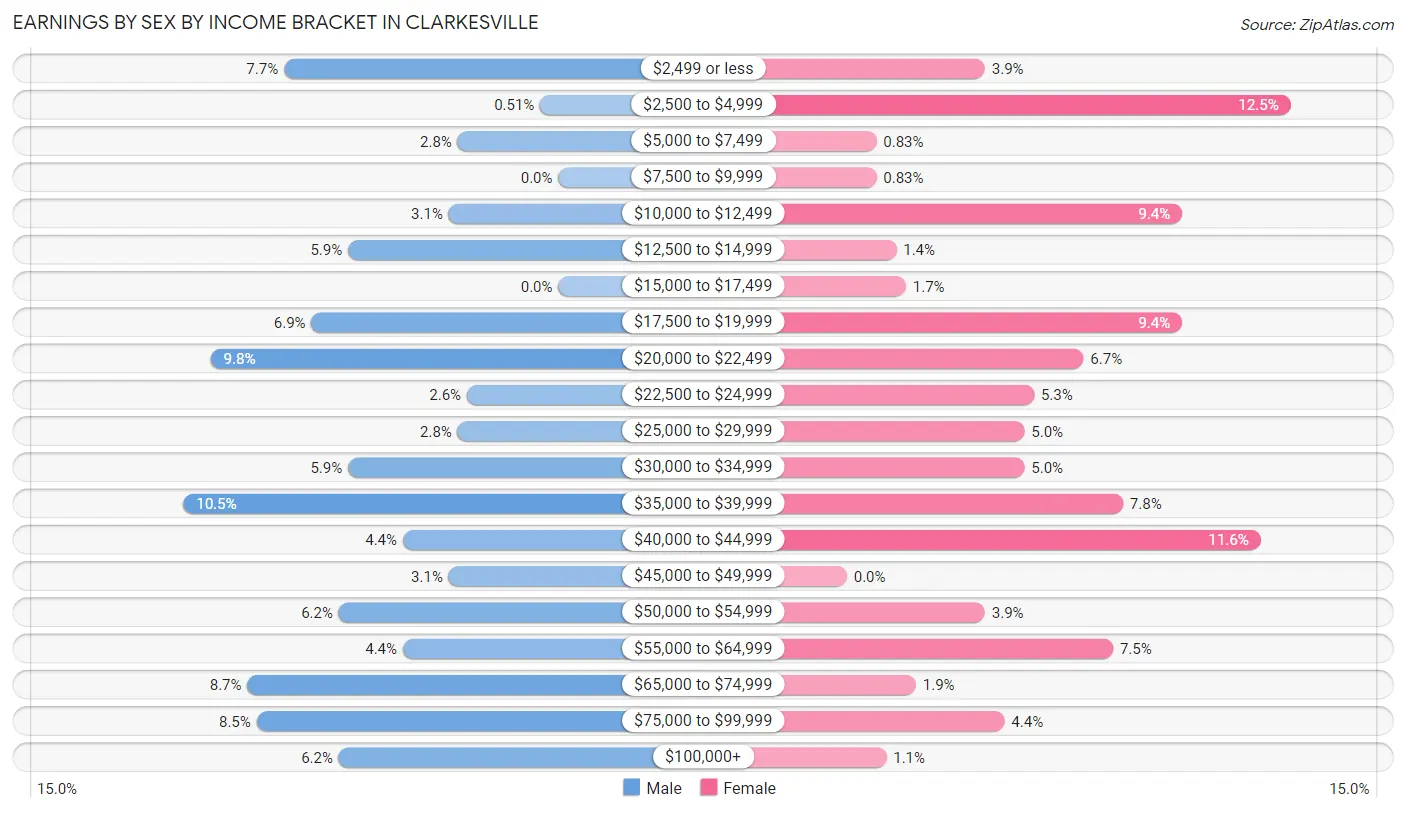
Earnings by Sex by Income Bracket in Clarkesville
The most common earnings brackets in Clarkesville are $35,000 to $39,999 for men (41 | 10.5%) and $2,500 to $4,999 for women (45 | 12.5%).
| Income | Male | Female |
| $2,499 or less | 30 (7.7%) | 14 (3.9%) |
| $2,500 to $4,999 | 2 (0.5%) | 45 (12.5%) |
| $5,000 to $7,499 | 11 (2.8%) | 3 (0.8%) |
| $7,500 to $9,999 | 0 (0.0%) | 3 (0.8%) |
| $10,000 to $12,499 | 12 (3.1%) | 34 (9.4%) |
| $12,500 to $14,999 | 23 (5.9%) | 5 (1.4%) |
| $15,000 to $17,499 | 0 (0.0%) | 6 (1.7%) |
| $17,500 to $19,999 | 27 (6.9%) | 34 (9.4%) |
| $20,000 to $22,499 | 38 (9.8%) | 24 (6.7%) |
| $22,500 to $24,999 | 10 (2.6%) | 19 (5.3%) |
| $25,000 to $29,999 | 11 (2.8%) | 18 (5.0%) |
| $30,000 to $34,999 | 23 (5.9%) | 18 (5.0%) |
| $35,000 to $39,999 | 41 (10.5%) | 28 (7.8%) |
| $40,000 to $44,999 | 17 (4.4%) | 42 (11.6%) |
| $45,000 to $49,999 | 12 (3.1%) | 0 (0.0%) |
| $50,000 to $54,999 | 24 (6.2%) | 14 (3.9%) |
| $55,000 to $64,999 | 17 (4.4%) | 27 (7.5%) |
| $65,000 to $74,999 | 34 (8.7%) | 7 (1.9%) |
| $75,000 to $99,999 | 33 (8.5%) | 16 (4.4%) |
| $100,000+ | 24 (6.2%) | 4 (1.1%) |
| Total | 389 (100.0%) | 361 (100.0%) |
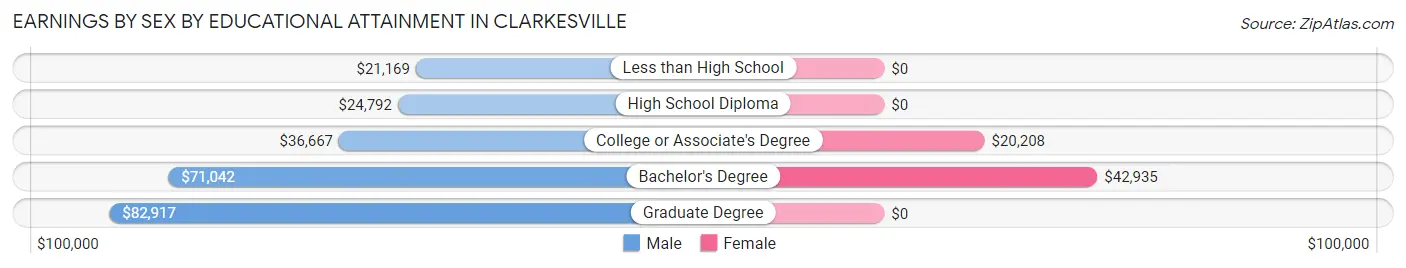
Earnings by Sex by Educational Attainment in Clarkesville
Average earnings in Clarkesville are $36,500 for men and $26,250 for women, a difference of 28.1%. Men with an educational attainment of graduate degree enjoy the highest average annual earnings of $82,917, while those with less than high school education earn the least with $21,169. Women with an educational attainment of bachelor's degree earn the most with the average annual earnings of $42,935, while those with college or associate's degree education have the smallest earnings of $20,208.
| Educational Attainment | Male Income | Female Income |
| Less than High School | $21,169 | $0 |
| High School Diploma | $24,792 | $0 |
| College or Associate's Degree | $36,667 | $20,208 |
| Bachelor's Degree | $71,042 | $42,935 |
| Graduate Degree | $82,917 | $0 |
| Total | $36,500 | $26,250 |
Family Income in Clarkesville
Family Income Brackets in Clarkesville
According to the Clarkesville family income data, there are 114 families falling into the $100,000 to $149,999 income range, which is the most common income bracket and makes up 25.9% of all families. Conversely, the less than $10,000 income bracket is the least frequent group with only 3 families (0.7%) belonging to this category.
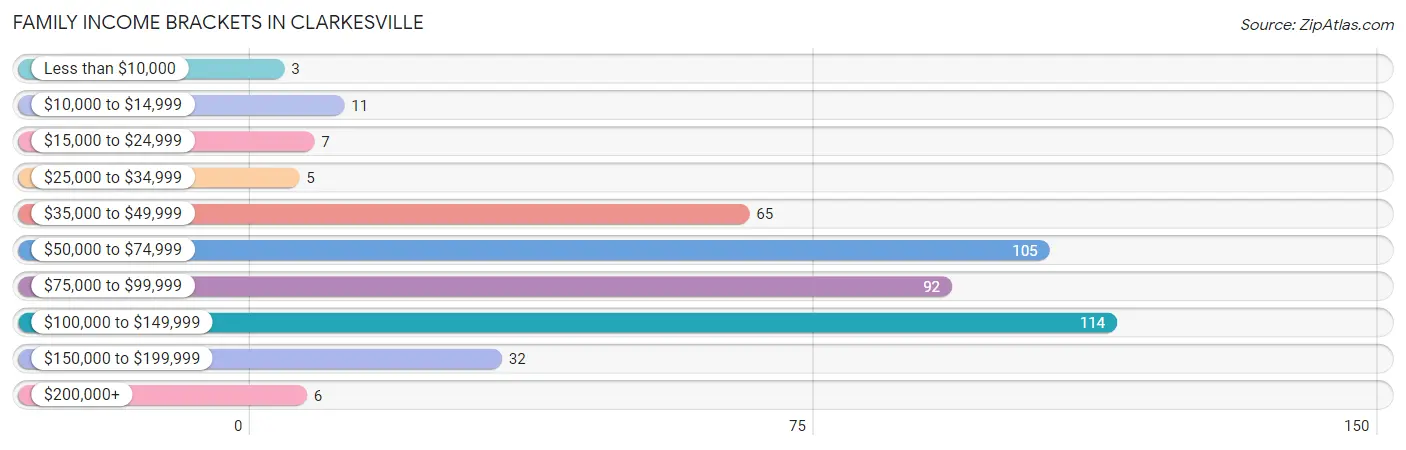
| Income Bracket | # Families | % Families |
| Less than $10,000 | 3 | 0.7% |
| $10,000 to $14,999 | 11 | 2.5% |
| $15,000 to $24,999 | 7 | 1.6% |
| $25,000 to $34,999 | 5 | 1.1% |
| $35,000 to $49,999 | 65 | 14.8% |
| $50,000 to $74,999 | 105 | 23.9% |
| $75,000 to $99,999 | 92 | 20.9% |
| $100,000 to $149,999 | 114 | 25.9% |
| $150,000 to $199,999 | 32 | 7.3% |
| $200,000+ | 6 | 1.4% |
Family Income by Famaliy Size in Clarkesville
6-person families (48 | 10.9%) account for the highest median family income in Clarkesville with $144,265 per family, while 2-person families (225 | 51.1%) have the highest median income of $37,430 per family member.
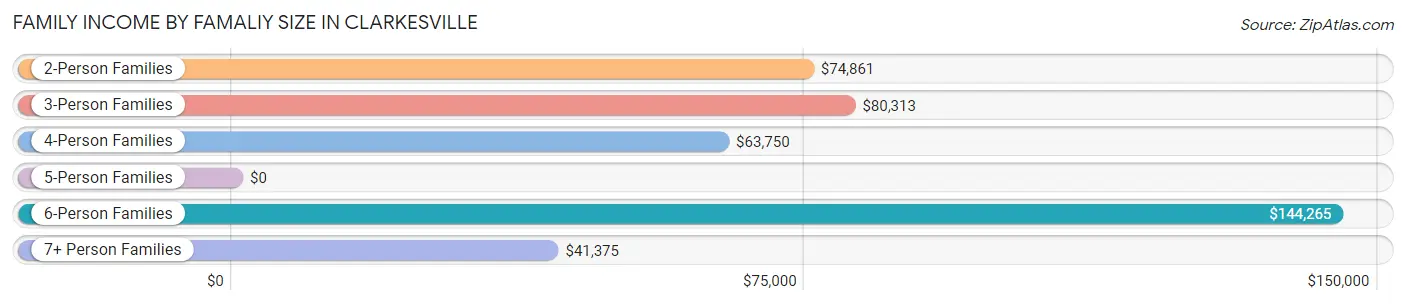
| Income Bracket | # Families | Median Income |
| 2-Person Families | 225 (51.1%) | $74,861 |
| 3-Person Families | 89 (20.2%) | $80,313 |
| 4-Person Families | 32 (7.3%) | $63,750 |
| 5-Person Families | 29 (6.6%) | $0 |
| 6-Person Families | 48 (10.9%) | $144,265 |
| 7+ Person Families | 17 (3.9%) | $41,375 |
| Total | 440 (100.0%) | $81,029 |
Family Income by Number of Earners in Clarkesville
The median family income in Clarkesville is $81,029, with families comprising 2 earners (153) having the highest median family income of $103,304, while families with no earners (79) have the lowest median family income of $49,688, accounting for 34.8% and 17.9% of families, respectively.
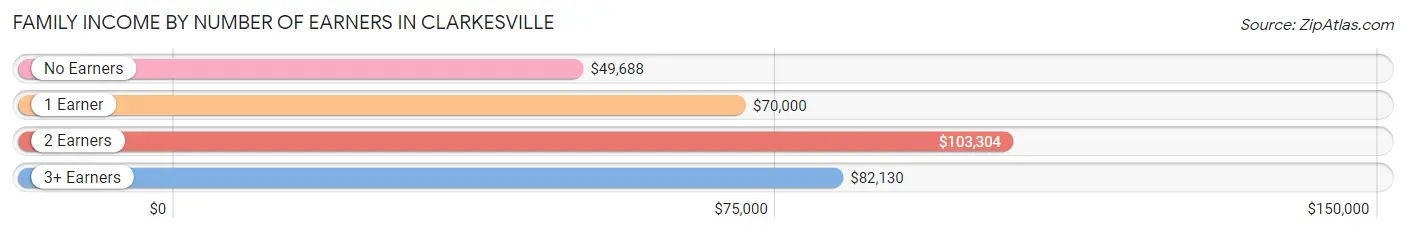
| Number of Earners | # Families | Median Income |
| No Earners | 79 (17.9%) | $49,688 |
| 1 Earner | 150 (34.1%) | $70,000 |
| 2 Earners | 153 (34.8%) | $103,304 |
| 3+ Earners | 58 (13.2%) | $82,130 |
| Total | 440 (100.0%) | $81,029 |
Household Income in Clarkesville
Household Income Brackets in Clarkesville
With 183 households falling in the category, the $75,000 to $99,999 income range is the most frequent in Clarkesville, accounting for 23.6% of all households. In contrast, only 10 households (1.3%) fall into the $200,000+ income bracket, making it the least populous group.
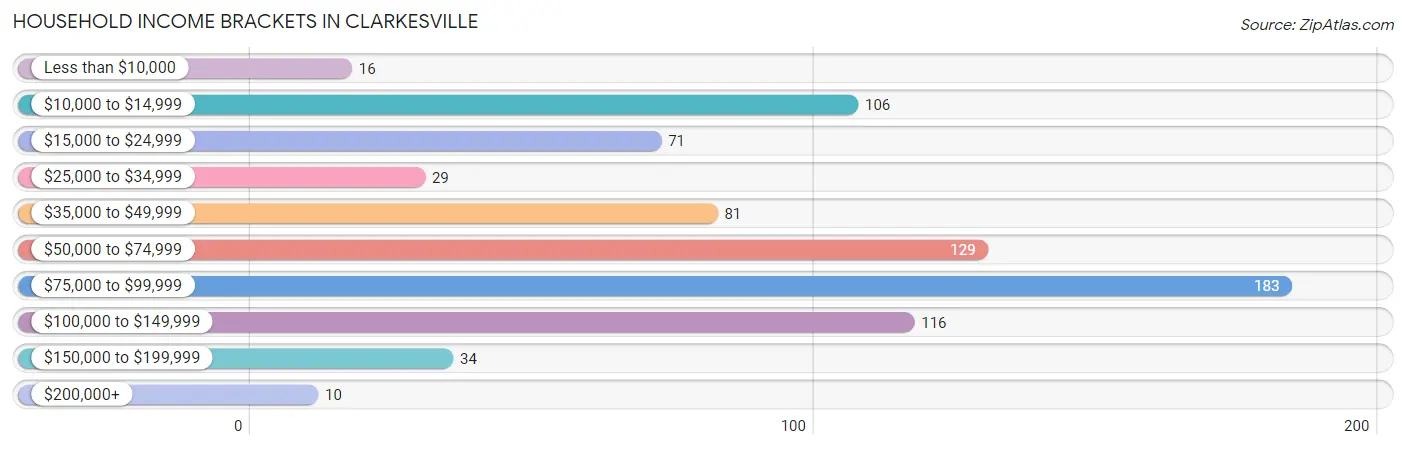
| Income Bracket | # Households | % Households |
| Less than $10,000 | 16 | 2.1% |
| $10,000 to $14,999 | 106 | 13.7% |
| $15,000 to $24,999 | 71 | 9.2% |
| $25,000 to $34,999 | 29 | 3.7% |
| $35,000 to $49,999 | 81 | 10.5% |
| $50,000 to $74,999 | 129 | 16.6% |
| $75,000 to $99,999 | 183 | 23.6% |
| $100,000 to $149,999 | 116 | 15.0% |
| $150,000 to $199,999 | 34 | 4.4% |
| $200,000+ | 10 | 1.3% |
Household Income by Householder Age in Clarkesville
The median household income in Clarkesville is $64,848, with the highest median household income of $68,929 found in the 45 to 64 years age bracket for the primary householder. A total of 232 households (29.9%) fall into this category. Meanwhile, the 15 to 24 years age bracket for the primary householder has the lowest median household income of $38,393, with 15 households (1.9%) in this group.
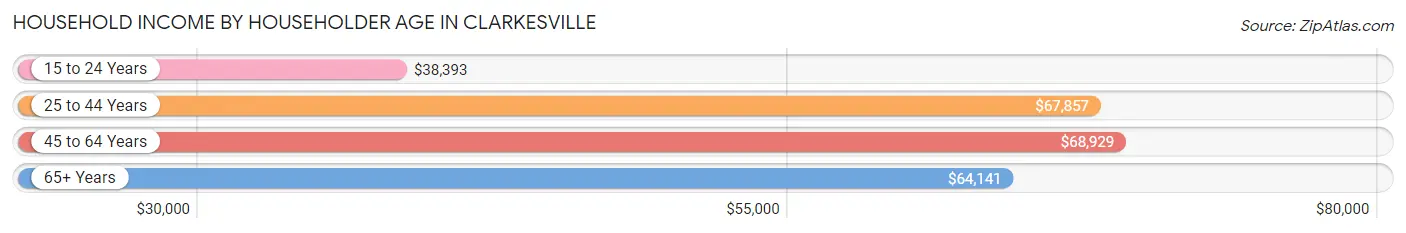
| Income Bracket | # Households | Median Income |
| 15 to 24 Years | 15 (1.9%) | $38,393 |
| 25 to 44 Years | 142 (18.3%) | $67,857 |
| 45 to 64 Years | 232 (29.9%) | $68,929 |
| 65+ Years | 386 (49.8%) | $64,141 |
| Total | 775 (100.0%) | $64,848 |
Poverty in Clarkesville
Income Below Poverty by Sex and Age in Clarkesville
With 14.6% poverty level for males and 17.3% for females among the residents of Clarkesville, under 5 year old males and 6 to 11 year old females are the most vulnerable to poverty, with 19 males (48.7%) and 34 females (43.0%) in their respective age groups living below the poverty level.
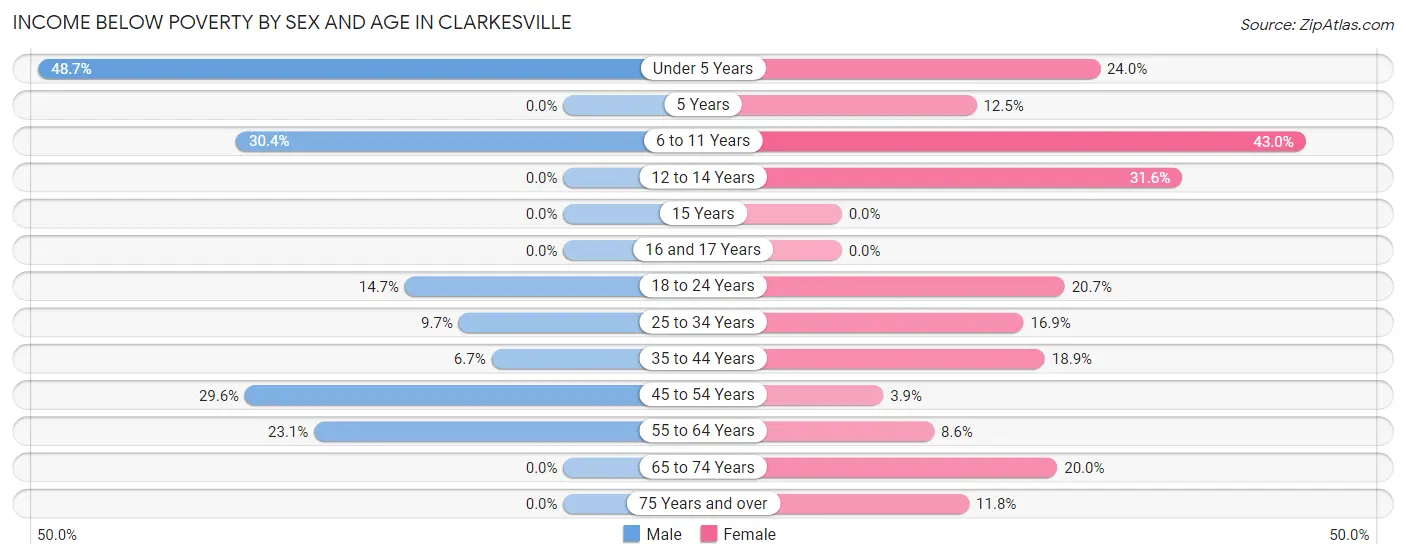
| Age Bracket | Male | Female |
| Under 5 Years | 19 (48.7%) | 23 (24.0%) |
| 5 Years | 0 (0.0%) | 3 (12.5%) |
| 6 to 11 Years | 17 (30.4%) | 34 (43.0%) |
| 12 to 14 Years | 0 (0.0%) | 6 (31.6%) |
| 15 Years | 0 (0.0%) | 0 (0.0%) |
| 16 and 17 Years | 0 (0.0%) | 0 (0.0%) |
| 18 to 24 Years | 5 (14.7%) | 6 (20.7%) |
| 25 to 34 Years | 10 (9.7%) | 14 (16.9%) |
| 35 to 44 Years | 4 (6.7%) | 23 (18.9%) |
| 45 to 54 Years | 26 (29.5%) | 3 (3.8%) |
| 55 to 64 Years | 31 (23.1%) | 9 (8.6%) |
| 65 to 74 Years | 0 (0.0%) | 29 (20.0%) |
| 75 Years and over | 0 (0.0%) | 26 (11.8%) |
| Total | 112 (14.6%) | 176 (17.3%) |
Income Above Poverty by Sex and Age in Clarkesville
According to the poverty statistics in Clarkesville, males aged 12 to 14 years and females aged 16 and 17 years are the age groups that are most secure financially, with 100.0% of males and 100.0% of females in these age groups living above the poverty line.
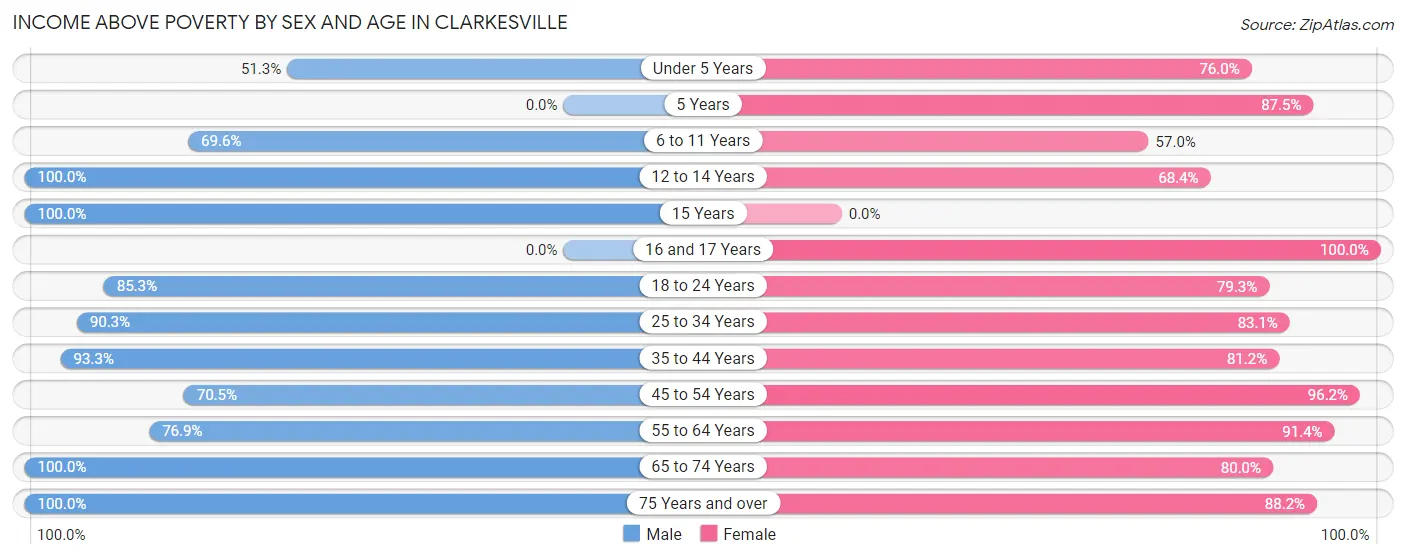
| Age Bracket | Male | Female |
| Under 5 Years | 20 (51.3%) | 73 (76.0%) |
| 5 Years | 0 (0.0%) | 21 (87.5%) |
| 6 to 11 Years | 39 (69.6%) | 45 (57.0%) |
| 12 to 14 Years | 30 (100.0%) | 13 (68.4%) |
| 15 Years | 21 (100.0%) | 0 (0.0%) |
| 16 and 17 Years | 0 (0.0%) | 15 (100.0%) |
| 18 to 24 Years | 29 (85.3%) | 23 (79.3%) |
| 25 to 34 Years | 93 (90.3%) | 69 (83.1%) |
| 35 to 44 Years | 56 (93.3%) | 99 (81.1%) |
| 45 to 54 Years | 62 (70.5%) | 75 (96.2%) |
| 55 to 64 Years | 103 (76.9%) | 96 (91.4%) |
| 65 to 74 Years | 157 (100.0%) | 116 (80.0%) |
| 75 Years and over | 46 (100.0%) | 194 (88.2%) |
| Total | 656 (85.4%) | 839 (82.7%) |
Income Below Poverty Among Married-Couple Families in Clarkesville
The poverty statistics for married-couple families in Clarkesville show that 4.3% or 13 of the total 304 families live below the poverty line. Families with 5 or more children have the highest poverty rate of 100.0%, comprising of 13 families. On the other hand, families with no children have the lowest poverty rate of 0.0%, which includes 0 families.
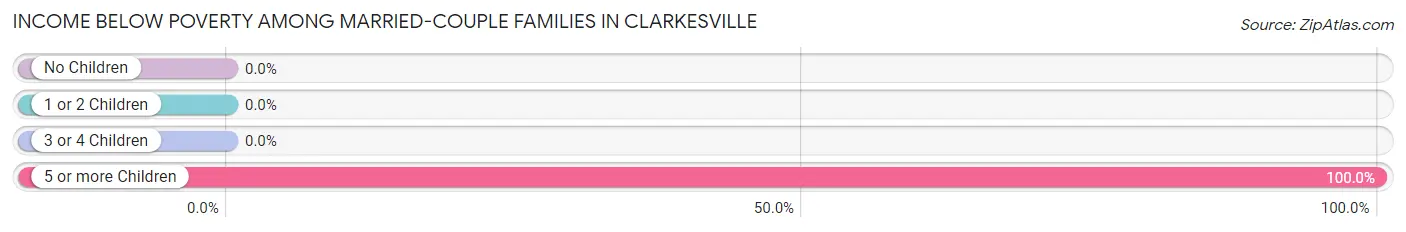
| Children | Above Poverty | Below Poverty |
| No Children | 217 (100.0%) | 0 (0.0%) |
| 1 or 2 Children | 51 (100.0%) | 0 (0.0%) |
| 3 or 4 Children | 23 (100.0%) | 0 (0.0%) |
| 5 or more Children | 0 (0.0%) | 13 (100.0%) |
| Total | 291 (95.7%) | 13 (4.3%) |
Income Below Poverty Among Single-Parent Households in Clarkesville
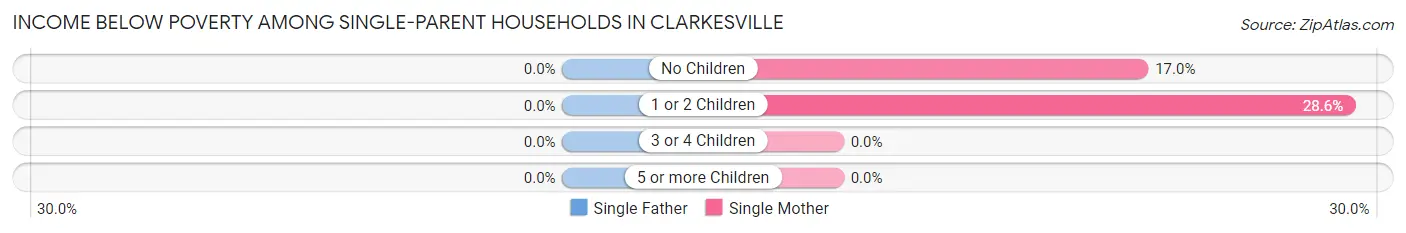
| Children | Single Father | Single Mother |
| No Children | 0 (0.0%) | 8 (17.0%) |
| 1 or 2 Children | 0 (0.0%) | 10 (28.6%) |
| 3 or 4 Children | 0 (0.0%) | 0 (0.0%) |
| 5 or more Children | 0 (0.0%) | 0 (0.0%) |
| Total | 0 (0.0%) | 18 (22.0%) |
Income Below Poverty Among Married-Couple vs Single-Parent Households in Clarkesville
The poverty data for Clarkesville shows that 13 of the married-couple family households (4.3%) and 18 of the single-parent households (13.2%) are living below the poverty level. Within the married-couple family households, those with 5 or more children have the highest poverty rate, with 13 households (100.0%) falling below the poverty line. Among the single-parent households, those with 1 or 2 children have the highest poverty rate, with 10 household (16.1%) living below poverty.
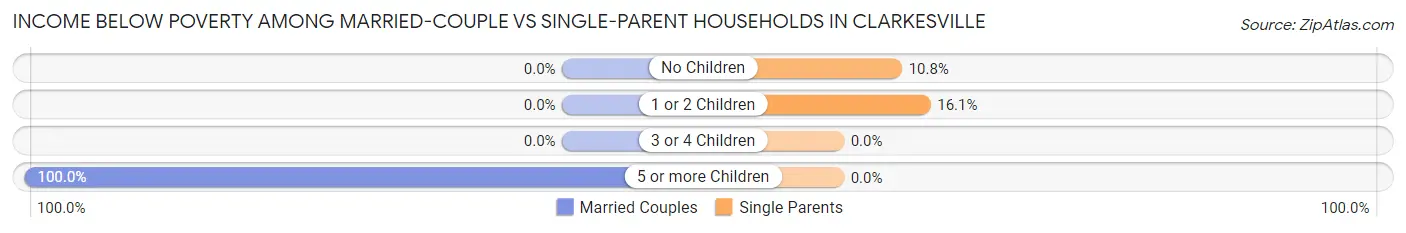
| Children | Married-Couple Families | Single-Parent Households |
| No Children | 0 (0.0%) | 8 (10.8%) |
| 1 or 2 Children | 0 (0.0%) | 10 (16.1%) |
| 3 or 4 Children | 0 (0.0%) | 0 (0.0%) |
| 5 or more Children | 13 (100.0%) | 0 (0.0%) |
| Total | 13 (4.3%) | 18 (13.2%) |
Race in Clarkesville
The most populous races in Clarkesville are White / Caucasian (1,501 | 79.6%), Black / African American (162 | 8.6%), and Two or more Races (135 | 7.2%).
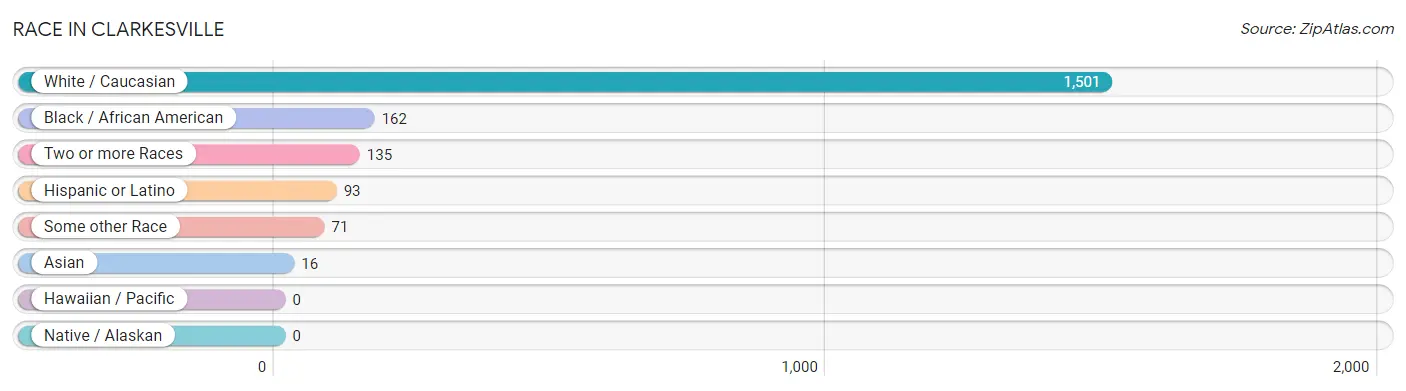
| Race | # Population | % Population |
| Asian | 16 | 0.9% |
| Black / African American | 162 | 8.6% |
| Hawaiian / Pacific | 0 | 0.0% |
| Hispanic or Latino | 93 | 4.9% |
| Native / Alaskan | 0 | 0.0% |
| White / Caucasian | 1,501 | 79.6% |
| Two or more Races | 135 | 7.2% |
| Some other Race | 71 | 3.8% |
| Total | 1,885 | 100.0% |
Ancestry in Clarkesville
The most populous ancestries reported in Clarkesville are English (390 | 20.7%), American (180 | 9.6%), Irish (131 | 7.0%), German (114 | 6.0%), and British (79 | 4.2%), together accounting for 47.4% of all Clarkesville residents.
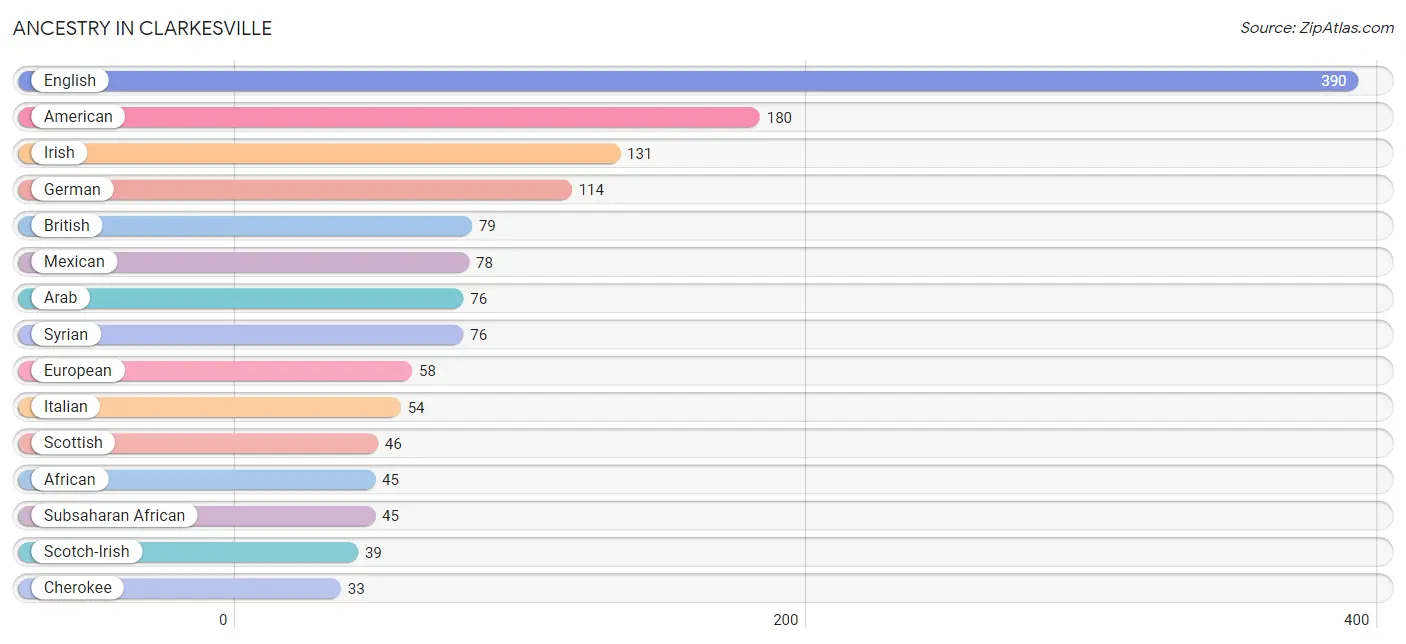
| Ancestry | # Population | % Population |
| African | 45 | 2.4% |
| Alsatian | 9 | 0.5% |
| American | 180 | 9.6% |
| Arab | 76 | 4.0% |
| Austrian | 16 | 0.9% |
| Bhutanese | 2 | 0.1% |
| British | 79 | 4.2% |
| Cherokee | 33 | 1.8% |
| Colombian | 4 | 0.2% |
| Cuban | 7 | 0.4% |
| Czech | 6 | 0.3% |
| English | 390 | 20.7% |
| European | 58 | 3.1% |
| French | 24 | 1.3% |
| French Canadian | 3 | 0.2% |
| German | 114 | 6.0% |
| Irish | 131 | 7.0% |
| Italian | 54 | 2.9% |
| Korean | 27 | 1.4% |
| Lithuanian | 19 | 1.0% |
| Mexican | 78 | 4.1% |
| Northern European | 5 | 0.3% |
| Peruvian | 4 | 0.2% |
| Polish | 8 | 0.4% |
| Scotch-Irish | 39 | 2.1% |
| Scottish | 46 | 2.4% |
| South American | 8 | 0.4% |
| Sri Lankan | 9 | 0.5% |
| Subsaharan African | 45 | 2.4% |
| Swedish | 25 | 1.3% |
| Swiss | 2 | 0.1% |
| Syrian | 76 | 4.0% |
| Ukrainian | 6 | 0.3% |
| Welsh | 21 | 1.1% | View All 34 Rows |
Immigrants in Clarkesville
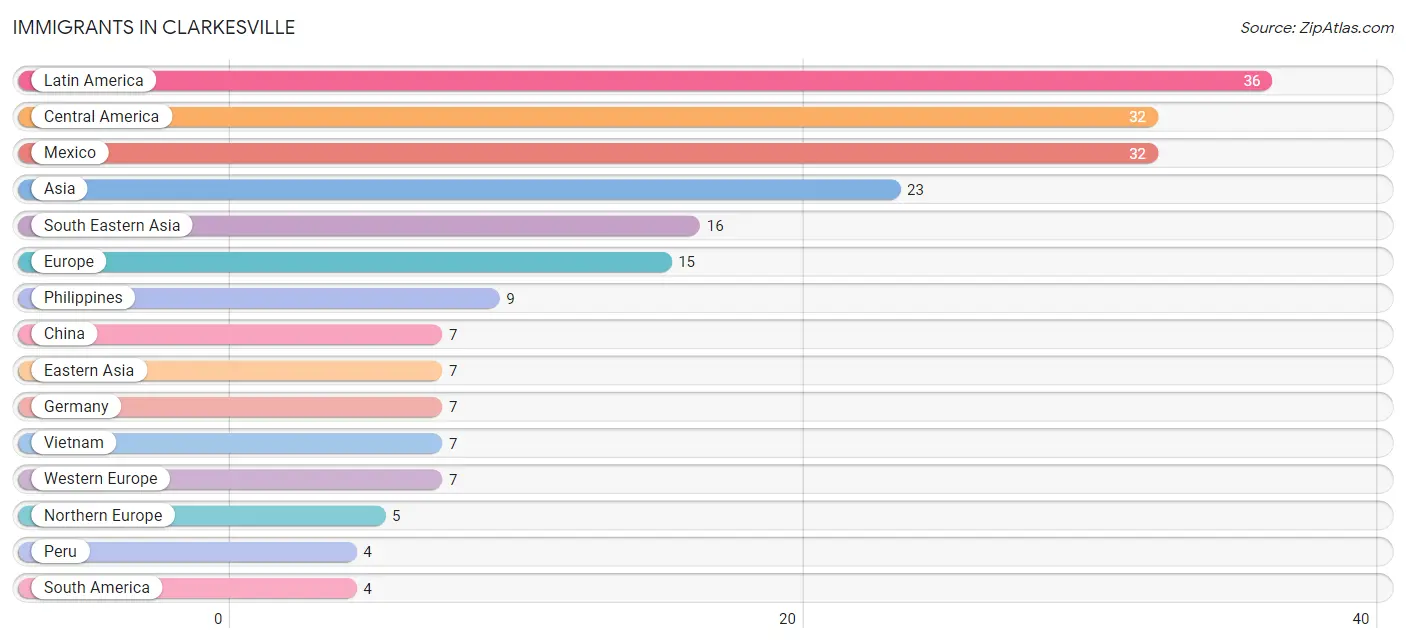
The most numerous immigrant groups reported in Clarkesville came from Latin America (36 | 1.9%), Central America (32 | 1.7%), Mexico (32 | 1.7%), Asia (23 | 1.2%), and South Eastern Asia (16 | 0.9%), together accounting for 7.4% of all Clarkesville residents.
| Immigration Origin | # Population | % Population |
| Asia | 23 | 1.2% |
| Central America | 32 | 1.7% |
| China | 7 | 0.4% |
| Eastern Asia | 7 | 0.4% |
| Eastern Europe | 3 | 0.2% |
| Europe | 15 | 0.8% |
| Germany | 7 | 0.4% |
| Latin America | 36 | 1.9% |
| Mexico | 32 | 1.7% |
| Northern Europe | 5 | 0.3% |
| Peru | 4 | 0.2% |
| Philippines | 9 | 0.5% |
| South America | 4 | 0.2% |
| South Eastern Asia | 16 | 0.9% |
| Ukraine | 3 | 0.2% |
| Vietnam | 7 | 0.4% |
| Western Europe | 7 | 0.4% | View All 17 Rows |
Sex and Age in Clarkesville
Sex and Age in Clarkesville
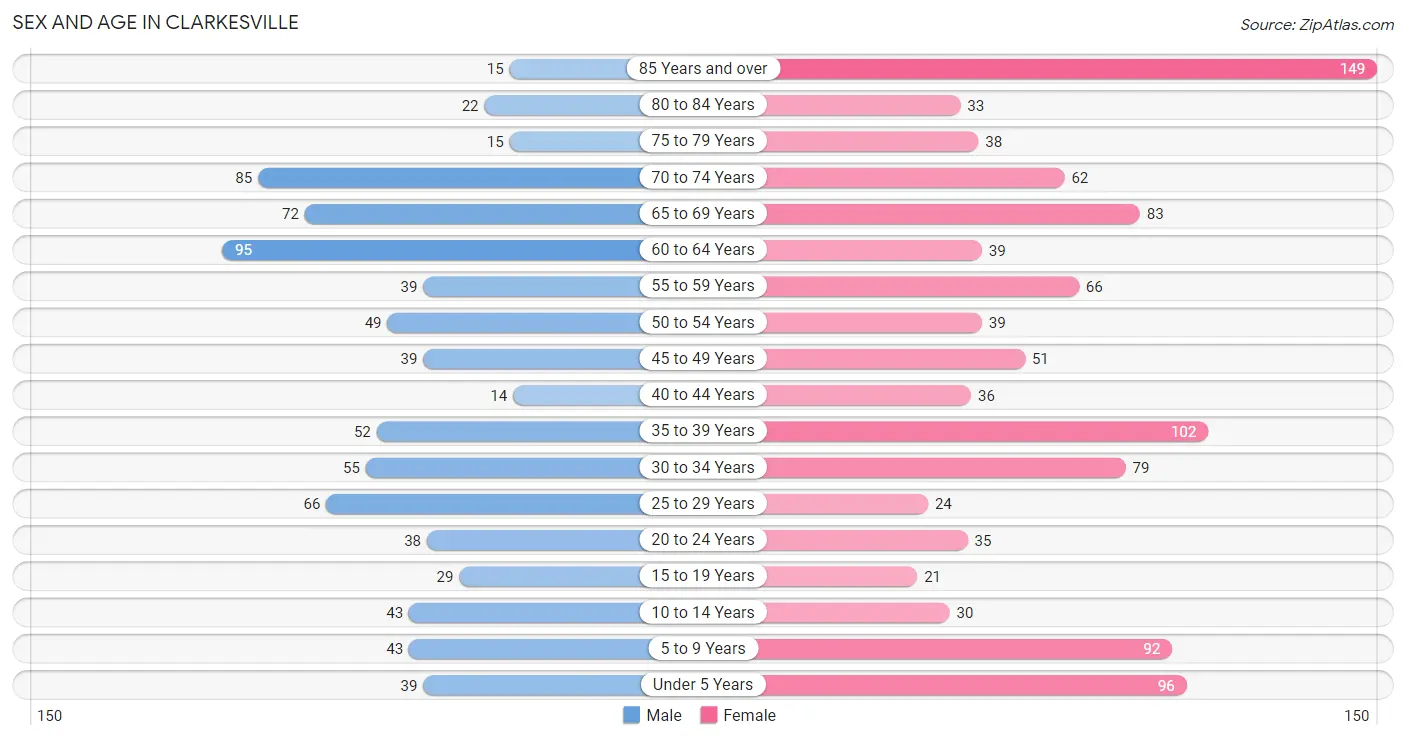
The most populous age groups in Clarkesville are 60 to 64 Years (95 | 11.7%) for men and 85 Years and over (149 | 13.9%) for women.
| Age Bracket | Male | Female |
| Under 5 Years | 39 (4.8%) | 96 (8.9%) |
| 5 to 9 Years | 43 (5.3%) | 92 (8.6%) |
| 10 to 14 Years | 43 (5.3%) | 30 (2.8%) |
| 15 to 19 Years | 29 (3.6%) | 21 (1.9%) |
| 20 to 24 Years | 38 (4.7%) | 35 (3.3%) |
| 25 to 29 Years | 66 (8.2%) | 24 (2.2%) |
| 30 to 34 Years | 55 (6.8%) | 79 (7.3%) |
| 35 to 39 Years | 52 (6.4%) | 102 (9.5%) |
| 40 to 44 Years | 14 (1.7%) | 36 (3.4%) |
| 45 to 49 Years | 39 (4.8%) | 51 (4.7%) |
| 50 to 54 Years | 49 (6.0%) | 39 (3.6%) |
| 55 to 59 Years | 39 (4.8%) | 66 (6.1%) |
| 60 to 64 Years | 95 (11.7%) | 39 (3.6%) |
| 65 to 69 Years | 72 (8.9%) | 83 (7.7%) |
| 70 to 74 Years | 85 (10.5%) | 62 (5.8%) |
| 75 to 79 Years | 15 (1.8%) | 38 (3.5%) |
| 80 to 84 Years | 22 (2.7%) | 33 (3.1%) |
| 85 Years and over | 15 (1.8%) | 149 (13.9%) |
| Total | 810 (100.0%) | 1,075 (100.0%) |
Families and Households in Clarkesville
Median Family Size in Clarkesville
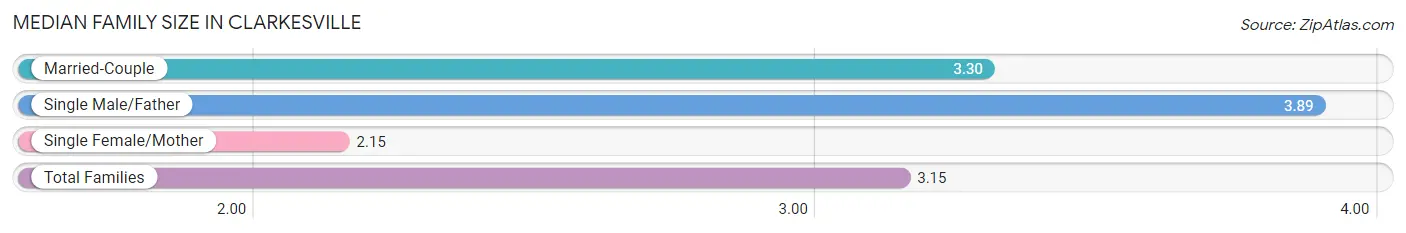
The median family size in Clarkesville is 3.15 persons per family, with single male/father families (54 | 12.3%) accounting for the largest median family size of 3.89 persons per family. On the other hand, single female/mother families (82 | 18.6%) represent the smallest median family size with 2.15 persons per family.
| Family Type | # Families | Family Size |
| Married-Couple | 304 (69.1%) | 3.30 |
| Single Male/Father | 54 (12.3%) | 3.89 |
| Single Female/Mother | 82 (18.6%) | 2.15 |
| Total Families | 440 (100.0%) | 3.15 |
Median Household Size in Clarkesville
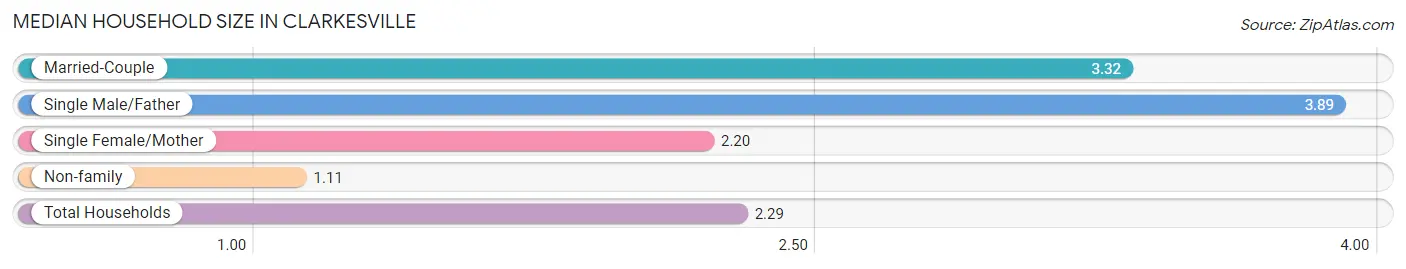
The median household size in Clarkesville is 2.29 persons per household, with single male/father households (54 | 7.0%) accounting for the largest median household size of 3.89 persons per household. non-family households (335 | 43.2%) represent the smallest median household size with 1.11 persons per household.
| Household Type | # Households | Household Size |
| Married-Couple | 304 (39.2%) | 3.32 |
| Single Male/Father | 54 (7.0%) | 3.89 |
| Single Female/Mother | 82 (10.6%) | 2.20 |
| Non-family | 335 (43.2%) | 1.11 |
| Total Households | 775 (100.0%) | 2.29 |
Household Size by Marriage Status in Clarkesville
Out of a total of 775 households in Clarkesville, 440 (56.8%) are family households, while 335 (43.2%) are nonfamily households. The most numerous type of family households are 2-person households, comprising 218, and the most common type of nonfamily households are 1-person households, comprising 312.
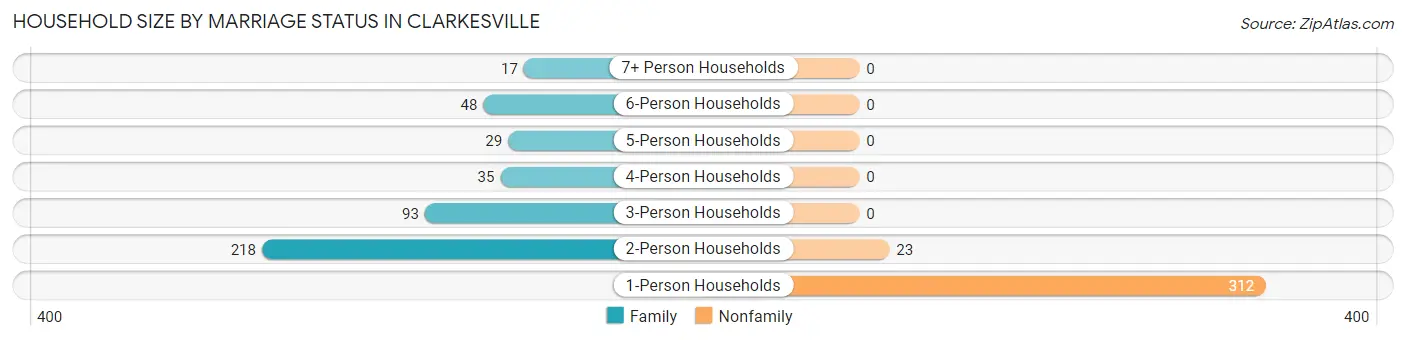
| Household Size | Family Households | Nonfamily Households |
| 1-Person Households | - | 312 (40.3%) |
| 2-Person Households | 218 (28.1%) | 23 (3.0%) |
| 3-Person Households | 93 (12.0%) | 0 (0.0%) |
| 4-Person Households | 35 (4.5%) | 0 (0.0%) |
| 5-Person Households | 29 (3.7%) | 0 (0.0%) |
| 6-Person Households | 48 (6.2%) | 0 (0.0%) |
| 7+ Person Households | 17 (2.2%) | 0 (0.0%) |
| Total | 440 (56.8%) | 335 (43.2%) |
Female Fertility in Clarkesville
Fertility by Age in Clarkesville
Average fertility rate in Clarkesville is 39.0 births per 1,000 women. Women in the age bracket of 35 to 50 years have the highest fertility rate with 45.0 births per 1,000 women. Women in the age bracket of 35 to 50 years acount for 64.3% of all women with births.
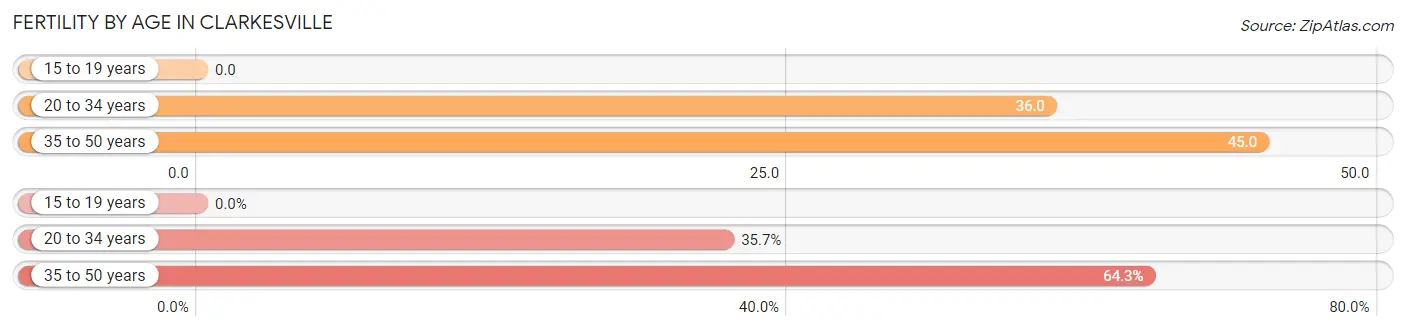
| Age Bracket | Women with Births | Births / 1,000 Women |
| 15 to 19 years | 0 (0.0%) | 0.0 |
| 20 to 34 years | 5 (35.7%) | 36.0 |
| 35 to 50 years | 9 (64.3%) | 45.0 |
| Total | 14 (100.0%) | 39.0 |
Fertility by Age by Marriage Status in Clarkesville
78.6% of women with births (14) in Clarkesville are married. The highest percentage of unmarried women with births falls into 35 to 50 years age bracket with 33.3% of them unmarried at the time of birth, while the lowest percentage of unmarried women with births belong to 20 to 34 years age bracket with 0.0% of them unmarried.
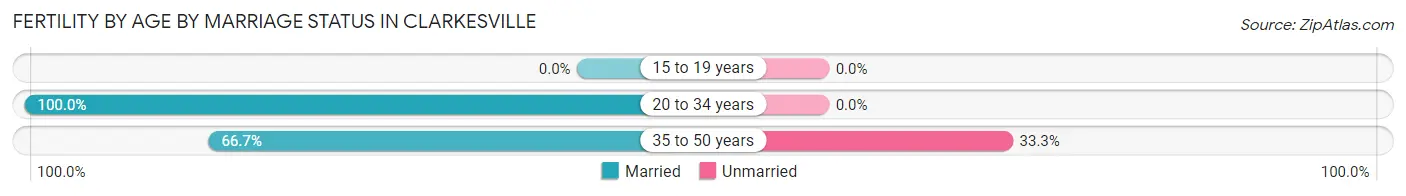
| Age Bracket | Married | Unmarried |
| 15 to 19 years | 0 (0.0%) | 0 (0.0%) |
| 20 to 34 years | 5 (100.0%) | 0 (0.0%) |
| 35 to 50 years | 6 (66.7%) | 3 (33.3%) |
| Total | 11 (78.6%) | 3 (21.4%) |
Fertility by Education in Clarkesville
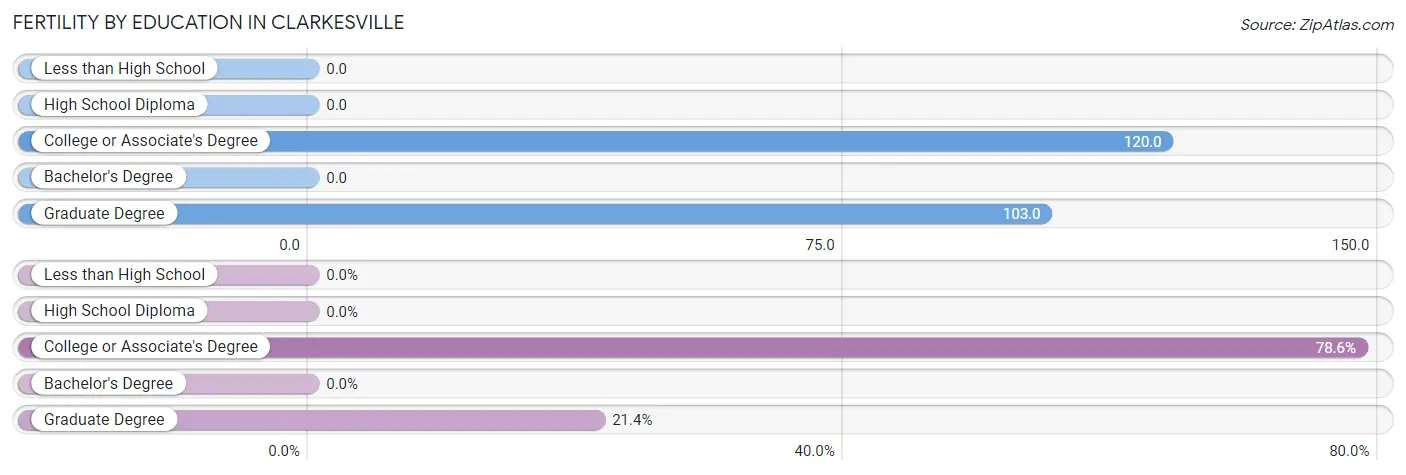
| Educational Attainment | Women with Births | Births / 1,000 Women |
| Less than High School | 0 (0.0%) | 0.0 |
| High School Diploma | 0 (0.0%) | 0.0 |
| College or Associate's Degree | 11 (78.6%) | 120.0 |
| Bachelor's Degree | 0 (0.0%) | 0.0 |
| Graduate Degree | 3 (21.4%) | 103.0 |
| Total | 14 (100.0%) | 39.0 |
Fertility by Education by Marriage Status in Clarkesville
21.4% of women with births in Clarkesville are unmarried. Women with the educational attainment of graduate degree are most likely to be married with 100.0% of them married at childbirth, while women with the educational attainment of college or associate's degree are least likely to be married with 27.3% of them unmarried at childbirth.
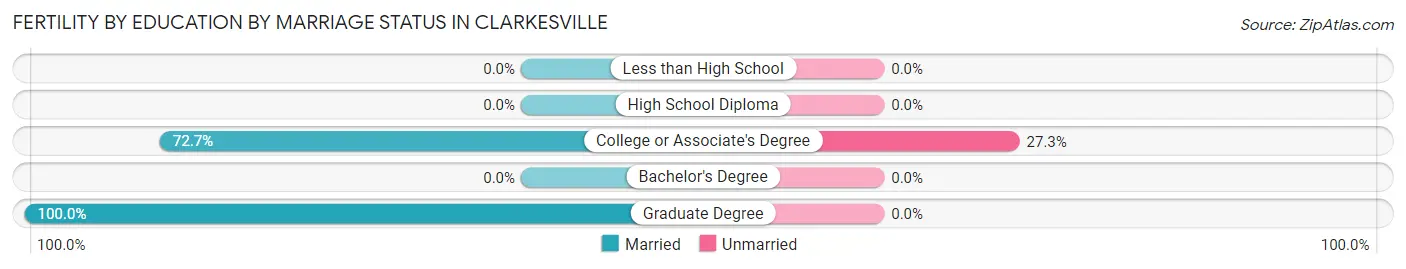
| Educational Attainment | Married | Unmarried |
| Less than High School | 0 (0.0%) | 0 (0.0%) |
| High School Diploma | 0 (0.0%) | 0 (0.0%) |
| College or Associate's Degree | 8 (72.7%) | 3 (27.3%) |
| Bachelor's Degree | 0 (0.0%) | 0 (0.0%) |
| Graduate Degree | 3 (100.0%) | 0 (0.0%) |
| Total | 11 (78.6%) | 3 (21.4%) |
Employment Characteristics in Clarkesville
Employment by Class of Employer in Clarkesville
Among the 652 employed individuals in Clarkesville, private company employees (381 | 58.4%), local government employees (87 | 13.3%), and self-employed (not incorporated) (65 | 10.0%) make up the most common classes of employment.
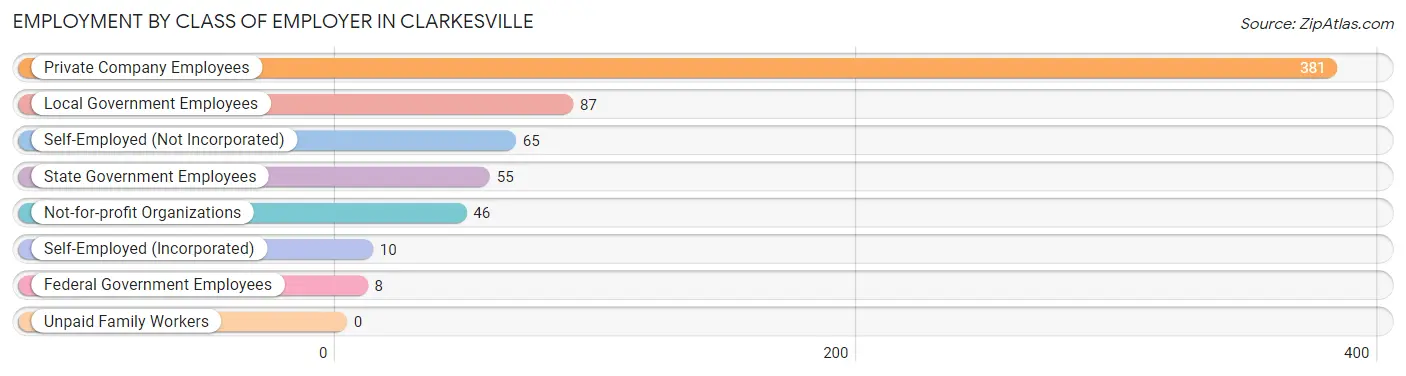
| Employer Class | # Employees | % Employees |
| Private Company Employees | 381 | 58.4% |
| Self-Employed (Incorporated) | 10 | 1.5% |
| Self-Employed (Not Incorporated) | 65 | 10.0% |
| Not-for-profit Organizations | 46 | 7.1% |
| Local Government Employees | 87 | 13.3% |
| State Government Employees | 55 | 8.4% |
| Federal Government Employees | 8 | 1.2% |
| Unpaid Family Workers | 0 | 0.0% |
| Total | 652 | 100.0% |
Employment Status by Age in Clarkesville
According to the labor force statistics for Clarkesville, out of the total population over 16 years of age (1,521), 44.6% or 678 individuals are in the labor force, with 2.7% or 18 of them unemployed. The age group with the highest labor force participation rate is 35 to 44 years, with 84.8% or 173 individuals in the labor force. Within the labor force, the 60 to 64 years age range has the highest percentage of unemployed individuals, with 5.9% or 4 of them being unemployed.
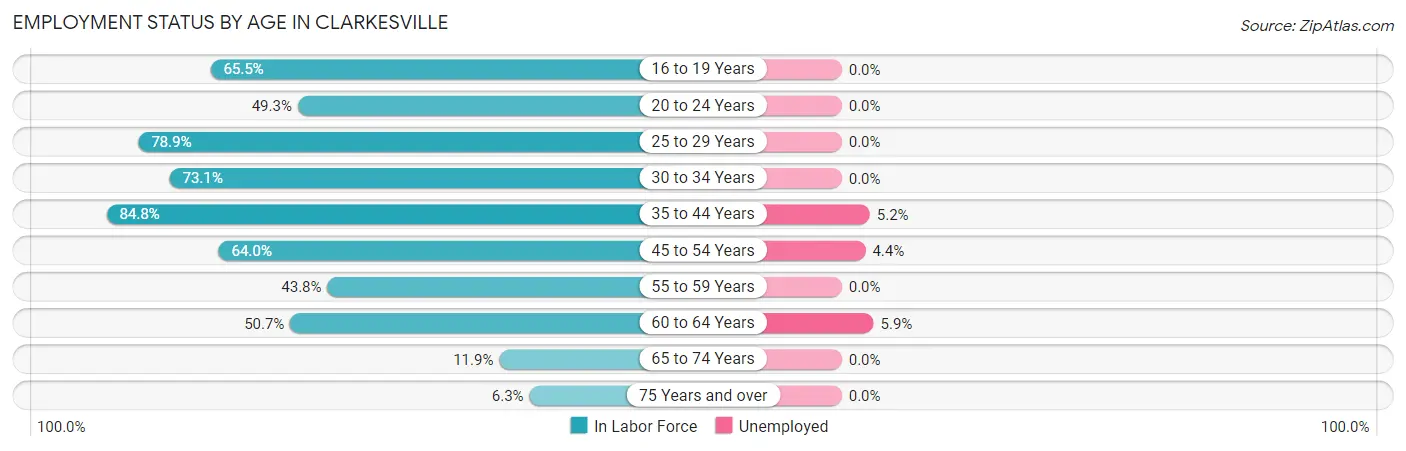
| Age Bracket | In Labor Force | Unemployed |
| 16 to 19 Years | 19 (65.5%) | 0 (0.0%) |
| 20 to 24 Years | 36 (49.3%) | 0 (0.0%) |
| 25 to 29 Years | 71 (78.9%) | 0 (0.0%) |
| 30 to 34 Years | 98 (73.1%) | 0 (0.0%) |
| 35 to 44 Years | 173 (84.8%) | 9 (5.2%) |
| 45 to 54 Years | 114 (64.0%) | 5 (4.4%) |
| 55 to 59 Years | 46 (43.8%) | 0 (0.0%) |
| 60 to 64 Years | 68 (50.7%) | 4 (5.9%) |
| 65 to 74 Years | 36 (11.9%) | 0 (0.0%) |
| 75 Years and over | 17 (6.3%) | 0 (0.0%) |
| Total | 678 (44.6%) | 18 (2.7%) |
Employment Status by Educational Attainment in Clarkesville
According to labor force statistics for Clarkesville, 67.5% of individuals (570) out of the total population between 25 and 64 years of age (845) are in the labor force, with 3.2% or 18 of them being unemployed. The group with the highest labor force participation rate are those with the educational attainment of bachelor's degree or higher, with 93.8% or 227 individuals in the labor force. Within the labor force, individuals with high school diploma education have the highest percentage of unemployment, with 10.3% or 13 of them being unemployed.
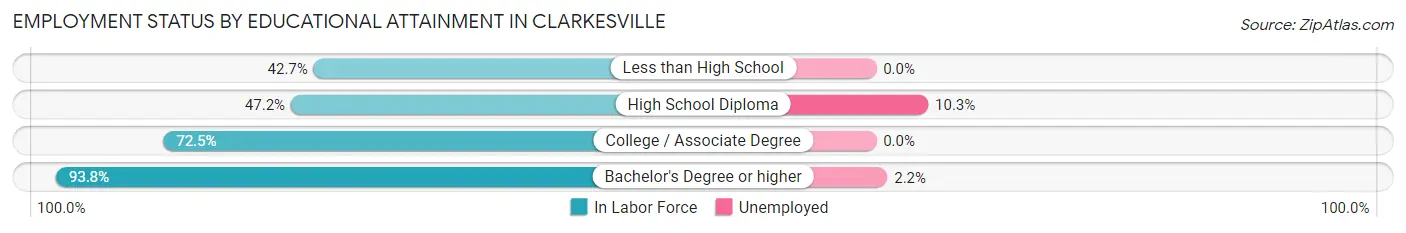
| Educational Attainment | In Labor Force | Unemployed |
| Less than High School | 38 (42.7%) | 0 (0.0%) |
| High School Diploma | 126 (47.2%) | 28 (10.3%) |
| College / Associate Degree | 179 (72.5%) | 0 (0.0%) |
| Bachelor's Degree or higher | 227 (93.8%) | 5 (2.2%) |
| Total | 570 (67.5%) | 27 (3.2%) |
Employment Occupations by Sex in Clarkesville
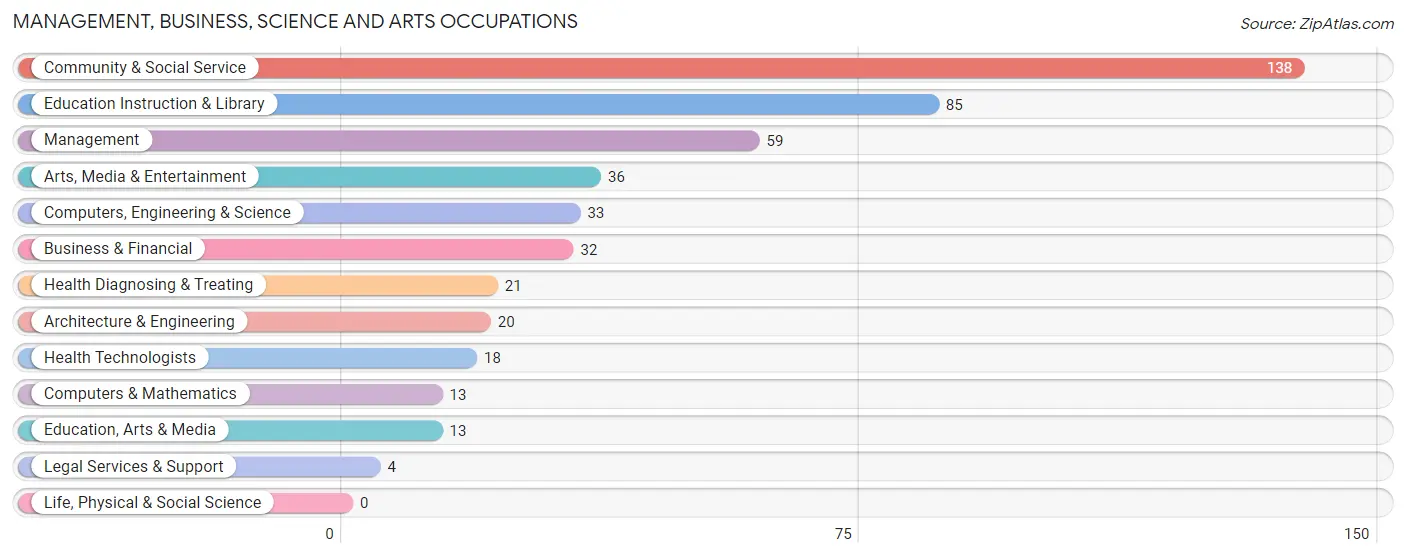
Management, Business, Science and Arts Occupations
The most common Management, Business, Science and Arts occupations in Clarkesville are Community & Social Service (138 | 20.9%), Education Instruction & Library (85 | 12.9%), Management (59 | 8.9%), Arts, Media & Entertainment (36 | 5.4%), and Computers, Engineering & Science (33 | 5.0%).
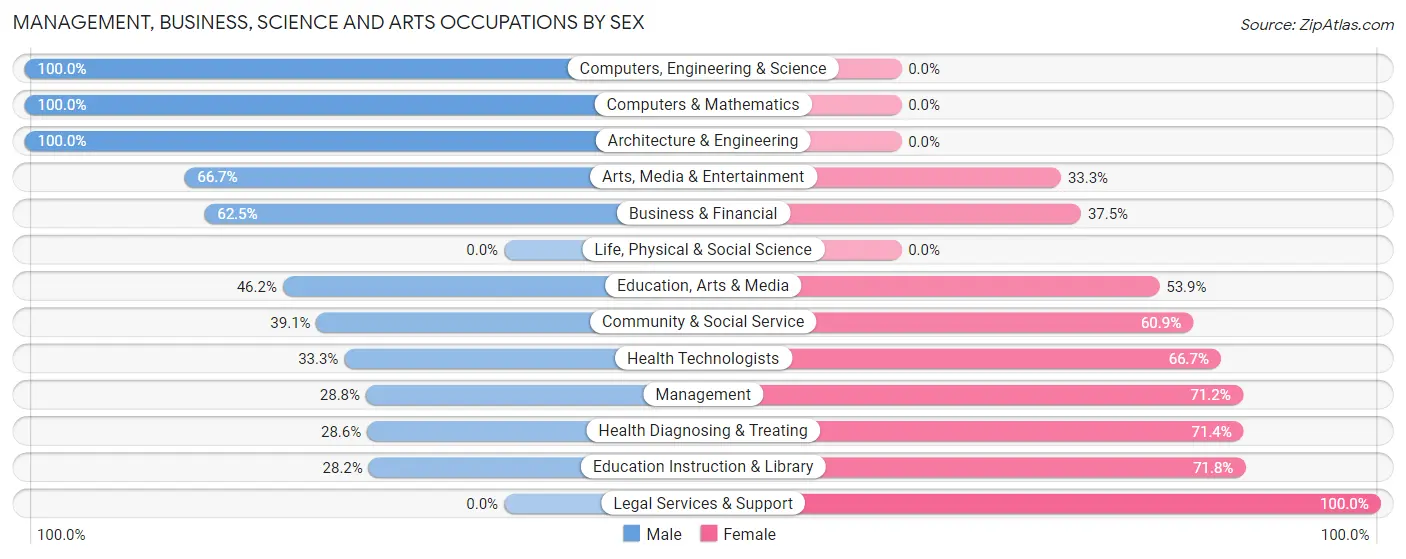
Management, Business, Science and Arts Occupations by Sex
Within the Management, Business, Science and Arts occupations in Clarkesville, the most male-oriented occupations are Computers, Engineering & Science (100.0%), Computers & Mathematics (100.0%), and Architecture & Engineering (100.0%), while the most female-oriented occupations are Legal Services & Support (100.0%), Education Instruction & Library (71.8%), and Health Diagnosing & Treating (71.4%).
| Occupation | Male | Female |
| Management | 17 (28.8%) | 42 (71.2%) |
| Business & Financial | 20 (62.5%) | 12 (37.5%) |
| Computers, Engineering & Science | 33 (100.0%) | 0 (0.0%) |
| Computers & Mathematics | 13 (100.0%) | 0 (0.0%) |
| Architecture & Engineering | 20 (100.0%) | 0 (0.0%) |
| Life, Physical & Social Science | 0 (0.0%) | 0 (0.0%) |
| Community & Social Service | 54 (39.1%) | 84 (60.9%) |
| Education, Arts & Media | 6 (46.2%) | 7 (53.8%) |
| Legal Services & Support | 0 (0.0%) | 4 (100.0%) |
| Education Instruction & Library | 24 (28.2%) | 61 (71.8%) |
| Arts, Media & Entertainment | 24 (66.7%) | 12 (33.3%) |
| Health Diagnosing & Treating | 6 (28.6%) | 15 (71.4%) |
| Health Technologists | 6 (33.3%) | 12 (66.7%) |
| Total (Category) | 130 (45.9%) | 153 (54.1%) |
| Total (Overall) | 356 (53.9%) | 304 (46.1%) |
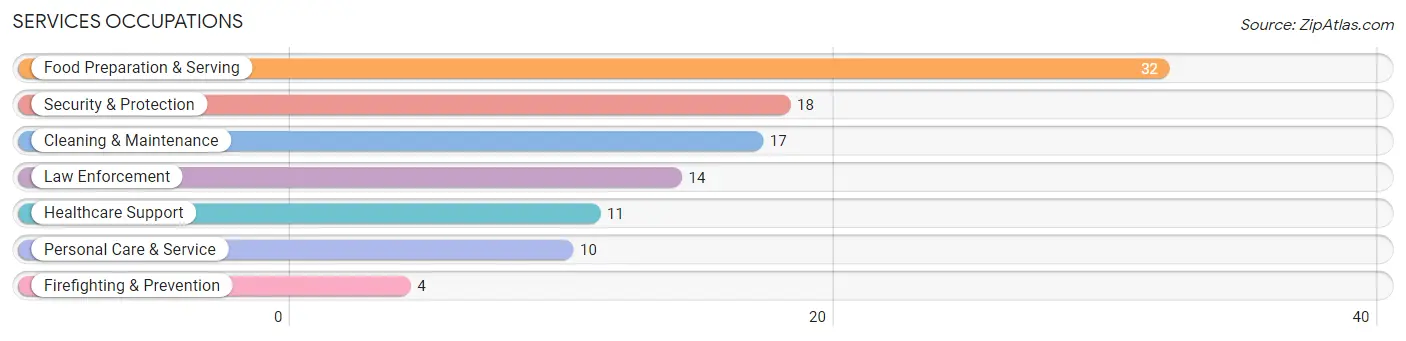
Services Occupations
The most common Services occupations in Clarkesville are Food Preparation & Serving (32 | 4.9%), Security & Protection (18 | 2.7%), Cleaning & Maintenance (17 | 2.6%), Law Enforcement (14 | 2.1%), and Healthcare Support (11 | 1.7%).
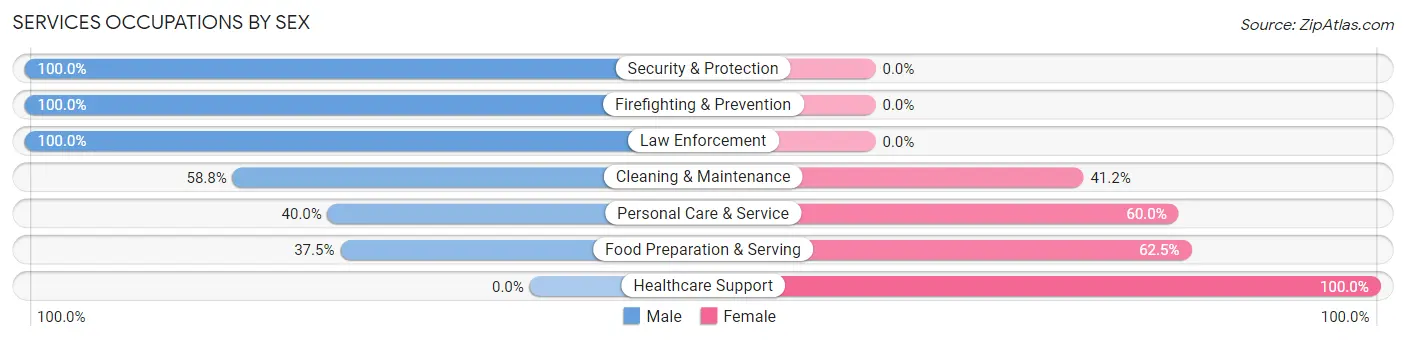
Services Occupations by Sex
Within the Services occupations in Clarkesville, the most male-oriented occupations are Security & Protection (100.0%), Firefighting & Prevention (100.0%), and Law Enforcement (100.0%), while the most female-oriented occupations are Healthcare Support (100.0%), Food Preparation & Serving (62.5%), and Personal Care & Service (60.0%).
| Occupation | Male | Female |
| Healthcare Support | 0 (0.0%) | 11 (100.0%) |
| Security & Protection | 18 (100.0%) | 0 (0.0%) |
| Firefighting & Prevention | 4 (100.0%) | 0 (0.0%) |
| Law Enforcement | 14 (100.0%) | 0 (0.0%) |
| Food Preparation & Serving | 12 (37.5%) | 20 (62.5%) |
| Cleaning & Maintenance | 10 (58.8%) | 7 (41.2%) |
| Personal Care & Service | 4 (40.0%) | 6 (60.0%) |
| Total (Category) | 44 (50.0%) | 44 (50.0%) |
| Total (Overall) | 356 (53.9%) | 304 (46.1%) |
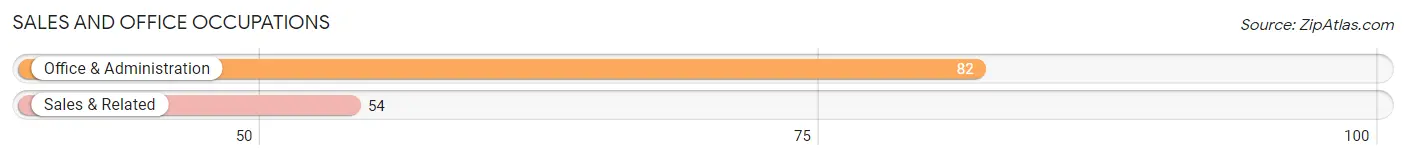
Sales and Office Occupations
The most common Sales and Office occupations in Clarkesville are Office & Administration (82 | 12.4%), and Sales & Related (54 | 8.2%).
Sales and Office Occupations by Sex
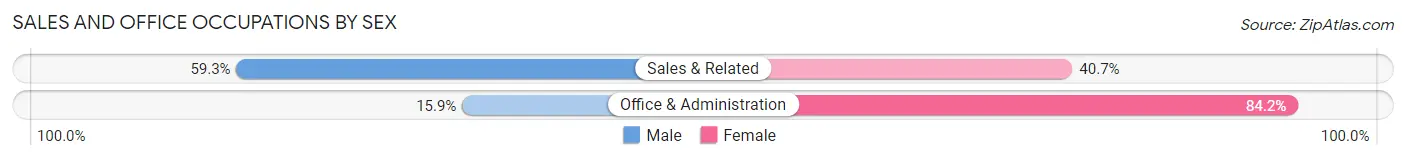
| Occupation | Male | Female |
| Sales & Related | 32 (59.3%) | 22 (40.7%) |
| Office & Administration | 13 (15.9%) | 69 (84.2%) |
| Total (Category) | 45 (33.1%) | 91 (66.9%) |
| Total (Overall) | 356 (53.9%) | 304 (46.1%) |
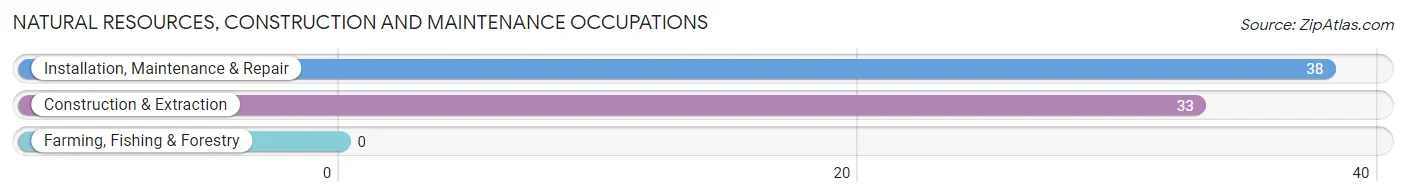
Natural Resources, Construction and Maintenance Occupations
The most common Natural Resources, Construction and Maintenance occupations in Clarkesville are Installation, Maintenance & Repair (38 | 5.8%), and Construction & Extraction (33 | 5.0%).
Natural Resources, Construction and Maintenance Occupations by Sex
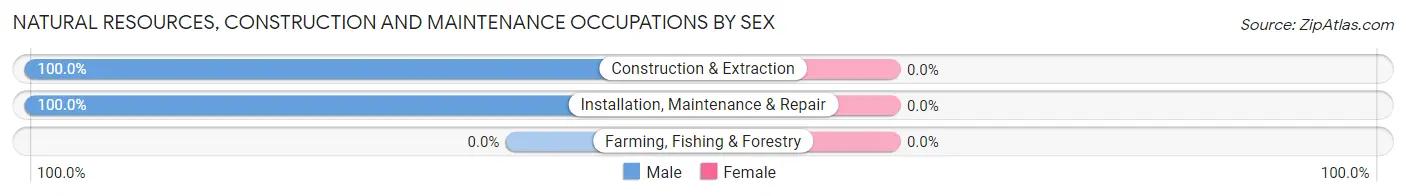
| Occupation | Male | Female |
| Farming, Fishing & Forestry | 0 (0.0%) | 0 (0.0%) |
| Construction & Extraction | 33 (100.0%) | 0 (0.0%) |
| Installation, Maintenance & Repair | 38 (100.0%) | 0 (0.0%) |
| Total (Category) | 71 (100.0%) | 0 (0.0%) |
| Total (Overall) | 356 (53.9%) | 304 (46.1%) |
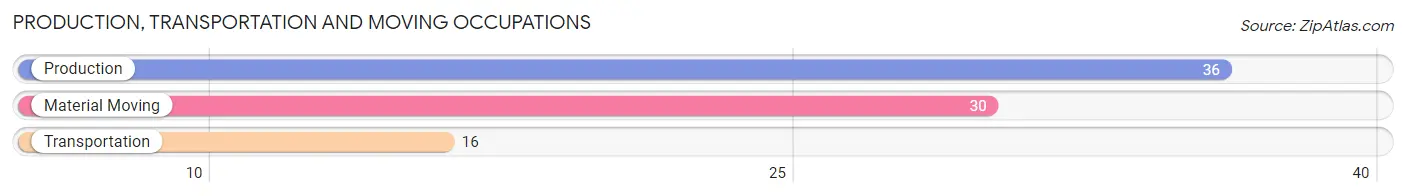
Production, Transportation and Moving Occupations
The most common Production, Transportation and Moving occupations in Clarkesville are Production (36 | 5.4%), Material Moving (30 | 4.5%), and Transportation (16 | 2.4%).
Production, Transportation and Moving Occupations by Sex
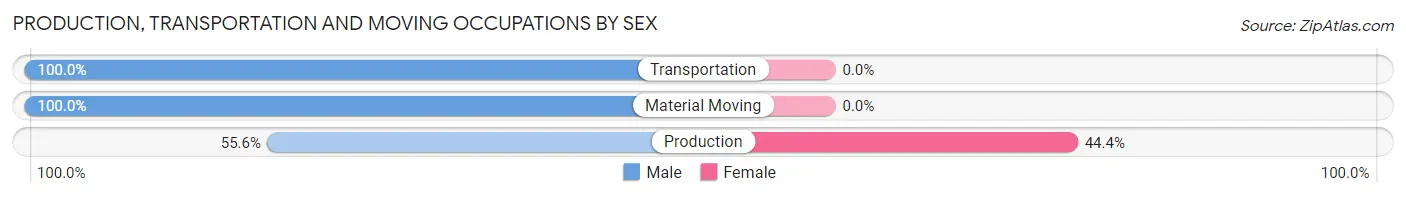
| Occupation | Male | Female |
| Production | 20 (55.6%) | 16 (44.4%) |
| Transportation | 16 (100.0%) | 0 (0.0%) |
| Material Moving | 30 (100.0%) | 0 (0.0%) |
| Total (Category) | 66 (80.5%) | 16 (19.5%) |
| Total (Overall) | 356 (53.9%) | 304 (46.1%) |
Employment Industries by Sex in Clarkesville
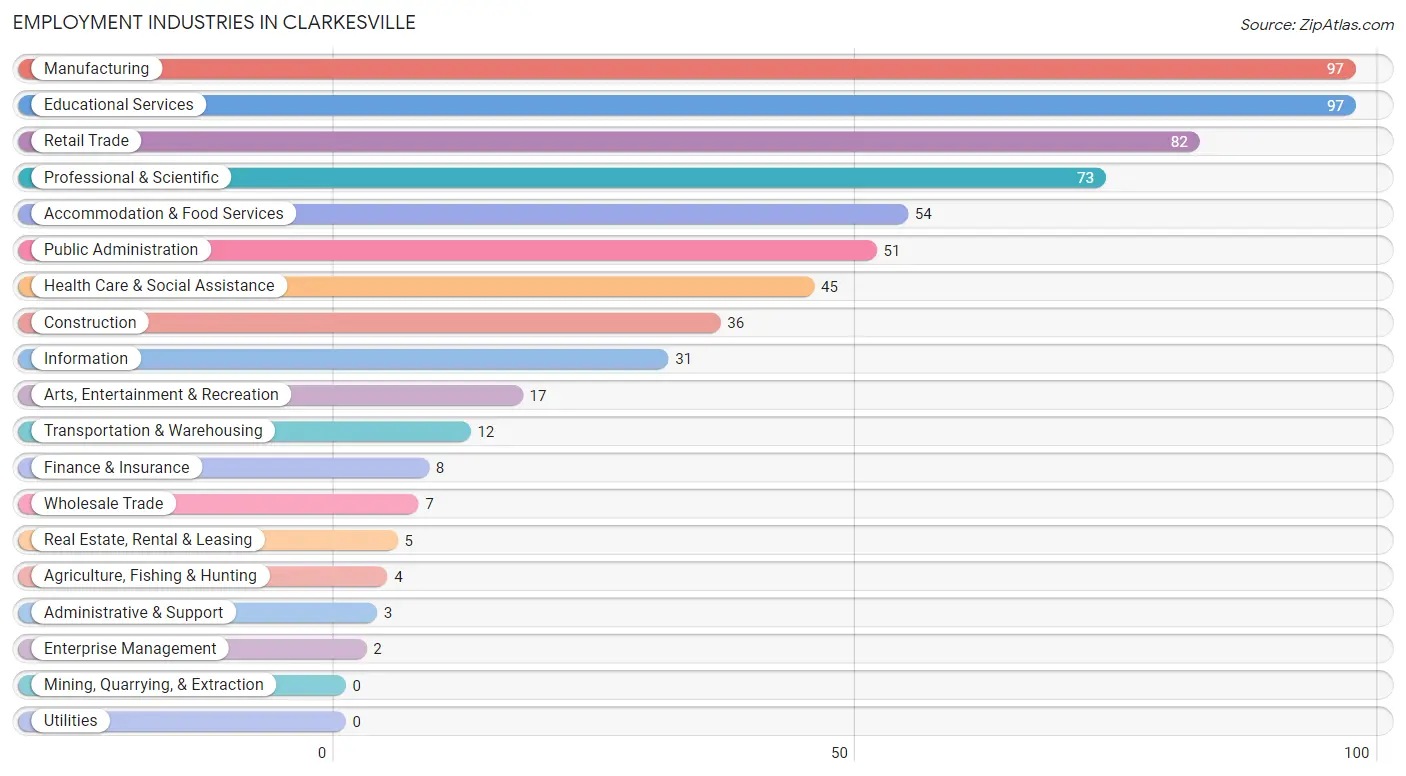
Employment Industries in Clarkesville
The major employment industries in Clarkesville include Manufacturing (97 | 14.7%), Educational Services (97 | 14.7%), Retail Trade (82 | 12.4%), Professional & Scientific (73 | 11.1%), and Accommodation & Food Services (54 | 8.2%).
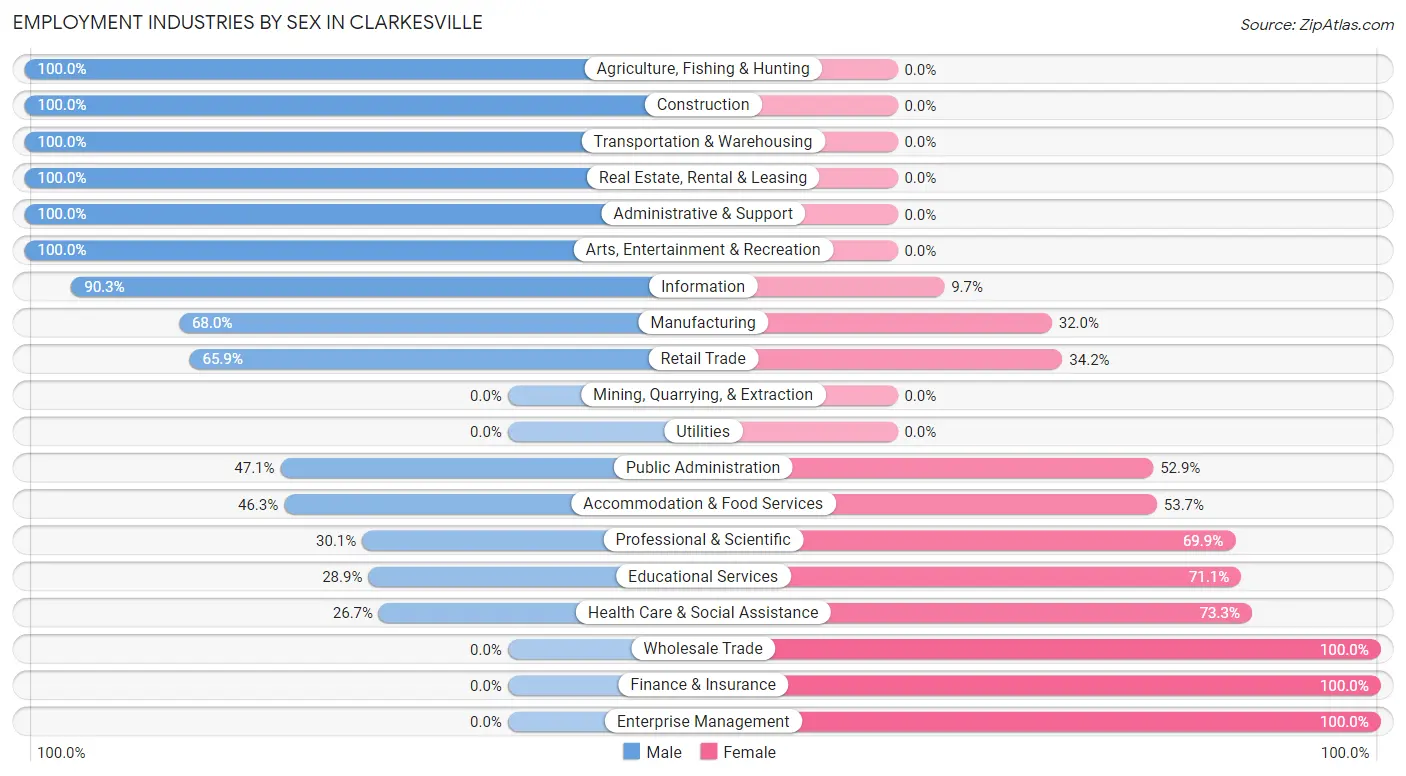
Employment Industries by Sex in Clarkesville
The Clarkesville industries that see more men than women are Agriculture, Fishing & Hunting (100.0%), Construction (100.0%), and Transportation & Warehousing (100.0%), whereas the industries that tend to have a higher number of women are Wholesale Trade (100.0%), Finance & Insurance (100.0%), and Enterprise Management (100.0%).
| Industry | Male | Female |
| Agriculture, Fishing & Hunting | 4 (100.0%) | 0 (0.0%) |
| Mining, Quarrying, & Extraction | 0 (0.0%) | 0 (0.0%) |
| Construction | 36 (100.0%) | 0 (0.0%) |
| Manufacturing | 66 (68.0%) | 31 (32.0%) |
| Wholesale Trade | 0 (0.0%) | 7 (100.0%) |
| Retail Trade | 54 (65.8%) | 28 (34.2%) |
| Transportation & Warehousing | 12 (100.0%) | 0 (0.0%) |
| Utilities | 0 (0.0%) | 0 (0.0%) |
| Information | 28 (90.3%) | 3 (9.7%) |
| Finance & Insurance | 0 (0.0%) | 8 (100.0%) |
| Real Estate, Rental & Leasing | 5 (100.0%) | 0 (0.0%) |
| Professional & Scientific | 22 (30.1%) | 51 (69.9%) |
| Enterprise Management | 0 (0.0%) | 2 (100.0%) |
| Administrative & Support | 3 (100.0%) | 0 (0.0%) |
| Educational Services | 28 (28.9%) | 69 (71.1%) |
| Health Care & Social Assistance | 12 (26.7%) | 33 (73.3%) |
| Arts, Entertainment & Recreation | 17 (100.0%) | 0 (0.0%) |
| Accommodation & Food Services | 25 (46.3%) | 29 (53.7%) |
| Public Administration | 24 (47.1%) | 27 (52.9%) |
| Total | 356 (53.9%) | 304 (46.1%) |
Education in Clarkesville
School Enrollment in Clarkesville
The most common levels of schooling among the 400 students in Clarkesville are college / undergraduate (111 | 27.8%), elementary school (100 | 25.0%), and high school (69 | 17.2%).
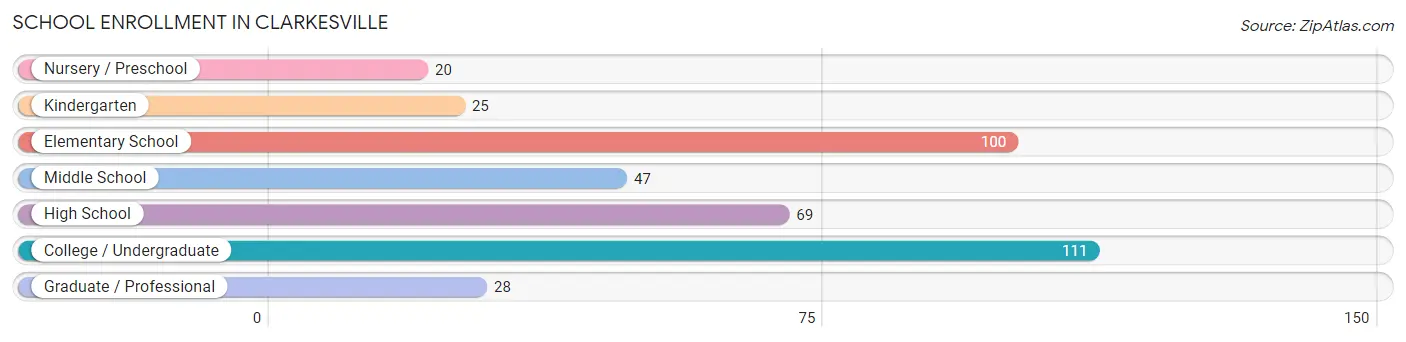
| School Level | # Students | % Students |
| Nursery / Preschool | 20 | 5.0% |
| Kindergarten | 25 | 6.2% |
| Elementary School | 100 | 25.0% |
| Middle School | 47 | 11.7% |
| High School | 69 | 17.2% |
| College / Undergraduate | 111 | 27.8% |
| Graduate / Professional | 28 | 7.0% |
| Total | 400 | 100.0% |
School Enrollment by Age by Funding Source in Clarkesville
Out of a total of 400 students who are enrolled in schools in Clarkesville, 166 (41.5%) attend a private institution, while the remaining 234 (58.5%) are enrolled in public schools. The age group of 35 years and over has the highest likelihood of being enrolled in private schools, with 76 (73.1% in the age bracket) enrolled. Conversely, the age group of 3 to 4 year olds has the lowest likelihood of being enrolled in a private school, with 2 (100.0% in the age bracket) attending a public institution.
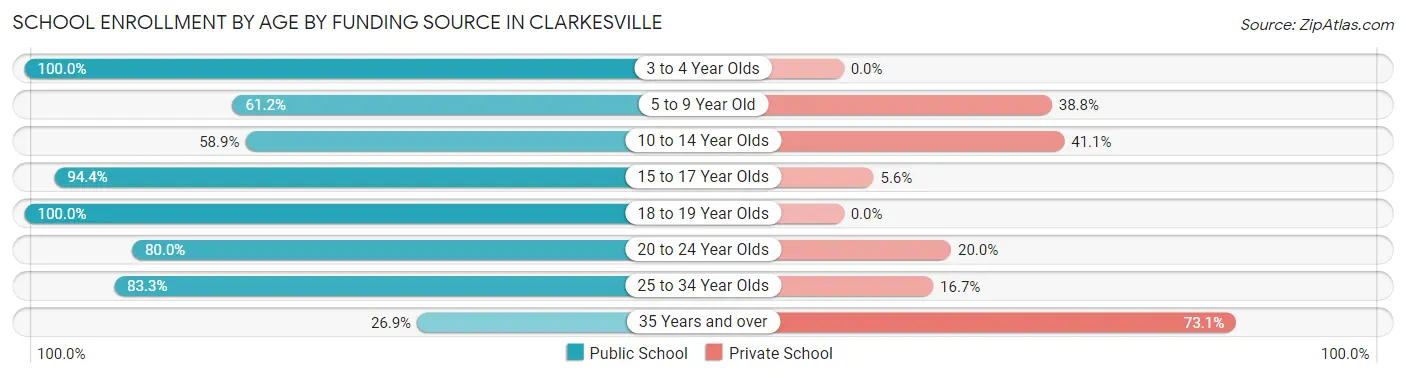
| Age Bracket | Public School | Private School |
| 3 to 4 Year Olds | 2 (100.0%) | 0 (0.0%) |
| 5 to 9 Year Old | 79 (61.2%) | 50 (38.8%) |
| 10 to 14 Year Olds | 43 (58.9%) | 30 (41.1%) |
| 15 to 17 Year Olds | 34 (94.4%) | 2 (5.6%) |
| 18 to 19 Year Olds | 12 (100.0%) | 0 (0.0%) |
| 20 to 24 Year Olds | 16 (80.0%) | 4 (20.0%) |
| 25 to 34 Year Olds | 20 (83.3%) | 4 (16.7%) |
| 35 Years and over | 28 (26.9%) | 76 (73.1%) |
| Total | 234 (58.5%) | 166 (41.5%) |
Educational Attainment by Field of Study in Clarkesville
Computers & mathematics (87 | 18.5%), business (73 | 15.5%), visual & performing arts (53 | 11.3%), education (49 | 10.4%), and communications (44 | 9.4%) are the most common fields of study among 470 individuals in Clarkesville who have obtained a bachelor's degree or higher.
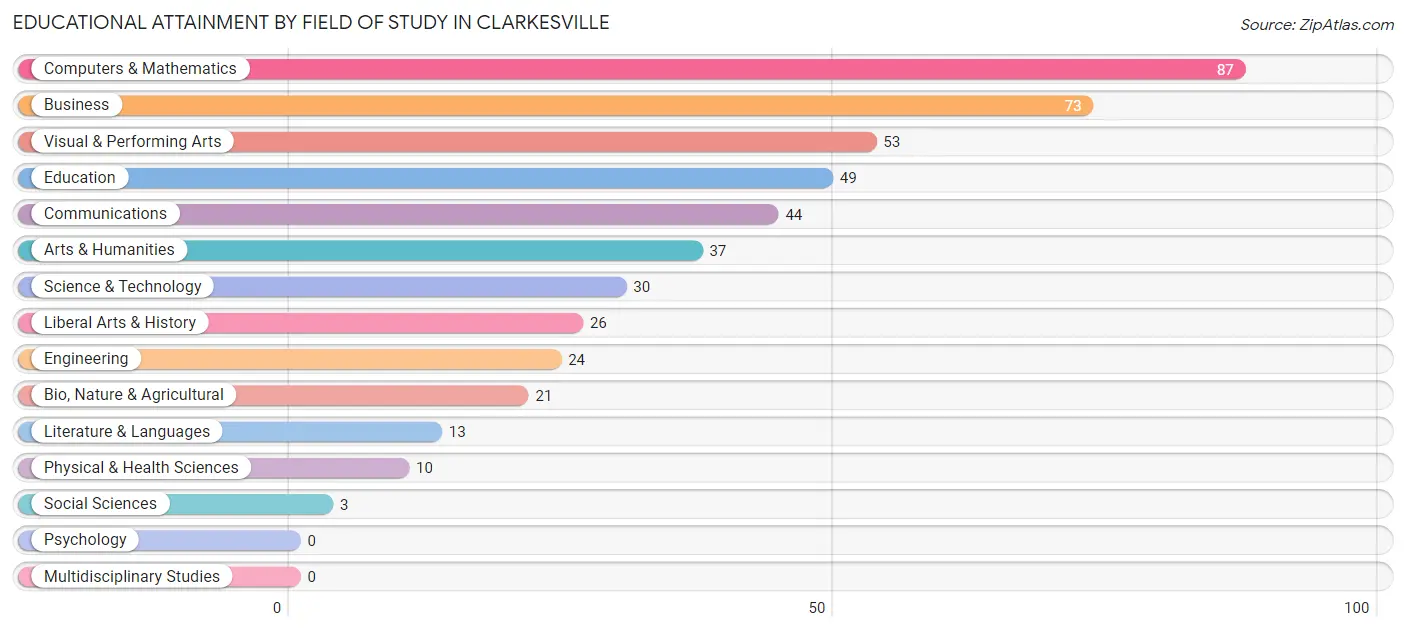
| Field of Study | # Graduates | % Graduates |
| Computers & Mathematics | 87 | 18.5% |
| Bio, Nature & Agricultural | 21 | 4.5% |
| Physical & Health Sciences | 10 | 2.1% |
| Psychology | 0 | 0.0% |
| Social Sciences | 3 | 0.6% |
| Engineering | 24 | 5.1% |
| Multidisciplinary Studies | 0 | 0.0% |
| Science & Technology | 30 | 6.4% |
| Business | 73 | 15.5% |
| Education | 49 | 10.4% |
| Literature & Languages | 13 | 2.8% |
| Liberal Arts & History | 26 | 5.5% |
| Visual & Performing Arts | 53 | 11.3% |
| Communications | 44 | 9.4% |
| Arts & Humanities | 37 | 7.9% |
| Total | 470 | 100.0% |
Transportation & Commute in Clarkesville
Vehicle Availability by Sex in Clarkesville
The most prevalent vehicle ownership categories in Clarkesville are males with 2 vehicles (157, accounting for 45.4%) and females with 2 vehicles (98, making up 52.3%).
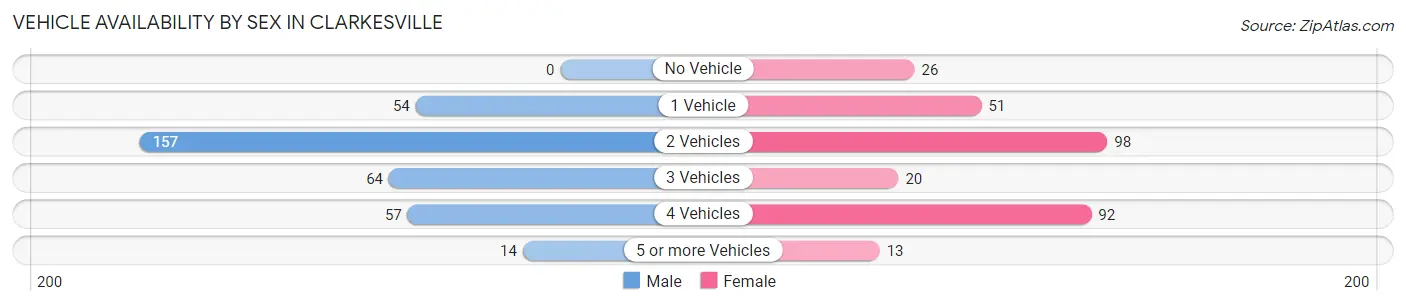
| Vehicles Available | Male | Female |
| No Vehicle | 0 (0.0%) | 26 (8.7%) |
| 1 Vehicle | 54 (15.6%) | 51 (17.0%) |
| 2 Vehicles | 157 (45.4%) | 98 (32.7%) |
| 3 Vehicles | 64 (18.5%) | 20 (6.7%) |
| 4 Vehicles | 57 (16.5%) | 92 (30.7%) |
| 5 or more Vehicles | 14 (4.1%) | 13 (4.3%) |
| Total | 346 (100.0%) | 300 (100.0%) |
Commute Time in Clarkesville
The most frequently occuring commute durations in Clarkesville are 5 to 9 minutes (125 commuters, 20.5%), 10 to 14 minutes (107 commuters, 17.5%), and 15 to 19 minutes (96 commuters, 15.7%).
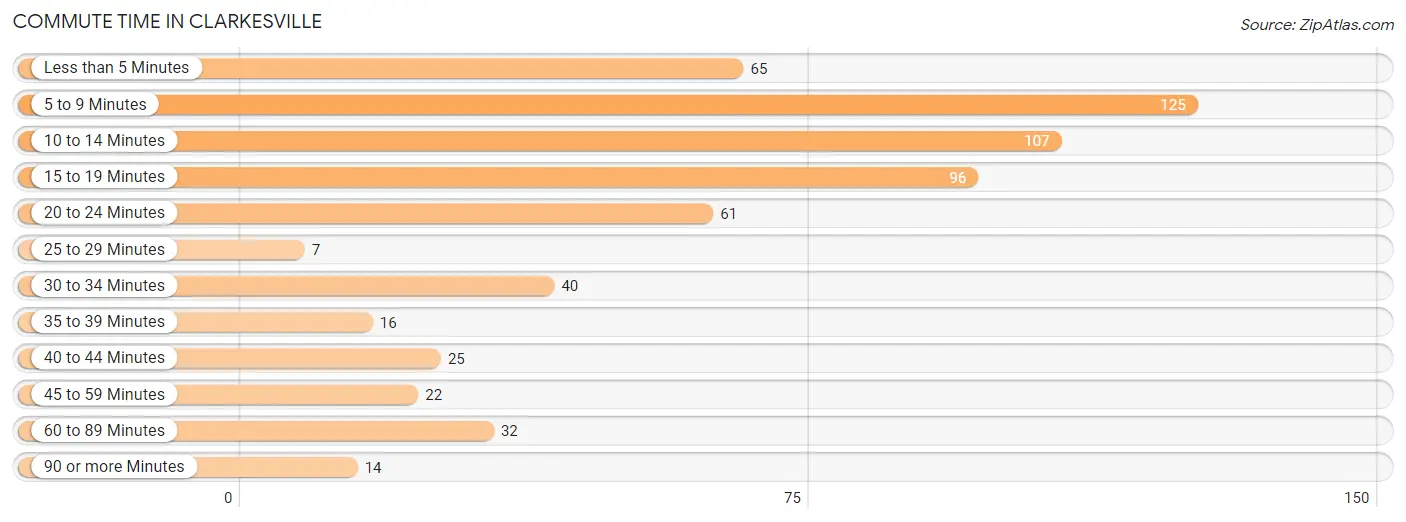
| Commute Time | # Commuters | % Commuters |
| Less than 5 Minutes | 65 | 10.7% |
| 5 to 9 Minutes | 125 | 20.5% |
| 10 to 14 Minutes | 107 | 17.5% |
| 15 to 19 Minutes | 96 | 15.7% |
| 20 to 24 Minutes | 61 | 10.0% |
| 25 to 29 Minutes | 7 | 1.1% |
| 30 to 34 Minutes | 40 | 6.6% |
| 35 to 39 Minutes | 16 | 2.6% |
| 40 to 44 Minutes | 25 | 4.1% |
| 45 to 59 Minutes | 22 | 3.6% |
| 60 to 89 Minutes | 32 | 5.2% |
| 90 or more Minutes | 14 | 2.3% |
Commute Time by Sex in Clarkesville
The most common commute times in Clarkesville are 5 to 9 minutes (74 commuters, 22.4%) for males and 10 to 14 minutes (90 commuters, 32.3%) for females.
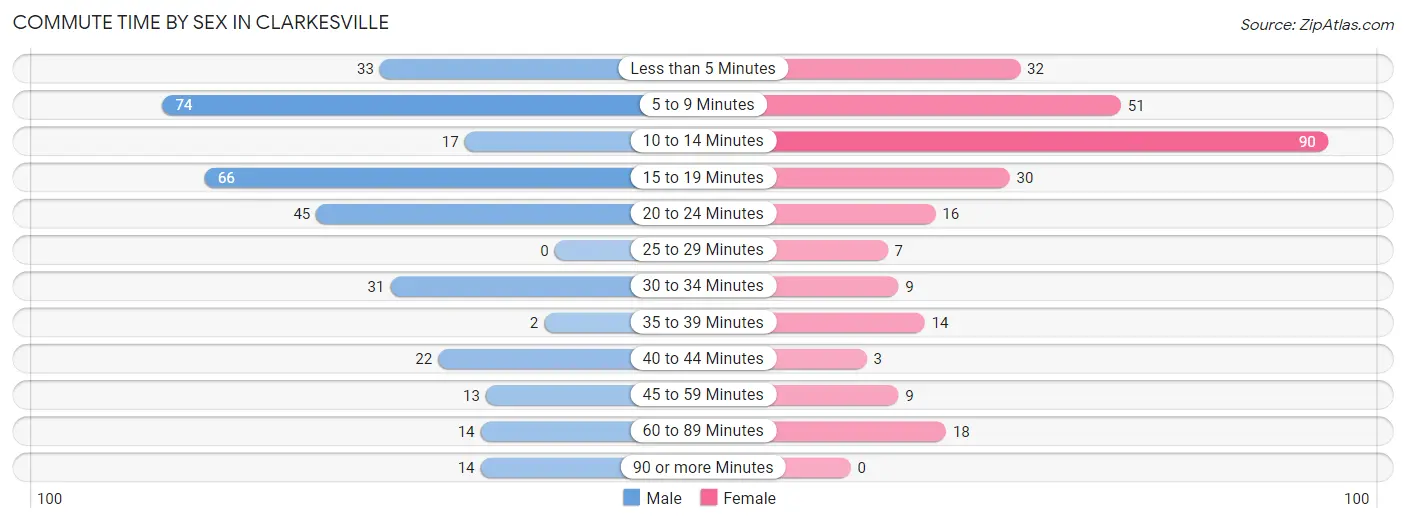
| Commute Time | Male | Female |
| Less than 5 Minutes | 33 (10.0%) | 32 (11.5%) |
| 5 to 9 Minutes | 74 (22.4%) | 51 (18.3%) |
| 10 to 14 Minutes | 17 (5.1%) | 90 (32.3%) |
| 15 to 19 Minutes | 66 (19.9%) | 30 (10.7%) |
| 20 to 24 Minutes | 45 (13.6%) | 16 (5.7%) |
| 25 to 29 Minutes | 0 (0.0%) | 7 (2.5%) |
| 30 to 34 Minutes | 31 (9.4%) | 9 (3.2%) |
| 35 to 39 Minutes | 2 (0.6%) | 14 (5.0%) |
| 40 to 44 Minutes | 22 (6.7%) | 3 (1.1%) |
| 45 to 59 Minutes | 13 (3.9%) | 9 (3.2%) |
| 60 to 89 Minutes | 14 (4.2%) | 18 (6.5%) |
| 90 or more Minutes | 14 (4.2%) | 0 (0.0%) |
Time of Departure to Work by Sex in Clarkesville
The most frequent times of departure to work in Clarkesville are 7:30 AM to 7:59 AM (46, 13.9%) for males and 8:00 AM to 8:29 AM (65, 23.3%) for females.
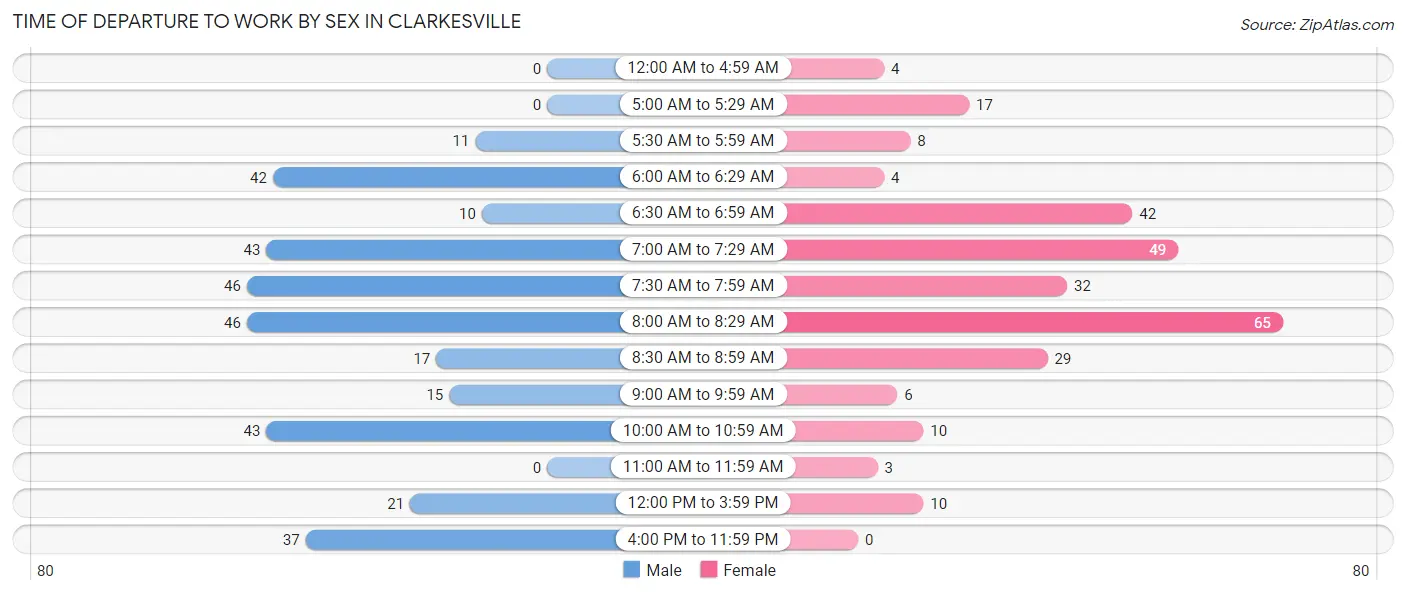
| Time of Departure | Male | Female |
| 12:00 AM to 4:59 AM | 0 (0.0%) | 4 (1.4%) |
| 5:00 AM to 5:29 AM | 0 (0.0%) | 17 (6.1%) |
| 5:30 AM to 5:59 AM | 11 (3.3%) | 8 (2.9%) |
| 6:00 AM to 6:29 AM | 42 (12.7%) | 4 (1.4%) |
| 6:30 AM to 6:59 AM | 10 (3.0%) | 42 (15.0%) |
| 7:00 AM to 7:29 AM | 43 (13.0%) | 49 (17.6%) |
| 7:30 AM to 7:59 AM | 46 (13.9%) | 32 (11.5%) |
| 8:00 AM to 8:29 AM | 46 (13.9%) | 65 (23.3%) |
| 8:30 AM to 8:59 AM | 17 (5.1%) | 29 (10.4%) |
| 9:00 AM to 9:59 AM | 15 (4.5%) | 6 (2.1%) |
| 10:00 AM to 10:59 AM | 43 (13.0%) | 10 (3.6%) |
| 11:00 AM to 11:59 AM | 0 (0.0%) | 3 (1.1%) |
| 12:00 PM to 3:59 PM | 21 (6.3%) | 10 (3.6%) |
| 4:00 PM to 11:59 PM | 37 (11.2%) | 0 (0.0%) |
| Total | 331 (100.0%) | 279 (100.0%) |
Housing Occupancy in Clarkesville
Occupancy by Ownership in Clarkesville
Of the total 775 dwellings in Clarkesville, owner-occupied units account for 503 (64.9%), while renter-occupied units make up 272 (35.1%).
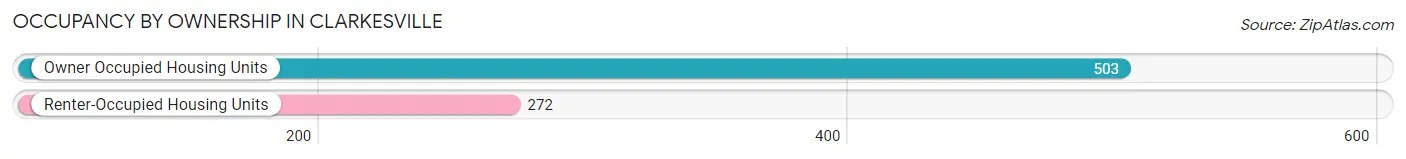
| Occupancy | # Housing Units | % Housing Units |
| Owner Occupied Housing Units | 503 | 64.9% |
| Renter-Occupied Housing Units | 272 | 35.1% |
| Total Occupied Housing Units | 775 | 100.0% |
Occupancy by Household Size in Clarkesville
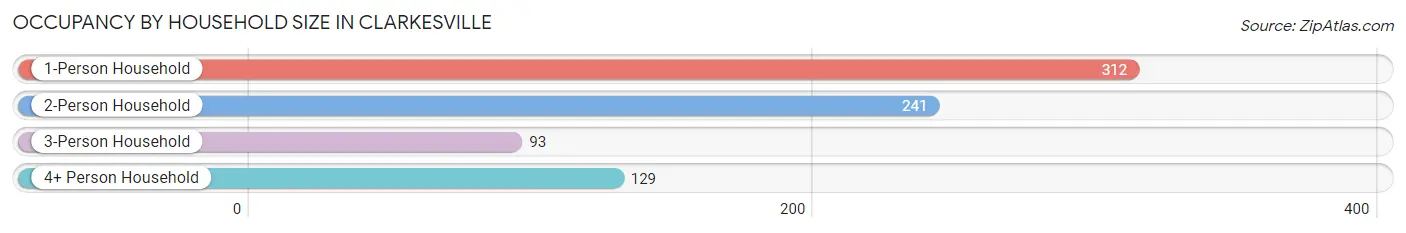
| Household Size | # Housing Units | % Housing Units |
| 1-Person Household | 312 | 40.3% |
| 2-Person Household | 241 | 31.1% |
| 3-Person Household | 93 | 12.0% |
| 4+ Person Household | 129 | 16.7% |
| Total Housing Units | 775 | 100.0% |
Occupancy by Ownership by Household Size in Clarkesville
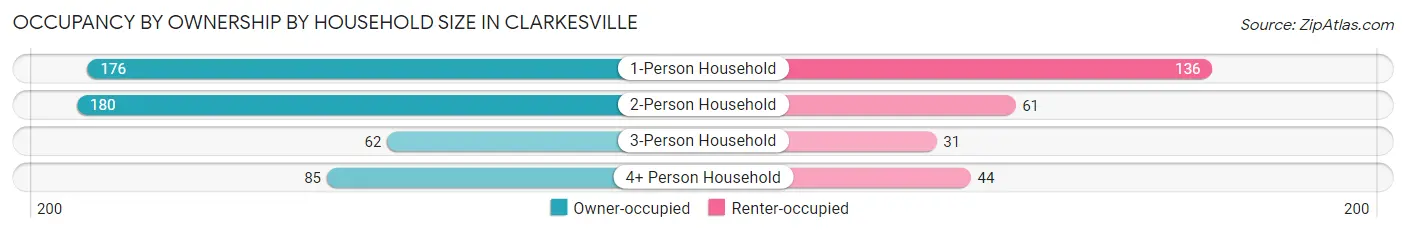
| Household Size | Owner-occupied | Renter-occupied |
| 1-Person Household | 176 (56.4%) | 136 (43.6%) |
| 2-Person Household | 180 (74.7%) | 61 (25.3%) |
| 3-Person Household | 62 (66.7%) | 31 (33.3%) |
| 4+ Person Household | 85 (65.9%) | 44 (34.1%) |
| Total Housing Units | 503 (64.9%) | 272 (35.1%) |
Occupancy by Educational Attainment in Clarkesville
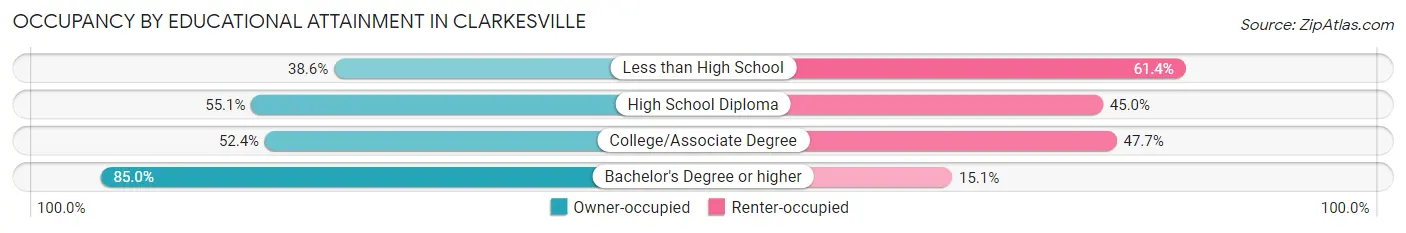
| Household Size | Owner-occupied | Renter-occupied |
| Less than High School | 34 (38.6%) | 54 (61.4%) |
| High School Diploma | 109 (55.0%) | 89 (45.0%) |
| College/Associate Degree | 89 (52.3%) | 81 (47.6%) |
| Bachelor's Degree or higher | 271 (85.0%) | 48 (15.0%) |
Occupancy by Age of Householder in Clarkesville
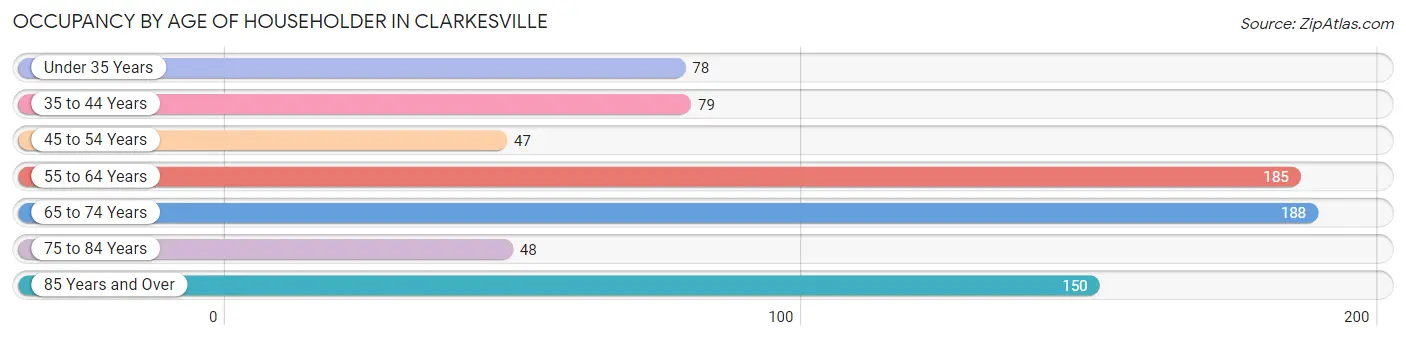
| Age Bracket | # Households | % Households |
| Under 35 Years | 78 | 10.1% |
| 35 to 44 Years | 79 | 10.2% |
| 45 to 54 Years | 47 | 6.1% |
| 55 to 64 Years | 185 | 23.9% |
| 65 to 74 Years | 188 | 24.3% |
| 75 to 84 Years | 48 | 6.2% |
| 85 Years and Over | 150 | 19.4% |
| Total | 775 | 100.0% |
Housing Finances in Clarkesville
Median Income by Occupancy in Clarkesville
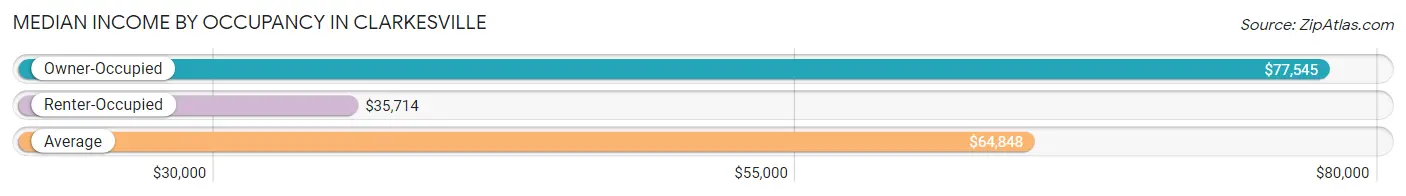
| Occupancy Type | # Households | Median Income |
| Owner-Occupied | 503 (64.9%) | $77,545 |
| Renter-Occupied | 272 (35.1%) | $35,714 |
| Average | 775 (100.0%) | $64,848 |
Occupancy by Householder Income Bracket in Clarkesville
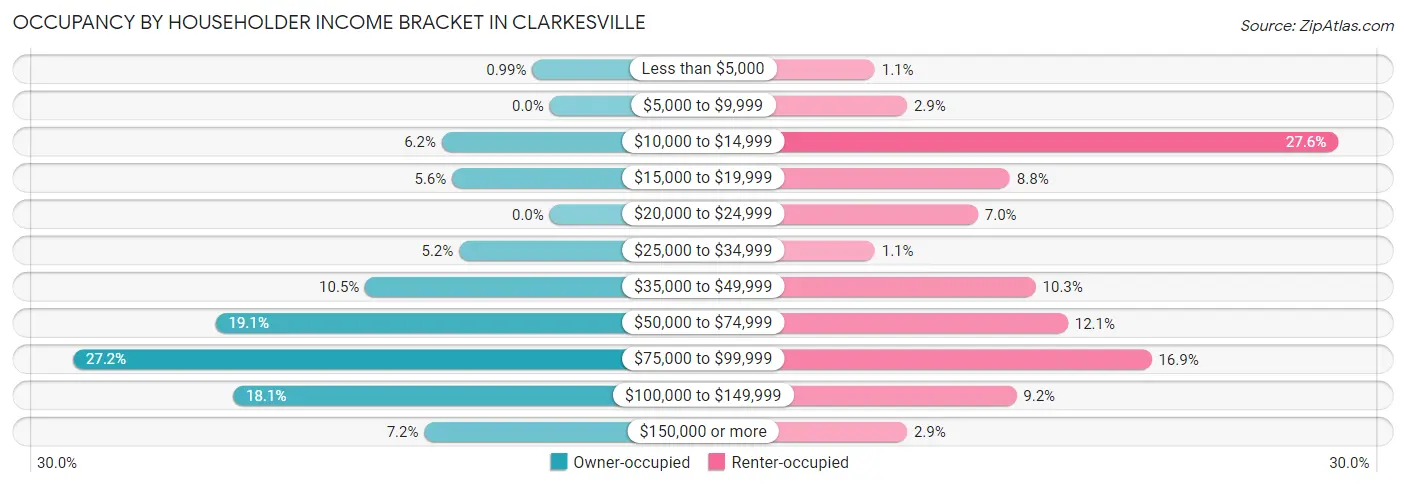
| Income Bracket | Owner-occupied | Renter-occupied |
| Less than $5,000 | 5 (1.0%) | 3 (1.1%) |
| $5,000 to $9,999 | 0 (0.0%) | 8 (2.9%) |
| $10,000 to $14,999 | 31 (6.2%) | 75 (27.6%) |
| $15,000 to $19,999 | 28 (5.6%) | 24 (8.8%) |
| $20,000 to $24,999 | 0 (0.0%) | 19 (7.0%) |
| $25,000 to $34,999 | 26 (5.2%) | 3 (1.1%) |
| $35,000 to $49,999 | 53 (10.5%) | 28 (10.3%) |
| $50,000 to $74,999 | 96 (19.1%) | 33 (12.1%) |
| $75,000 to $99,999 | 137 (27.2%) | 46 (16.9%) |
| $100,000 to $149,999 | 91 (18.1%) | 25 (9.2%) |
| $150,000 or more | 36 (7.2%) | 8 (2.9%) |
| Total | 503 (100.0%) | 272 (100.0%) |
Monthly Housing Cost Tiers in Clarkesville
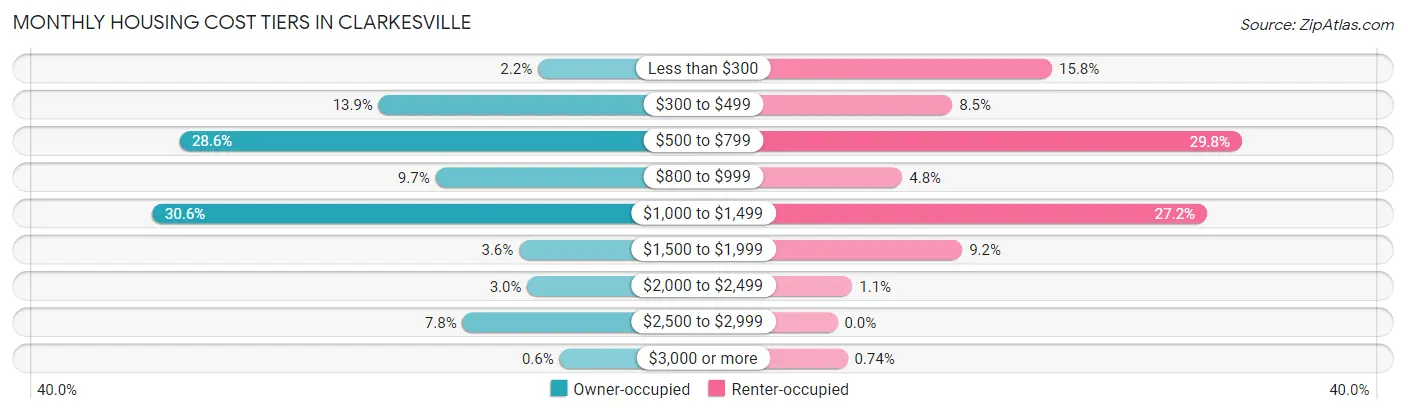
| Monthly Cost | Owner-occupied | Renter-occupied |
| Less than $300 | 11 (2.2%) | 43 (15.8%) |
| $300 to $499 | 70 (13.9%) | 23 (8.5%) |
| $500 to $799 | 144 (28.6%) | 81 (29.8%) |
| $800 to $999 | 49 (9.7%) | 13 (4.8%) |
| $1,000 to $1,499 | 154 (30.6%) | 74 (27.2%) |
| $1,500 to $1,999 | 18 (3.6%) | 25 (9.2%) |
| $2,000 to $2,499 | 15 (3.0%) | 3 (1.1%) |
| $2,500 to $2,999 | 39 (7.7%) | 0 (0.0%) |
| $3,000 or more | 3 (0.6%) | 2 (0.7%) |
| Total | 503 (100.0%) | 272 (100.0%) |
Physical Housing Characteristics in Clarkesville
Housing Structures in Clarkesville
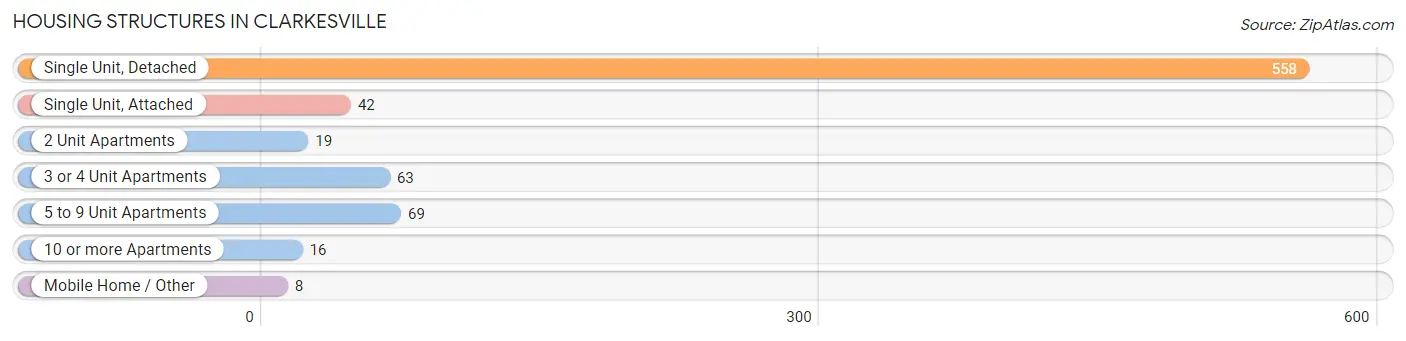
| Structure Type | # Housing Units | % Housing Units |
| Single Unit, Detached | 558 | 72.0% |
| Single Unit, Attached | 42 | 5.4% |
| 2 Unit Apartments | 19 | 2.5% |
| 3 or 4 Unit Apartments | 63 | 8.1% |
| 5 to 9 Unit Apartments | 69 | 8.9% |
| 10 or more Apartments | 16 | 2.1% |
| Mobile Home / Other | 8 | 1.0% |
| Total | 775 | 100.0% |
Housing Structures by Occupancy in Clarkesville
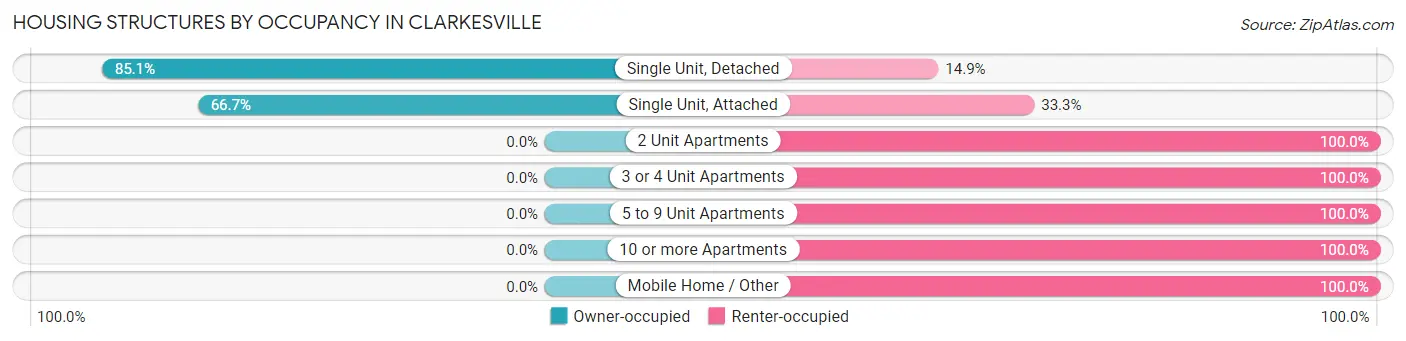
| Structure Type | Owner-occupied | Renter-occupied |
| Single Unit, Detached | 475 (85.1%) | 83 (14.9%) |
| Single Unit, Attached | 28 (66.7%) | 14 (33.3%) |
| 2 Unit Apartments | 0 (0.0%) | 19 (100.0%) |
| 3 or 4 Unit Apartments | 0 (0.0%) | 63 (100.0%) |
| 5 to 9 Unit Apartments | 0 (0.0%) | 69 (100.0%) |
| 10 or more Apartments | 0 (0.0%) | 16 (100.0%) |
| Mobile Home / Other | 0 (0.0%) | 8 (100.0%) |
| Total | 503 (64.9%) | 272 (35.1%) |
Housing Structures by Number of Rooms in Clarkesville
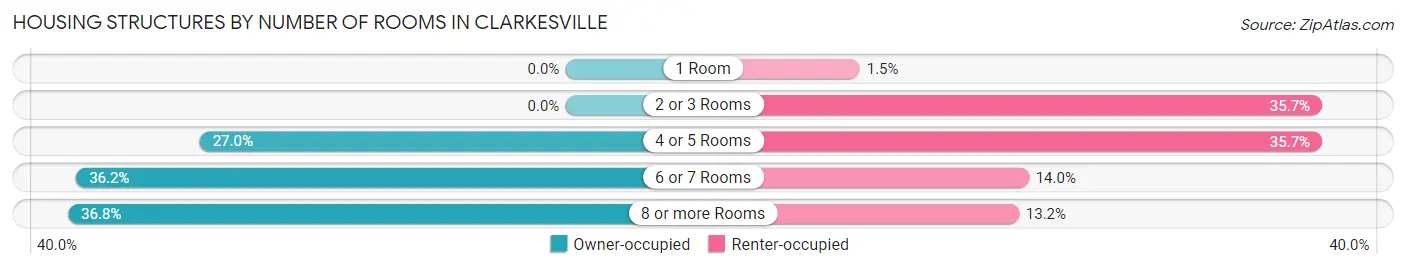
| Number of Rooms | Owner-occupied | Renter-occupied |
| 1 Room | 0 (0.0%) | 4 (1.5%) |
| 2 or 3 Rooms | 0 (0.0%) | 97 (35.7%) |
| 4 or 5 Rooms | 136 (27.0%) | 97 (35.7%) |
| 6 or 7 Rooms | 182 (36.2%) | 38 (14.0%) |
| 8 or more Rooms | 185 (36.8%) | 36 (13.2%) |
| Total | 503 (100.0%) | 272 (100.0%) |
Housing Structure by Heating Type in Clarkesville
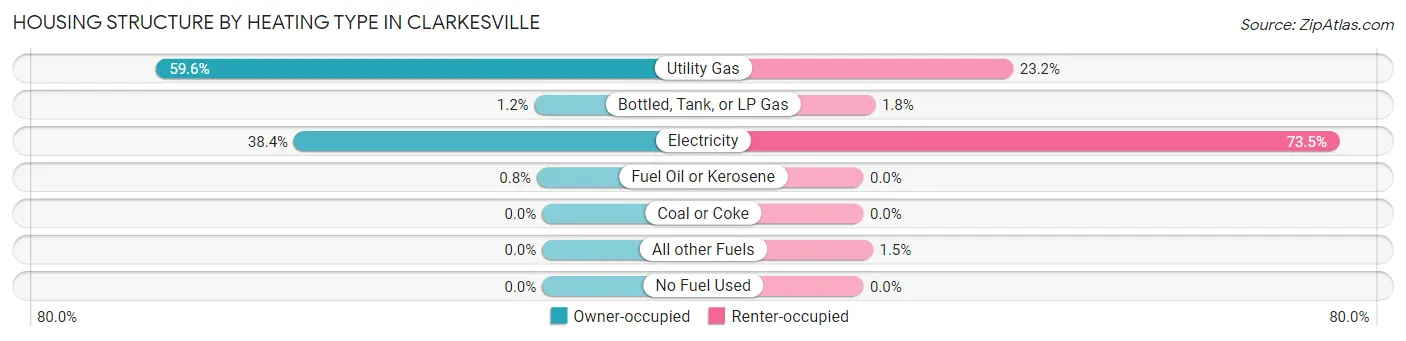
| Heating Type | Owner-occupied | Renter-occupied |
| Utility Gas | 300 (59.6%) | 63 (23.2%) |
| Bottled, Tank, or LP Gas | 6 (1.2%) | 5 (1.8%) |
| Electricity | 193 (38.4%) | 200 (73.5%) |
| Fuel Oil or Kerosene | 4 (0.8%) | 0 (0.0%) |
| Coal or Coke | 0 (0.0%) | 0 (0.0%) |
| All other Fuels | 0 (0.0%) | 4 (1.5%) |
| No Fuel Used | 0 (0.0%) | 0 (0.0%) |
| Total | 503 (100.0%) | 272 (100.0%) |
Household Vehicle Usage in Clarkesville
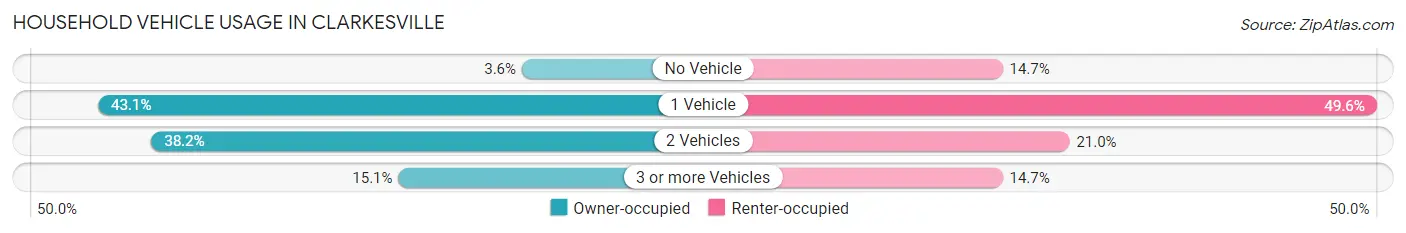
| Vehicles per Household | Owner-occupied | Renter-occupied |
| No Vehicle | 18 (3.6%) | 40 (14.7%) |
| 1 Vehicle | 217 (43.1%) | 135 (49.6%) |
| 2 Vehicles | 192 (38.2%) | 57 (21.0%) |
| 3 or more Vehicles | 76 (15.1%) | 40 (14.7%) |
| Total | 503 (100.0%) | 272 (100.0%) |
Real Estate & Mortgages in Clarkesville
Real Estate and Mortgage Overview in Clarkesville
| Characteristic | Without Mortgage | With Mortgage |
| Housing Units | 220 | 283 |
| Median Property Value | $190,000 | $171,700 |
| Median Household Income | $50,750 | $13 |
| Monthly Housing Costs | $555 | $3 |
| Real Estate Taxes | $1,696 | $3 |
Property Value by Mortgage Status in Clarkesville
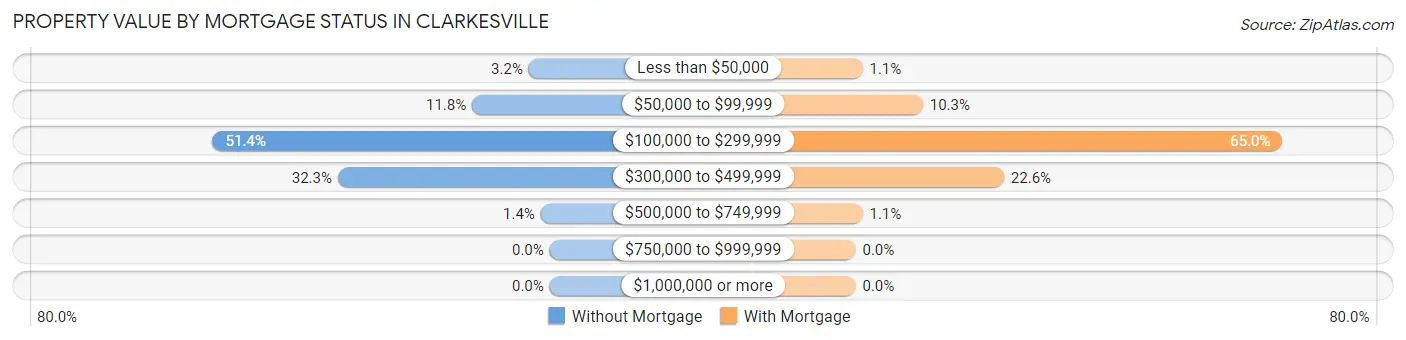
| Property Value | Without Mortgage | With Mortgage |
| Less than $50,000 | 7 (3.2%) | 3 (1.1%) |
| $50,000 to $99,999 | 26 (11.8%) | 29 (10.2%) |
| $100,000 to $299,999 | 113 (51.4%) | 184 (65.0%) |
| $300,000 to $499,999 | 71 (32.3%) | 64 (22.6%) |
| $500,000 to $749,999 | 3 (1.4%) | 3 (1.1%) |
| $750,000 to $999,999 | 0 (0.0%) | 0 (0.0%) |
| $1,000,000 or more | 0 (0.0%) | 0 (0.0%) |
| Total | 220 (100.0%) | 283 (100.0%) |
Household Income by Mortgage Status in Clarkesville
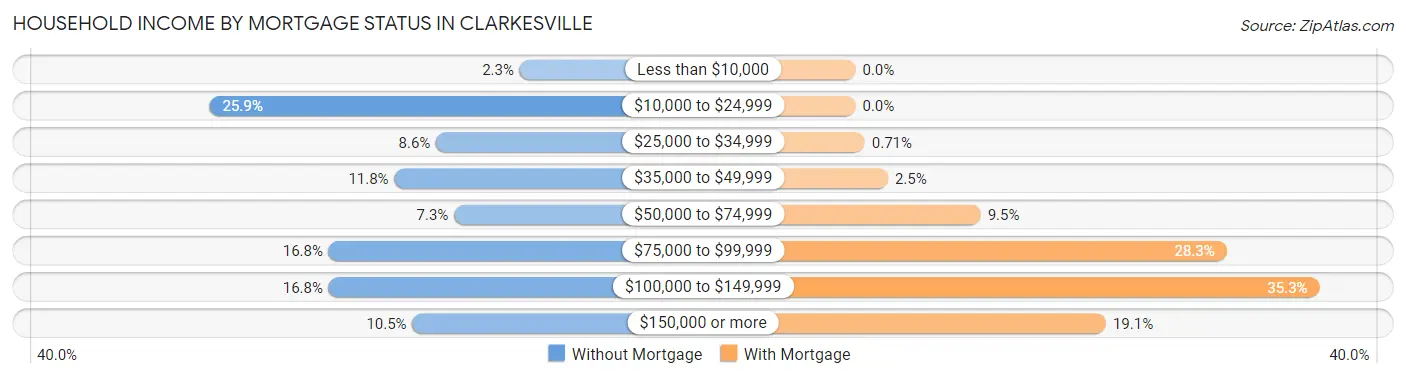
| Household Income | Without Mortgage | With Mortgage |
| Less than $10,000 | 5 (2.3%) | 0 (0.0%) |
| $10,000 to $24,999 | 57 (25.9%) | 0 (0.0%) |
| $25,000 to $34,999 | 19 (8.6%) | 2 (0.7%) |
| $35,000 to $49,999 | 26 (11.8%) | 7 (2.5%) |
| $50,000 to $74,999 | 16 (7.3%) | 27 (9.5%) |
| $75,000 to $99,999 | 37 (16.8%) | 80 (28.3%) |
| $100,000 to $149,999 | 37 (16.8%) | 100 (35.3%) |
| $150,000 or more | 23 (10.4%) | 54 (19.1%) |
| Total | 220 (100.0%) | 283 (100.0%) |
Property Value to Household Income Ratio in Clarkesville
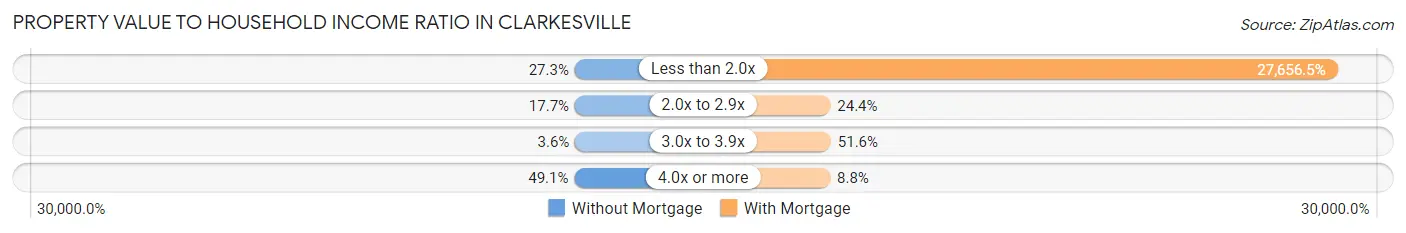
| Value-to-Income Ratio | Without Mortgage | With Mortgage |
| Less than 2.0x | 60 (27.3%) | 78,268 (27,656.5%) |
| 2.0x to 2.9x | 39 (17.7%) | 69 (24.4%) |
| 3.0x to 3.9x | 8 (3.6%) | 146 (51.6%) |
| 4.0x or more | 108 (49.1%) | 25 (8.8%) |
| Total | 220 (100.0%) | 283 (100.0%) |
Real Estate Taxes by Mortgage Status in Clarkesville
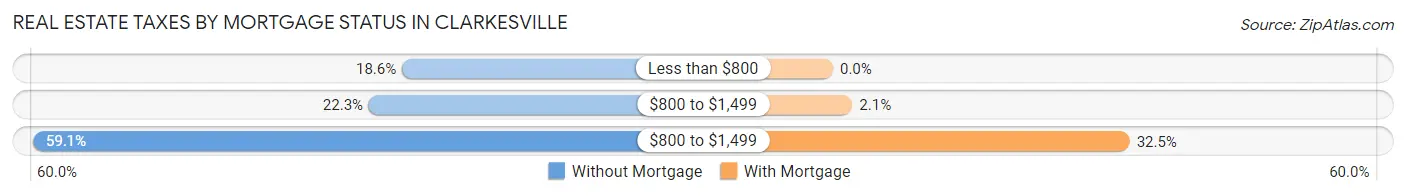
| Property Taxes | Without Mortgage | With Mortgage |
| Less than $800 | 41 (18.6%) | 0 (0.0%) |
| $800 to $1,499 | 49 (22.3%) | 6 (2.1%) |
| $800 to $1,499 | 130 (59.1%) | 92 (32.5%) |
| Total | 220 (100.0%) | 283 (100.0%) |
Health & Disability in Clarkesville
Health Insurance Coverage by Age in Clarkesville
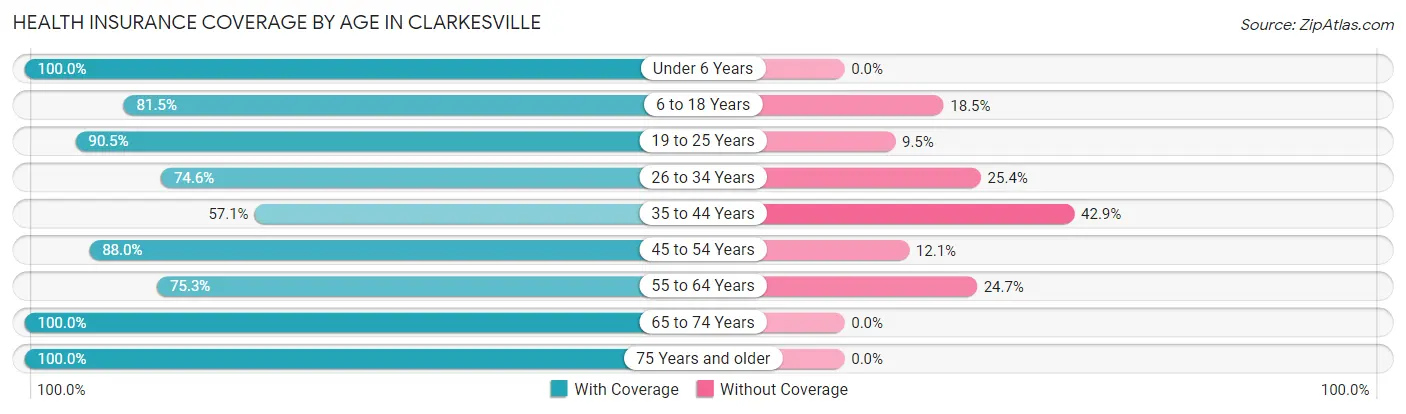
| Age Bracket | With Coverage | Without Coverage |
| Under 6 Years | 159 (100.0%) | 0 (0.0%) |
| 6 to 18 Years | 181 (81.5%) | 41 (18.5%) |
| 19 to 25 Years | 67 (90.5%) | 7 (9.5%) |
| 26 to 34 Years | 129 (74.6%) | 44 (25.4%) |
| 35 to 44 Years | 104 (57.1%) | 78 (42.9%) |
| 45 to 54 Years | 146 (87.9%) | 20 (12.0%) |
| 55 to 64 Years | 180 (75.3%) | 59 (24.7%) |
| 65 to 74 Years | 302 (100.0%) | 0 (0.0%) |
| 75 Years and older | 266 (100.0%) | 0 (0.0%) |
| Total | 1,534 (86.0%) | 249 (14.0%) |
Health Insurance Coverage by Citizenship Status in Clarkesville
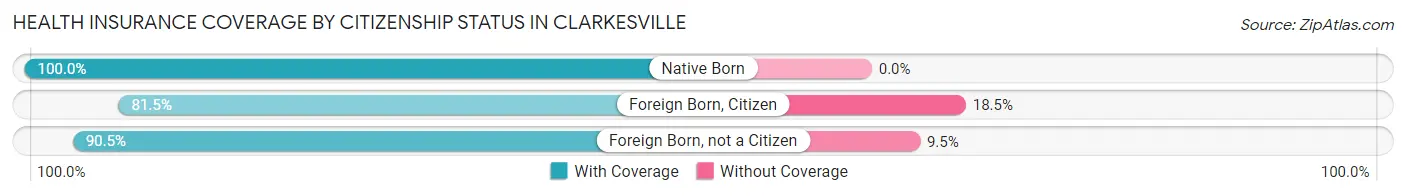
| Citizenship Status | With Coverage | Without Coverage |
| Native Born | 159 (100.0%) | 0 (0.0%) |
| Foreign Born, Citizen | 181 (81.5%) | 41 (18.5%) |
| Foreign Born, not a Citizen | 67 (90.5%) | 7 (9.5%) |
Health Insurance Coverage by Household Income in Clarkesville
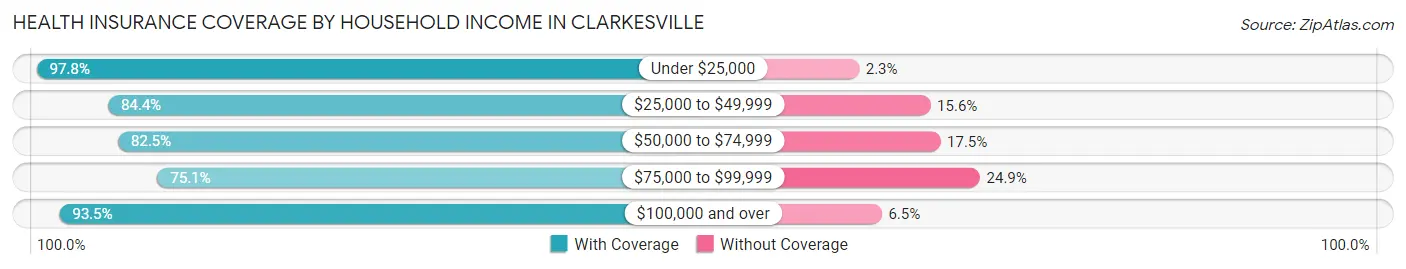
| Household Income | With Coverage | Without Coverage |
| Under $25,000 | 217 (97.8%) | 5 (2.2%) |
| $25,000 to $49,999 | 270 (84.4%) | 50 (15.6%) |
| $50,000 to $74,999 | 269 (82.5%) | 57 (17.5%) |
| $75,000 to $99,999 | 320 (75.1%) | 106 (24.9%) |
| $100,000 and over | 446 (93.5%) | 31 (6.5%) |
Public vs Private Health Insurance Coverage by Age in Clarkesville
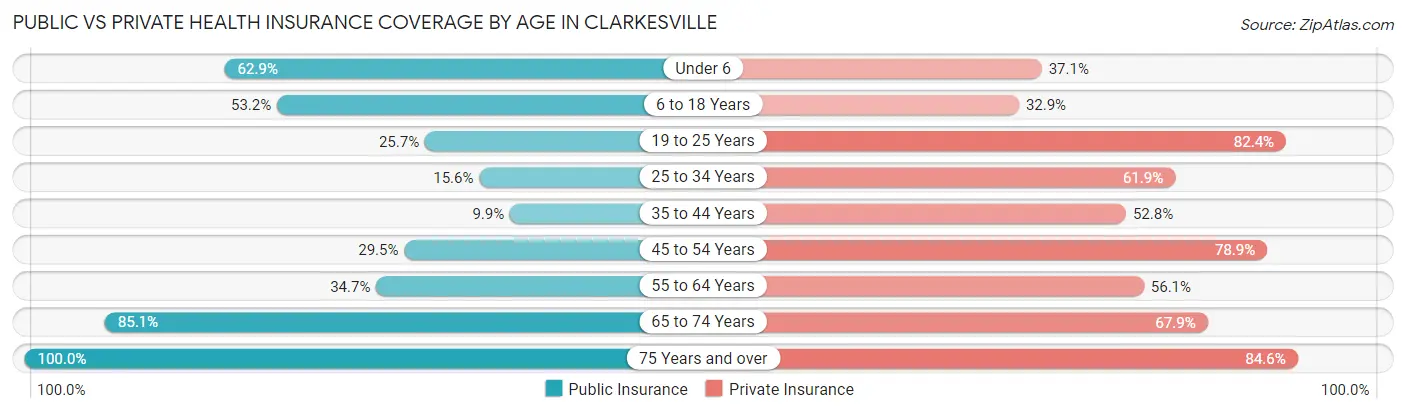
| Age Bracket | Public Insurance | Private Insurance |
| Under 6 | 100 (62.9%) | 59 (37.1%) |
| 6 to 18 Years | 118 (53.1%) | 73 (32.9%) |
| 19 to 25 Years | 19 (25.7%) | 61 (82.4%) |
| 25 to 34 Years | 27 (15.6%) | 107 (61.9%) |
| 35 to 44 Years | 18 (9.9%) | 96 (52.7%) |
| 45 to 54 Years | 49 (29.5%) | 131 (78.9%) |
| 55 to 64 Years | 83 (34.7%) | 134 (56.1%) |
| 65 to 74 Years | 257 (85.1%) | 205 (67.9%) |
| 75 Years and over | 266 (100.0%) | 225 (84.6%) |
| Total | 937 (52.5%) | 1,091 (61.2%) |
Disability Status by Sex by Age in Clarkesville
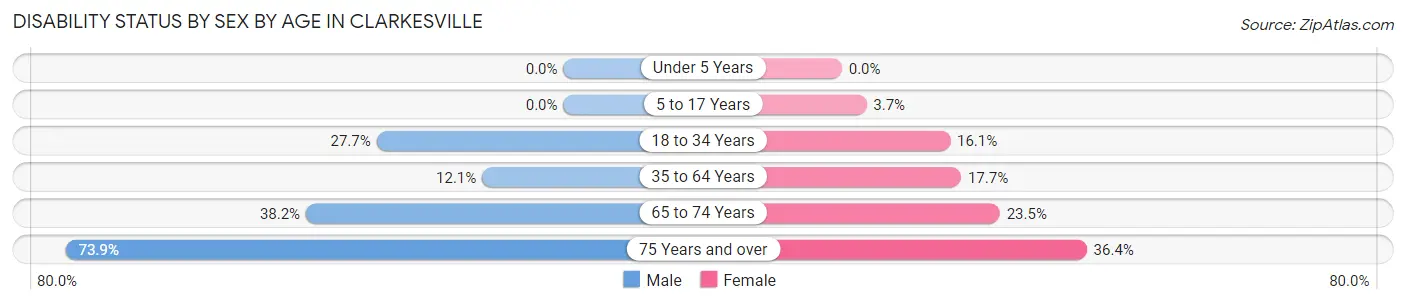
| Age Bracket | Male | Female |
| Under 5 Years | 0 (0.0%) | 0 (0.0%) |
| 5 to 17 Years | 0 (0.0%) | 5 (3.6%) |
| 18 to 34 Years | 38 (27.7%) | 18 (16.1%) |
| 35 to 64 Years | 34 (12.1%) | 54 (17.7%) |
| 65 to 74 Years | 60 (38.2%) | 34 (23.4%) |
| 75 Years and over | 34 (73.9%) | 80 (36.4%) |
Disability Class by Sex by Age in Clarkesville
Disability Class: Hearing Difficulty
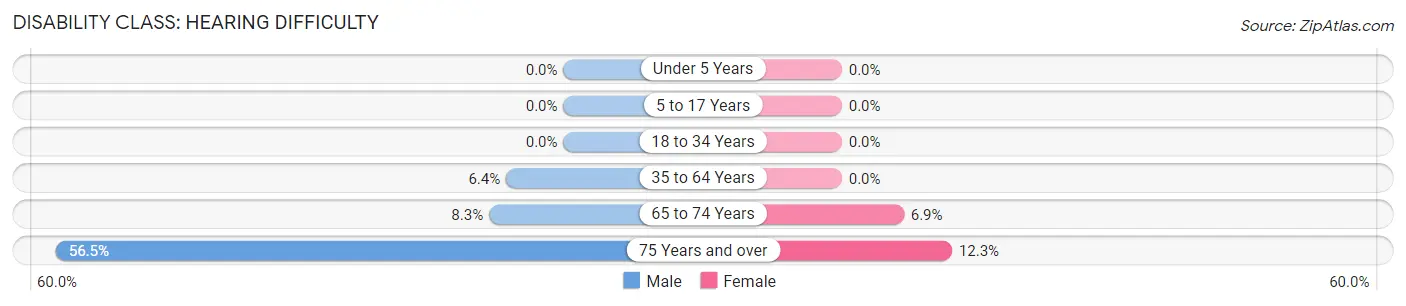
| Age Bracket | Male | Female |
| Under 5 Years | 0 (0.0%) | 0 (0.0%) |
| 5 to 17 Years | 0 (0.0%) | 0 (0.0%) |
| 18 to 34 Years | 0 (0.0%) | 0 (0.0%) |
| 35 to 64 Years | 18 (6.4%) | 0 (0.0%) |
| 65 to 74 Years | 13 (8.3%) | 10 (6.9%) |
| 75 Years and over | 26 (56.5%) | 27 (12.3%) |
Disability Class: Vision Difficulty
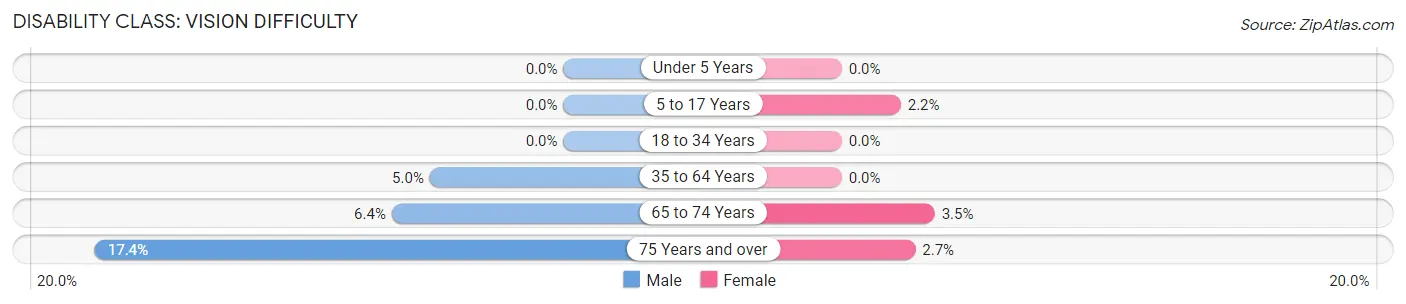
| Age Bracket | Male | Female |
| Under 5 Years | 0 (0.0%) | 0 (0.0%) |
| 5 to 17 Years | 0 (0.0%) | 3 (2.2%) |
| 18 to 34 Years | 0 (0.0%) | 0 (0.0%) |
| 35 to 64 Years | 14 (5.0%) | 0 (0.0%) |
| 65 to 74 Years | 10 (6.4%) | 5 (3.5%) |
| 75 Years and over | 8 (17.4%) | 6 (2.7%) |
Disability Class: Cognitive Difficulty
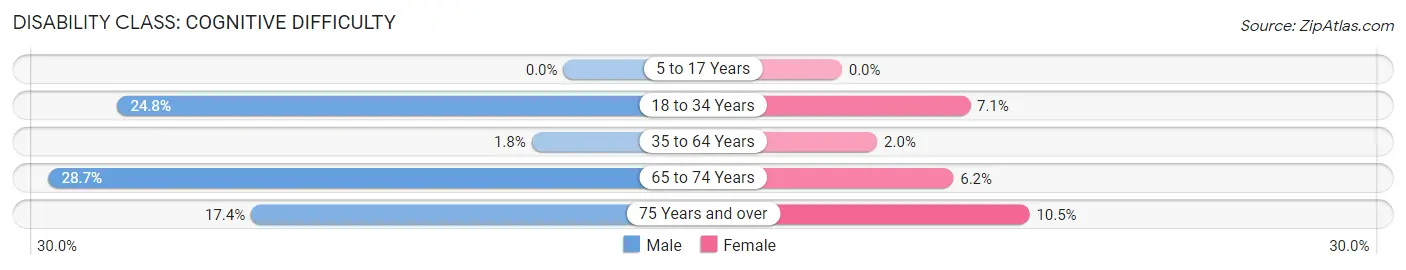
| Age Bracket | Male | Female |
| 5 to 17 Years | 0 (0.0%) | 0 (0.0%) |
| 18 to 34 Years | 34 (24.8%) | 8 (7.1%) |
| 35 to 64 Years | 5 (1.8%) | 6 (2.0%) |
| 65 to 74 Years | 45 (28.7%) | 9 (6.2%) |
| 75 Years and over | 8 (17.4%) | 23 (10.4%) |
Disability Class: Ambulatory Difficulty
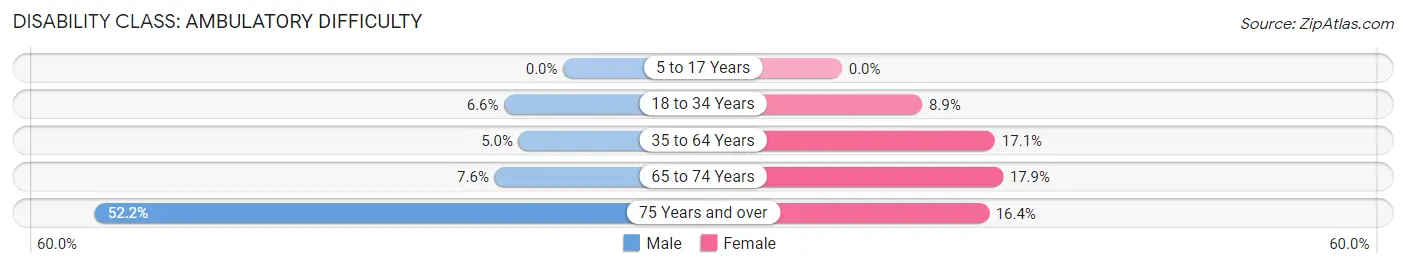
| Age Bracket | Male | Female |
| 5 to 17 Years | 0 (0.0%) | 0 (0.0%) |
| 18 to 34 Years | 9 (6.6%) | 10 (8.9%) |
| 35 to 64 Years | 14 (5.0%) | 52 (17.1%) |
| 65 to 74 Years | 12 (7.6%) | 26 (17.9%) |
| 75 Years and over | 24 (52.2%) | 36 (16.4%) |
Disability Class: Self-Care Difficulty
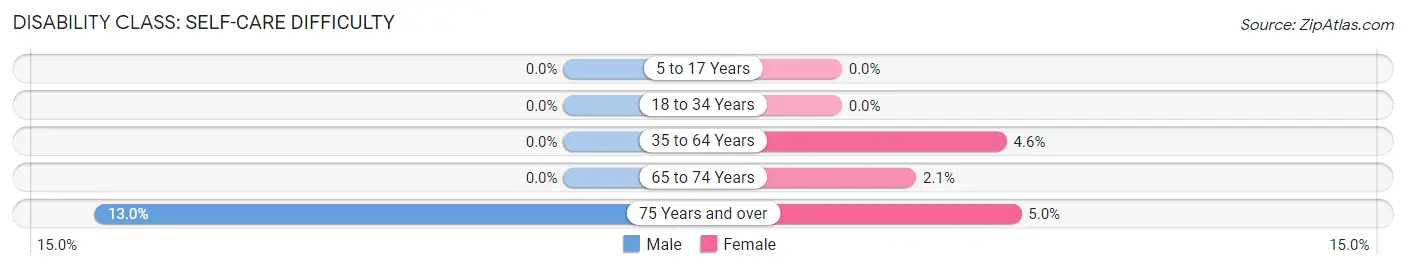
| Age Bracket | Male | Female |
| 5 to 17 Years | 0 (0.0%) | 0 (0.0%) |
| 18 to 34 Years | 0 (0.0%) | 0 (0.0%) |
| 35 to 64 Years | 0 (0.0%) | 14 (4.6%) |
| 65 to 74 Years | 0 (0.0%) | 3 (2.1%) |
| 75 Years and over | 6 (13.0%) | 11 (5.0%) |
Technology Access in Clarkesville
Computing Device Access in Clarkesville
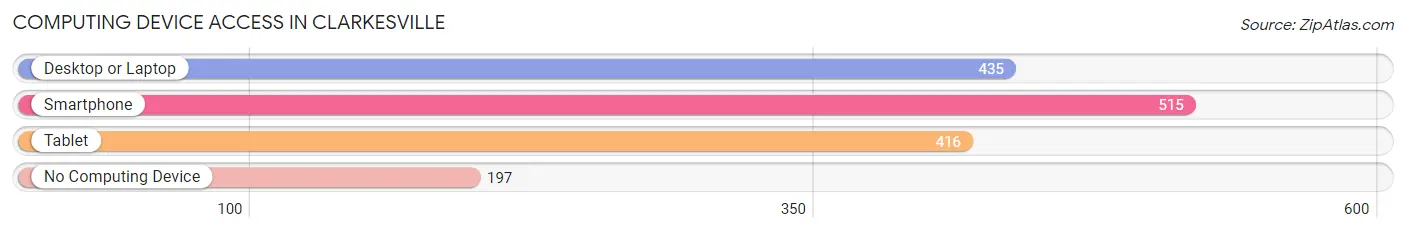
| Device Type | # Households | % Households |
| Desktop or Laptop | 435 | 56.1% |
| Smartphone | 515 | 66.4% |
| Tablet | 416 | 53.7% |
| No Computing Device | 197 | 25.4% |
| Total | 775 | 100.0% |
Internet Access in Clarkesville
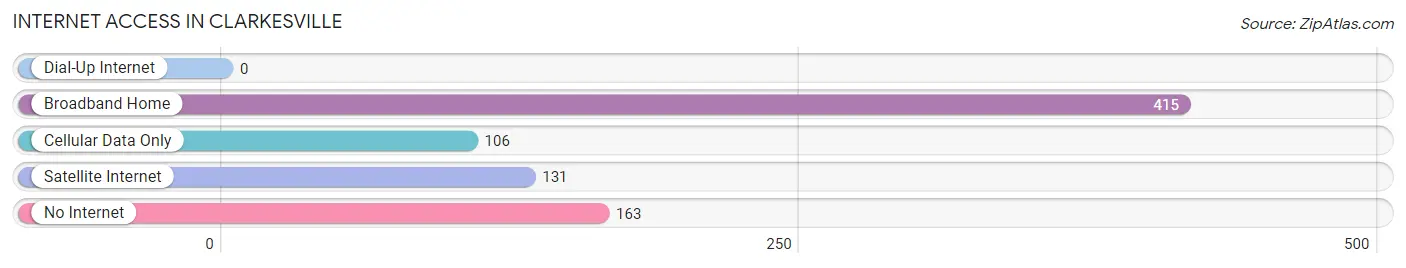
| Internet Type | # Households | % Households |
| Dial-Up Internet | 0 | 0.0% |
| Broadband Home | 415 | 53.5% |
| Cellular Data Only | 106 | 13.7% |
| Satellite Internet | 131 | 16.9% |
| No Internet | 163 | 21.0% |
| Total | 775 | 100.0% |
Clarkesville Summary
History
Clarkesville, Georgia is a small city located in Habersham County in the northeastern part of the state. It was founded in 1821 and named after John C. Clark, a prominent local politician. The city was originally a trading post and was the county seat of Habersham County until the county seat was moved to nearby Cornelia in 1873.
The city was an important stop on the Gainesville, Jefferson and Southern Railroad, which was built in the late 19th century. The railroad brought economic growth to the area and helped to spur the development of the city. The city was also home to a number of mills, including a cotton mill, a woolen mill, and a grist mill.
In the early 20th century, the city was a popular tourist destination, with many visitors coming to enjoy the natural beauty of the area. The city was also home to a number of resorts, including the famous Lake Russell Resort.
The city was also home to a number of prominent figures, including the author and poet Sidney Lanier, who was born in Clarkesville in 1842. The city was also home to the first African-American college in the state, Paine College, which was founded in 1882.
Geography
Clarkesville is located in the foothills of the Blue Ridge Mountains in the northeastern part of the state. The city is situated at an elevation of 1,400 feet and is surrounded by the Chattahoochee National Forest. The city is located near the headwaters of the Chattahoochee River and is approximately 30 miles from the city of Gainesville.
The city has a total area of 4.2 square miles, all of which is land. The city is located in a humid subtropical climate zone and experiences hot, humid summers and mild winters.
Economy
The economy of Clarkesville is largely based on tourism and manufacturing. The city is home to a number of tourist attractions, including the Lake Russell Resort, the Sidney Lanier Cottage, and the Paine College Historic District. The city is also home to a number of manufacturing companies, including a paper mill, a furniture factory, and a plastics factory.
The city is also home to a number of retail stores, restaurants, and other businesses. The city is served by the Habersham County Airport, which is located just outside of the city limits.
Demographics
As of the 2010 census, the population of Clarkesville was 4,719. The racial makeup of the city was 87.3% White, 8.2% African American, 0.3% Native American, 0.7% Asian, 0.1% Pacific Islander, 1.2% from other races, and 2.4% from two or more races. Hispanic or Latino of any race were 3.2% of the population.
The median household income in Clarkesville was $37,917, and the median family income was $45,938. The per capita income for the city was $20,845. About 11.3% of families and 14.2% of the population were below the poverty line, including 19.2% of those under age 18 and 8.2% of those age 65 or over.
Common Questions
What is Per Capita Income in Clarkesville?
Per Capita income in Clarkesville is $28,858.
What is the Median Family Income in Clarkesville?
Median Family Income in Clarkesville is $81,029.
What is the Median Household income in Clarkesville?
Median Household Income in Clarkesville is $64,848.
What is Income or Wage Gap in Clarkesville?
Income or Wage Gap in Clarkesville is 32.1%.
Women in Clarkesville earn 67.9 cents for every dollar earned by a man.
What is Inequality or Gini Index in Clarkesville?
Inequality or Gini Index in Clarkesville is 0.40.
What is the Total Population of Clarkesville?
Total Population of Clarkesville is 1,885.
What is the Total Male Population of Clarkesville?
Total Male Population of Clarkesville is 810.
What is the Total Female Population of Clarkesville?
Total Female Population of Clarkesville is 1,075.
What is the Ratio of Males per 100 Females in Clarkesville?
There are 75.35 Males per 100 Females in Clarkesville.
What is the Ratio of Females per 100 Males in Clarkesville?
There are 132.72 Females per 100 Males in Clarkesville.
What is the Median Population Age in Clarkesville?
Median Population Age in Clarkesville is 47.4 Years.
What is the Average Family Size in Clarkesville
Average Family Size in Clarkesville is 3.1 People.
What is the Average Household Size in Clarkesville
Average Household Size in Clarkesville is 2.3 People.
How Large is the Labor Force in Clarkesville?
There are 678 People in the Labor Forcein in Clarkesville.
What is the Percentage of People in the Labor Force in Clarkesville?
44.6% of People are in the Labor Force in Clarkesville.
What is the Unemployment Rate in Clarkesville?
Unemployment Rate in Clarkesville is 2.7%.