Cecil, GA Map & Demographics
Cecil Map
Cecil Overview
$18,419
PER CAPITA INCOME
$41,875
AVG FAMILY INCOME
$39,000
AVG HOUSEHOLD INCOME
21.4%
WAGE / INCOME GAP [ % ]
78.6¢/ $1
WAGE / INCOME GAP [ $ ]
0.41
INEQUALITY / GINI INDEX
349
TOTAL POPULATION
175
MALE POPULATION
174
FEMALE POPULATION
100.57
MALES / 100 FEMALES
99.43
FEMALES / 100 MALES
39.8
MEDIAN AGE
3.0
AVG FAMILY SIZE
3.0
AVG HOUSEHOLD SIZE
133
LABOR FORCE [ PEOPLE ]
44.8%
PERCENT IN LABOR FORCE
Cecil Zip Codes
Cecil Area Codes
Income in Cecil
Income Overview in Cecil
Per Capita Income in Cecil is $18,419, while median incomes of families and households are $41,875 and $39,000 respectively.
| Characteristic | Number | Measure |
| Per Capita Income | 349 | $18,419 |
| Median Family Income | 94 | $41,875 |
| Mean Family Income | 94 | $46,461 |
| Median Household Income | 116 | $39,000 |
| Mean Household Income | 116 | $46,141 |
| Income Deficit | 94 | $0 |
| Wage / Income Gap (%) | 349 | 21.42% |
| Wage / Income Gap ($) | 349 | 78.58¢ per $1 |
| Gini / Inequality Index | 349 | 0.41 |
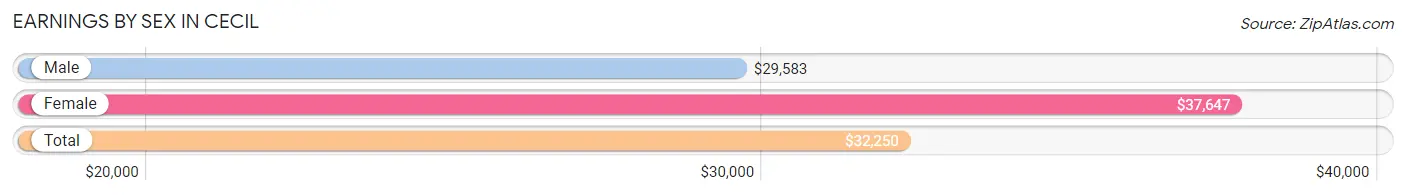
Earnings by Sex in Cecil
Average Earnings in Cecil are $32,250, $29,583 for men and $37,647 for women, a difference of 21.4%.
| Sex | Number | Average Earnings |
| Male | 67 (50.4%) | $29,583 |
| Female | 66 (49.6%) | $37,647 |
| Total | 133 (100.0%) | $32,250 |
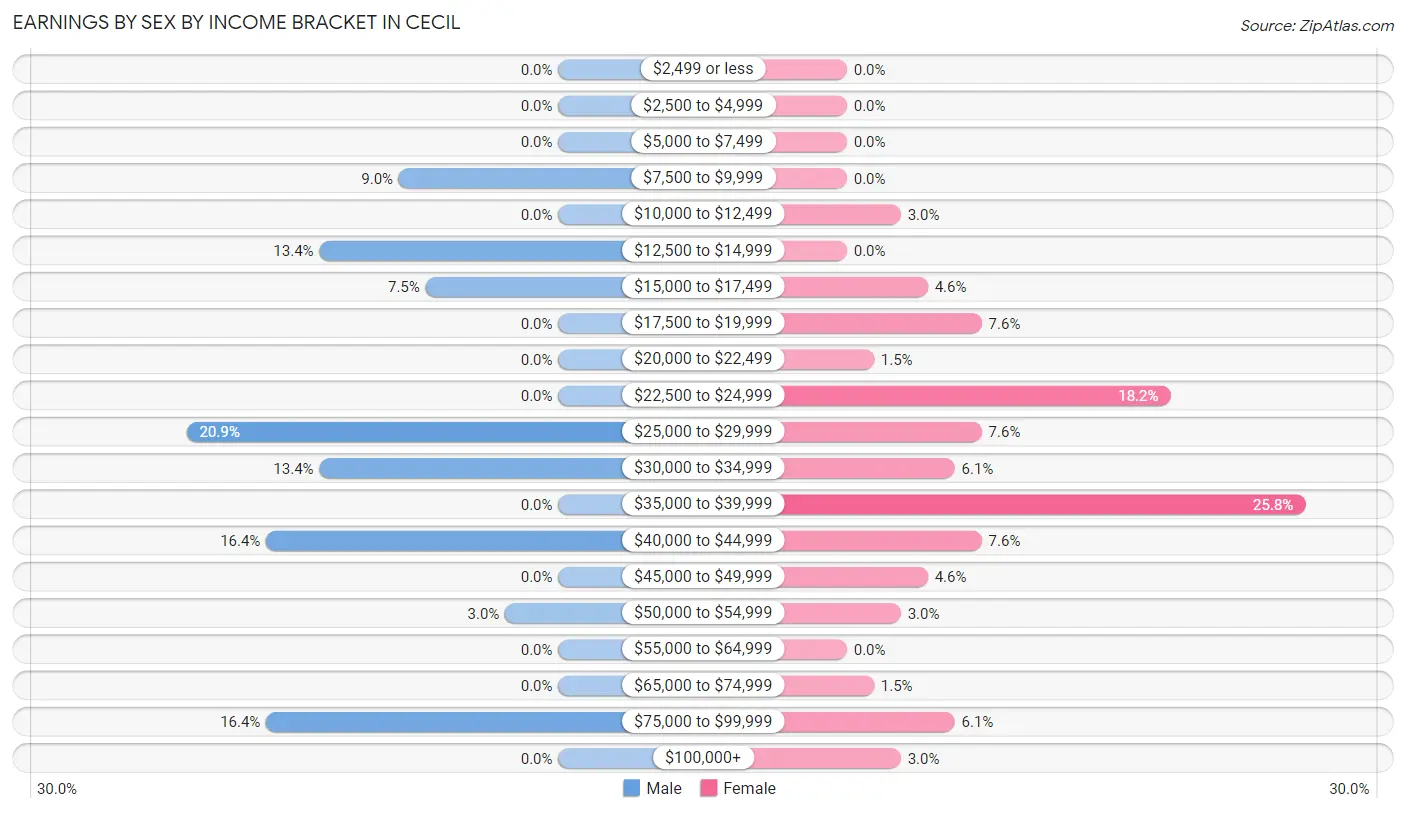
Earnings by Sex by Income Bracket in Cecil
The most common earnings brackets in Cecil are $25,000 to $29,999 for men (14 | 20.9%) and $35,000 to $39,999 for women (17 | 25.8%).
| Income | Male | Female |
| $2,499 or less | 0 (0.0%) | 0 (0.0%) |
| $2,500 to $4,999 | 0 (0.0%) | 0 (0.0%) |
| $5,000 to $7,499 | 0 (0.0%) | 0 (0.0%) |
| $7,500 to $9,999 | 6 (9.0%) | 0 (0.0%) |
| $10,000 to $12,499 | 0 (0.0%) | 2 (3.0%) |
| $12,500 to $14,999 | 9 (13.4%) | 0 (0.0%) |
| $15,000 to $17,499 | 5 (7.5%) | 3 (4.5%) |
| $17,500 to $19,999 | 0 (0.0%) | 5 (7.6%) |
| $20,000 to $22,499 | 0 (0.0%) | 1 (1.5%) |
| $22,500 to $24,999 | 0 (0.0%) | 12 (18.2%) |
| $25,000 to $29,999 | 14 (20.9%) | 5 (7.6%) |
| $30,000 to $34,999 | 9 (13.4%) | 4 (6.1%) |
| $35,000 to $39,999 | 0 (0.0%) | 17 (25.8%) |
| $40,000 to $44,999 | 11 (16.4%) | 5 (7.6%) |
| $45,000 to $49,999 | 0 (0.0%) | 3 (4.5%) |
| $50,000 to $54,999 | 2 (3.0%) | 2 (3.0%) |
| $55,000 to $64,999 | 0 (0.0%) | 0 (0.0%) |
| $65,000 to $74,999 | 0 (0.0%) | 1 (1.5%) |
| $75,000 to $99,999 | 11 (16.4%) | 4 (6.1%) |
| $100,000+ | 0 (0.0%) | 2 (3.0%) |
| Total | 67 (100.0%) | 66 (100.0%) |
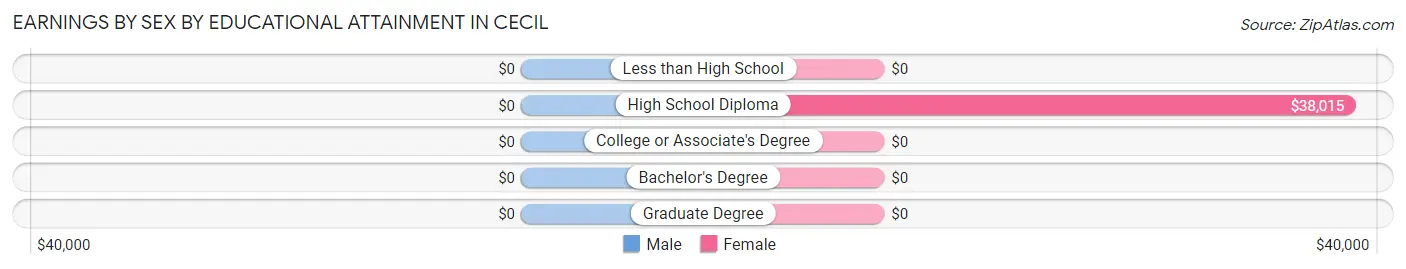
Earnings by Sex by Educational Attainment in Cecil
| Educational Attainment | Male Income | Female Income |
| Less than High School | - | - |
| High School Diploma | - | - |
| College or Associate's Degree | - | - |
| Bachelor's Degree | - | - |
| Graduate Degree | - | - |
| Total | $41,875 | $37,941 |
Family Income in Cecil
Family Income Brackets in Cecil
According to the Cecil family income data, there are 26 families falling into the $15,000 to $24,999 income range, which is the most common income bracket and makes up 27.7% of all families.
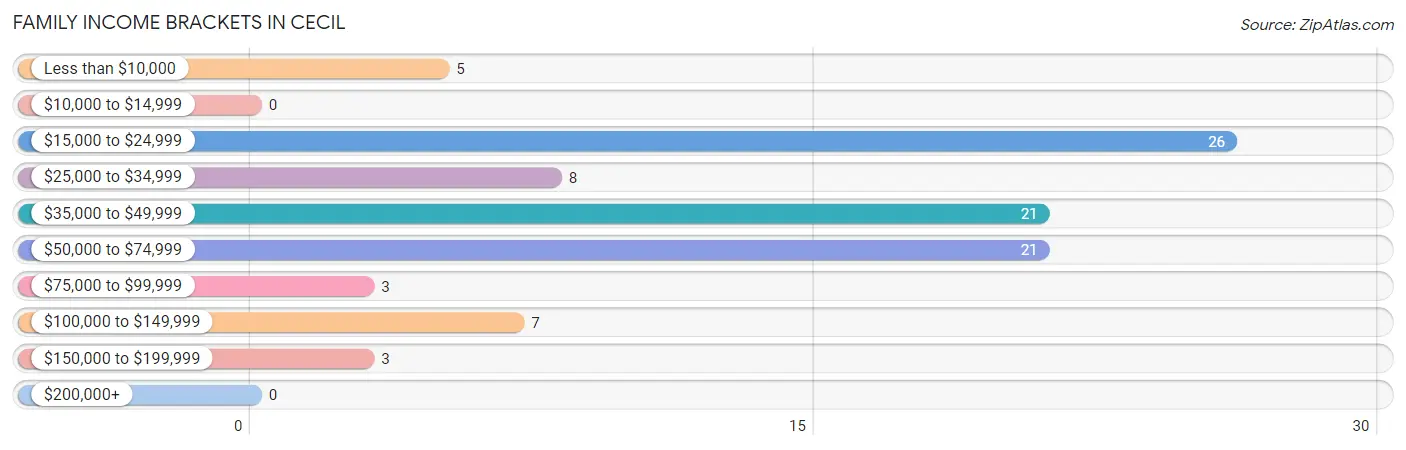
| Income Bracket | # Families | % Families |
| Less than $10,000 | 5 | 5.3% |
| $10,000 to $14,999 | 0 | 0.0% |
| $15,000 to $24,999 | 26 | 27.7% |
| $25,000 to $34,999 | 8 | 8.5% |
| $35,000 to $49,999 | 21 | 22.3% |
| $50,000 to $74,999 | 21 | 22.3% |
| $75,000 to $99,999 | 3 | 3.2% |
| $100,000 to $149,999 | 7 | 7.4% |
| $150,000 to $199,999 | 3 | 3.2% |
| $200,000+ | 0 | 0.0% |
Family Income by Famaliy Size in Cecil
3-person families (15 | 16.0%) account for the highest median family income in Cecil with $61,042 per family, while 3-person families (15 | 16.0%) have the highest median income of $20,347 per family member.
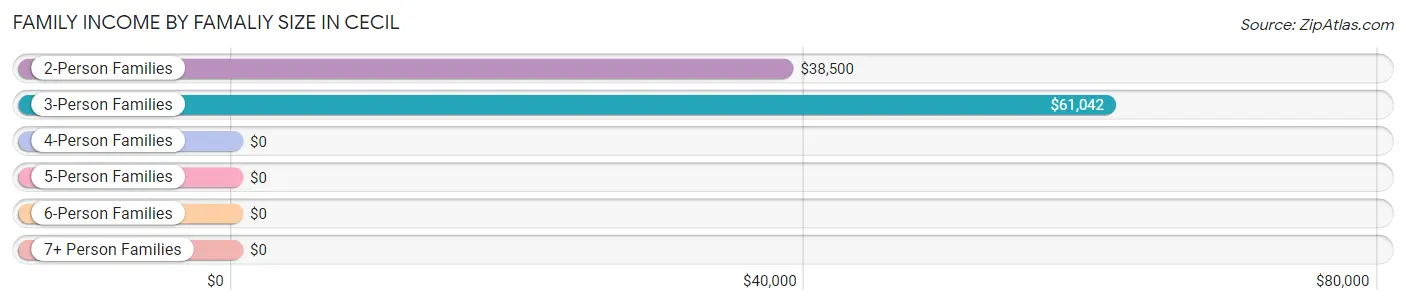
| Income Bracket | # Families | Median Income |
| 2-Person Families | 70 (74.5%) | $38,500 |
| 3-Person Families | 15 (16.0%) | $61,042 |
| 4-Person Families | 1 (1.1%) | $0 |
| 5-Person Families | 8 (8.5%) | $0 |
| 6-Person Families | 0 (0.0%) | $0 |
| 7+ Person Families | 0 (0.0%) | $0 |
| Total | 94 (100.0%) | $41,875 |
Family Income by Number of Earners in Cecil
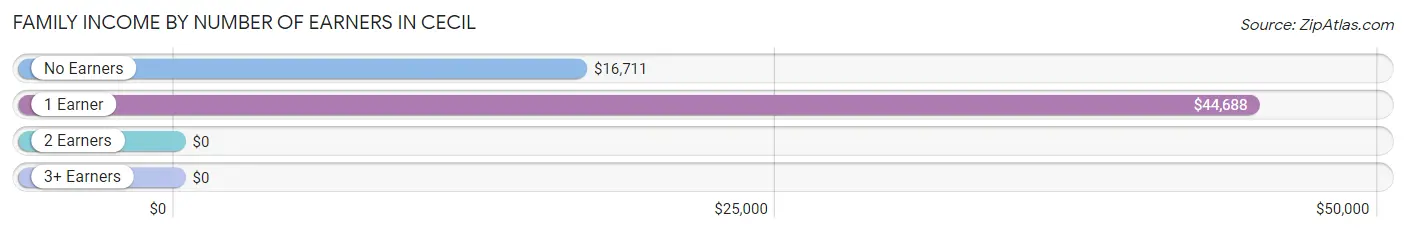
| Number of Earners | # Families | Median Income |
| No Earners | 26 (27.7%) | $16,711 |
| 1 Earner | 56 (59.6%) | $44,688 |
| 2 Earners | 12 (12.8%) | $0 |
| 3+ Earners | 0 (0.0%) | $0 |
| Total | 94 (100.0%) | $41,875 |
Household Income in Cecil
Household Income Brackets in Cecil
With 30 households falling in the category, the $15,000 to $24,999 income range is the most frequent in Cecil, accounting for 25.9% of all households.
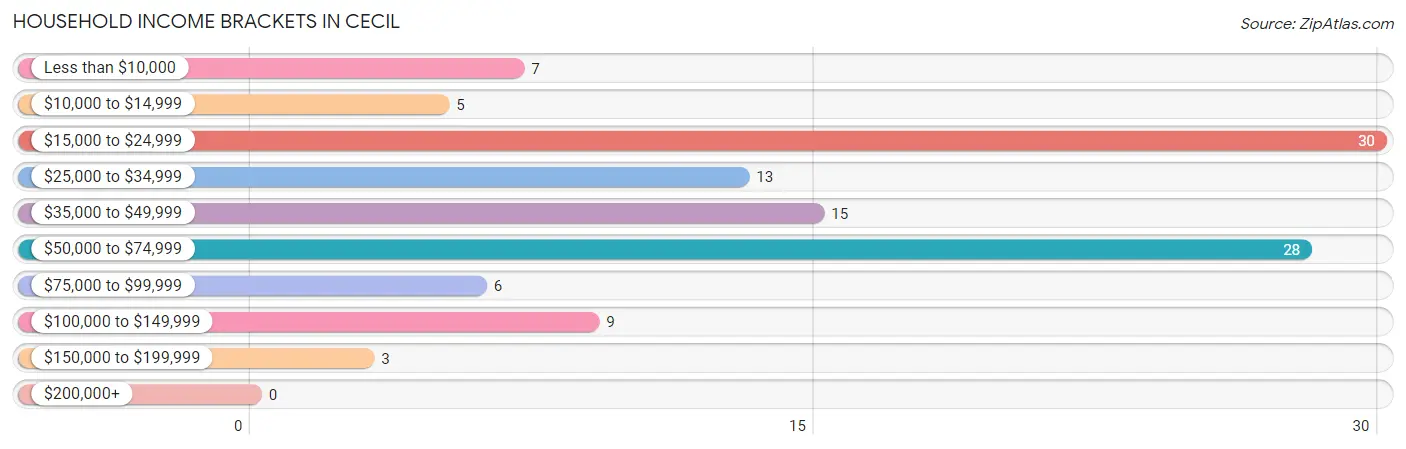
| Income Bracket | # Households | % Households |
| Less than $10,000 | 7 | 6.0% |
| $10,000 to $14,999 | 5 | 4.3% |
| $15,000 to $24,999 | 30 | 25.9% |
| $25,000 to $34,999 | 13 | 11.2% |
| $35,000 to $49,999 | 15 | 12.9% |
| $50,000 to $74,999 | 28 | 24.1% |
| $75,000 to $99,999 | 6 | 5.2% |
| $100,000 to $149,999 | 9 | 7.8% |
| $150,000 to $199,999 | 3 | 2.6% |
| $200,000+ | 0 | 0.0% |
Household Income by Householder Age in Cecil
The median household income in Cecil is $39,000, with the highest median household income of $65,750 found in the 25 to 44 years age bracket for the primary householder. A total of 30 households (25.9%) fall into this category. Meanwhile, the 15 to 24 years age bracket for the primary householder has the lowest median household income of $0, with 8 households (6.9%) in this group.
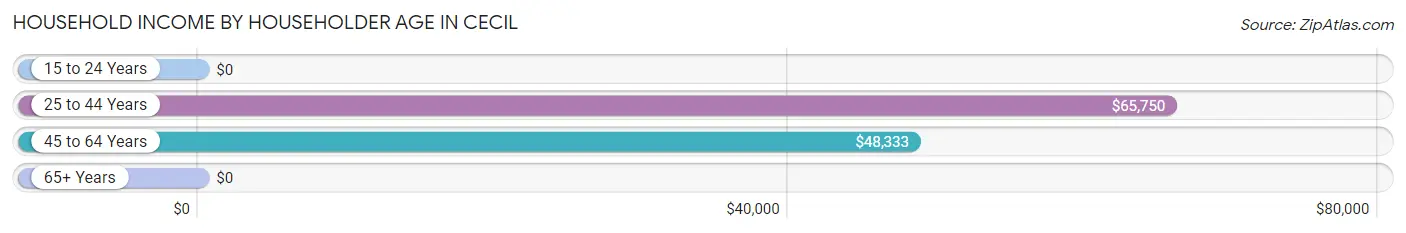
| Income Bracket | # Households | Median Income |
| 15 to 24 Years | 8 (6.9%) | $0 |
| 25 to 44 Years | 30 (25.9%) | $65,750 |
| 45 to 64 Years | 28 (24.1%) | $48,333 |
| 65+ Years | 50 (43.1%) | $0 |
| Total | 116 (100.0%) | $39,000 |
Poverty in Cecil
Income Below Poverty by Sex and Age in Cecil
With 34.9% poverty level for males and 40.7% for females among the residents of Cecil, 16 and 17 year old males and under 5 year old females are the most vulnerable to poverty, with 17 males (100.0%) and 3 females (100.0%) in their respective age groups living below the poverty level.
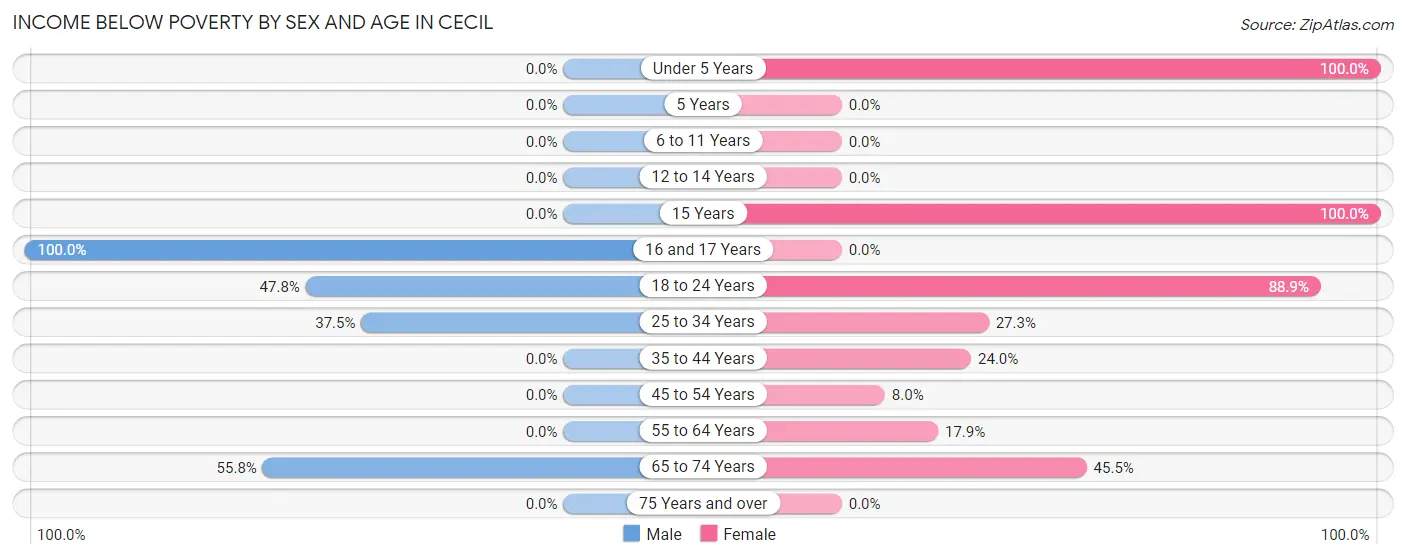
| Age Bracket | Male | Female |
| Under 5 Years | 0 (0.0%) | 3 (100.0%) |
| 5 Years | 0 (0.0%) | 0 (0.0%) |
| 6 to 11 Years | 0 (0.0%) | 0 (0.0%) |
| 12 to 14 Years | 0 (0.0%) | 0 (0.0%) |
| 15 Years | 0 (0.0%) | 14 (100.0%) |
| 16 and 17 Years | 17 (100.0%) | 0 (0.0%) |
| 18 to 24 Years | 11 (47.8%) | 32 (88.9%) |
| 25 to 34 Years | 9 (37.5%) | 3 (27.3%) |
| 35 to 44 Years | 0 (0.0%) | 6 (24.0%) |
| 45 to 54 Years | 0 (0.0%) | 2 (8.0%) |
| 55 to 64 Years | 0 (0.0%) | 5 (17.9%) |
| 65 to 74 Years | 24 (55.8%) | 5 (45.5%) |
| 75 Years and over | 0 (0.0%) | 0 (0.0%) |
| Total | 61 (34.9%) | 70 (40.7%) |
Income Above Poverty by Sex and Age in Cecil
According to the poverty statistics in Cecil, males aged under 5 years and females aged 5 years are the age groups that are most secure financially, with 100.0% of males and 100.0% of females in these age groups living above the poverty line.
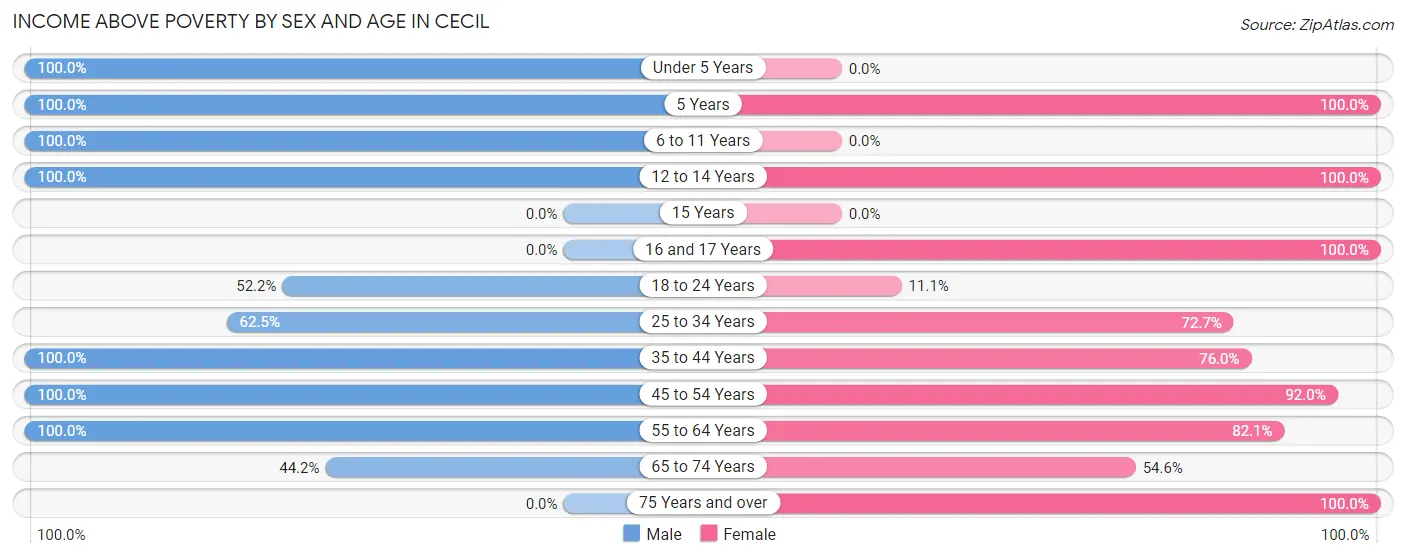
| Age Bracket | Male | Female |
| Under 5 Years | 4 (100.0%) | 0 (0.0%) |
| 5 Years | 2 (100.0%) | 2 (100.0%) |
| 6 to 11 Years | 21 (100.0%) | 0 (0.0%) |
| 12 to 14 Years | 2 (100.0%) | 2 (100.0%) |
| 15 Years | 0 (0.0%) | 0 (0.0%) |
| 16 and 17 Years | 0 (0.0%) | 2 (100.0%) |
| 18 to 24 Years | 12 (52.2%) | 4 (11.1%) |
| 25 to 34 Years | 15 (62.5%) | 8 (72.7%) |
| 35 to 44 Years | 16 (100.0%) | 19 (76.0%) |
| 45 to 54 Years | 4 (100.0%) | 23 (92.0%) |
| 55 to 64 Years | 19 (100.0%) | 23 (82.1%) |
| 65 to 74 Years | 19 (44.2%) | 6 (54.5%) |
| 75 Years and over | 0 (0.0%) | 13 (100.0%) |
| Total | 114 (65.1%) | 102 (59.3%) |
Income Below Poverty Among Married-Couple Families in Cecil
The poverty statistics for married-couple families in Cecil show that 42.2% or 19 of the total 45 families live below the poverty line. Families with no children have the highest poverty rate of 45.2%, comprising of 19 families. On the other hand, families with 1 or 2 children have the lowest poverty rate of 0.0%, which includes 0 families.
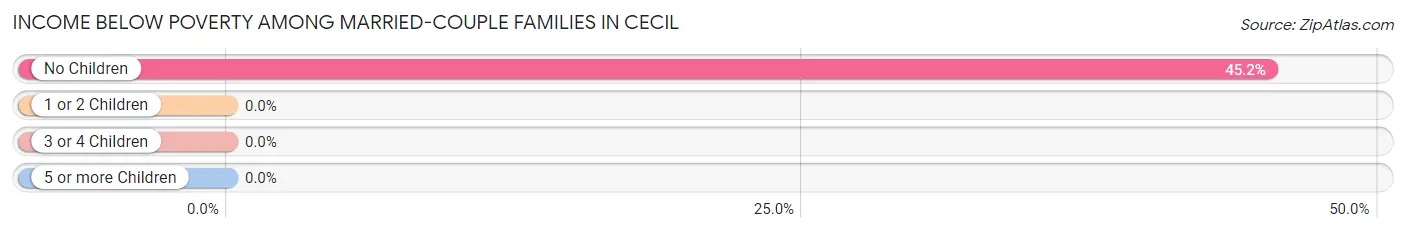
| Children | Above Poverty | Below Poverty |
| No Children | 23 (54.8%) | 19 (45.2%) |
| 1 or 2 Children | 3 (100.0%) | 0 (0.0%) |
| 3 or 4 Children | 0 (0.0%) | 0 (0.0%) |
| 5 or more Children | 0 (0.0%) | 0 (0.0%) |
| Total | 26 (57.8%) | 19 (42.2%) |
Income Below Poverty Among Single-Parent Households in Cecil
According to the poverty data in Cecil, 16.7% or 5 single-father households and 68.4% or 13 single-mother households are living below the poverty line. Among single-father households, those with 1 or 2 children have the highest poverty rate, with 5 households (31.2%) experiencing poverty. Likewise, among single-mother households, those with 1 or 2 children have the highest poverty rate, with 8 households (88.9%) falling below the poverty line.
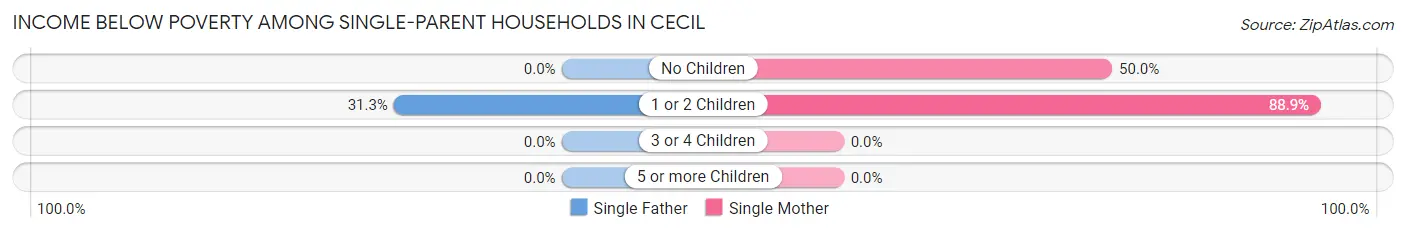
| Children | Single Father | Single Mother |
| No Children | 0 (0.0%) | 5 (50.0%) |
| 1 or 2 Children | 5 (31.2%) | 8 (88.9%) |
| 3 or 4 Children | 0 (0.0%) | 0 (0.0%) |
| 5 or more Children | 0 (0.0%) | 0 (0.0%) |
| Total | 5 (16.7%) | 13 (68.4%) |
Income Below Poverty Among Married-Couple vs Single-Parent Households in Cecil
The poverty data for Cecil shows that 19 of the married-couple family households (42.2%) and 18 of the single-parent households (36.7%) are living below the poverty level. Within the married-couple family households, those with no children have the highest poverty rate, with 19 households (45.2%) falling below the poverty line. Among the single-parent households, those with 1 or 2 children have the highest poverty rate, with 13 household (52.0%) living below poverty.
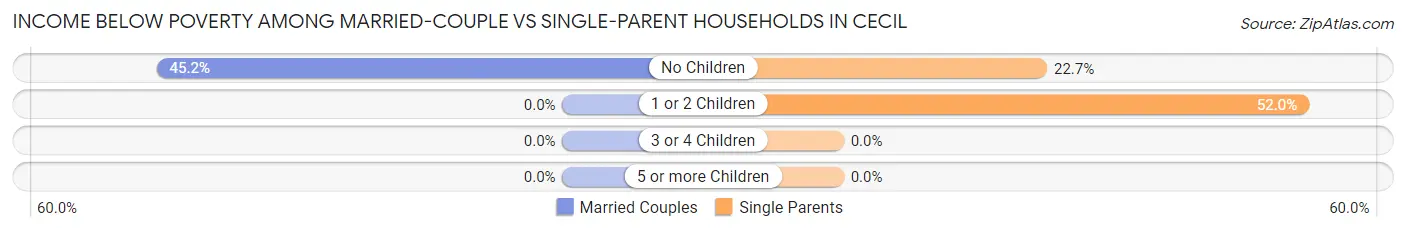
| Children | Married-Couple Families | Single-Parent Households |
| No Children | 19 (45.2%) | 5 (22.7%) |
| 1 or 2 Children | 0 (0.0%) | 13 (52.0%) |
| 3 or 4 Children | 0 (0.0%) | 0 (0.0%) |
| 5 or more Children | 0 (0.0%) | 0 (0.0%) |
| Total | 19 (42.2%) | 18 (36.7%) |
Race in Cecil
The most populous races in Cecil are Black / African American (196 | 56.2%), White / Caucasian (112 | 32.1%), and Hispanic or Latino (41 | 11.7%).
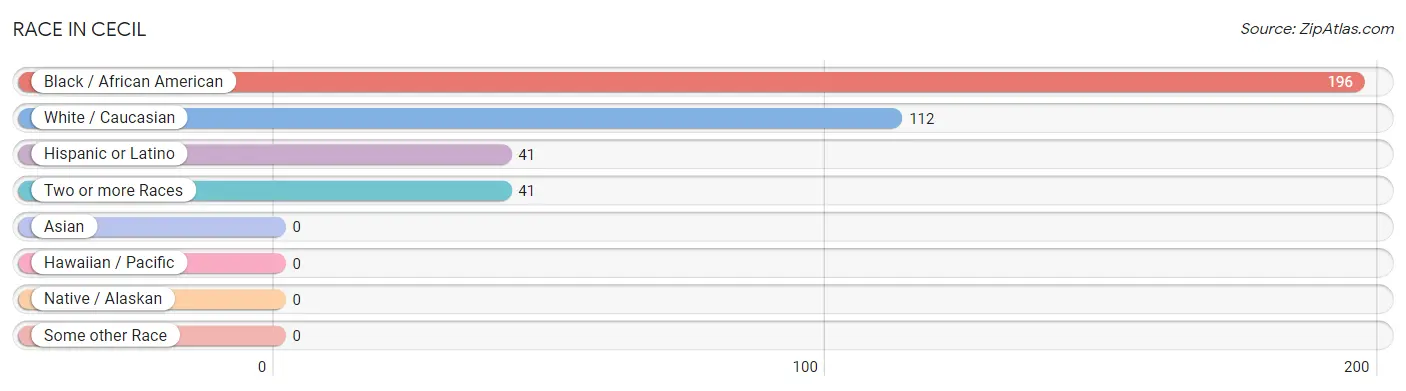
| Race | # Population | % Population |
| Asian | 0 | 0.0% |
| Black / African American | 196 | 56.2% |
| Hawaiian / Pacific | 0 | 0.0% |
| Hispanic or Latino | 41 | 11.7% |
| Native / Alaskan | 0 | 0.0% |
| White / Caucasian | 112 | 32.1% |
| Two or more Races | 41 | 11.7% |
| Some other Race | 0 | 0.0% |
| Total | 349 | 100.0% |
Ancestry in Cecil
The most populous ancestries reported in Cecil are Mexican (28 | 8.0%), German (19 | 5.4%), Puerto Rican (13 | 3.7%), English (7 | 2.0%), and Irish (7 | 2.0%), together accounting for 21.2% of all Cecil residents.
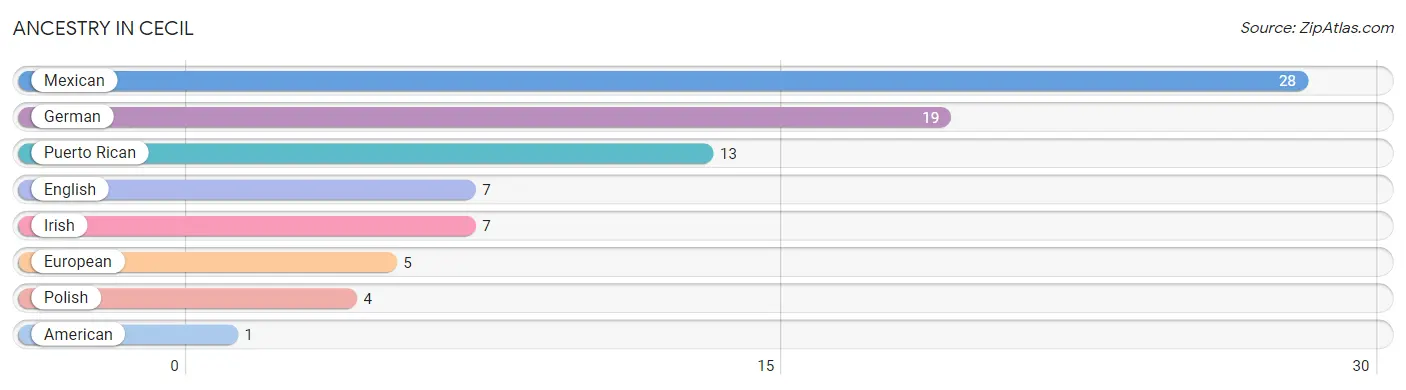
| Ancestry | # Population | % Population |
| American | 1 | 0.3% |
| English | 7 | 2.0% |
| European | 5 | 1.4% |
| German | 19 | 5.4% |
| Irish | 7 | 2.0% |
| Mexican | 28 | 8.0% |
| Polish | 4 | 1.1% |
| Puerto Rican | 13 | 3.7% | View All 8 Rows |
Immigrants in Cecil

| Immigration Origin | # Population | % Population | View All 0 Rows |
Sex and Age in Cecil
Sex and Age in Cecil
The most populous age groups in Cecil are 65 to 69 Years (27 | 15.4%) for men and 15 to 19 Years (29 | 16.7%) for women.
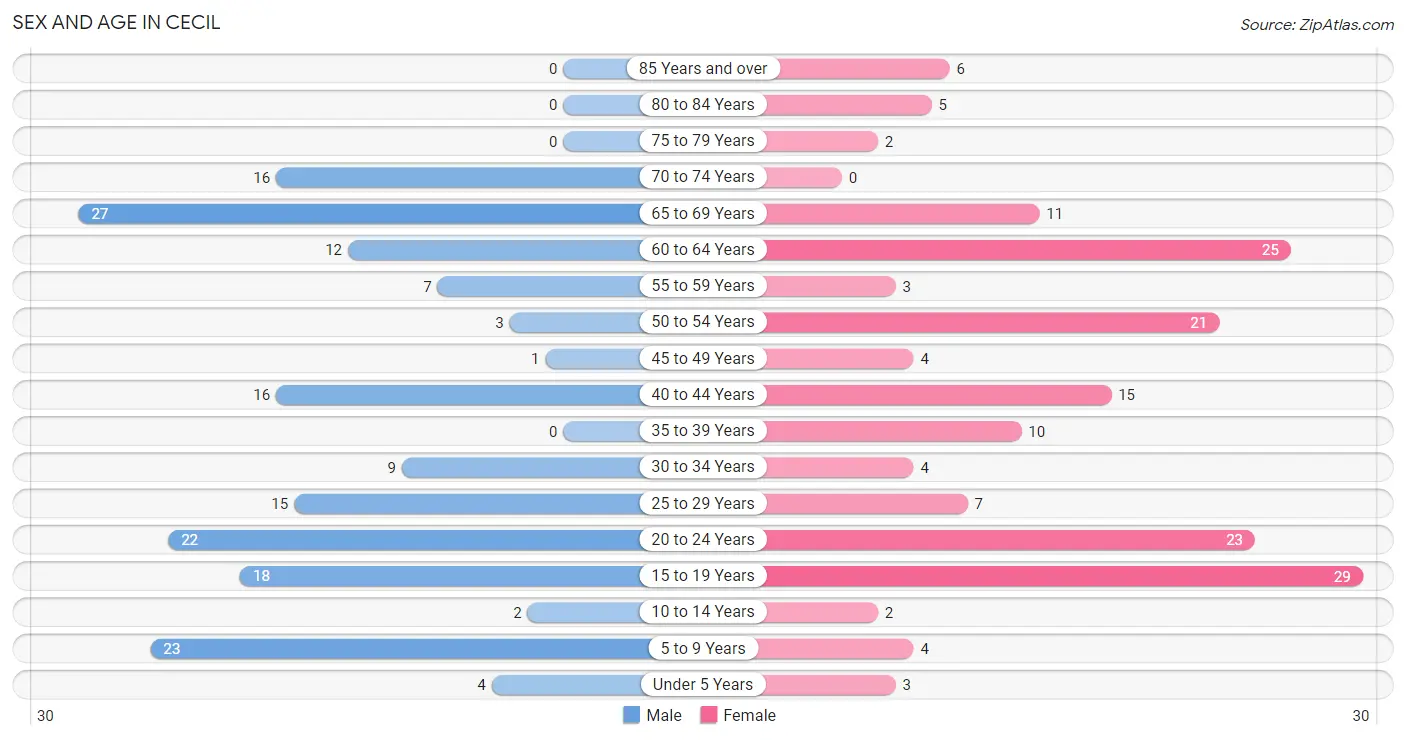
| Age Bracket | Male | Female |
| Under 5 Years | 4 (2.3%) | 3 (1.7%) |
| 5 to 9 Years | 23 (13.1%) | 4 (2.3%) |
| 10 to 14 Years | 2 (1.1%) | 2 (1.1%) |
| 15 to 19 Years | 18 (10.3%) | 29 (16.7%) |
| 20 to 24 Years | 22 (12.6%) | 23 (13.2%) |
| 25 to 29 Years | 15 (8.6%) | 7 (4.0%) |
| 30 to 34 Years | 9 (5.1%) | 4 (2.3%) |
| 35 to 39 Years | 0 (0.0%) | 10 (5.8%) |
| 40 to 44 Years | 16 (9.1%) | 15 (8.6%) |
| 45 to 49 Years | 1 (0.6%) | 4 (2.3%) |
| 50 to 54 Years | 3 (1.7%) | 21 (12.1%) |
| 55 to 59 Years | 7 (4.0%) | 3 (1.7%) |
| 60 to 64 Years | 12 (6.9%) | 25 (14.4%) |
| 65 to 69 Years | 27 (15.4%) | 11 (6.3%) |
| 70 to 74 Years | 16 (9.1%) | 0 (0.0%) |
| 75 to 79 Years | 0 (0.0%) | 2 (1.1%) |
| 80 to 84 Years | 0 (0.0%) | 5 (2.9%) |
| 85 Years and over | 0 (0.0%) | 6 (3.5%) |
| Total | 175 (100.0%) | 174 (100.0%) |
Families and Households in Cecil
Median Family Size in Cecil
The median family size in Cecil is 3.03 persons per family, with single female/mother families (19 | 20.2%) accounting for the largest median family size of 5.26 persons per family. On the other hand, married-couple families (45 | 47.9%) represent the smallest median family size with 2.27 persons per family.
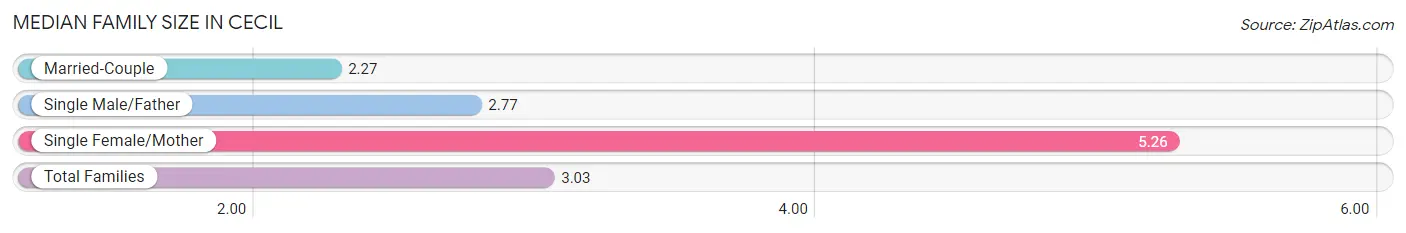
| Family Type | # Families | Family Size |
| Married-Couple | 45 (47.9%) | 2.27 |
| Single Male/Father | 30 (31.9%) | 2.77 |
| Single Female/Mother | 19 (20.2%) | 5.26 |
| Total Families | 94 (100.0%) | 3.03 |
Median Household Size in Cecil
The median household size in Cecil is 3.01 persons per household, with single female/mother households (19 | 16.4%) accounting for the largest median household size of 5.26 persons per household. non-family households (22 | 19.0%) represent the smallest median household size with 1.14 persons per household.
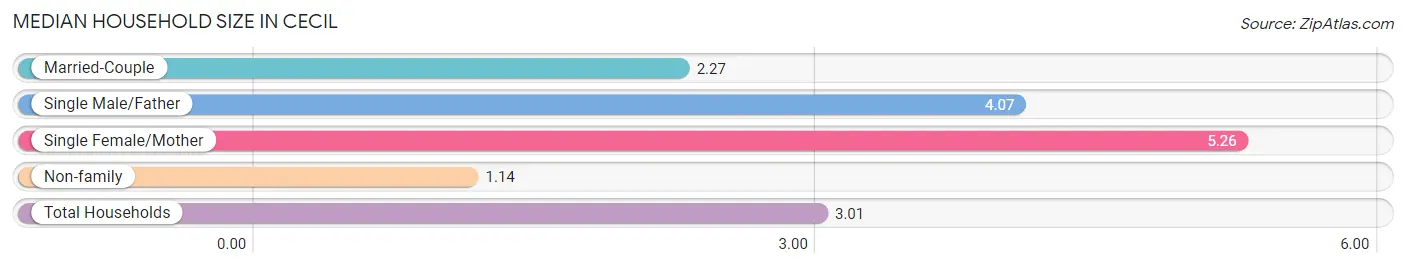
| Household Type | # Households | Household Size |
| Married-Couple | 45 (38.8%) | 2.27 |
| Single Male/Father | 30 (25.9%) | 4.07 |
| Single Female/Mother | 19 (16.4%) | 5.26 |
| Non-family | 22 (19.0%) | 1.14 |
| Total Households | 116 (100.0%) | 3.01 |
Household Size by Marriage Status in Cecil
Out of a total of 116 households in Cecil, 94 (81.0%) are family households, while 22 (19.0%) are nonfamily households. The most numerous type of family households are 2-person households, comprising 56, and the most common type of nonfamily households are 1-person households, comprising 19.
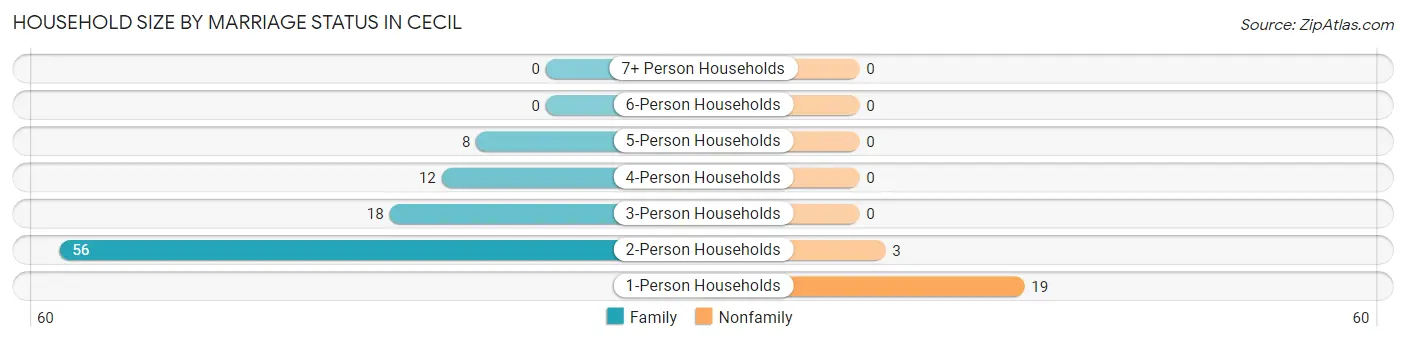
| Household Size | Family Households | Nonfamily Households |
| 1-Person Households | - | 19 (16.4%) |
| 2-Person Households | 56 (48.3%) | 3 (2.6%) |
| 3-Person Households | 18 (15.5%) | 0 (0.0%) |
| 4-Person Households | 12 (10.3%) | 0 (0.0%) |
| 5-Person Households | 8 (6.9%) | 0 (0.0%) |
| 6-Person Households | 0 (0.0%) | 0 (0.0%) |
| 7+ Person Households | 0 (0.0%) | 0 (0.0%) |
| Total | 94 (81.0%) | 22 (19.0%) |
Female Fertility in Cecil
Fertility by Age in Cecil
| Age Bracket | Women with Births | Births / 1,000 Women |
| 15 to 19 years | 0 (0.0%) | 0.0 |
| 20 to 34 years | 0 (0.0%) | 0.0 |
| 35 to 50 years | 0 (0.0%) | 0.0 |
| Total | 0 (0.0%) | 0.0 |
Fertility by Age by Marriage Status in Cecil
| Age Bracket | Married | Unmarried |
| 15 to 19 years | 0 (0.0%) | 0 (0.0%) |
| 20 to 34 years | 0 (0.0%) | 0 (0.0%) |
| 35 to 50 years | 0 (0.0%) | 0 (0.0%) |
| Total | 0 (0.0%) | 0 (0.0%) |
Fertility by Education in Cecil
| Educational Attainment | Women with Births | Births / 1,000 Women |
| Less than High School | 0 (0.0%) | 0.0 |
| High School Diploma | 0 (0.0%) | 0.0 |
| College or Associate's Degree | 0 (0.0%) | 0.0 |
| Bachelor's Degree | 0 (0.0%) | 0.0 |
| Graduate Degree | 0 (0.0%) | 0.0 |
| Total | 0 (0.0%) | 0.0 |
Fertility by Education by Marriage Status in Cecil
| Educational Attainment | Married | Unmarried |
| Less than High School | 0 (0.0%) | 0 (0.0%) |
| High School Diploma | 0 (0.0%) | 0 (0.0%) |
| College or Associate's Degree | 0 (0.0%) | 0 (0.0%) |
| Bachelor's Degree | 0 (0.0%) | 0 (0.0%) |
| Graduate Degree | 0 (0.0%) | 0 (0.0%) |
| Total | 0 (0.0%) | 0 (0.0%) |
Employment Characteristics in Cecil
Employment by Class of Employer in Cecil
Among the 133 employed individuals in Cecil, private company employees (87 | 65.4%), state government employees (19 | 14.3%), and local government employees (14 | 10.5%) make up the most common classes of employment.
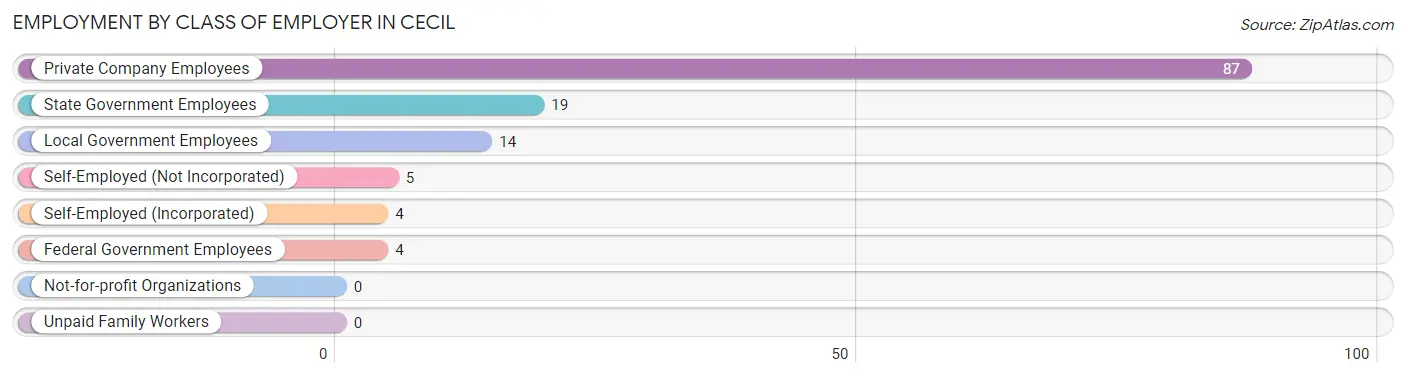
| Employer Class | # Employees | % Employees |
| Private Company Employees | 87 | 65.4% |
| Self-Employed (Incorporated) | 4 | 3.0% |
| Self-Employed (Not Incorporated) | 5 | 3.8% |
| Not-for-profit Organizations | 0 | 0.0% |
| Local Government Employees | 14 | 10.5% |
| State Government Employees | 19 | 14.3% |
| Federal Government Employees | 4 | 3.0% |
| Unpaid Family Workers | 0 | 0.0% |
| Total | 133 | 100.0% |
Employment Status by Age in Cecil
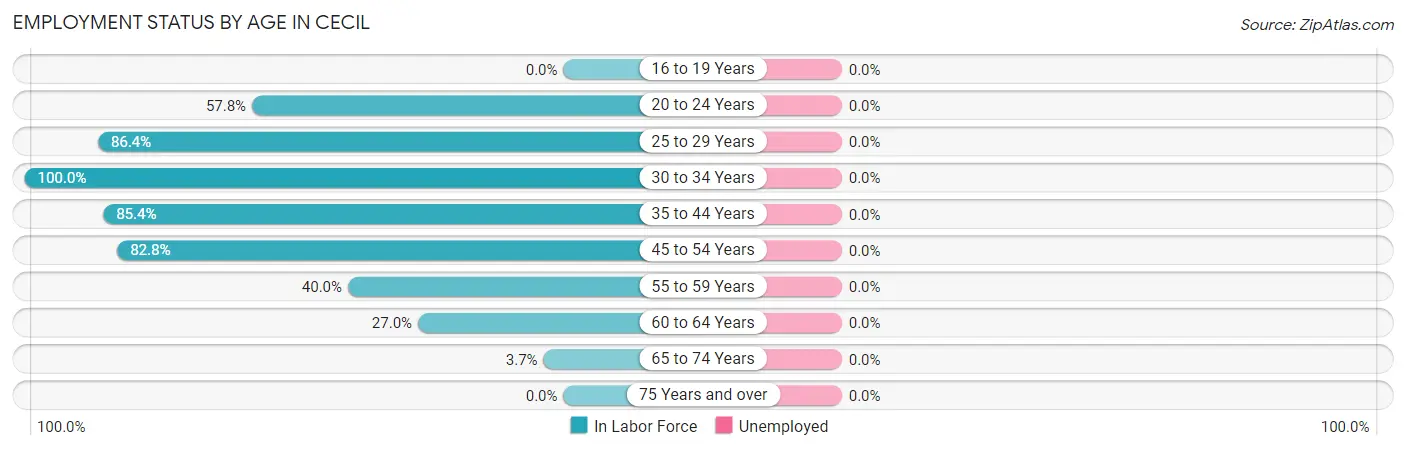
| Age Bracket | In Labor Force | Unemployed |
| 16 to 19 Years | 0 (0.0%) | 0 (0.0%) |
| 20 to 24 Years | 26 (57.8%) | 0 (0.0%) |
| 25 to 29 Years | 19 (86.4%) | 0 (0.0%) |
| 30 to 34 Years | 13 (100.0%) | 0 (0.0%) |
| 35 to 44 Years | 35 (85.4%) | 0 (0.0%) |
| 45 to 54 Years | 24 (82.8%) | 0 (0.0%) |
| 55 to 59 Years | 4 (40.0%) | 0 (0.0%) |
| 60 to 64 Years | 10 (27.0%) | 0 (0.0%) |
| 65 to 74 Years | 2 (3.7%) | 0 (0.0%) |
| 75 Years and over | 0 (0.0%) | 0 (0.0%) |
| Total | 133 (44.8%) | 0 (0.0%) |
Employment Status by Educational Attainment in Cecil
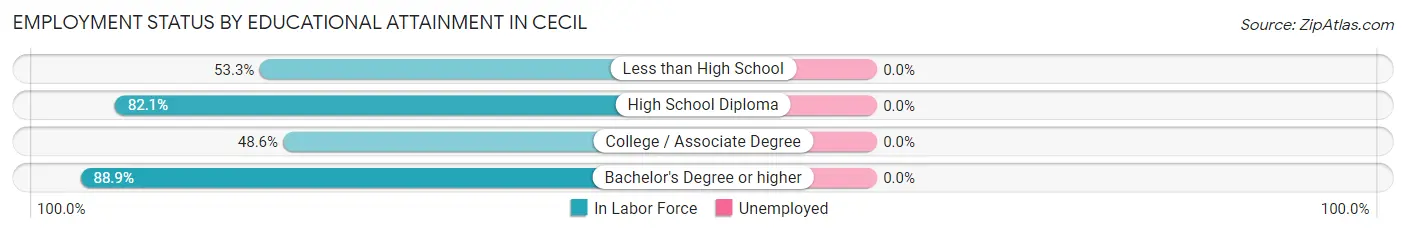
| Educational Attainment | In Labor Force | Unemployed |
| Less than High School | 16 (53.3%) | 0 (0.0%) |
| High School Diploma | 64 (82.1%) | 0 (0.0%) |
| College / Associate Degree | 17 (48.6%) | 0 (0.0%) |
| Bachelor's Degree or higher | 8 (88.9%) | 0 (0.0%) |
| Total | 105 (69.1%) | 0 (0.0%) |
Employment Occupations by Sex in Cecil
Management, Business, Science and Arts Occupations
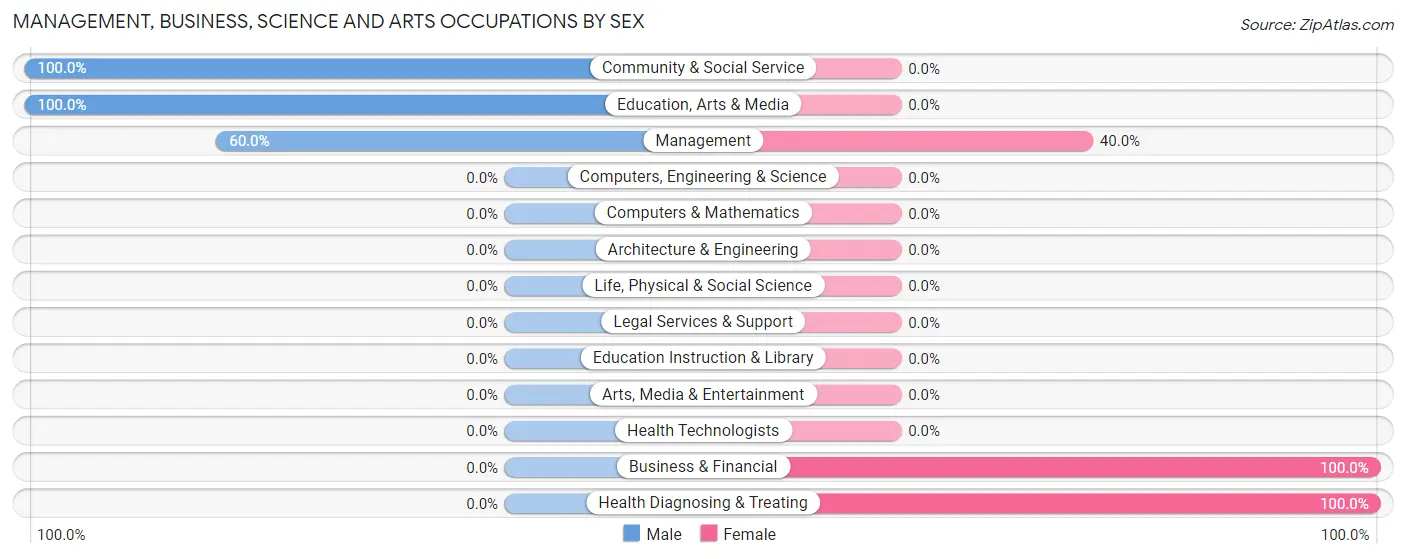
The most common Management, Business, Science and Arts occupations in Cecil are Management (5 | 3.8%), Business & Financial (2 | 1.5%), Community & Social Service (2 | 1.5%), Education, Arts & Media (2 | 1.5%), and Health Diagnosing & Treating (2 | 1.5%).
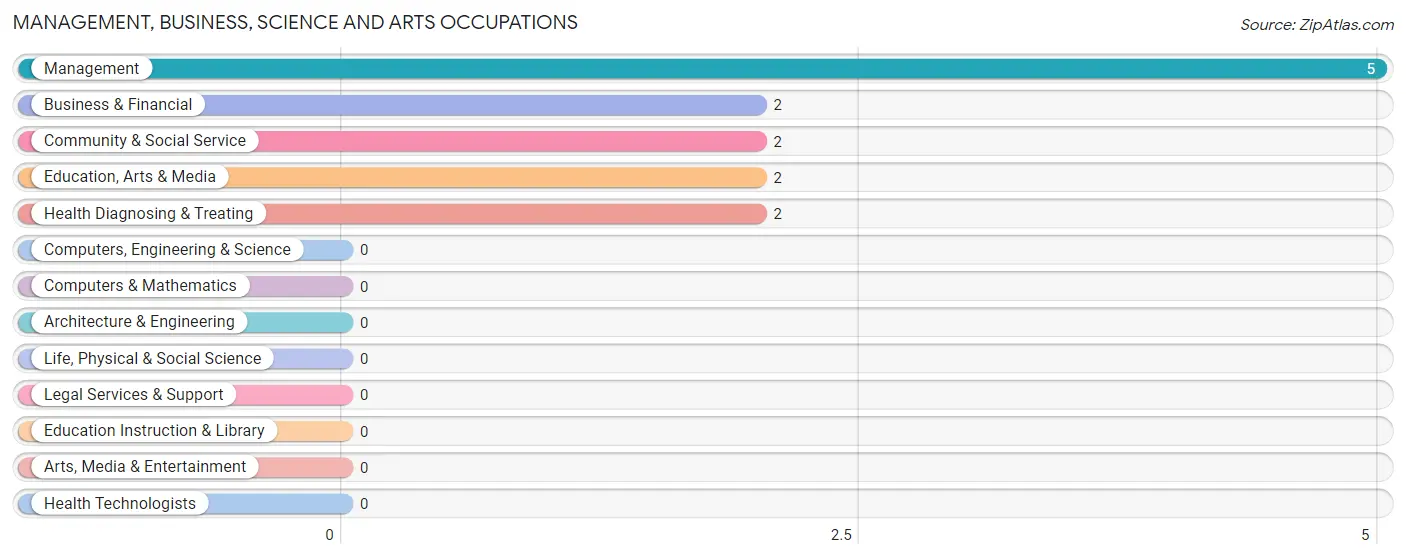
Management, Business, Science and Arts Occupations by Sex
Within the Management, Business, Science and Arts occupations in Cecil, the most male-oriented occupations are Community & Social Service (100.0%), Education, Arts & Media (100.0%), and Management (60.0%), while the most female-oriented occupations are Business & Financial (100.0%), Health Diagnosing & Treating (100.0%), and Management (40.0%).
| Occupation | Male | Female |
| Management | 3 (60.0%) | 2 (40.0%) |
| Business & Financial | 0 (0.0%) | 2 (100.0%) |
| Computers, Engineering & Science | 0 (0.0%) | 0 (0.0%) |
| Computers & Mathematics | 0 (0.0%) | 0 (0.0%) |
| Architecture & Engineering | 0 (0.0%) | 0 (0.0%) |
| Life, Physical & Social Science | 0 (0.0%) | 0 (0.0%) |
| Community & Social Service | 2 (100.0%) | 0 (0.0%) |
| Education, Arts & Media | 2 (100.0%) | 0 (0.0%) |
| Legal Services & Support | 0 (0.0%) | 0 (0.0%) |
| Education Instruction & Library | 0 (0.0%) | 0 (0.0%) |
| Arts, Media & Entertainment | 0 (0.0%) | 0 (0.0%) |
| Health Diagnosing & Treating | 0 (0.0%) | 2 (100.0%) |
| Health Technologists | 0 (0.0%) | 0 (0.0%) |
| Total (Category) | 5 (45.5%) | 6 (54.5%) |
| Total (Overall) | 67 (50.4%) | 66 (49.6%) |
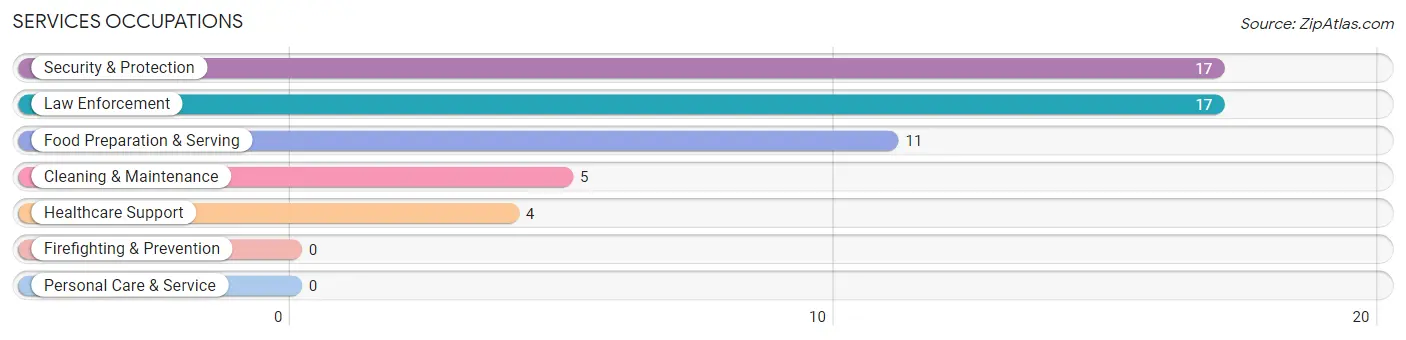
Services Occupations
The most common Services occupations in Cecil are Security & Protection (17 | 12.8%), Law Enforcement (17 | 12.8%), Food Preparation & Serving (11 | 8.3%), Cleaning & Maintenance (5 | 3.8%), and Healthcare Support (4 | 3.0%).
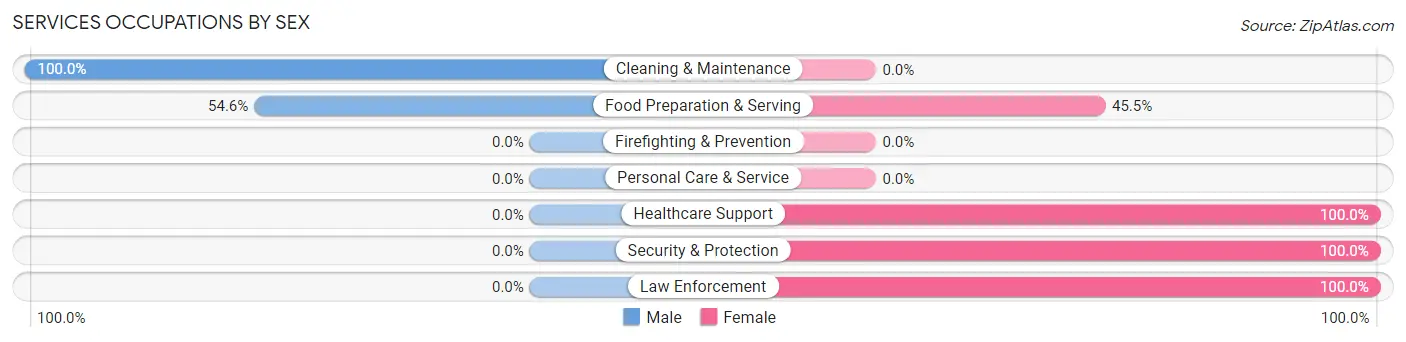
Services Occupations by Sex
Within the Services occupations in Cecil, the most male-oriented occupations are Cleaning & Maintenance (100.0%), and Food Preparation & Serving (54.5%), while the most female-oriented occupations are Healthcare Support (100.0%), Security & Protection (100.0%), and Law Enforcement (100.0%).
| Occupation | Male | Female |
| Healthcare Support | 0 (0.0%) | 4 (100.0%) |
| Security & Protection | 0 (0.0%) | 17 (100.0%) |
| Firefighting & Prevention | 0 (0.0%) | 0 (0.0%) |
| Law Enforcement | 0 (0.0%) | 17 (100.0%) |
| Food Preparation & Serving | 6 (54.5%) | 5 (45.5%) |
| Cleaning & Maintenance | 5 (100.0%) | 0 (0.0%) |
| Personal Care & Service | 0 (0.0%) | 0 (0.0%) |
| Total (Category) | 11 (29.7%) | 26 (70.3%) |
| Total (Overall) | 67 (50.4%) | 66 (49.6%) |
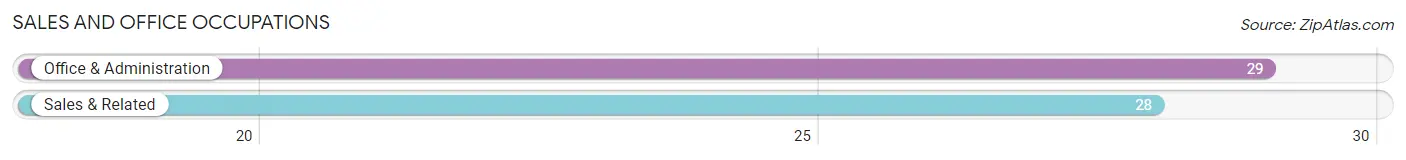
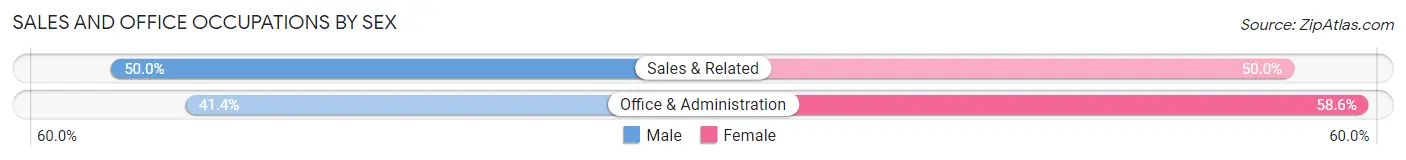
Sales and Office Occupations
The most common Sales and Office occupations in Cecil are Office & Administration (29 | 21.8%), and Sales & Related (28 | 21.0%).
Sales and Office Occupations by Sex
| Occupation | Male | Female |
| Sales & Related | 14 (50.0%) | 14 (50.0%) |
| Office & Administration | 12 (41.4%) | 17 (58.6%) |
| Total (Category) | 26 (45.6%) | 31 (54.4%) |
| Total (Overall) | 67 (50.4%) | 66 (49.6%) |
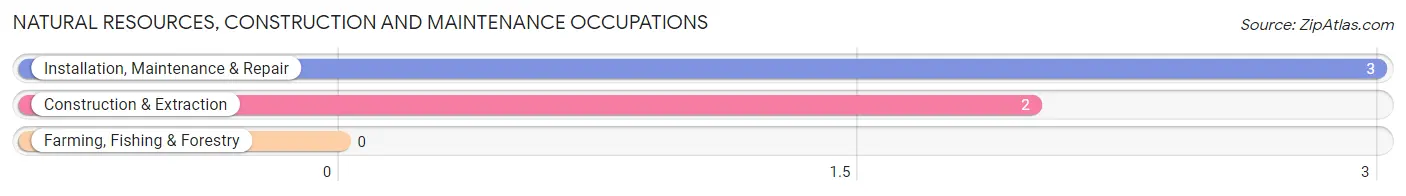
Natural Resources, Construction and Maintenance Occupations
The most common Natural Resources, Construction and Maintenance occupations in Cecil are Installation, Maintenance & Repair (3 | 2.3%), and Construction & Extraction (2 | 1.5%).
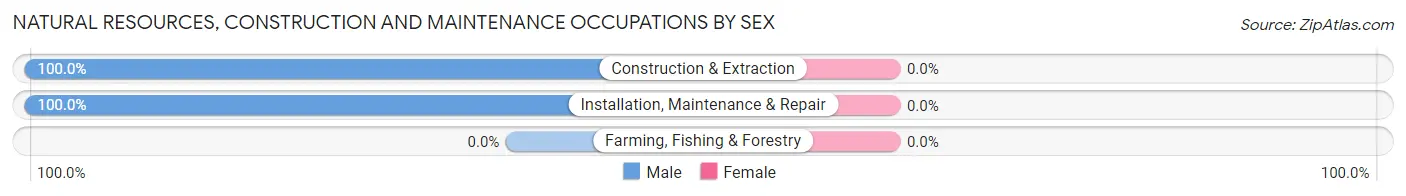
Natural Resources, Construction and Maintenance Occupations by Sex
| Occupation | Male | Female |
| Farming, Fishing & Forestry | 0 (0.0%) | 0 (0.0%) |
| Construction & Extraction | 2 (100.0%) | 0 (0.0%) |
| Installation, Maintenance & Repair | 3 (100.0%) | 0 (0.0%) |
| Total (Category) | 5 (100.0%) | 0 (0.0%) |
| Total (Overall) | 67 (50.4%) | 66 (49.6%) |
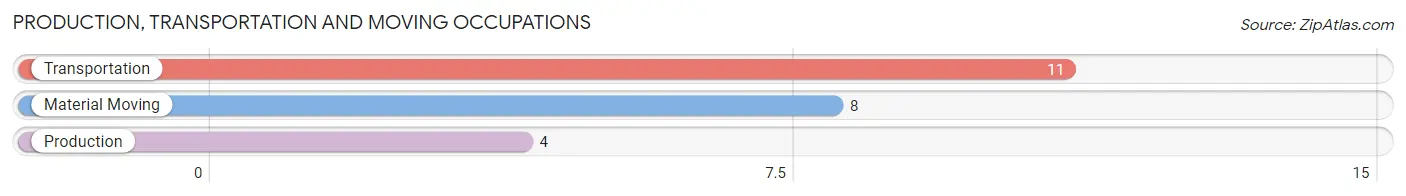
Production, Transportation and Moving Occupations
The most common Production, Transportation and Moving occupations in Cecil are Transportation (11 | 8.3%), Material Moving (8 | 6.0%), and Production (4 | 3.0%).
Production, Transportation and Moving Occupations by Sex
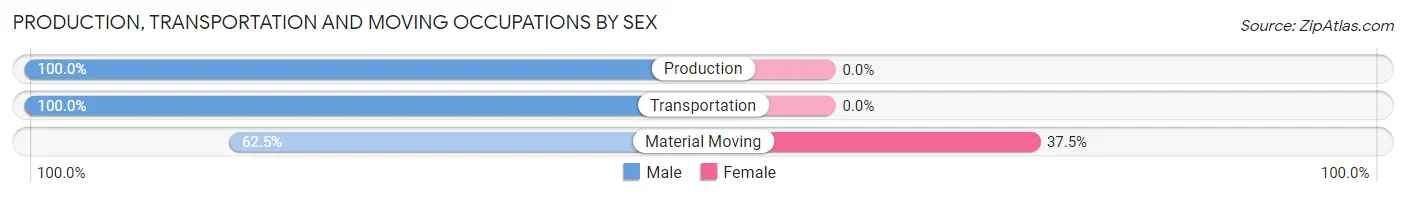
| Occupation | Male | Female |
| Production | 4 (100.0%) | 0 (0.0%) |
| Transportation | 11 (100.0%) | 0 (0.0%) |
| Material Moving | 5 (62.5%) | 3 (37.5%) |
| Total (Category) | 20 (87.0%) | 3 (13.0%) |
| Total (Overall) | 67 (50.4%) | 66 (49.6%) |
Employment Industries by Sex in Cecil
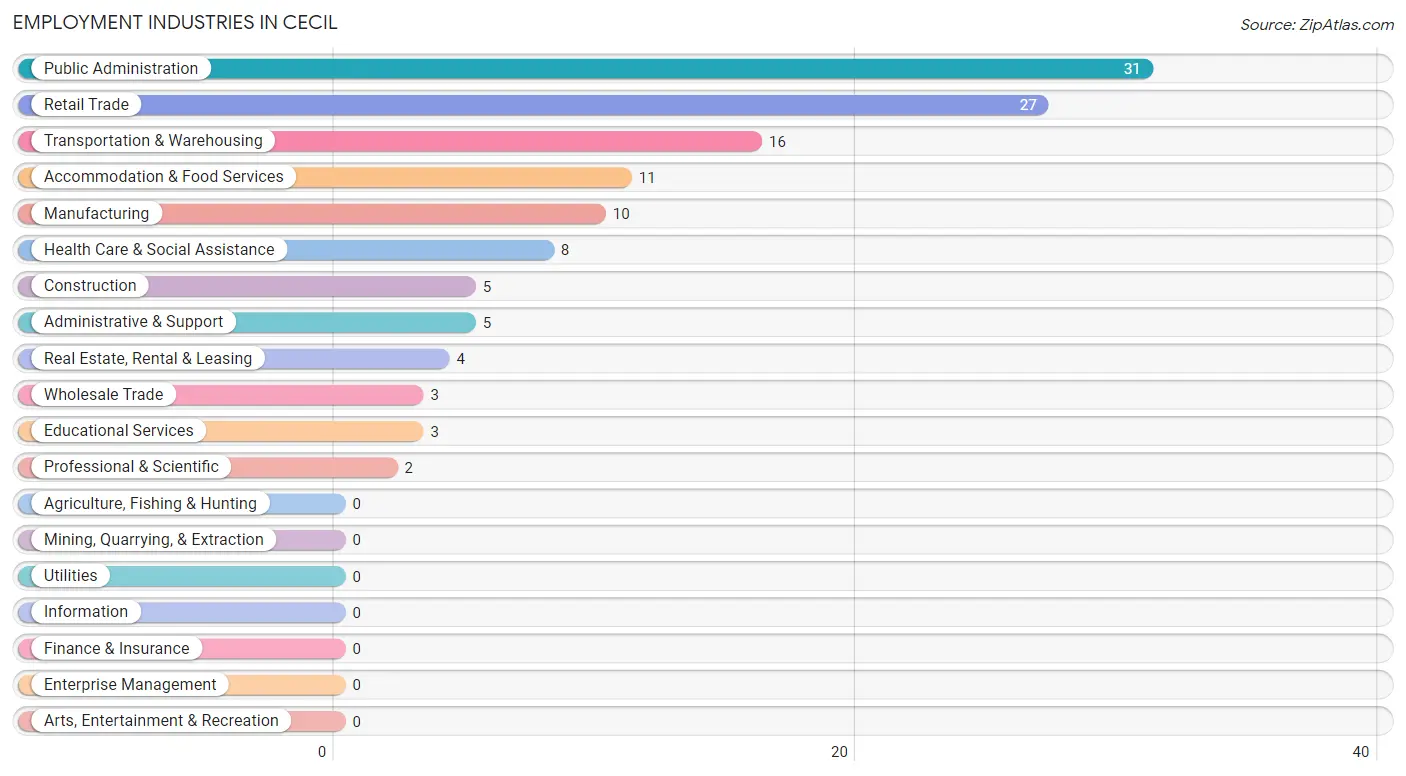
Employment Industries in Cecil
The major employment industries in Cecil include Public Administration (31 | 23.3%), Retail Trade (27 | 20.3%), Transportation & Warehousing (16 | 12.0%), Accommodation & Food Services (11 | 8.3%), and Manufacturing (10 | 7.5%).
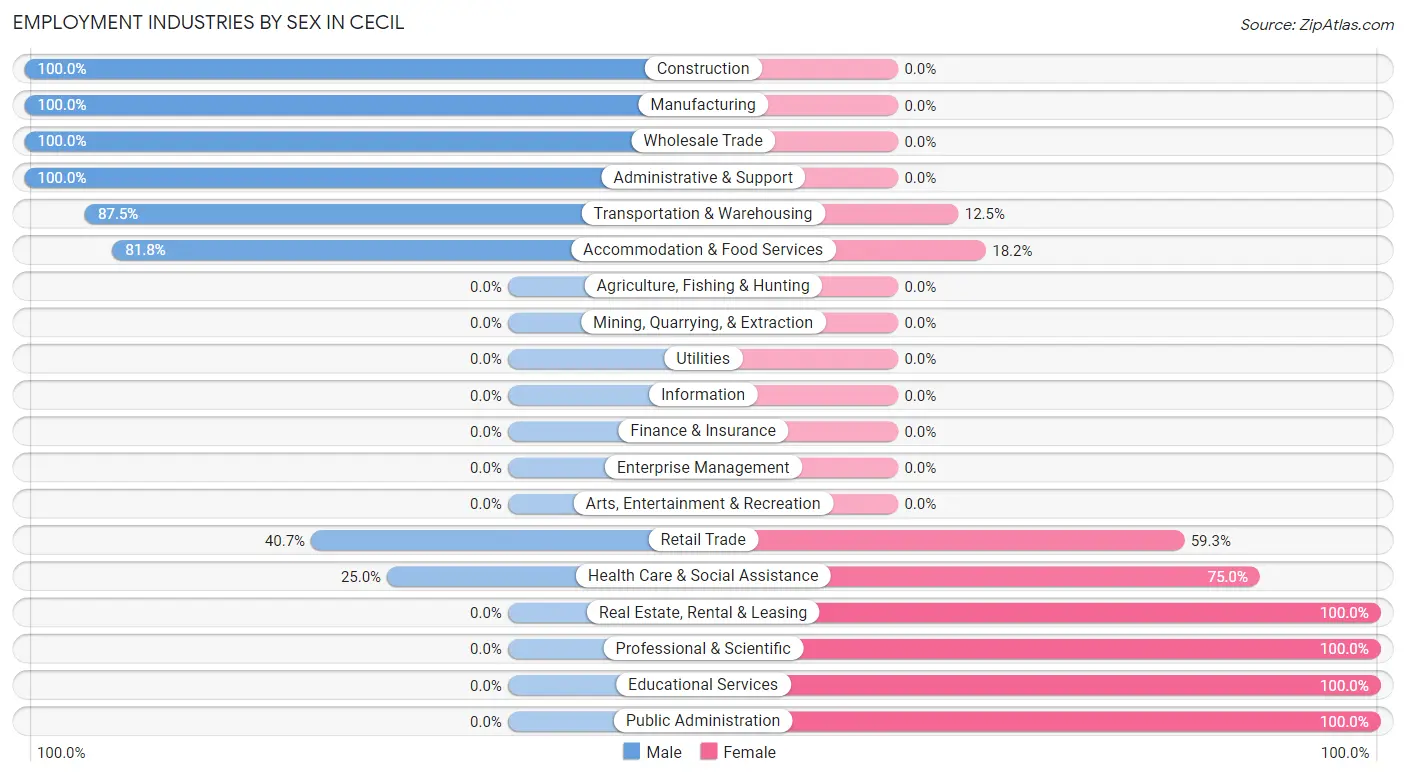
Employment Industries by Sex in Cecil
The Cecil industries that see more men than women are Construction (100.0%), Manufacturing (100.0%), and Wholesale Trade (100.0%), whereas the industries that tend to have a higher number of women are Real Estate, Rental & Leasing (100.0%), Professional & Scientific (100.0%), and Educational Services (100.0%).
| Industry | Male | Female |
| Agriculture, Fishing & Hunting | 0 (0.0%) | 0 (0.0%) |
| Mining, Quarrying, & Extraction | 0 (0.0%) | 0 (0.0%) |
| Construction | 5 (100.0%) | 0 (0.0%) |
| Manufacturing | 10 (100.0%) | 0 (0.0%) |
| Wholesale Trade | 3 (100.0%) | 0 (0.0%) |
| Retail Trade | 11 (40.7%) | 16 (59.3%) |
| Transportation & Warehousing | 14 (87.5%) | 2 (12.5%) |
| Utilities | 0 (0.0%) | 0 (0.0%) |
| Information | 0 (0.0%) | 0 (0.0%) |
| Finance & Insurance | 0 (0.0%) | 0 (0.0%) |
| Real Estate, Rental & Leasing | 0 (0.0%) | 4 (100.0%) |
| Professional & Scientific | 0 (0.0%) | 2 (100.0%) |
| Enterprise Management | 0 (0.0%) | 0 (0.0%) |
| Administrative & Support | 5 (100.0%) | 0 (0.0%) |
| Educational Services | 0 (0.0%) | 3 (100.0%) |
| Health Care & Social Assistance | 2 (25.0%) | 6 (75.0%) |
| Arts, Entertainment & Recreation | 0 (0.0%) | 0 (0.0%) |
| Accommodation & Food Services | 9 (81.8%) | 2 (18.2%) |
| Public Administration | 0 (0.0%) | 31 (100.0%) |
| Total | 67 (50.4%) | 66 (49.6%) |
Education in Cecil
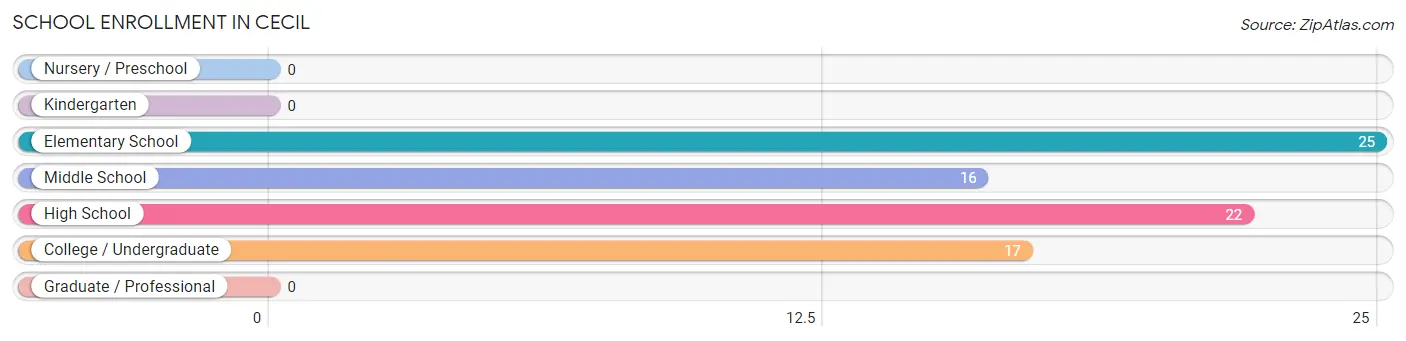
School Enrollment in Cecil
The most common levels of schooling among the 80 students in Cecil are elementary school (25 | 31.2%), high school (22 | 27.5%), and college / undergraduate (17 | 21.2%).
| School Level | # Students | % Students |
| Nursery / Preschool | 0 | 0.0% |
| Kindergarten | 0 | 0.0% |
| Elementary School | 25 | 31.2% |
| Middle School | 16 | 20.0% |
| High School | 22 | 27.5% |
| College / Undergraduate | 17 | 21.2% |
| Graduate / Professional | 0 | 0.0% |
| Total | 80 | 100.0% |
School Enrollment by Age by Funding Source in Cecil
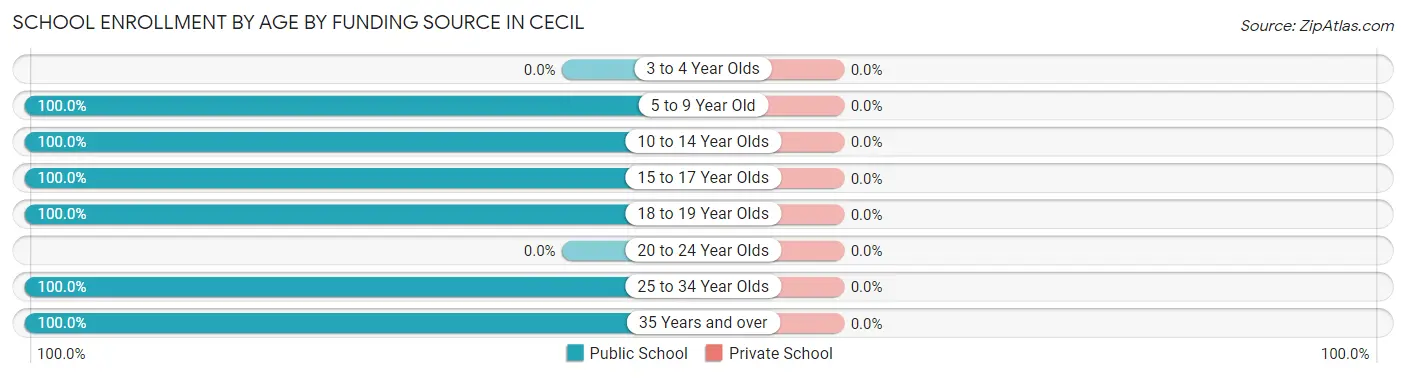
| Age Bracket | Public School | Private School |
| 3 to 4 Year Olds | 0 (0.0%) | 0 (0.0%) |
| 5 to 9 Year Old | 25 (100.0%) | 0 (0.0%) |
| 10 to 14 Year Olds | 4 (100.0%) | 0 (0.0%) |
| 15 to 17 Year Olds | 33 (100.0%) | 0 (0.0%) |
| 18 to 19 Year Olds | 14 (100.0%) | 0 (0.0%) |
| 20 to 24 Year Olds | 0 (0.0%) | 0 (0.0%) |
| 25 to 34 Year Olds | 3 (100.0%) | 0 (0.0%) |
| 35 Years and over | 1 (100.0%) | 0 (0.0%) |
| Total | 80 (100.0%) | 0 (0.0%) |
Educational Attainment by Field of Study in Cecil
Psychology (4 | 28.6%), business (4 | 28.6%), engineering (3 | 21.4%), liberal arts & history (2 | 14.3%), and literature & languages (1 | 7.1%) are the most common fields of study among 14 individuals in Cecil who have obtained a bachelor's degree or higher.
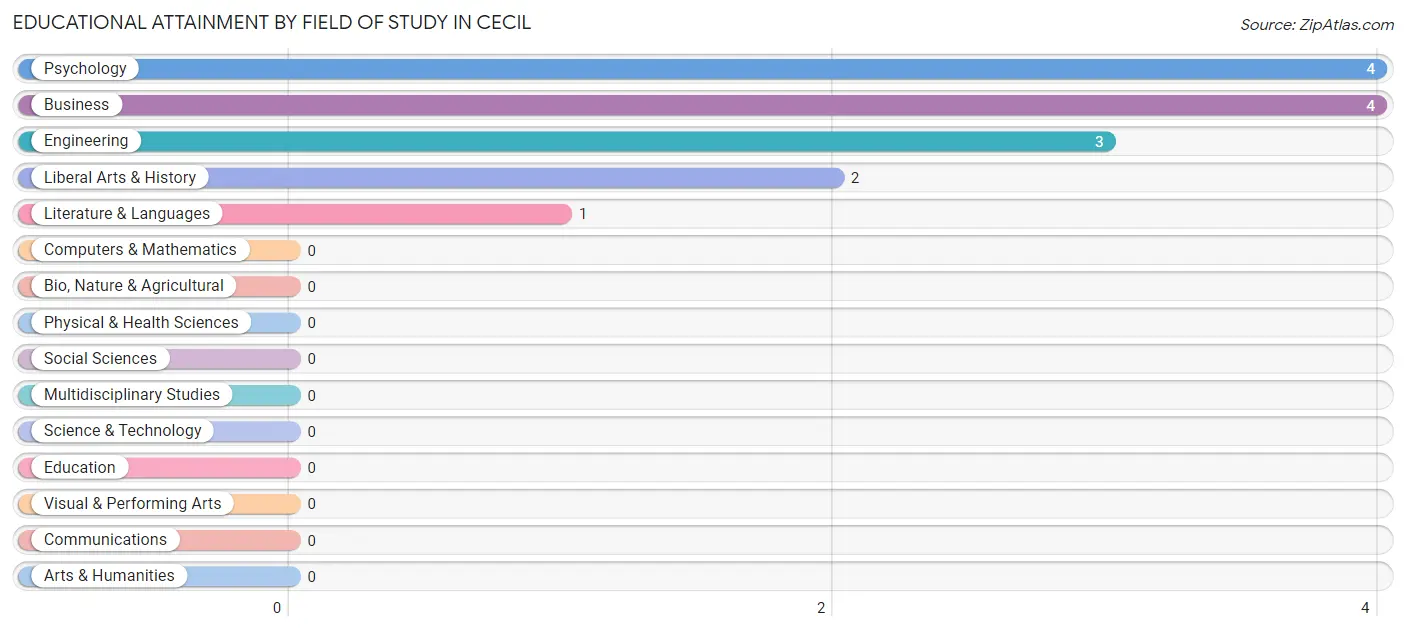
| Field of Study | # Graduates | % Graduates |
| Computers & Mathematics | 0 | 0.0% |
| Bio, Nature & Agricultural | 0 | 0.0% |
| Physical & Health Sciences | 0 | 0.0% |
| Psychology | 4 | 28.6% |
| Social Sciences | 0 | 0.0% |
| Engineering | 3 | 21.4% |
| Multidisciplinary Studies | 0 | 0.0% |
| Science & Technology | 0 | 0.0% |
| Business | 4 | 28.6% |
| Education | 0 | 0.0% |
| Literature & Languages | 1 | 7.1% |
| Liberal Arts & History | 2 | 14.3% |
| Visual & Performing Arts | 0 | 0.0% |
| Communications | 0 | 0.0% |
| Arts & Humanities | 0 | 0.0% |
| Total | 14 | 100.0% |
Transportation & Commute in Cecil
Vehicle Availability by Sex in Cecil
The most prevalent vehicle ownership categories in Cecil are males with 1 vehicle (31, accounting for 46.3%) and females with 1 vehicle (11, making up 47.0%).
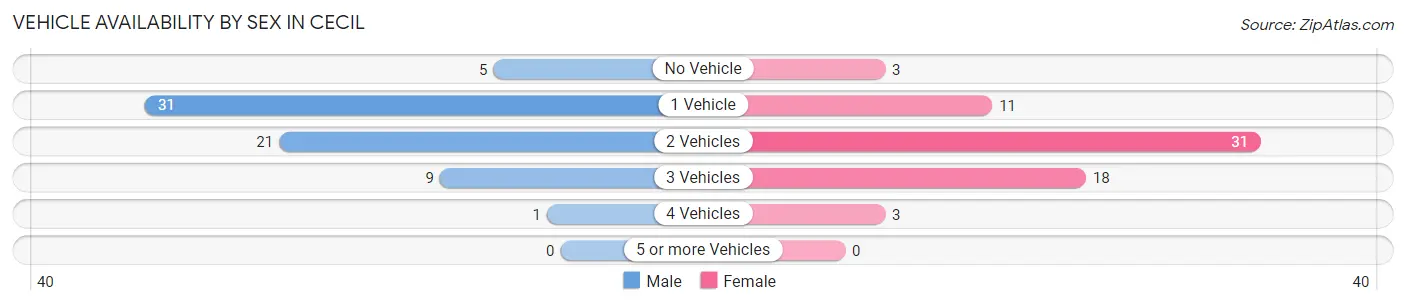
| Vehicles Available | Male | Female |
| No Vehicle | 5 (7.5%) | 3 (4.5%) |
| 1 Vehicle | 31 (46.3%) | 11 (16.7%) |
| 2 Vehicles | 21 (31.3%) | 31 (47.0%) |
| 3 Vehicles | 9 (13.4%) | 18 (27.3%) |
| 4 Vehicles | 1 (1.5%) | 3 (4.5%) |
| 5 or more Vehicles | 0 (0.0%) | 0 (0.0%) |
| Total | 67 (100.0%) | 66 (100.0%) |
Commute Time in Cecil
The most frequently occuring commute durations in Cecil are 30 to 34 minutes (32 commuters, 25.0%), 5 to 9 minutes (30 commuters, 23.4%), and 15 to 19 minutes (19 commuters, 14.8%).
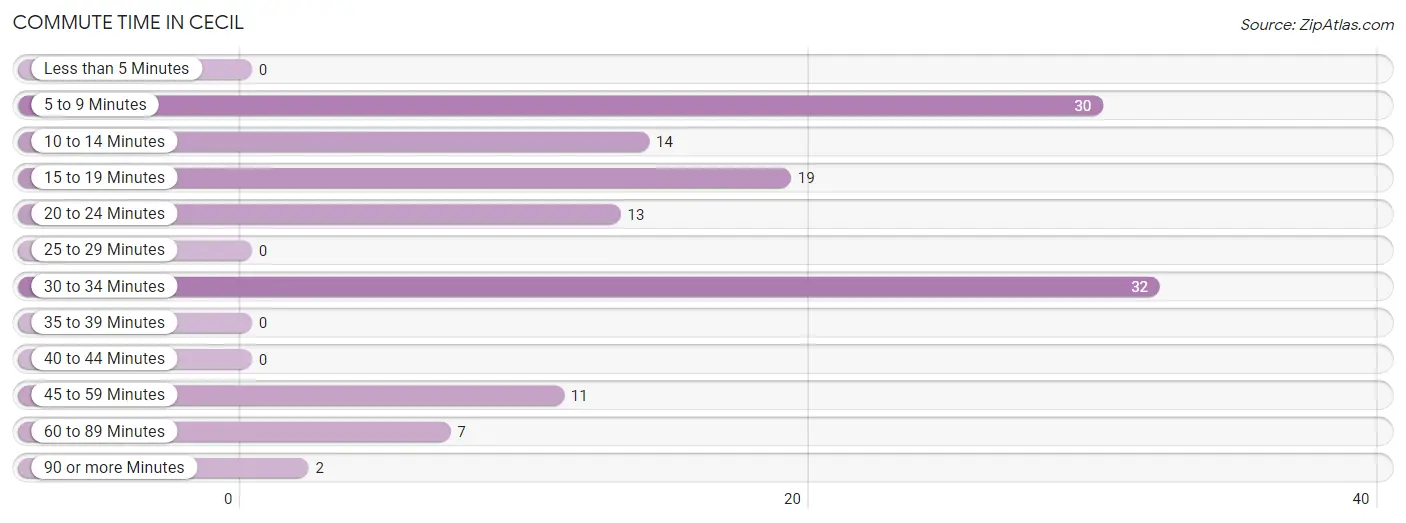
| Commute Time | # Commuters | % Commuters |
| Less than 5 Minutes | 0 | 0.0% |
| 5 to 9 Minutes | 30 | 23.4% |
| 10 to 14 Minutes | 14 | 10.9% |
| 15 to 19 Minutes | 19 | 14.8% |
| 20 to 24 Minutes | 13 | 10.2% |
| 25 to 29 Minutes | 0 | 0.0% |
| 30 to 34 Minutes | 32 | 25.0% |
| 35 to 39 Minutes | 0 | 0.0% |
| 40 to 44 Minutes | 0 | 0.0% |
| 45 to 59 Minutes | 11 | 8.6% |
| 60 to 89 Minutes | 7 | 5.5% |
| 90 or more Minutes | 2 | 1.6% |
Commute Time by Sex in Cecil
The most common commute times in Cecil are 5 to 9 minutes (18 commuters, 28.1%) for males and 30 to 34 minutes (28 commuters, 43.8%) for females.
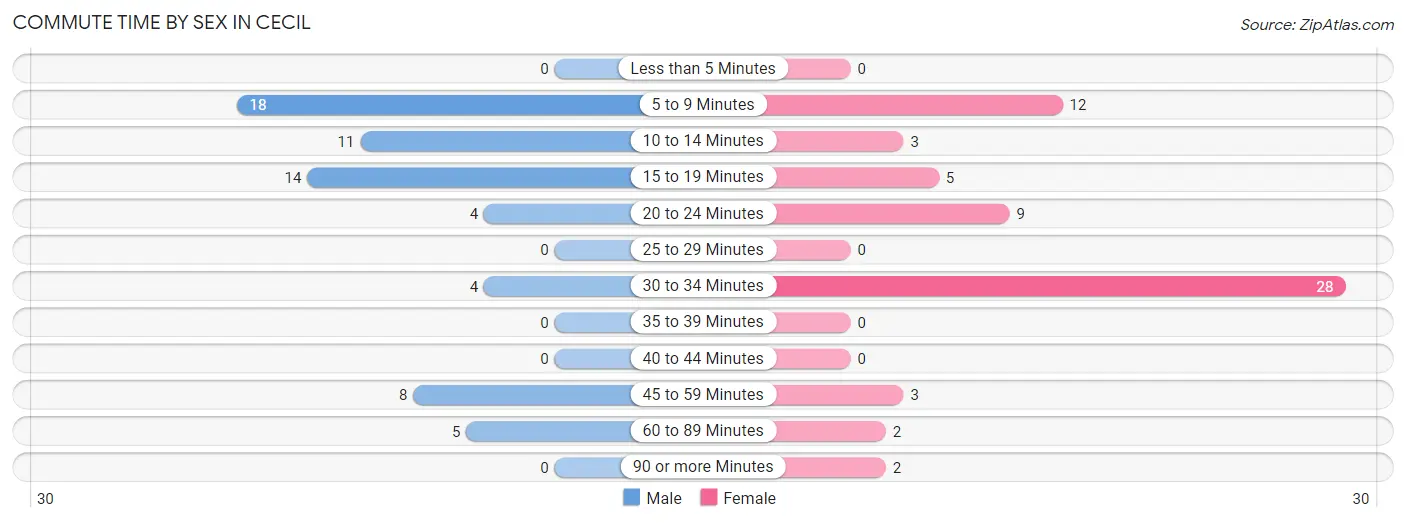
| Commute Time | Male | Female |
| Less than 5 Minutes | 0 (0.0%) | 0 (0.0%) |
| 5 to 9 Minutes | 18 (28.1%) | 12 (18.8%) |
| 10 to 14 Minutes | 11 (17.2%) | 3 (4.7%) |
| 15 to 19 Minutes | 14 (21.9%) | 5 (7.8%) |
| 20 to 24 Minutes | 4 (6.2%) | 9 (14.1%) |
| 25 to 29 Minutes | 0 (0.0%) | 0 (0.0%) |
| 30 to 34 Minutes | 4 (6.2%) | 28 (43.8%) |
| 35 to 39 Minutes | 0 (0.0%) | 0 (0.0%) |
| 40 to 44 Minutes | 0 (0.0%) | 0 (0.0%) |
| 45 to 59 Minutes | 8 (12.5%) | 3 (4.7%) |
| 60 to 89 Minutes | 5 (7.8%) | 2 (3.1%) |
| 90 or more Minutes | 0 (0.0%) | 2 (3.1%) |
Time of Departure to Work by Sex in Cecil
The most frequent times of departure to work in Cecil are 5:00 AM to 5:29 AM (15, 23.4%) for males and 6:00 AM to 6:29 AM (24, 37.5%) for females.
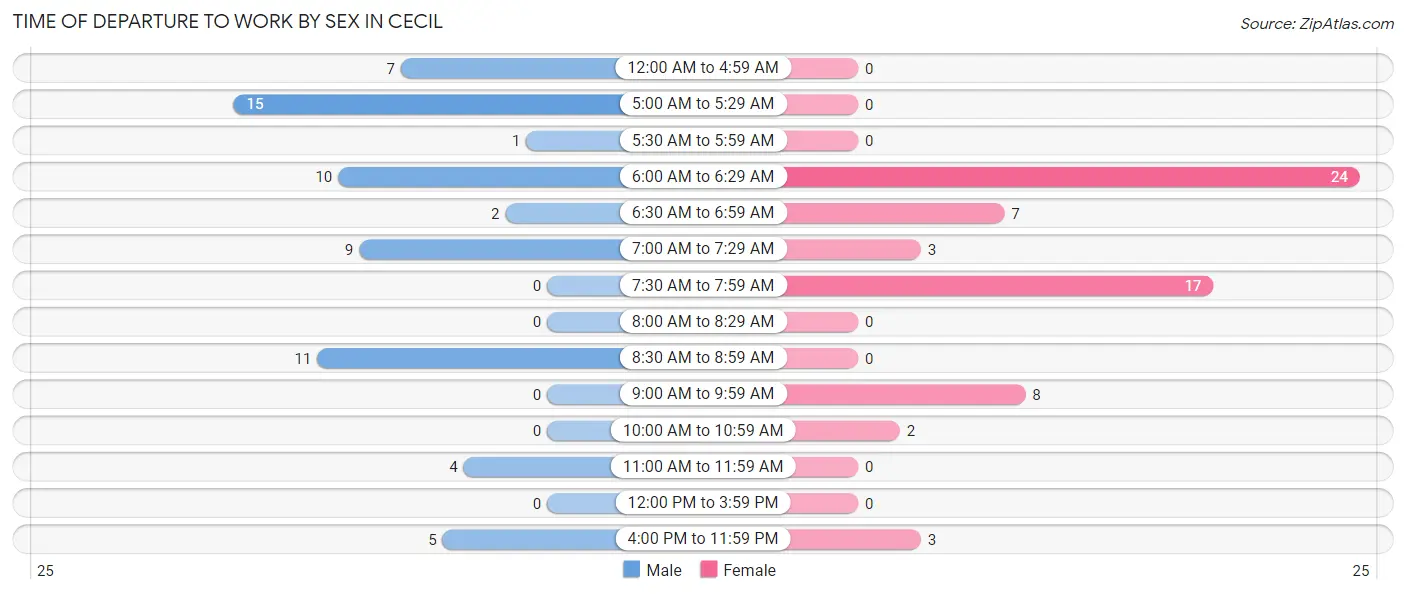
| Time of Departure | Male | Female |
| 12:00 AM to 4:59 AM | 7 (10.9%) | 0 (0.0%) |
| 5:00 AM to 5:29 AM | 15 (23.4%) | 0 (0.0%) |
| 5:30 AM to 5:59 AM | 1 (1.6%) | 0 (0.0%) |
| 6:00 AM to 6:29 AM | 10 (15.6%) | 24 (37.5%) |
| 6:30 AM to 6:59 AM | 2 (3.1%) | 7 (10.9%) |
| 7:00 AM to 7:29 AM | 9 (14.1%) | 3 (4.7%) |
| 7:30 AM to 7:59 AM | 0 (0.0%) | 17 (26.6%) |
| 8:00 AM to 8:29 AM | 0 (0.0%) | 0 (0.0%) |
| 8:30 AM to 8:59 AM | 11 (17.2%) | 0 (0.0%) |
| 9:00 AM to 9:59 AM | 0 (0.0%) | 8 (12.5%) |
| 10:00 AM to 10:59 AM | 0 (0.0%) | 2 (3.1%) |
| 11:00 AM to 11:59 AM | 4 (6.2%) | 0 (0.0%) |
| 12:00 PM to 3:59 PM | 0 (0.0%) | 0 (0.0%) |
| 4:00 PM to 11:59 PM | 5 (7.8%) | 3 (4.7%) |
| Total | 64 (100.0%) | 64 (100.0%) |
Housing Occupancy in Cecil
Occupancy by Ownership in Cecil
Of the total 116 dwellings in Cecil, owner-occupied units account for 77 (66.4%), while renter-occupied units make up 39 (33.6%).
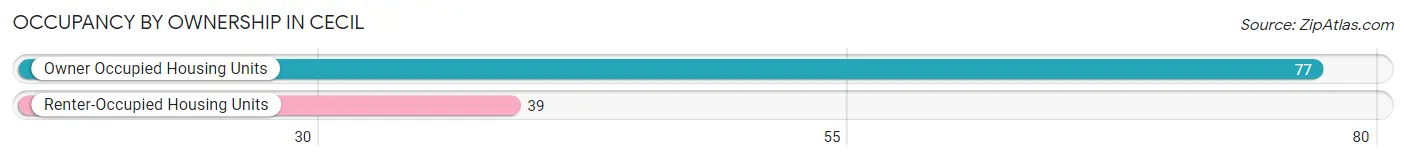
| Occupancy | # Housing Units | % Housing Units |
| Owner Occupied Housing Units | 77 | 66.4% |
| Renter-Occupied Housing Units | 39 | 33.6% |
| Total Occupied Housing Units | 116 | 100.0% |
Occupancy by Household Size in Cecil
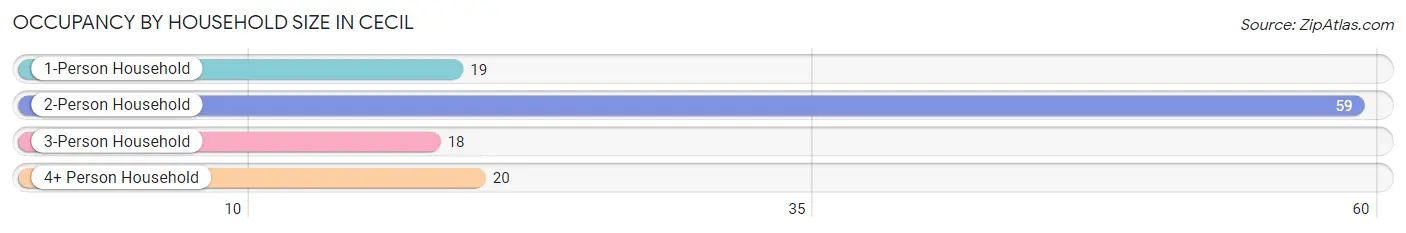
| Household Size | # Housing Units | % Housing Units |
| 1-Person Household | 19 | 16.4% |
| 2-Person Household | 59 | 50.9% |
| 3-Person Household | 18 | 15.5% |
| 4+ Person Household | 20 | 17.2% |
| Total Housing Units | 116 | 100.0% |
Occupancy by Ownership by Household Size in Cecil
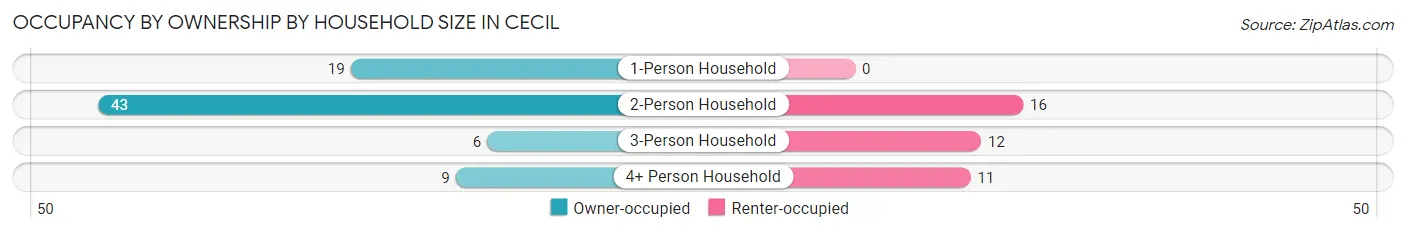
| Household Size | Owner-occupied | Renter-occupied |
| 1-Person Household | 19 (100.0%) | 0 (0.0%) |
| 2-Person Household | 43 (72.9%) | 16 (27.1%) |
| 3-Person Household | 6 (33.3%) | 12 (66.7%) |
| 4+ Person Household | 9 (45.0%) | 11 (55.0%) |
| Total Housing Units | 77 (66.4%) | 39 (33.6%) |
Occupancy by Educational Attainment in Cecil
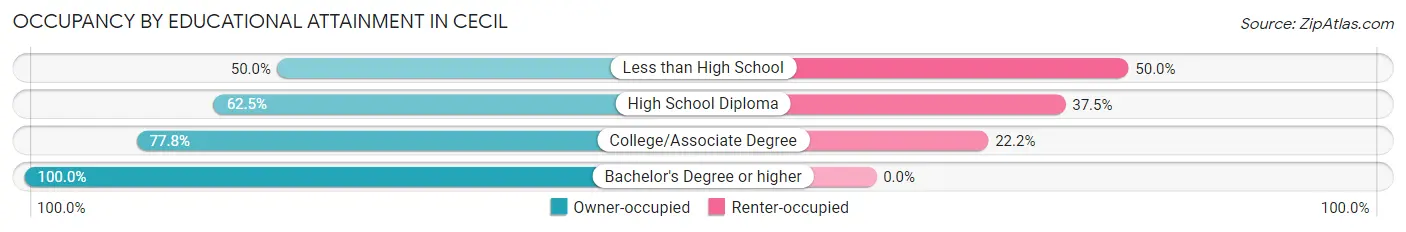
| Household Size | Owner-occupied | Renter-occupied |
| Less than High School | 16 (50.0%) | 16 (50.0%) |
| High School Diploma | 25 (62.5%) | 15 (37.5%) |
| College/Associate Degree | 28 (77.8%) | 8 (22.2%) |
| Bachelor's Degree or higher | 8 (100.0%) | 0 (0.0%) |
Occupancy by Age of Householder in Cecil
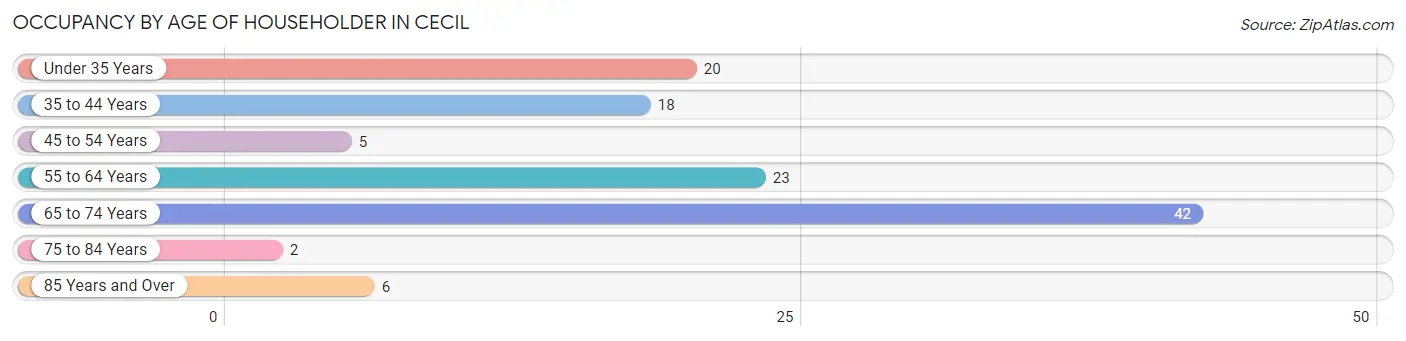
| Age Bracket | # Households | % Households |
| Under 35 Years | 20 | 17.2% |
| 35 to 44 Years | 18 | 15.5% |
| 45 to 54 Years | 5 | 4.3% |
| 55 to 64 Years | 23 | 19.8% |
| 65 to 74 Years | 42 | 36.2% |
| 75 to 84 Years | 2 | 1.7% |
| 85 Years and Over | 6 | 5.2% |
| Total | 116 | 100.0% |
Housing Finances in Cecil
Median Income by Occupancy in Cecil
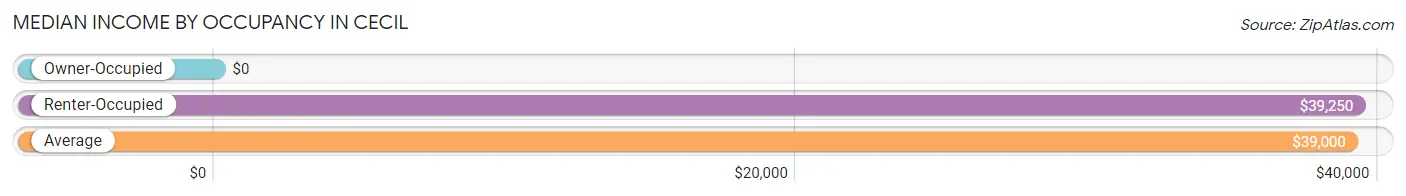
| Occupancy Type | # Households | Median Income |
| Owner-Occupied | 77 (66.4%) | $0 |
| Renter-Occupied | 39 (33.6%) | $39,250 |
| Average | 116 (100.0%) | $39,000 |
Occupancy by Householder Income Bracket in Cecil
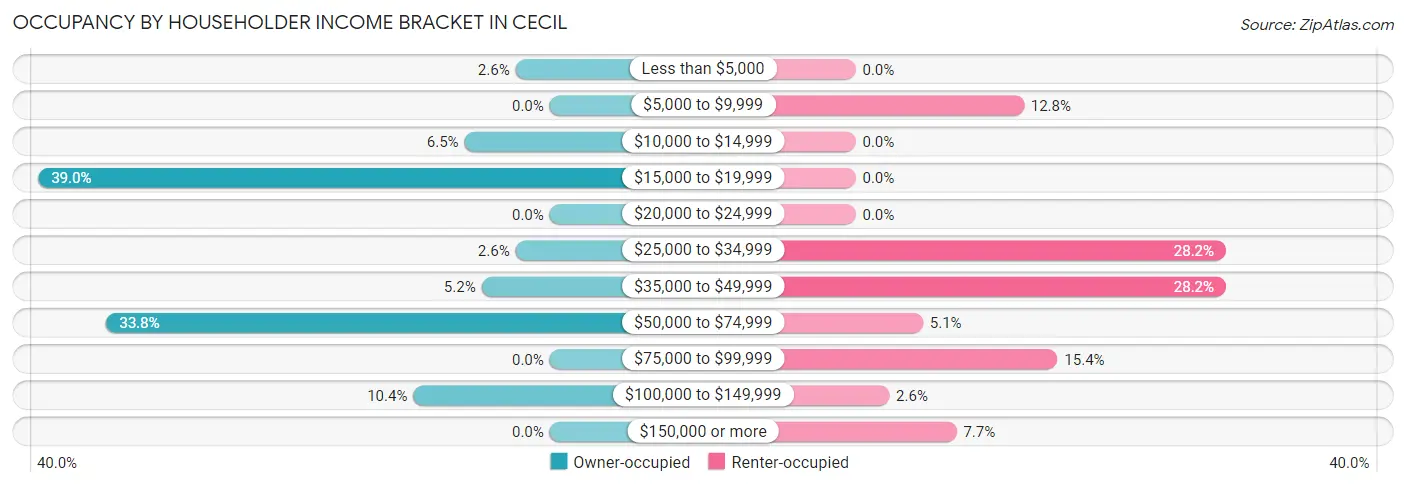
| Income Bracket | Owner-occupied | Renter-occupied |
| Less than $5,000 | 2 (2.6%) | 0 (0.0%) |
| $5,000 to $9,999 | 0 (0.0%) | 5 (12.8%) |
| $10,000 to $14,999 | 5 (6.5%) | 0 (0.0%) |
| $15,000 to $19,999 | 30 (39.0%) | 0 (0.0%) |
| $20,000 to $24,999 | 0 (0.0%) | 0 (0.0%) |
| $25,000 to $34,999 | 2 (2.6%) | 11 (28.2%) |
| $35,000 to $49,999 | 4 (5.2%) | 11 (28.2%) |
| $50,000 to $74,999 | 26 (33.8%) | 2 (5.1%) |
| $75,000 to $99,999 | 0 (0.0%) | 6 (15.4%) |
| $100,000 to $149,999 | 8 (10.4%) | 1 (2.6%) |
| $150,000 or more | 0 (0.0%) | 3 (7.7%) |
| Total | 77 (100.0%) | 39 (100.0%) |
Monthly Housing Cost Tiers in Cecil
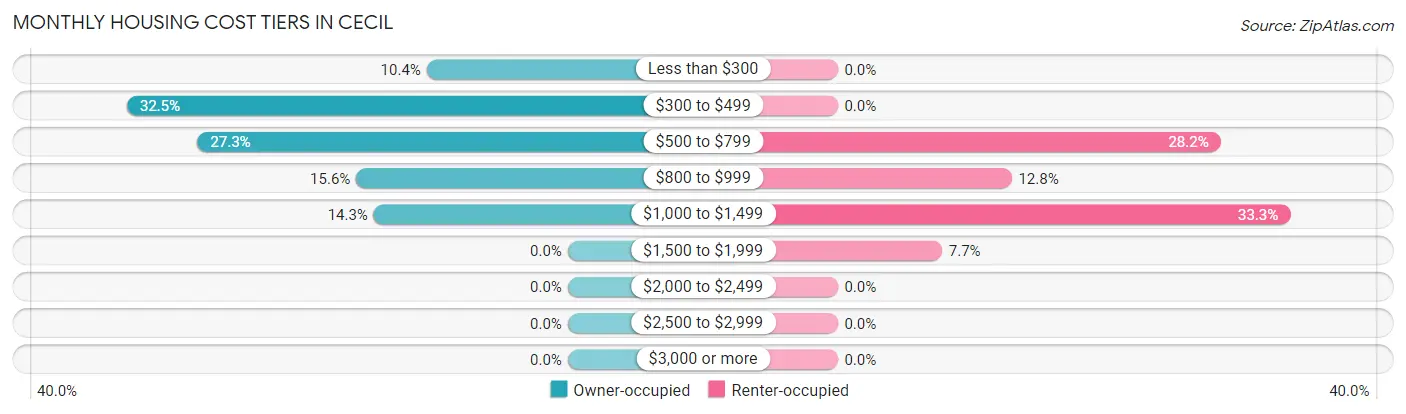
| Monthly Cost | Owner-occupied | Renter-occupied |
| Less than $300 | 8 (10.4%) | 0 (0.0%) |
| $300 to $499 | 25 (32.5%) | 0 (0.0%) |
| $500 to $799 | 21 (27.3%) | 11 (28.2%) |
| $800 to $999 | 12 (15.6%) | 5 (12.8%) |
| $1,000 to $1,499 | 11 (14.3%) | 13 (33.3%) |
| $1,500 to $1,999 | 0 (0.0%) | 3 (7.7%) |
| $2,000 to $2,499 | 0 (0.0%) | 0 (0.0%) |
| $2,500 to $2,999 | 0 (0.0%) | 0 (0.0%) |
| $3,000 or more | 0 (0.0%) | 0 (0.0%) |
| Total | 77 (100.0%) | 39 (100.0%) |
Physical Housing Characteristics in Cecil
Housing Structures in Cecil
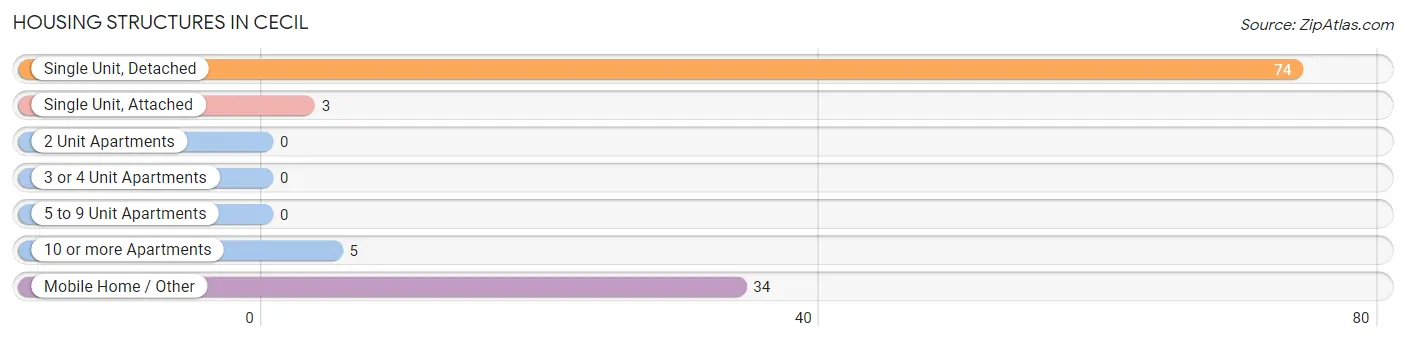
| Structure Type | # Housing Units | % Housing Units |
| Single Unit, Detached | 74 | 63.8% |
| Single Unit, Attached | 3 | 2.6% |
| 2 Unit Apartments | 0 | 0.0% |
| 3 or 4 Unit Apartments | 0 | 0.0% |
| 5 to 9 Unit Apartments | 0 | 0.0% |
| 10 or more Apartments | 5 | 4.3% |
| Mobile Home / Other | 34 | 29.3% |
| Total | 116 | 100.0% |
Housing Structures by Occupancy in Cecil
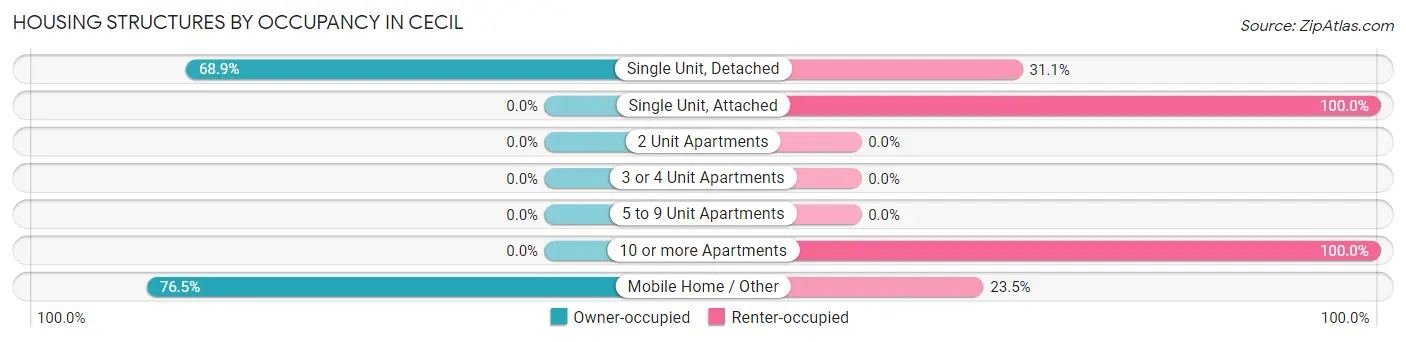
| Structure Type | Owner-occupied | Renter-occupied |
| Single Unit, Detached | 51 (68.9%) | 23 (31.1%) |
| Single Unit, Attached | 0 (0.0%) | 3 (100.0%) |
| 2 Unit Apartments | 0 (0.0%) | 0 (0.0%) |
| 3 or 4 Unit Apartments | 0 (0.0%) | 0 (0.0%) |
| 5 to 9 Unit Apartments | 0 (0.0%) | 0 (0.0%) |
| 10 or more Apartments | 0 (0.0%) | 5 (100.0%) |
| Mobile Home / Other | 26 (76.5%) | 8 (23.5%) |
| Total | 77 (66.4%) | 39 (33.6%) |
Housing Structures by Number of Rooms in Cecil
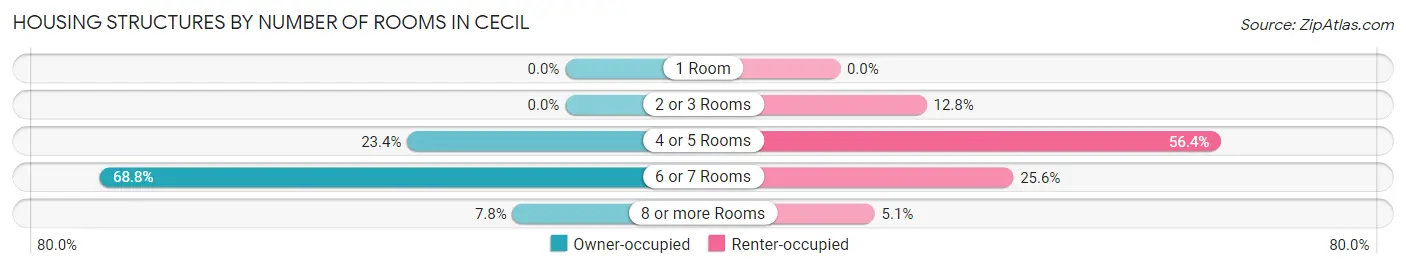
| Number of Rooms | Owner-occupied | Renter-occupied |
| 1 Room | 0 (0.0%) | 0 (0.0%) |
| 2 or 3 Rooms | 0 (0.0%) | 5 (12.8%) |
| 4 or 5 Rooms | 18 (23.4%) | 22 (56.4%) |
| 6 or 7 Rooms | 53 (68.8%) | 10 (25.6%) |
| 8 or more Rooms | 6 (7.8%) | 2 (5.1%) |
| Total | 77 (100.0%) | 39 (100.0%) |
Housing Structure by Heating Type in Cecil
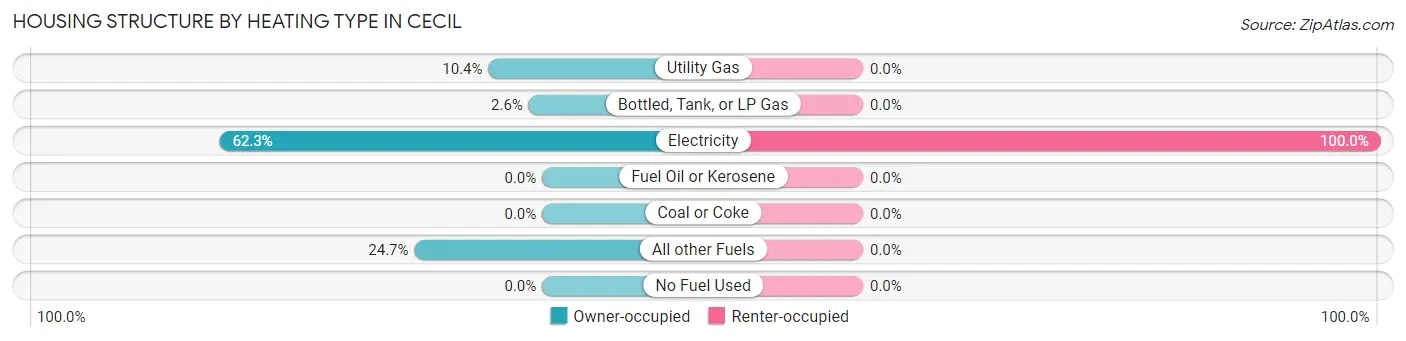
| Heating Type | Owner-occupied | Renter-occupied |
| Utility Gas | 8 (10.4%) | 0 (0.0%) |
| Bottled, Tank, or LP Gas | 2 (2.6%) | 0 (0.0%) |
| Electricity | 48 (62.3%) | 39 (100.0%) |
| Fuel Oil or Kerosene | 0 (0.0%) | 0 (0.0%) |
| Coal or Coke | 0 (0.0%) | 0 (0.0%) |
| All other Fuels | 19 (24.7%) | 0 (0.0%) |
| No Fuel Used | 0 (0.0%) | 0 (0.0%) |
| Total | 77 (100.0%) | 39 (100.0%) |
Household Vehicle Usage in Cecil
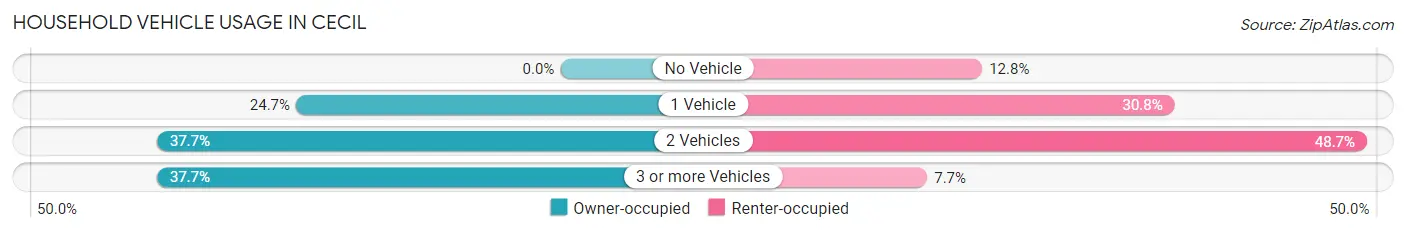
| Vehicles per Household | Owner-occupied | Renter-occupied |
| No Vehicle | 0 (0.0%) | 5 (12.8%) |
| 1 Vehicle | 19 (24.7%) | 12 (30.8%) |
| 2 Vehicles | 29 (37.7%) | 19 (48.7%) |
| 3 or more Vehicles | 29 (37.7%) | 3 (7.7%) |
| Total | 77 (100.0%) | 39 (100.0%) |
Real Estate & Mortgages in Cecil
Real Estate and Mortgage Overview in Cecil
| Characteristic | Without Mortgage | With Mortgage |
| Housing Units | 39 | 38 |
| Median Property Value | $80,800 | $0 |
| Median Household Income | $53,194 | $0 |
| Monthly Housing Costs | $539 | $0 |
| Real Estate Taxes | $850 | $3 |
Property Value by Mortgage Status in Cecil
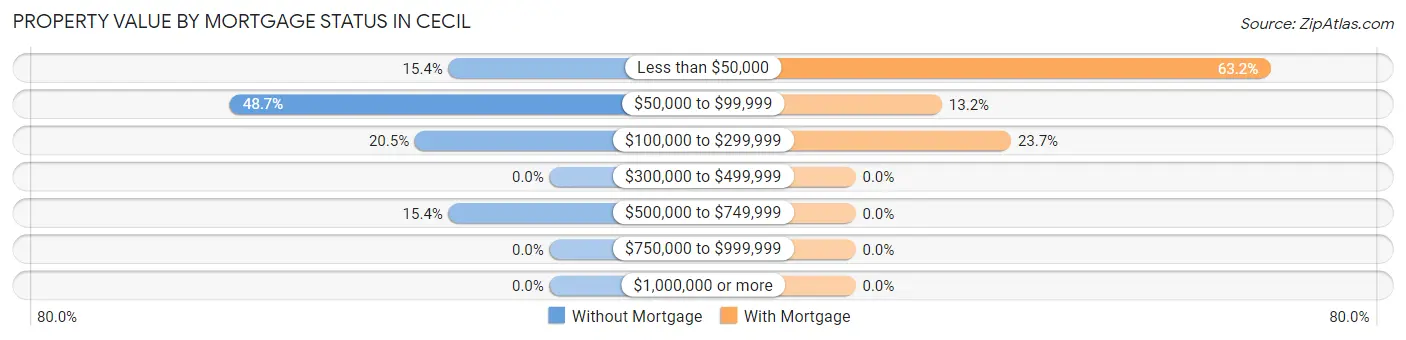
| Property Value | Without Mortgage | With Mortgage |
| Less than $50,000 | 6 (15.4%) | 24 (63.2%) |
| $50,000 to $99,999 | 19 (48.7%) | 5 (13.2%) |
| $100,000 to $299,999 | 8 (20.5%) | 9 (23.7%) |
| $300,000 to $499,999 | 0 (0.0%) | 0 (0.0%) |
| $500,000 to $749,999 | 6 (15.4%) | 0 (0.0%) |
| $750,000 to $999,999 | 0 (0.0%) | 0 (0.0%) |
| $1,000,000 or more | 0 (0.0%) | 0 (0.0%) |
| Total | 39 (100.0%) | 38 (100.0%) |
Household Income by Mortgage Status in Cecil
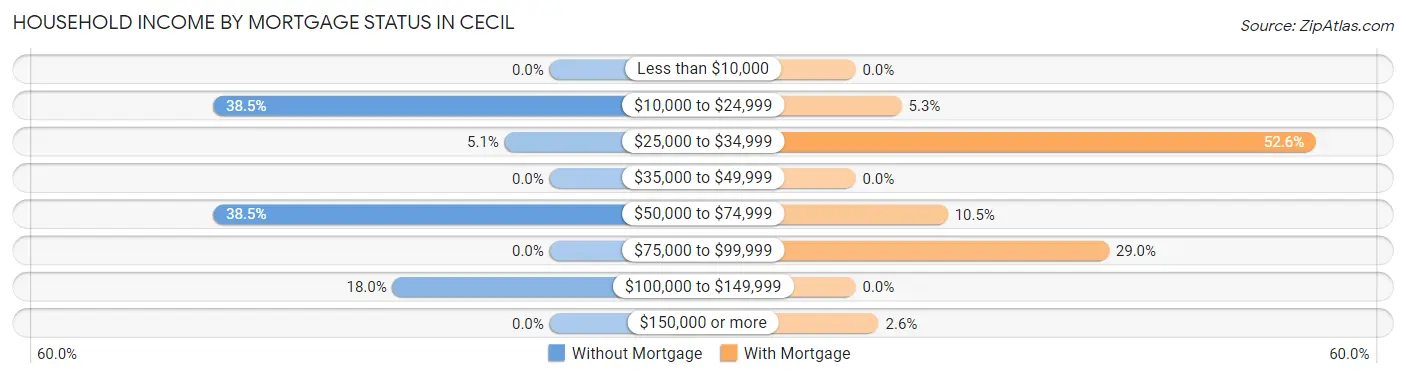
| Household Income | Without Mortgage | With Mortgage |
| Less than $10,000 | 0 (0.0%) | 0 (0.0%) |
| $10,000 to $24,999 | 15 (38.5%) | 2 (5.3%) |
| $25,000 to $34,999 | 2 (5.1%) | 20 (52.6%) |
| $35,000 to $49,999 | 0 (0.0%) | 0 (0.0%) |
| $50,000 to $74,999 | 15 (38.5%) | 4 (10.5%) |
| $75,000 to $99,999 | 0 (0.0%) | 11 (28.9%) |
| $100,000 to $149,999 | 7 (17.9%) | 0 (0.0%) |
| $150,000 or more | 0 (0.0%) | 1 (2.6%) |
| Total | 39 (100.0%) | 38 (100.0%) |
Property Value to Household Income Ratio in Cecil
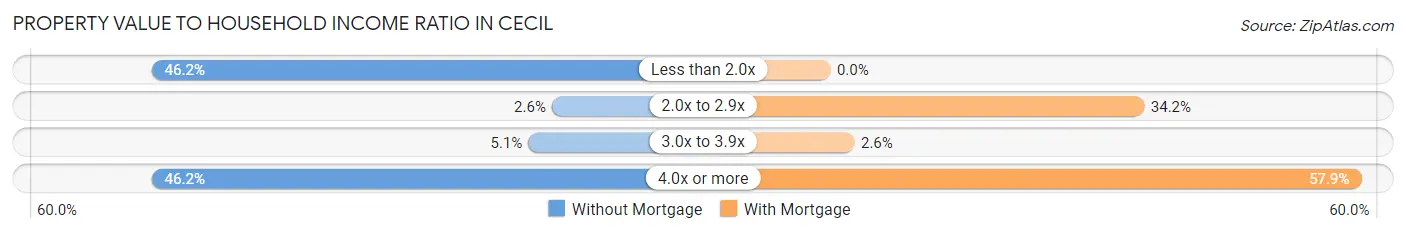
| Value-to-Income Ratio | Without Mortgage | With Mortgage |
| Less than 2.0x | 18 (46.2%) | 0 (0.0%) |
| 2.0x to 2.9x | 1 (2.6%) | 13 (34.2%) |
| 3.0x to 3.9x | 2 (5.1%) | 1 (2.6%) |
| 4.0x or more | 18 (46.2%) | 22 (57.9%) |
| Total | 39 (100.0%) | 38 (100.0%) |
Real Estate Taxes by Mortgage Status in Cecil
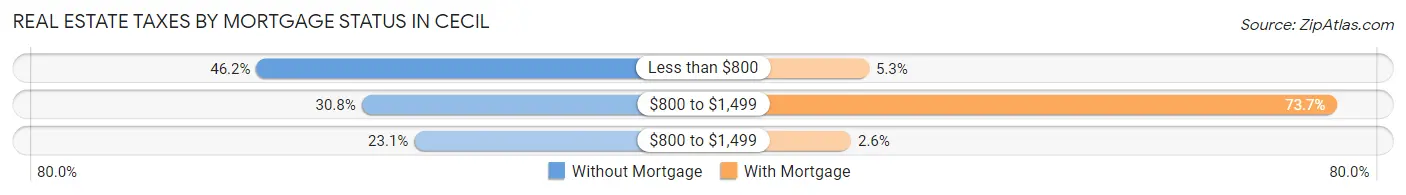
| Property Taxes | Without Mortgage | With Mortgage |
| Less than $800 | 18 (46.2%) | 2 (5.3%) |
| $800 to $1,499 | 12 (30.8%) | 28 (73.7%) |
| $800 to $1,499 | 9 (23.1%) | 1 (2.6%) |
| Total | 39 (100.0%) | 38 (100.0%) |
Health & Disability in Cecil
Health Insurance Coverage by Age in Cecil
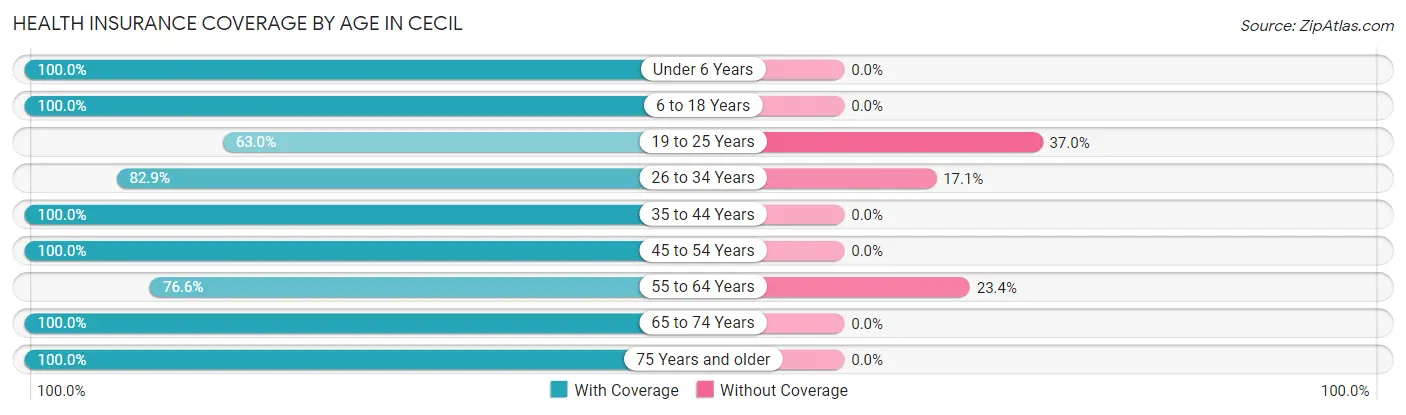
| Age Bracket | With Coverage | Without Coverage |
| Under 6 Years | 11 (100.0%) | 0 (0.0%) |
| 6 to 18 Years | 73 (100.0%) | 0 (0.0%) |
| 19 to 25 Years | 29 (63.0%) | 17 (37.0%) |
| 26 to 34 Years | 29 (82.9%) | 6 (17.1%) |
| 35 to 44 Years | 41 (100.0%) | 0 (0.0%) |
| 45 to 54 Years | 29 (100.0%) | 0 (0.0%) |
| 55 to 64 Years | 36 (76.6%) | 11 (23.4%) |
| 65 to 74 Years | 54 (100.0%) | 0 (0.0%) |
| 75 Years and older | 13 (100.0%) | 0 (0.0%) |
| Total | 315 (90.3%) | 34 (9.7%) |
Health Insurance Coverage by Citizenship Status in Cecil
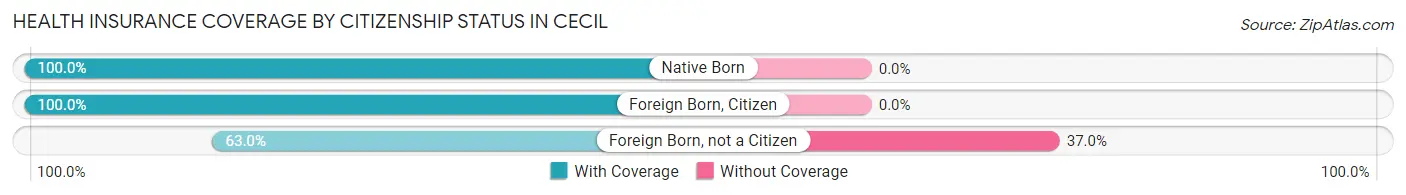
| Citizenship Status | With Coverage | Without Coverage |
| Native Born | 11 (100.0%) | 0 (0.0%) |
| Foreign Born, Citizen | 73 (100.0%) | 0 (0.0%) |
| Foreign Born, not a Citizen | 29 (63.0%) | 17 (37.0%) |
Health Insurance Coverage by Household Income in Cecil
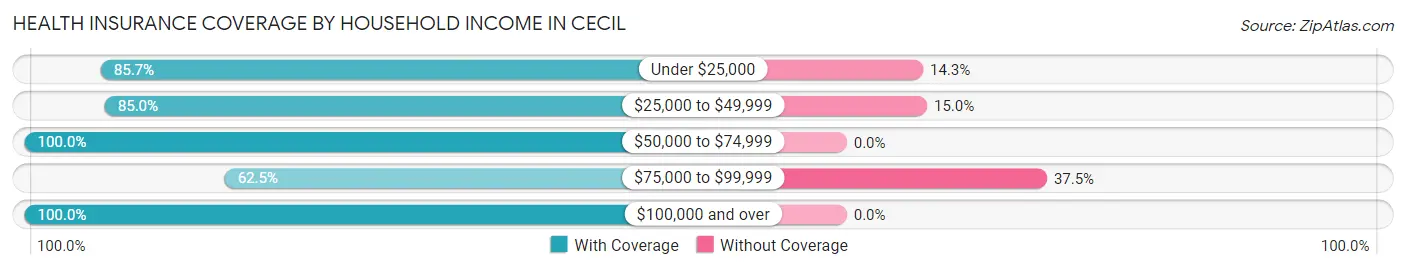
| Household Income | With Coverage | Without Coverage |
| Under $25,000 | 48 (85.7%) | 8 (14.3%) |
| $25,000 to $49,999 | 113 (85.0%) | 20 (15.0%) |
| $50,000 to $74,999 | 110 (100.0%) | 0 (0.0%) |
| $75,000 to $99,999 | 10 (62.5%) | 6 (37.5%) |
| $100,000 and over | 34 (100.0%) | 0 (0.0%) |
Public vs Private Health Insurance Coverage by Age in Cecil
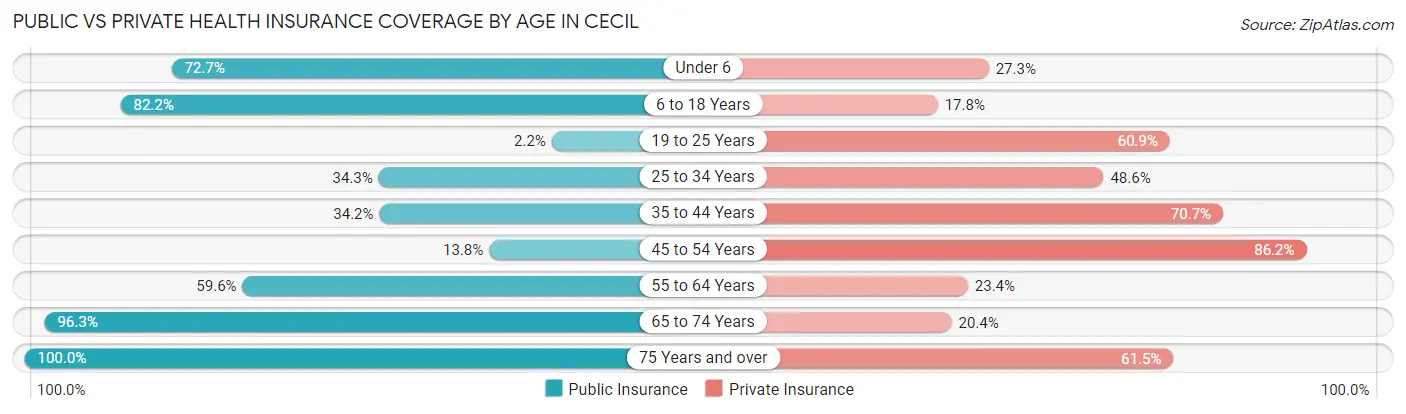
| Age Bracket | Public Insurance | Private Insurance |
| Under 6 | 8 (72.7%) | 3 (27.3%) |
| 6 to 18 Years | 60 (82.2%) | 13 (17.8%) |
| 19 to 25 Years | 1 (2.2%) | 28 (60.9%) |
| 25 to 34 Years | 12 (34.3%) | 17 (48.6%) |
| 35 to 44 Years | 14 (34.2%) | 29 (70.7%) |
| 45 to 54 Years | 4 (13.8%) | 25 (86.2%) |
| 55 to 64 Years | 28 (59.6%) | 11 (23.4%) |
| 65 to 74 Years | 52 (96.3%) | 11 (20.4%) |
| 75 Years and over | 13 (100.0%) | 8 (61.5%) |
| Total | 192 (55.0%) | 145 (41.5%) |
Disability Status by Sex by Age in Cecil
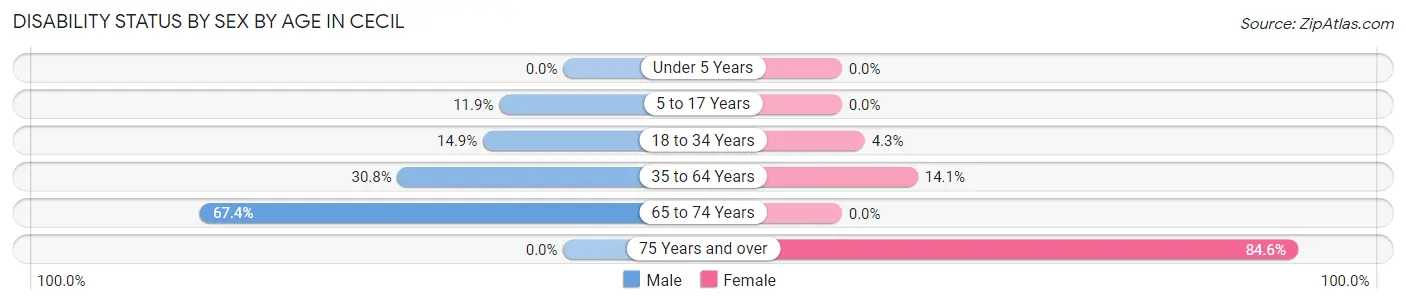
| Age Bracket | Male | Female |
| Under 5 Years | 0 (0.0%) | 0 (0.0%) |
| 5 to 17 Years | 5 (11.9%) | 0 (0.0%) |
| 18 to 34 Years | 7 (14.9%) | 2 (4.3%) |
| 35 to 64 Years | 12 (30.8%) | 11 (14.1%) |
| 65 to 74 Years | 29 (67.4%) | 0 (0.0%) |
| 75 Years and over | 0 (0.0%) | 11 (84.6%) |
Disability Class by Sex by Age in Cecil
Disability Class: Hearing Difficulty
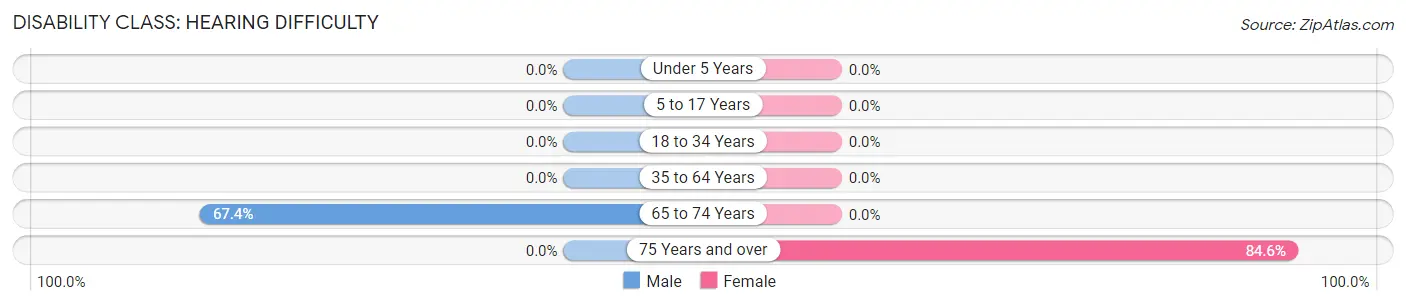
| Age Bracket | Male | Female |
| Under 5 Years | 0 (0.0%) | 0 (0.0%) |
| 5 to 17 Years | 0 (0.0%) | 0 (0.0%) |
| 18 to 34 Years | 0 (0.0%) | 0 (0.0%) |
| 35 to 64 Years | 0 (0.0%) | 0 (0.0%) |
| 65 to 74 Years | 29 (67.4%) | 0 (0.0%) |
| 75 Years and over | 0 (0.0%) | 11 (84.6%) |
Disability Class: Vision Difficulty
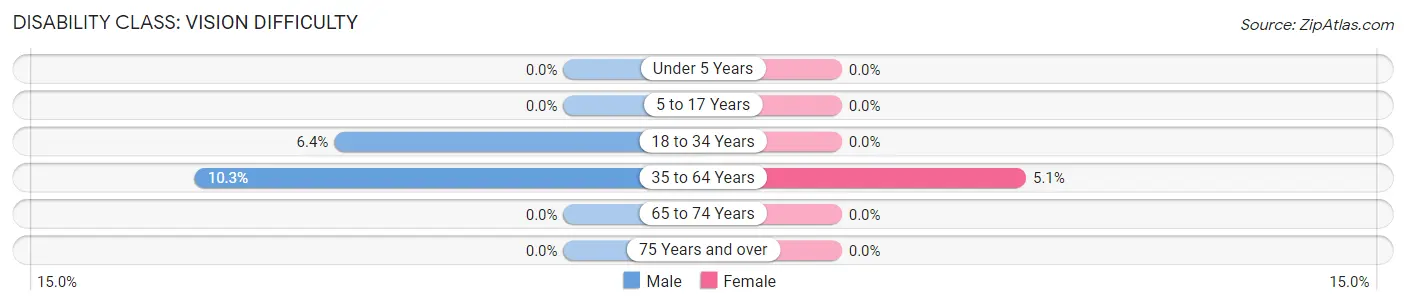
| Age Bracket | Male | Female |
| Under 5 Years | 0 (0.0%) | 0 (0.0%) |
| 5 to 17 Years | 0 (0.0%) | 0 (0.0%) |
| 18 to 34 Years | 3 (6.4%) | 0 (0.0%) |
| 35 to 64 Years | 4 (10.3%) | 4 (5.1%) |
| 65 to 74 Years | 0 (0.0%) | 0 (0.0%) |
| 75 Years and over | 0 (0.0%) | 0 (0.0%) |
Disability Class: Cognitive Difficulty
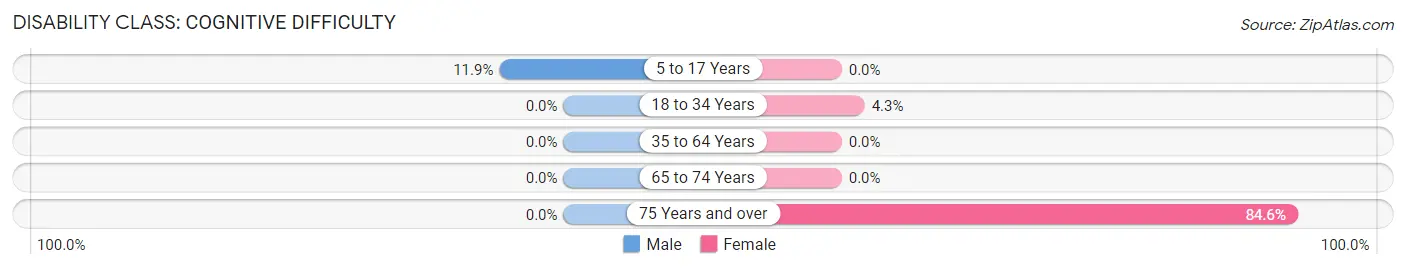
| Age Bracket | Male | Female |
| 5 to 17 Years | 5 (11.9%) | 0 (0.0%) |
| 18 to 34 Years | 0 (0.0%) | 2 (4.3%) |
| 35 to 64 Years | 0 (0.0%) | 0 (0.0%) |
| 65 to 74 Years | 0 (0.0%) | 0 (0.0%) |
| 75 Years and over | 0 (0.0%) | 11 (84.6%) |
Disability Class: Ambulatory Difficulty
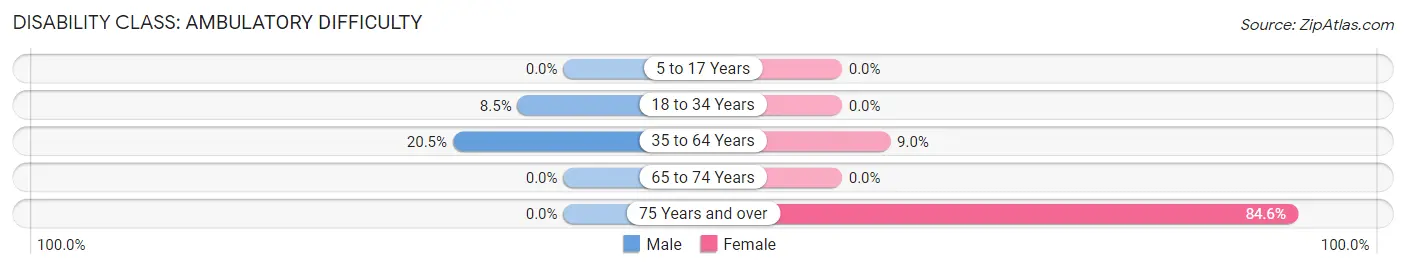
| Age Bracket | Male | Female |
| 5 to 17 Years | 0 (0.0%) | 0 (0.0%) |
| 18 to 34 Years | 4 (8.5%) | 0 (0.0%) |
| 35 to 64 Years | 8 (20.5%) | 7 (9.0%) |
| 65 to 74 Years | 0 (0.0%) | 0 (0.0%) |
| 75 Years and over | 0 (0.0%) | 11 (84.6%) |
Disability Class: Self-Care Difficulty
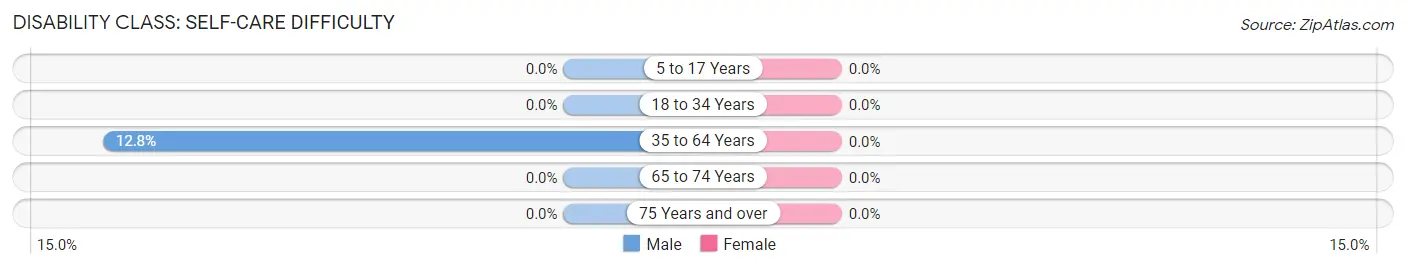
| Age Bracket | Male | Female |
| 5 to 17 Years | 0 (0.0%) | 0 (0.0%) |
| 18 to 34 Years | 0 (0.0%) | 0 (0.0%) |
| 35 to 64 Years | 5 (12.8%) | 0 (0.0%) |
| 65 to 74 Years | 0 (0.0%) | 0 (0.0%) |
| 75 Years and over | 0 (0.0%) | 0 (0.0%) |
Technology Access in Cecil
Computing Device Access in Cecil
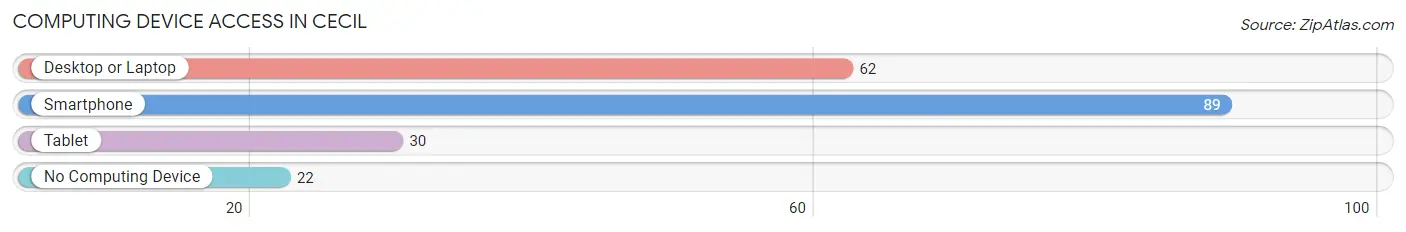
| Device Type | # Households | % Households |
| Desktop or Laptop | 62 | 53.4% |
| Smartphone | 89 | 76.7% |
| Tablet | 30 | 25.9% |
| No Computing Device | 22 | 19.0% |
| Total | 116 | 100.0% |
Internet Access in Cecil
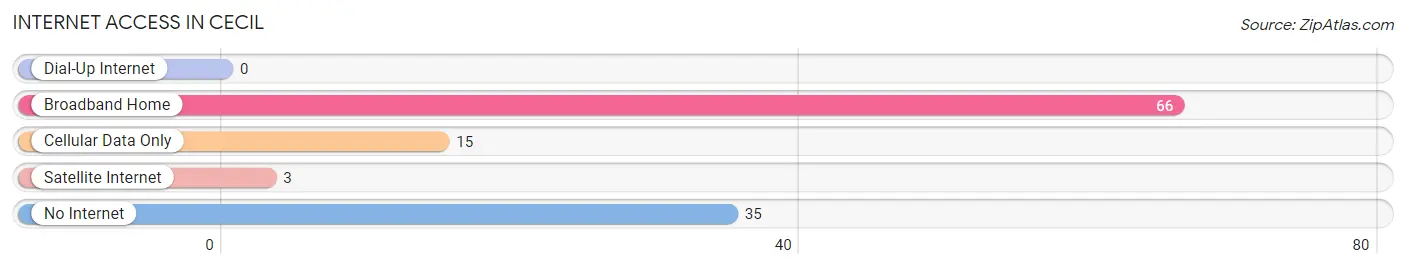
| Internet Type | # Households | % Households |
| Dial-Up Internet | 0 | 0.0% |
| Broadband Home | 66 | 56.9% |
| Cellular Data Only | 15 | 12.9% |
| Satellite Internet | 3 | 2.6% |
| No Internet | 35 | 30.2% |
| Total | 116 | 100.0% |
Cecil Summary
Cecil is a small unincorporated community located in Harris County, Georgia, United States. It is situated in the southwestern part of the county, approximately 10 miles south of Hamilton and 15 miles north of Columbus. The population of Cecil was estimated to be around 1,000 in 2020.
History
Cecil was founded in 1883 by a group of settlers from Alabama. The town was named after the first postmaster, William Cecil. The town was originally a farming community, but it soon developed into a small industrial center. The town was home to several cotton mills, a sawmill, and a gristmill. The town also had a railroad station, which was used to transport goods to and from the nearby cities of Hamilton and Columbus.
In the early 1900s, Cecil was a thriving community with a population of over 1,000 people. The town had several stores, churches, and a school. The town also had a movie theater, which was a popular destination for locals and visitors alike.
Geography
Cecil is located in the southwestern part of Harris County, Georgia. It is situated in the foothills of the Appalachian Mountains, approximately 10 miles south of Hamilton and 15 miles north of Columbus. The town is surrounded by rolling hills and forests, and is located near the Chattahoochee River.
The climate in Cecil is humid subtropical, with hot summers and mild winters. The average annual temperature is around 70 degrees Fahrenheit, and the average annual precipitation is around 50 inches.
Economy
Cecil’s economy is largely based on agriculture and forestry. The town is home to several farms, which produce a variety of crops, including corn, soybeans, cotton, and peanuts. The town also has several sawmills and lumber yards, which produce lumber for the local market.
In addition to agriculture and forestry, Cecil also has a small manufacturing sector. The town is home to several small factories, which produce a variety of products, including furniture, clothing, and electronics.
Demographics
As of 2020, the population of Cecil was estimated to be around 1,000 people. The town is predominantly white, with a small African American population. The median household income in Cecil is around $35,000, and the median home value is around $100,000.
Cecil is a small, rural community with a strong sense of community and a rich history. The town is home to several churches, schools, and businesses, and is a popular destination for visitors looking to explore the area’s natural beauty.
Common Questions
What is Per Capita Income in Cecil?
Per Capita income in Cecil is $18,419.
What is the Median Family Income in Cecil?
Median Family Income in Cecil is $41,875.
What is the Median Household income in Cecil?
Median Household Income in Cecil is $39,000.
What is Income or Wage Gap in Cecil?
Income or Wage Gap in Cecil is 21.4%.
Women in Cecil earn 78.6 cents for every dollar earned by a man.
What is Inequality or Gini Index in Cecil?
Inequality or Gini Index in Cecil is 0.41.
What is the Total Population of Cecil?
Total Population of Cecil is 349.
What is the Total Male Population of Cecil?
Total Male Population of Cecil is 175.
What is the Total Female Population of Cecil?
Total Female Population of Cecil is 174.
What is the Ratio of Males per 100 Females in Cecil?
There are 100.57 Males per 100 Females in Cecil.
What is the Ratio of Females per 100 Males in Cecil?
There are 99.43 Females per 100 Males in Cecil.
What is the Median Population Age in Cecil?
Median Population Age in Cecil is 39.8 Years.
What is the Average Family Size in Cecil
Average Family Size in Cecil is 3.0 People.
What is the Average Household Size in Cecil
Average Household Size in Cecil is 3.0 People.
How Large is the Labor Force in Cecil?
There are 133 People in the Labor Forcein in Cecil.
What is the Percentage of People in the Labor Force in Cecil?
44.8% of People are in the Labor Force in Cecil.