Cave Spring, GA Map & Demographics
Cave Spring Map
Cave Spring Overview
$22,613
PER CAPITA INCOME
$53,375
AVG FAMILY INCOME
$40,250
AVG HOUSEHOLD INCOME
10.2%
WAGE / INCOME GAP [ % ]
89.8¢/ $1
WAGE / INCOME GAP [ $ ]
0.45
INEQUALITY / GINI INDEX
982
TOTAL POPULATION
478
MALE POPULATION
504
FEMALE POPULATION
94.84
MALES / 100 FEMALES
105.44
FEMALES / 100 MALES
49.2
MEDIAN AGE
3.1
AVG FAMILY SIZE
2.5
AVG HOUSEHOLD SIZE
419
LABOR FORCE [ PEOPLE ]
52.0%
PERCENT IN LABOR FORCE
11.0%
UNEMPLOYMENT RATE
Cave Spring Zip Codes
Cave Spring Area Codes
Income in Cave Spring
Income Overview in Cave Spring
Per Capita Income in Cave Spring is $22,613, while median incomes of families and households are $53,375 and $40,250 respectively.
| Characteristic | Number | Measure |
| Per Capita Income | 982 | $22,613 |
| Median Family Income | 247 | $53,375 |
| Mean Family Income | 247 | $68,501 |
| Median Household Income | 369 | $40,250 |
| Mean Household Income | 369 | $56,050 |
| Income Deficit | 247 | $0 |
| Wage / Income Gap (%) | 982 | 10.16% |
| Wage / Income Gap ($) | 982 | 89.84¢ per $1 |
| Gini / Inequality Index | 982 | 0.45 |
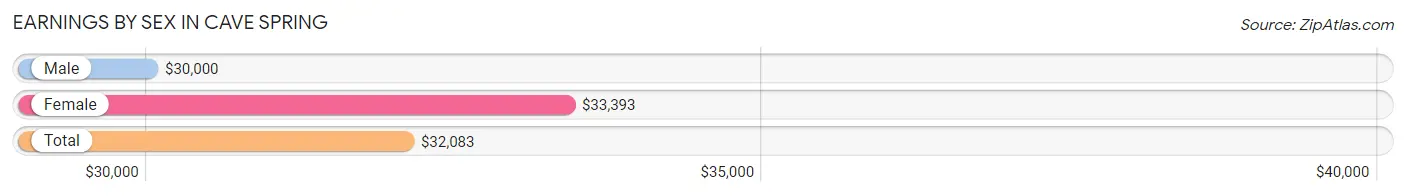
Earnings by Sex in Cave Spring
Average Earnings in Cave Spring are $32,083, $30,000 for men and $33,393 for women, a difference of 10.2%.
| Sex | Number | Average Earnings |
| Male | 184 (45.2%) | $30,000 |
| Female | 223 (54.8%) | $33,393 |
| Total | 407 (100.0%) | $32,083 |
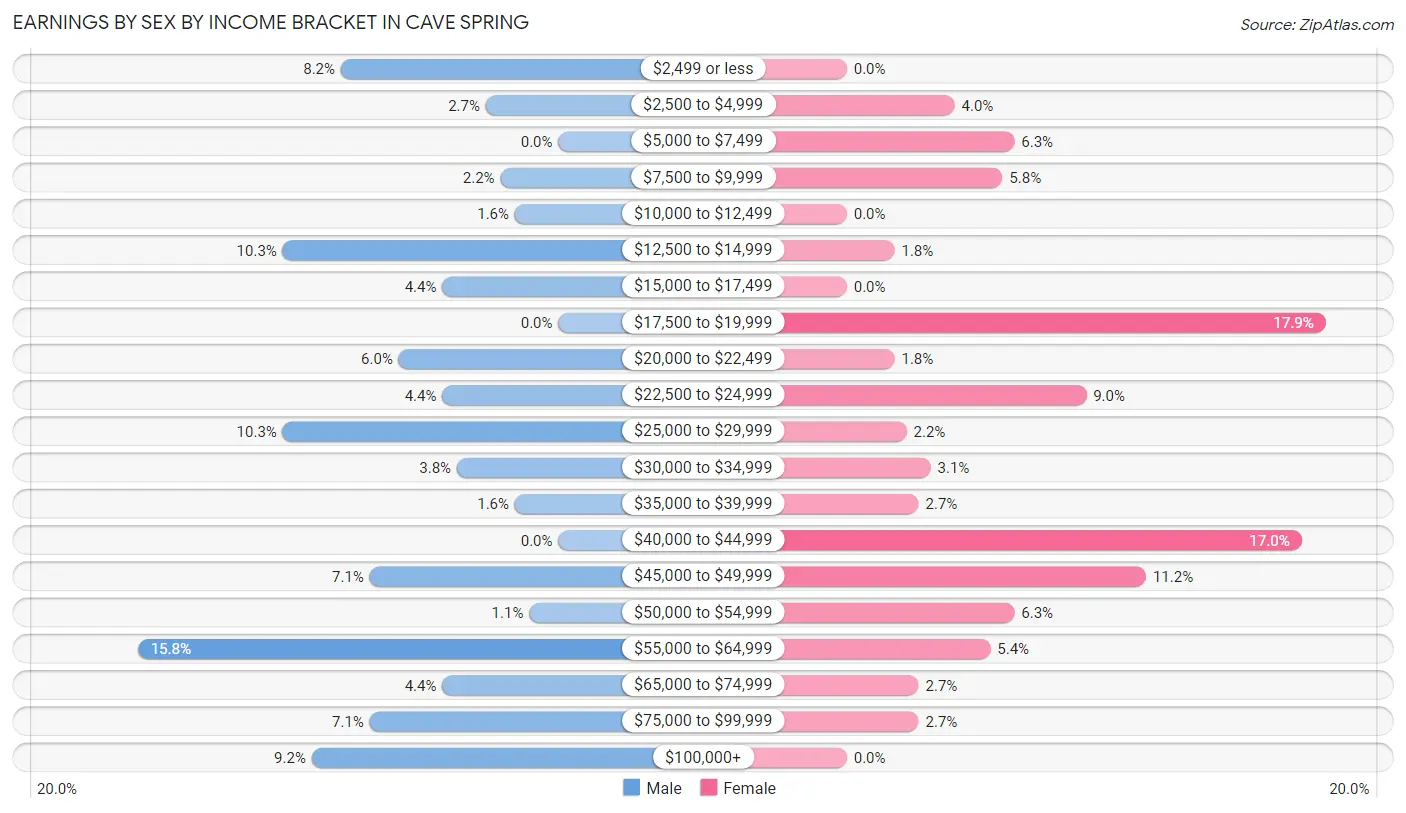
Earnings by Sex by Income Bracket in Cave Spring
The most common earnings brackets in Cave Spring are $55,000 to $64,999 for men (29 | 15.8%) and $17,500 to $19,999 for women (40 | 17.9%).
| Income | Male | Female |
| $2,499 or less | 15 (8.2%) | 0 (0.0%) |
| $2,500 to $4,999 | 5 (2.7%) | 9 (4.0%) |
| $5,000 to $7,499 | 0 (0.0%) | 14 (6.3%) |
| $7,500 to $9,999 | 4 (2.2%) | 13 (5.8%) |
| $10,000 to $12,499 | 3 (1.6%) | 0 (0.0%) |
| $12,500 to $14,999 | 19 (10.3%) | 4 (1.8%) |
| $15,000 to $17,499 | 8 (4.3%) | 0 (0.0%) |
| $17,500 to $19,999 | 0 (0.0%) | 40 (17.9%) |
| $20,000 to $22,499 | 11 (6.0%) | 4 (1.8%) |
| $22,500 to $24,999 | 8 (4.3%) | 20 (9.0%) |
| $25,000 to $29,999 | 19 (10.3%) | 5 (2.2%) |
| $30,000 to $34,999 | 7 (3.8%) | 7 (3.1%) |
| $35,000 to $39,999 | 3 (1.6%) | 6 (2.7%) |
| $40,000 to $44,999 | 0 (0.0%) | 38 (17.0%) |
| $45,000 to $49,999 | 13 (7.1%) | 25 (11.2%) |
| $50,000 to $54,999 | 2 (1.1%) | 14 (6.3%) |
| $55,000 to $64,999 | 29 (15.8%) | 12 (5.4%) |
| $65,000 to $74,999 | 8 (4.3%) | 6 (2.7%) |
| $75,000 to $99,999 | 13 (7.1%) | 6 (2.7%) |
| $100,000+ | 17 (9.2%) | 0 (0.0%) |
| Total | 184 (100.0%) | 223 (100.0%) |
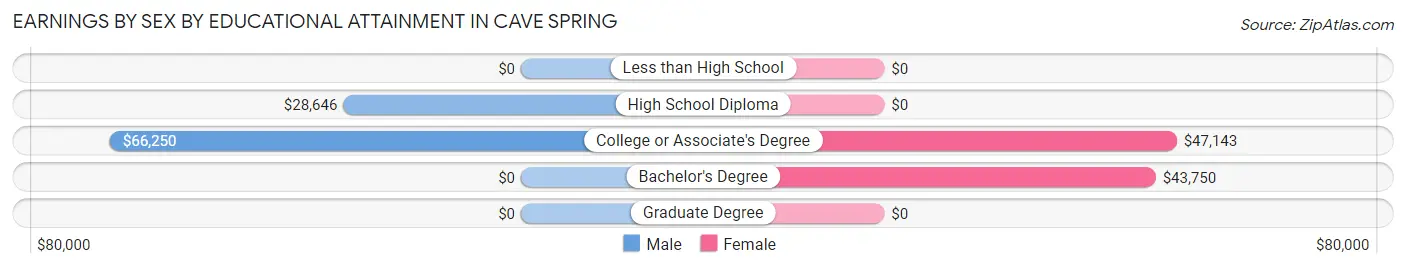
Earnings by Sex by Educational Attainment in Cave Spring
| Educational Attainment | Male Income | Female Income |
| Less than High School | - | - |
| High School Diploma | $28,646 | $0 |
| College or Associate's Degree | $66,250 | $47,143 |
| Bachelor's Degree | - | - |
| Graduate Degree | - | - |
| Total | - | - |
Family Income in Cave Spring
Family Income Brackets in Cave Spring
According to the Cave Spring family income data, there are 47 families falling into the $25,000 to $34,999 income range, which is the most common income bracket and makes up 19.0% of all families. Conversely, the $200,000+ income bracket is the least frequent group with only 4 families (1.6%) belonging to this category.
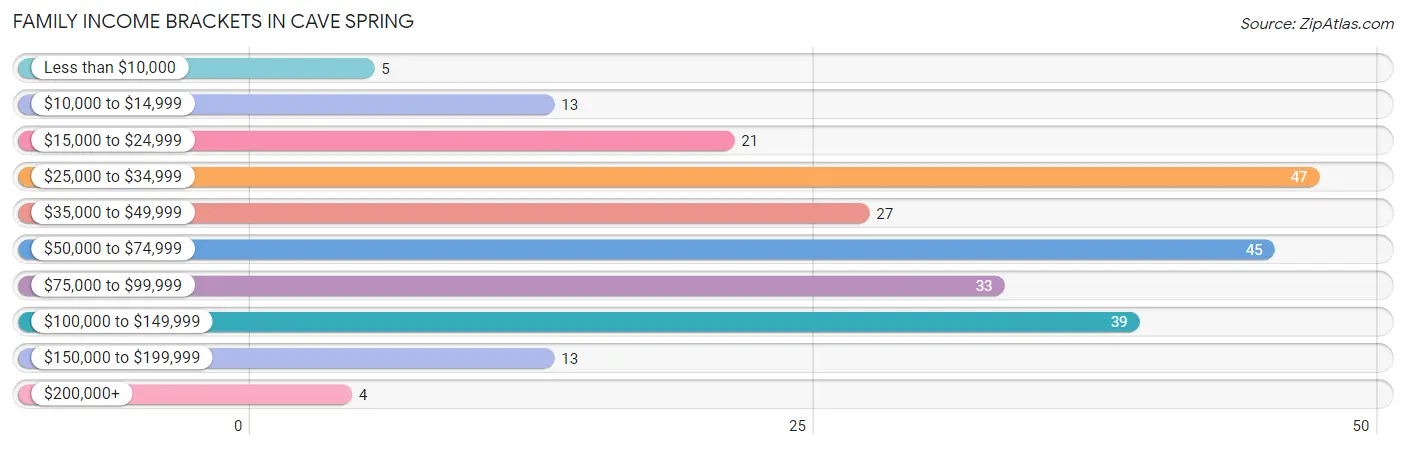
| Income Bracket | # Families | % Families |
| Less than $10,000 | 5 | 2.0% |
| $10,000 to $14,999 | 13 | 5.3% |
| $15,000 to $24,999 | 21 | 8.5% |
| $25,000 to $34,999 | 47 | 19.0% |
| $35,000 to $49,999 | 27 | 10.9% |
| $50,000 to $74,999 | 45 | 18.2% |
| $75,000 to $99,999 | 33 | 13.4% |
| $100,000 to $149,999 | 39 | 15.8% |
| $150,000 to $199,999 | 13 | 5.3% |
| $200,000+ | 4 | 1.6% |
Family Income by Famaliy Size in Cave Spring
3-person families (27 | 10.9%) account for the highest median family income in Cave Spring with $93,472 per family, while 3-person families (27 | 10.9%) have the highest median income of $31,157 per family member.
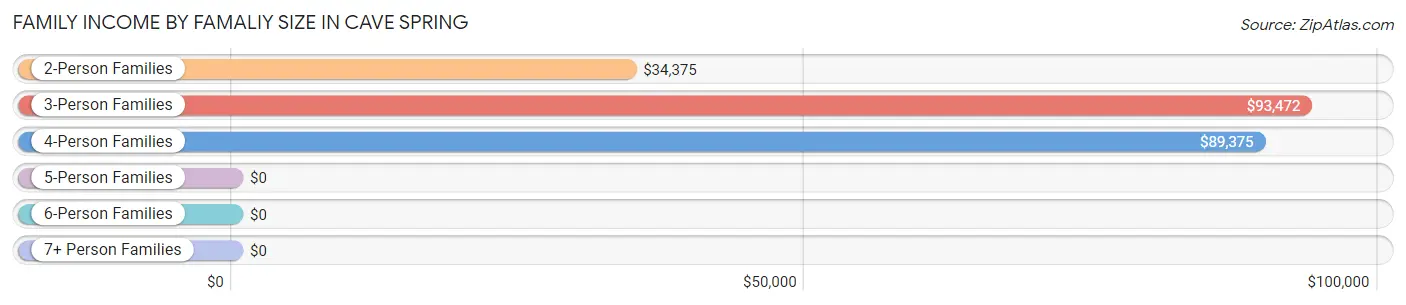
| Income Bracket | # Families | Median Income |
| 2-Person Families | 141 (57.1%) | $34,375 |
| 3-Person Families | 27 (10.9%) | $93,472 |
| 4-Person Families | 49 (19.8%) | $89,375 |
| 5-Person Families | 8 (3.2%) | $0 |
| 6-Person Families | 22 (8.9%) | $0 |
| 7+ Person Families | 0 (0.0%) | $0 |
| Total | 247 (100.0%) | $53,375 |
Family Income by Number of Earners in Cave Spring
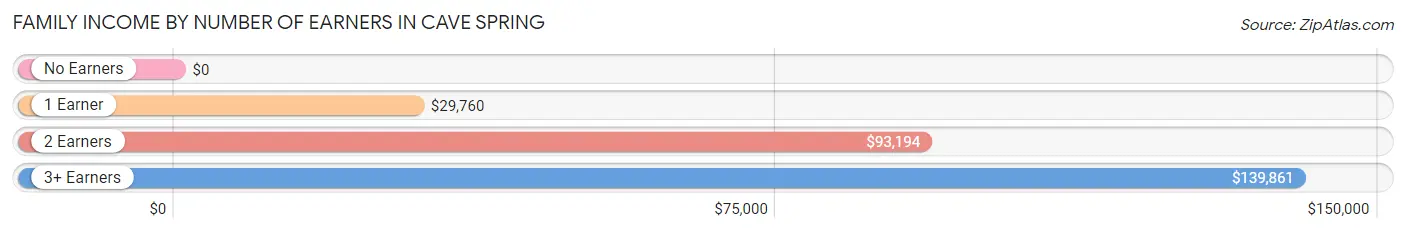
| Number of Earners | # Families | Median Income |
| No Earners | 50 (20.2%) | $0 |
| 1 Earner | 87 (35.2%) | $29,760 |
| 2 Earners | 93 (37.7%) | $93,194 |
| 3+ Earners | 17 (6.9%) | $139,861 |
| Total | 247 (100.0%) | $53,375 |
Household Income in Cave Spring
Household Income Brackets in Cave Spring
With 71 households falling in the category, the $50,000 to $74,999 income range is the most frequent in Cave Spring, accounting for 19.2% of all households. In contrast, only 6 households (1.6%) fall into the $200,000+ income bracket, making it the least populous group.
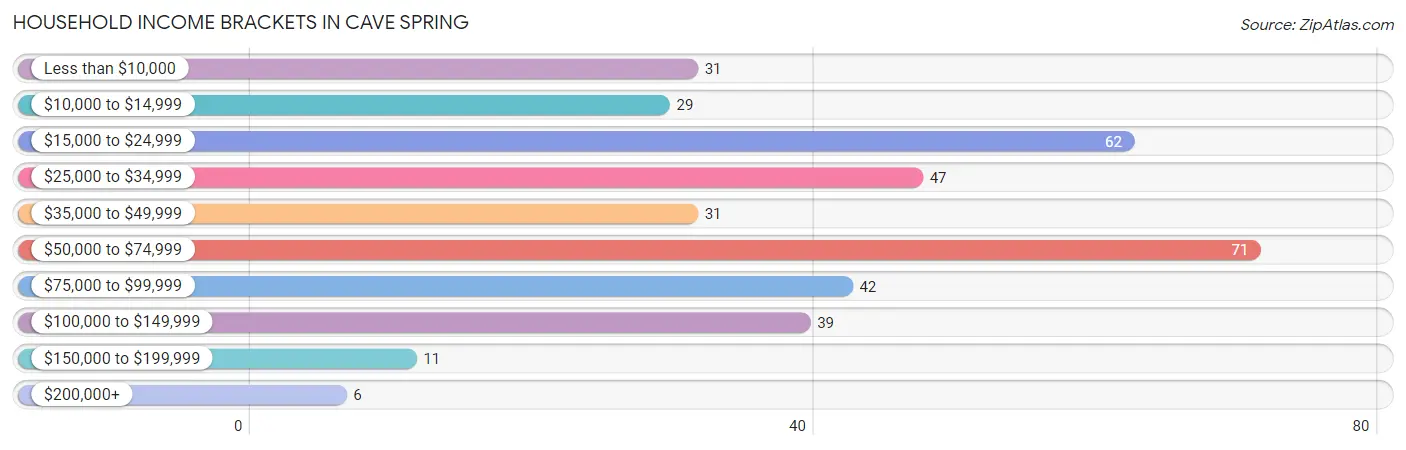
| Income Bracket | # Households | % Households |
| Less than $10,000 | 31 | 8.4% |
| $10,000 to $14,999 | 29 | 7.9% |
| $15,000 to $24,999 | 62 | 16.8% |
| $25,000 to $34,999 | 47 | 12.7% |
| $35,000 to $49,999 | 31 | 8.4% |
| $50,000 to $74,999 | 71 | 19.2% |
| $75,000 to $99,999 | 42 | 11.4% |
| $100,000 to $149,999 | 39 | 10.6% |
| $150,000 to $199,999 | 11 | 3.0% |
| $200,000+ | 6 | 1.6% |
Household Income by Householder Age in Cave Spring
The median household income in Cave Spring is $40,250, with the highest median household income of $51,964 found in the 45 to 64 years age bracket for the primary householder. A total of 155 households (42.0%) fall into this category. Meanwhile, the 15 to 24 years age bracket for the primary householder has the lowest median household income of $0, with 4 households (1.1%) in this group.
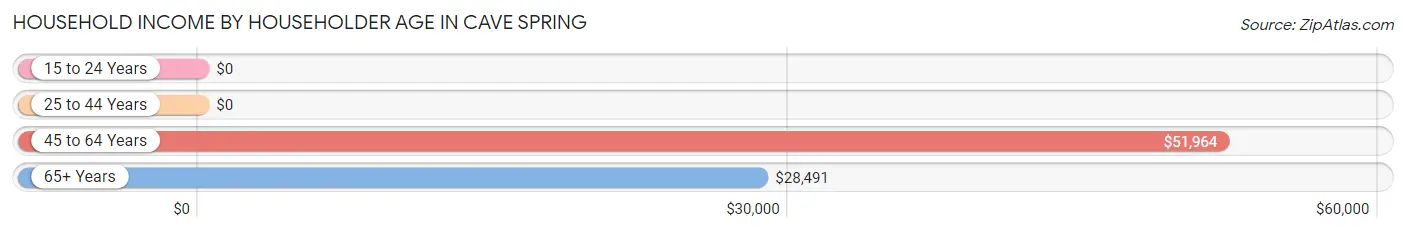
| Income Bracket | # Households | Median Income |
| 15 to 24 Years | 4 (1.1%) | $0 |
| 25 to 44 Years | 55 (14.9%) | $0 |
| 45 to 64 Years | 155 (42.0%) | $51,964 |
| 65+ Years | 155 (42.0%) | $28,491 |
| Total | 369 (100.0%) | $40,250 |
Poverty in Cave Spring
Income Below Poverty by Sex and Age in Cave Spring
With 27.8% poverty level for males and 18.6% for females among the residents of Cave Spring, 12 to 14 year old males and 6 to 11 year old females are the most vulnerable to poverty, with 26 males (72.2%) and 18 females (58.1%) in their respective age groups living below the poverty level.
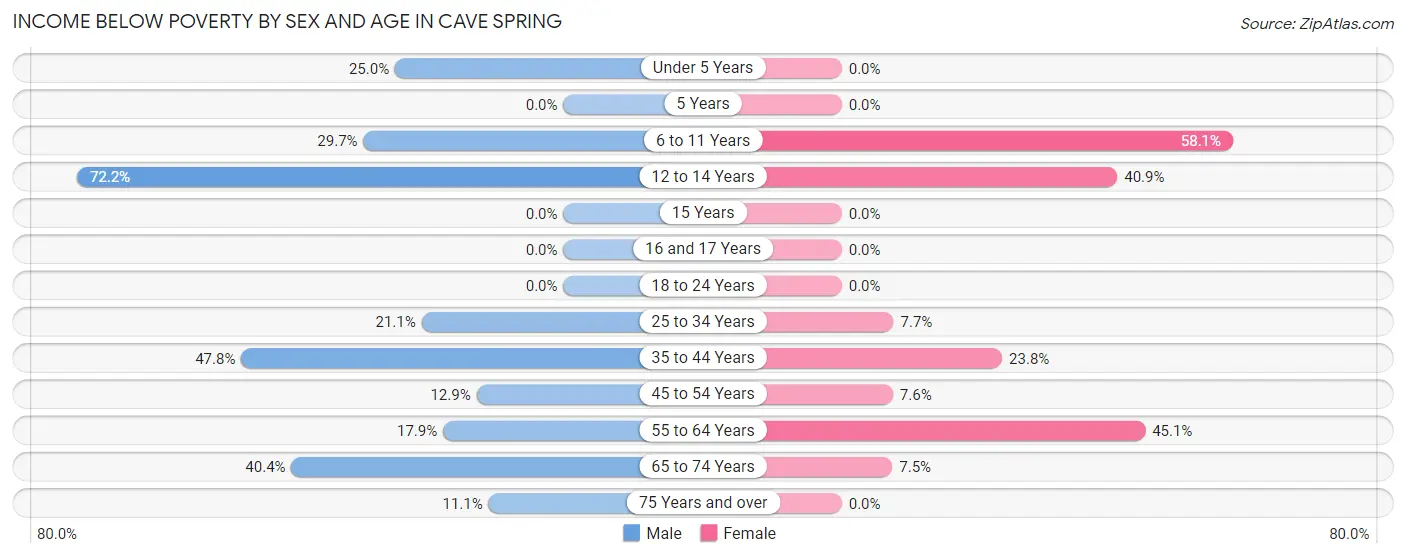
| Age Bracket | Male | Female |
| Under 5 Years | 2 (25.0%) | 0 (0.0%) |
| 5 Years | 0 (0.0%) | 0 (0.0%) |
| 6 to 11 Years | 19 (29.7%) | 18 (58.1%) |
| 12 to 14 Years | 26 (72.2%) | 9 (40.9%) |
| 15 Years | 0 (0.0%) | 0 (0.0%) |
| 16 and 17 Years | 0 (0.0%) | 0 (0.0%) |
| 18 to 24 Years | 0 (0.0%) | 0 (0.0%) |
| 25 to 34 Years | 8 (21.0%) | 3 (7.7%) |
| 35 to 44 Years | 22 (47.8%) | 10 (23.8%) |
| 45 to 54 Years | 8 (12.9%) | 6 (7.6%) |
| 55 to 64 Years | 15 (17.9%) | 41 (45.1%) |
| 65 to 74 Years | 21 (40.4%) | 3 (7.5%) |
| 75 Years and over | 3 (11.1%) | 0 (0.0%) |
| Total | 124 (27.8%) | 90 (18.6%) |
Income Above Poverty by Sex and Age in Cave Spring
According to the poverty statistics in Cave Spring, males aged 16 and 17 years and females aged under 5 years are the age groups that are most secure financially, with 100.0% of males and 100.0% of females in these age groups living above the poverty line.
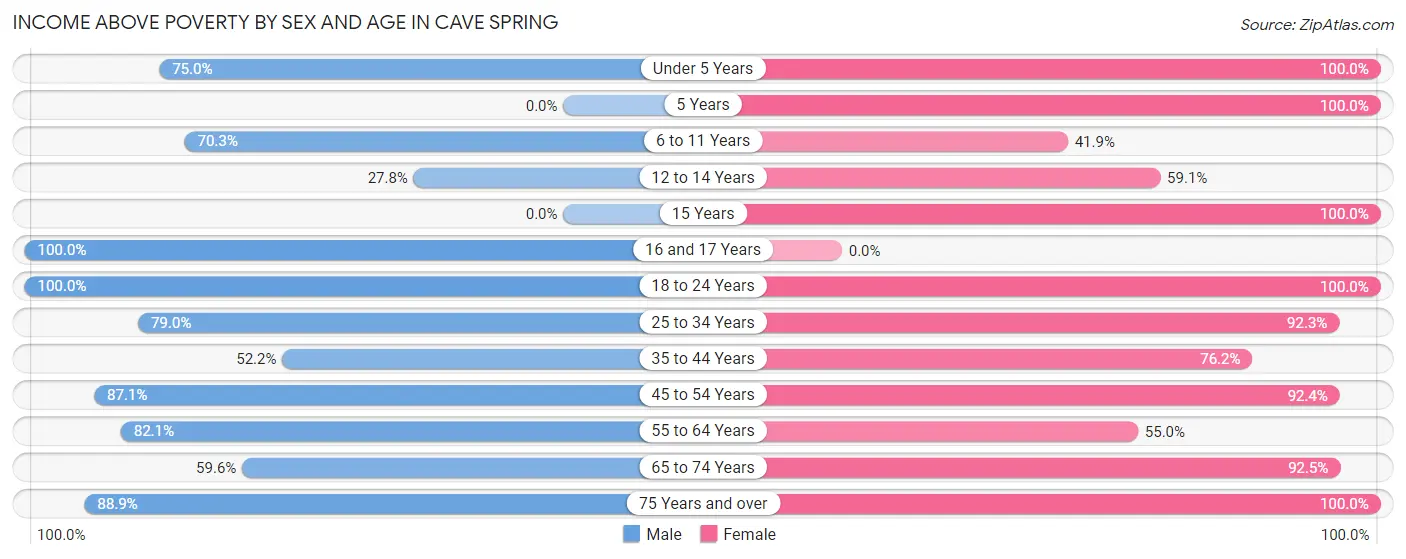
| Age Bracket | Male | Female |
| Under 5 Years | 6 (75.0%) | 4 (100.0%) |
| 5 Years | 0 (0.0%) | 4 (100.0%) |
| 6 to 11 Years | 45 (70.3%) | 13 (41.9%) |
| 12 to 14 Years | 10 (27.8%) | 13 (59.1%) |
| 15 Years | 0 (0.0%) | 7 (100.0%) |
| 16 and 17 Years | 9 (100.0%) | 0 (0.0%) |
| 18 to 24 Years | 20 (100.0%) | 56 (100.0%) |
| 25 to 34 Years | 30 (78.9%) | 36 (92.3%) |
| 35 to 44 Years | 24 (52.2%) | 32 (76.2%) |
| 45 to 54 Years | 54 (87.1%) | 73 (92.4%) |
| 55 to 64 Years | 69 (82.1%) | 50 (54.9%) |
| 65 to 74 Years | 31 (59.6%) | 37 (92.5%) |
| 75 Years and over | 24 (88.9%) | 68 (100.0%) |
| Total | 322 (72.2%) | 393 (81.4%) |
Income Below Poverty Among Married-Couple Families in Cave Spring
The poverty statistics for married-couple families in Cave Spring show that 16.2% or 27 of the total 167 families live below the poverty line. Families with 3 or 4 children have the highest poverty rate of 71.4%, comprising of 10 families. On the other hand, families with 1 or 2 children have the lowest poverty rate of 0.0%, which includes 0 families.
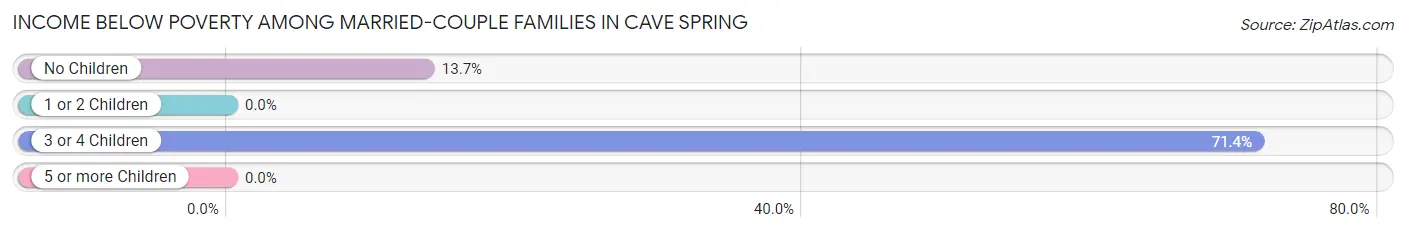
| Children | Above Poverty | Below Poverty |
| No Children | 107 (86.3%) | 17 (13.7%) |
| 1 or 2 Children | 29 (100.0%) | 0 (0.0%) |
| 3 or 4 Children | 4 (28.6%) | 10 (71.4%) |
| 5 or more Children | 0 (0.0%) | 0 (0.0%) |
| Total | 140 (83.8%) | 27 (16.2%) |
Income Below Poverty Among Single-Parent Households in Cave Spring
According to the poverty data in Cave Spring, 100.0% or 9 single-father households and 12.7% or 9 single-mother households are living below the poverty line. Among single-father households, those with 3 or 4 children have the highest poverty rate, with 9 households (100.0%) experiencing poverty. Likewise, among single-mother households, those with 3 or 4 children have the highest poverty rate, with 6 households (33.3%) falling below the poverty line.
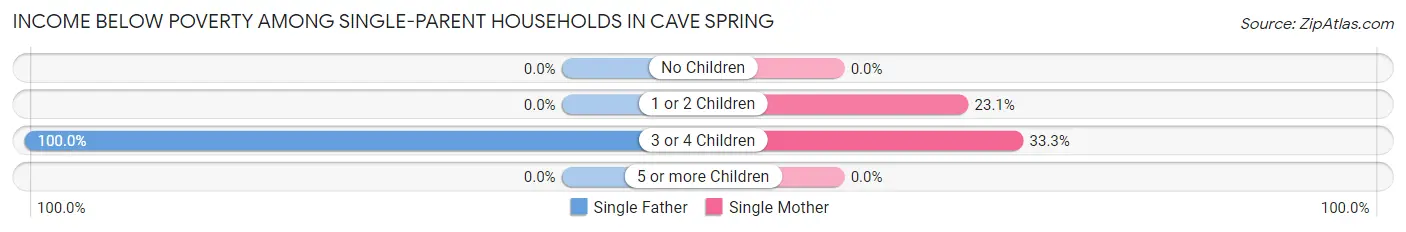
| Children | Single Father | Single Mother |
| No Children | 0 (0.0%) | 0 (0.0%) |
| 1 or 2 Children | 0 (0.0%) | 3 (23.1%) |
| 3 or 4 Children | 9 (100.0%) | 6 (33.3%) |
| 5 or more Children | 0 (0.0%) | 0 (0.0%) |
| Total | 9 (100.0%) | 9 (12.7%) |
Income Below Poverty Among Married-Couple vs Single-Parent Households in Cave Spring
The poverty data for Cave Spring shows that 27 of the married-couple family households (16.2%) and 18 of the single-parent households (22.5%) are living below the poverty level. Within the married-couple family households, those with 3 or 4 children have the highest poverty rate, with 10 households (71.4%) falling below the poverty line. Among the single-parent households, those with 3 or 4 children have the highest poverty rate, with 15 household (55.6%) living below poverty.
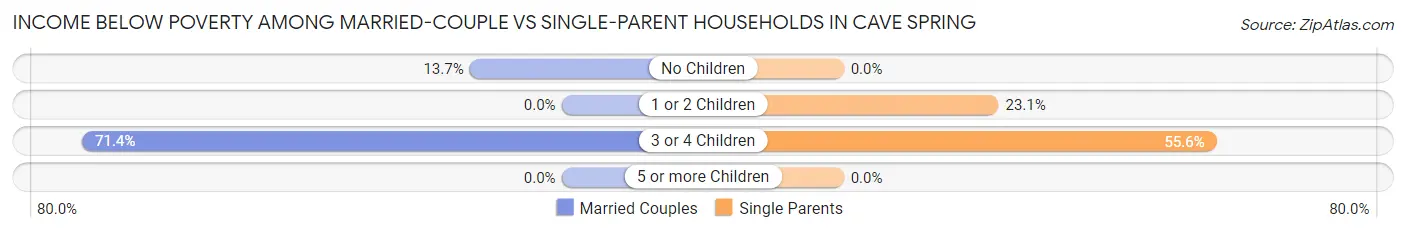
| Children | Married-Couple Families | Single-Parent Households |
| No Children | 17 (13.7%) | 0 (0.0%) |
| 1 or 2 Children | 0 (0.0%) | 3 (23.1%) |
| 3 or 4 Children | 10 (71.4%) | 15 (55.6%) |
| 5 or more Children | 0 (0.0%) | 0 (0.0%) |
| Total | 27 (16.2%) | 18 (22.5%) |
Race in Cave Spring
The most populous races in Cave Spring are White / Caucasian (816 | 83.1%), Black / African American (126 | 12.8%), and Two or more Races (37 | 3.8%).
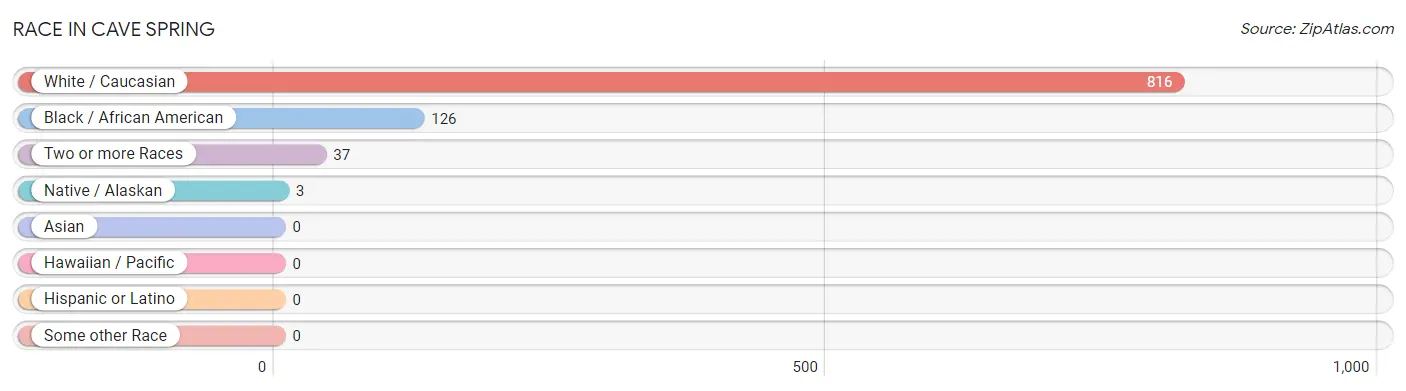
| Race | # Population | % Population |
| Asian | 0 | 0.0% |
| Black / African American | 126 | 12.8% |
| Hawaiian / Pacific | 0 | 0.0% |
| Hispanic or Latino | 0 | 0.0% |
| Native / Alaskan | 3 | 0.3% |
| White / Caucasian | 816 | 83.1% |
| Two or more Races | 37 | 3.8% |
| Some other Race | 0 | 0.0% |
| Total | 982 | 100.0% |
Ancestry in Cave Spring
The most populous ancestries reported in Cave Spring are English (317 | 32.3%), American (158 | 16.1%), Irish (71 | 7.2%), German (45 | 4.6%), and Scottish (32 | 3.3%), together accounting for 63.4% of all Cave Spring residents.
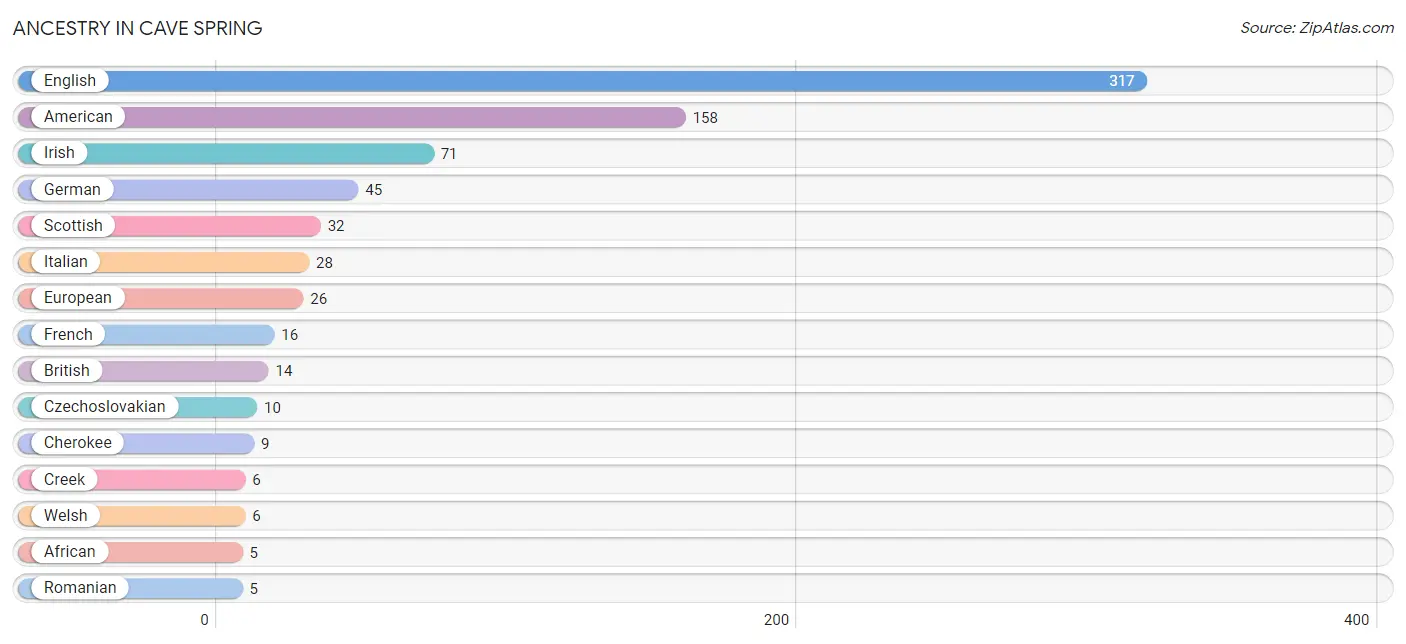
| Ancestry | # Population | % Population |
| African | 5 | 0.5% |
| American | 158 | 16.1% |
| British | 14 | 1.4% |
| Cherokee | 9 | 0.9% |
| Creek | 6 | 0.6% |
| Czechoslovakian | 10 | 1.0% |
| English | 317 | 32.3% |
| European | 26 | 2.6% |
| French | 16 | 1.6% |
| French Canadian | 3 | 0.3% |
| German | 45 | 4.6% |
| Irish | 71 | 7.2% |
| Italian | 28 | 2.9% |
| Polish | 2 | 0.2% |
| Romanian | 5 | 0.5% |
| Scotch-Irish | 4 | 0.4% |
| Scottish | 32 | 3.3% |
| Subsaharan African | 5 | 0.5% |
| Welsh | 6 | 0.6% | View All 19 Rows |
Immigrants in Cave Spring
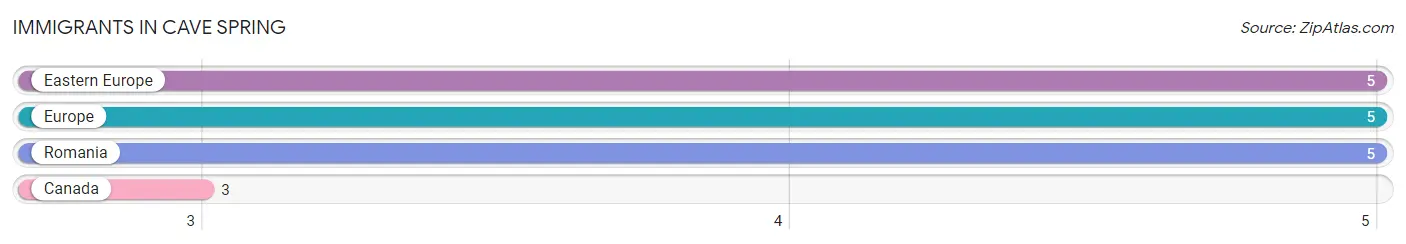
The most numerous immigrant groups reported in Cave Spring came from Eastern Europe (5 | 0.5%), Europe (5 | 0.5%), Romania (5 | 0.5%), and Canada (3 | 0.3%), together accounting for 1.8% of all Cave Spring residents.
| Immigration Origin | # Population | % Population |
| Canada | 3 | 0.3% |
| Eastern Europe | 5 | 0.5% |
| Europe | 5 | 0.5% |
| Romania | 5 | 0.5% | View All 4 Rows |
Sex and Age in Cave Spring
Sex and Age in Cave Spring
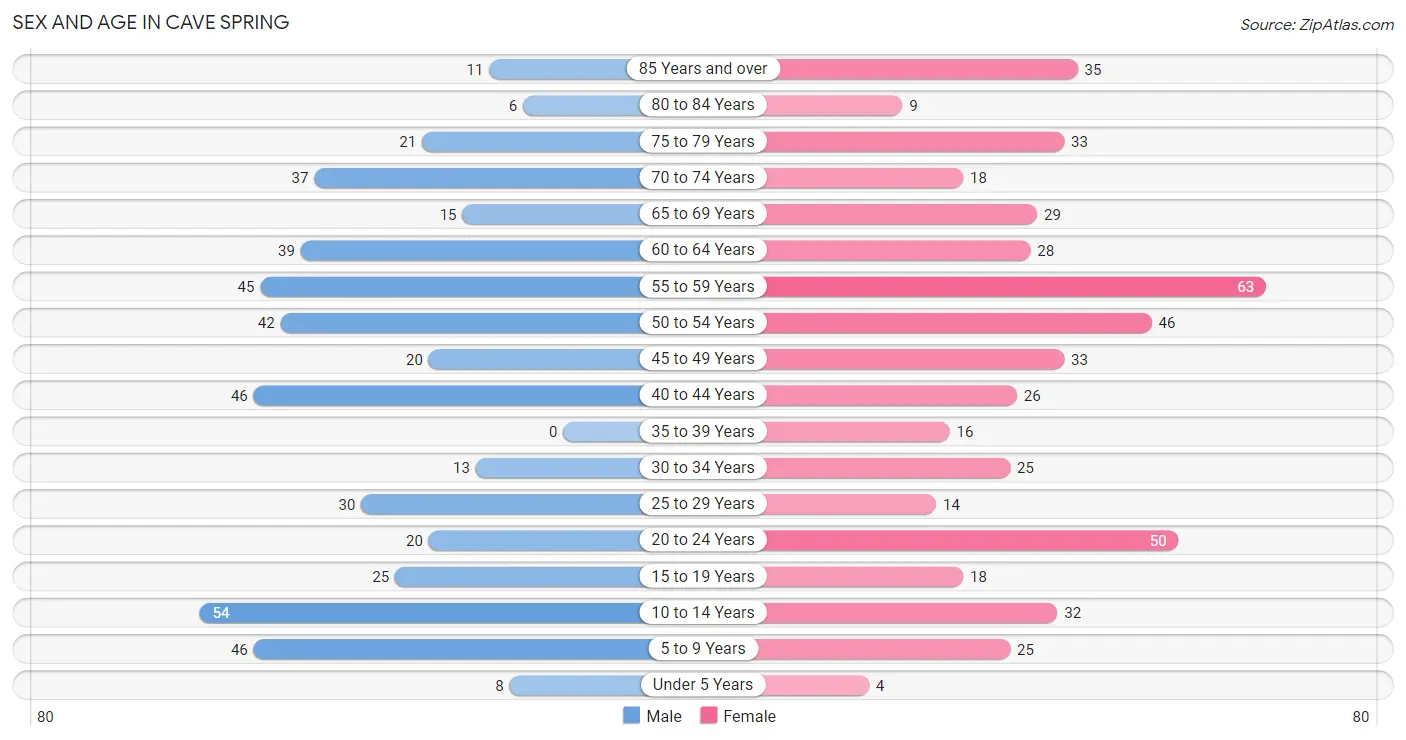
The most populous age groups in Cave Spring are 10 to 14 Years (54 | 11.3%) for men and 55 to 59 Years (63 | 12.5%) for women.
| Age Bracket | Male | Female |
| Under 5 Years | 8 (1.7%) | 4 (0.8%) |
| 5 to 9 Years | 46 (9.6%) | 25 (5.0%) |
| 10 to 14 Years | 54 (11.3%) | 32 (6.4%) |
| 15 to 19 Years | 25 (5.2%) | 18 (3.6%) |
| 20 to 24 Years | 20 (4.2%) | 50 (9.9%) |
| 25 to 29 Years | 30 (6.3%) | 14 (2.8%) |
| 30 to 34 Years | 13 (2.7%) | 25 (5.0%) |
| 35 to 39 Years | 0 (0.0%) | 16 (3.2%) |
| 40 to 44 Years | 46 (9.6%) | 26 (5.2%) |
| 45 to 49 Years | 20 (4.2%) | 33 (6.6%) |
| 50 to 54 Years | 42 (8.8%) | 46 (9.1%) |
| 55 to 59 Years | 45 (9.4%) | 63 (12.5%) |
| 60 to 64 Years | 39 (8.2%) | 28 (5.6%) |
| 65 to 69 Years | 15 (3.1%) | 29 (5.8%) |
| 70 to 74 Years | 37 (7.7%) | 18 (3.6%) |
| 75 to 79 Years | 21 (4.4%) | 33 (6.6%) |
| 80 to 84 Years | 6 (1.3%) | 9 (1.8%) |
| 85 Years and over | 11 (2.3%) | 35 (6.9%) |
| Total | 478 (100.0%) | 504 (100.0%) |
Families and Households in Cave Spring
Median Family Size in Cave Spring
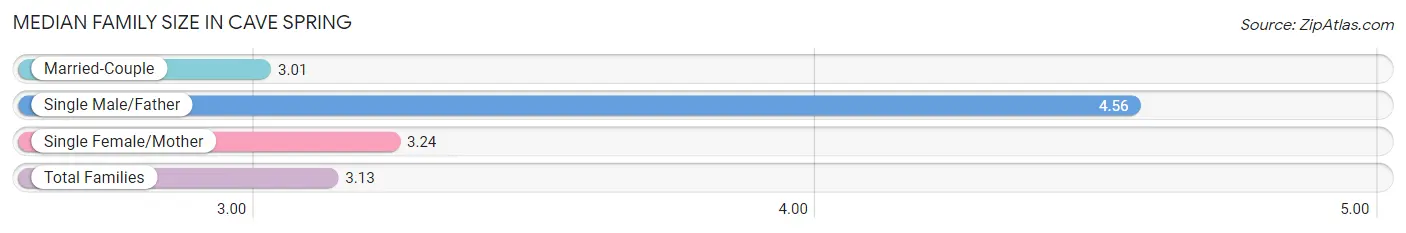
The median family size in Cave Spring is 3.13 persons per family, with single male/father families (9 | 3.6%) accounting for the largest median family size of 4.56 persons per family. On the other hand, married-couple families (167 | 67.6%) represent the smallest median family size with 3.01 persons per family.
| Family Type | # Families | Family Size |
| Married-Couple | 167 (67.6%) | 3.01 |
| Single Male/Father | 9 (3.6%) | 4.56 |
| Single Female/Mother | 71 (28.7%) | 3.24 |
| Total Families | 247 (100.0%) | 3.13 |
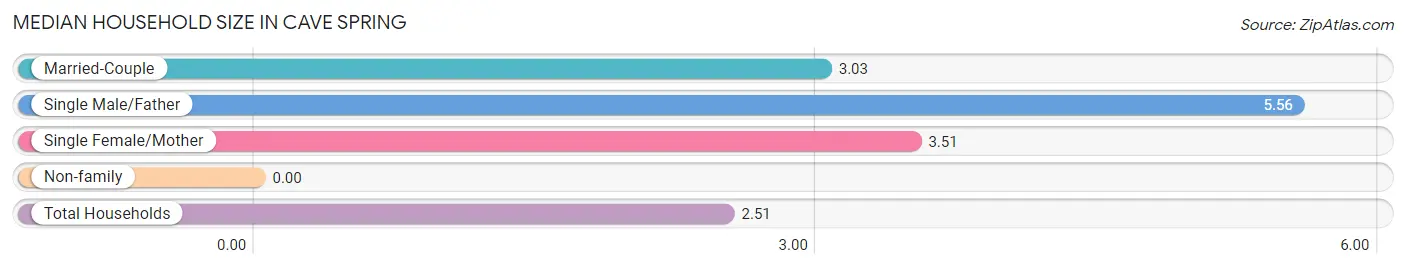
Median Household Size in Cave Spring
| Household Type | # Households | Household Size |
| Married-Couple | 167 (45.3%) | 3.03 |
| Single Male/Father | 9 (2.4%) | 5.56 |
| Single Female/Mother | 71 (19.2%) | 3.51 |
| Non-family | 122 (33.1%) | - |
| Total Households | 369 (100.0%) | 2.51 |
Household Size by Marriage Status in Cave Spring
Out of a total of 369 households in Cave Spring, 247 (66.9%) are family households, while 122 (33.1%) are nonfamily households. The most numerous type of family households are 2-person households, comprising 133, and the most common type of nonfamily households are 1-person households, comprising 122.
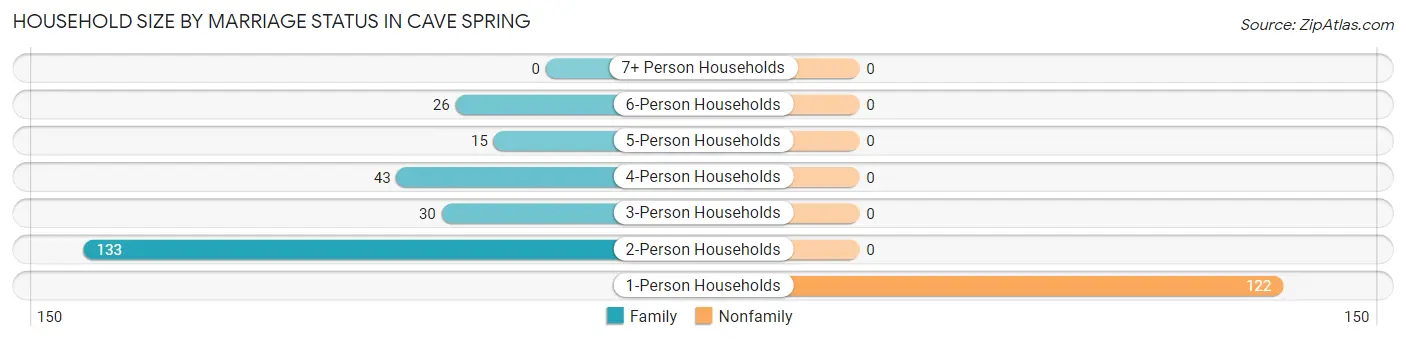
| Household Size | Family Households | Nonfamily Households |
| 1-Person Households | - | 122 (33.1%) |
| 2-Person Households | 133 (36.0%) | 0 (0.0%) |
| 3-Person Households | 30 (8.1%) | 0 (0.0%) |
| 4-Person Households | 43 (11.7%) | 0 (0.0%) |
| 5-Person Households | 15 (4.1%) | 0 (0.0%) |
| 6-Person Households | 26 (7.0%) | 0 (0.0%) |
| 7+ Person Households | 0 (0.0%) | 0 (0.0%) |
| Total | 247 (66.9%) | 122 (33.1%) |
Female Fertility in Cave Spring
Fertility by Age in Cave Spring
| Age Bracket | Women with Births | Births / 1,000 Women |
| 15 to 19 years | 0 (0.0%) | 0.0 |
| 20 to 34 years | 0 (0.0%) | 0.0 |
| 35 to 50 years | 0 (0.0%) | 0.0 |
| Total | 0 (0.0%) | 0.0 |
Fertility by Age by Marriage Status in Cave Spring
| Age Bracket | Married | Unmarried |
| 15 to 19 years | 0 (0.0%) | 0 (0.0%) |
| 20 to 34 years | 0 (0.0%) | 0 (0.0%) |
| 35 to 50 years | 0 (0.0%) | 0 (0.0%) |
| Total | 0 (0.0%) | 0 (0.0%) |
Fertility by Education in Cave Spring
| Educational Attainment | Women with Births | Births / 1,000 Women |
| Less than High School | 0 (0.0%) | 0.0 |
| High School Diploma | 0 (0.0%) | 0.0 |
| College or Associate's Degree | 0 (0.0%) | 0.0 |
| Bachelor's Degree | 0 (0.0%) | 0.0 |
| Graduate Degree | 0 (0.0%) | 0.0 |
| Total | 0 (0.0%) | 0.0 |
Fertility by Education by Marriage Status in Cave Spring
| Educational Attainment | Married | Unmarried |
| Less than High School | 0 (0.0%) | 0 (0.0%) |
| High School Diploma | 0 (0.0%) | 0 (0.0%) |
| College or Associate's Degree | 0 (0.0%) | 0 (0.0%) |
| Bachelor's Degree | 0 (0.0%) | 0 (0.0%) |
| Graduate Degree | 0 (0.0%) | 0 (0.0%) |
| Total | 0 (0.0%) | 0 (0.0%) |
Employment Characteristics in Cave Spring
Employment by Class of Employer in Cave Spring
Among the 370 employed individuals in Cave Spring, private company employees (219 | 59.2%), local government employees (56 | 15.1%), and not-for-profit organizations (53 | 14.3%) make up the most common classes of employment.
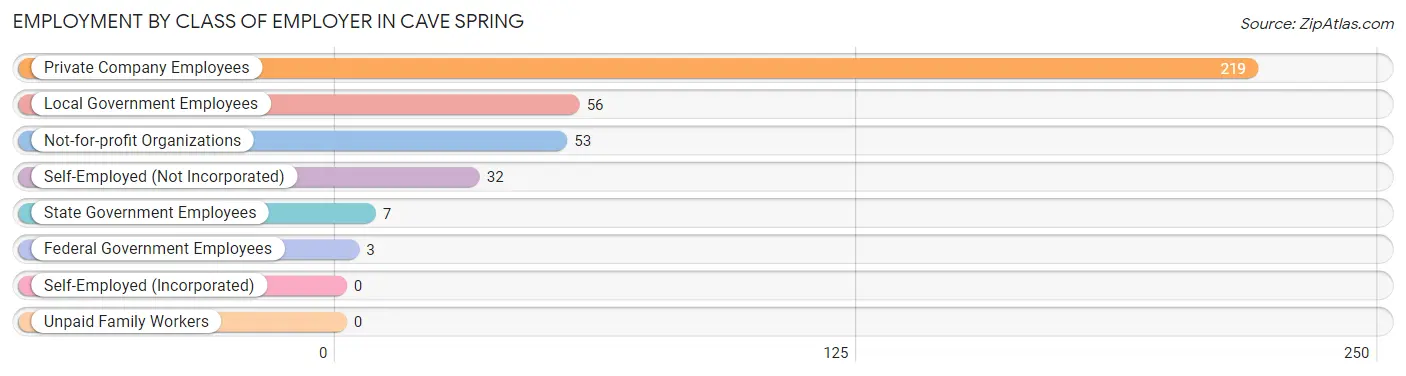
| Employer Class | # Employees | % Employees |
| Private Company Employees | 219 | 59.2% |
| Self-Employed (Incorporated) | 0 | 0.0% |
| Self-Employed (Not Incorporated) | 32 | 8.6% |
| Not-for-profit Organizations | 53 | 14.3% |
| Local Government Employees | 56 | 15.1% |
| State Government Employees | 7 | 1.9% |
| Federal Government Employees | 3 | 0.8% |
| Unpaid Family Workers | 0 | 0.0% |
| Total | 370 | 100.0% |
Employment Status by Age in Cave Spring
According to the labor force statistics for Cave Spring, out of the total population over 16 years of age (806), 52.0% or 419 individuals are in the labor force, with 11.0% or 46 of them unemployed. The age group with the highest labor force participation rate is 30 to 34 years, with 86.8% or 33 individuals in the labor force. Within the labor force, the 16 to 19 years age range has the highest percentage of unemployed individuals, with 100.0% or 5 of them being unemployed.
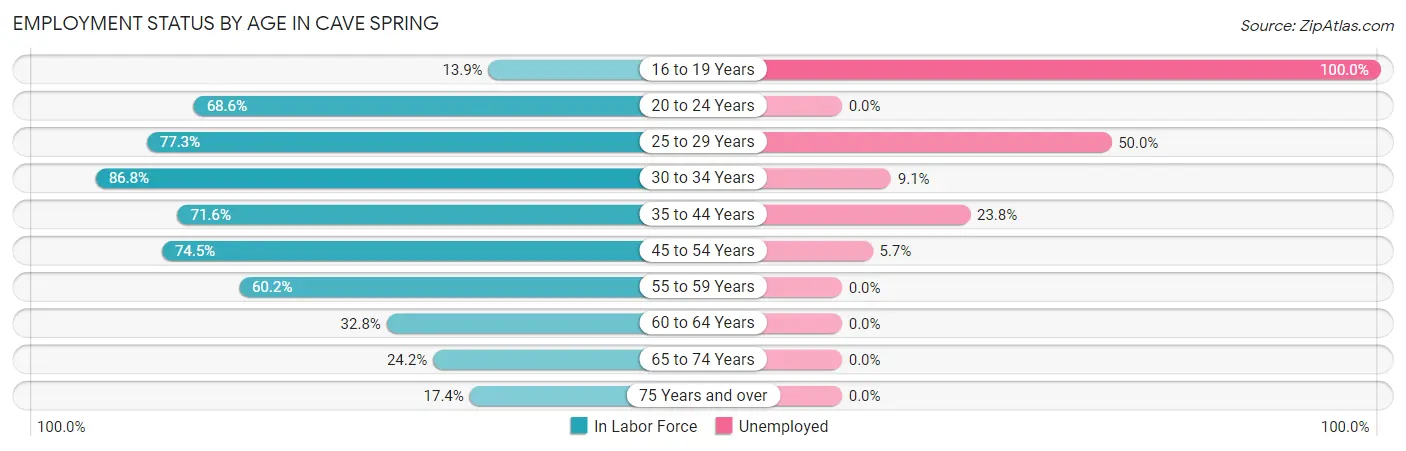
| Age Bracket | In Labor Force | Unemployed |
| 16 to 19 Years | 5 (13.9%) | 5 (100.0%) |
| 20 to 24 Years | 48 (68.6%) | 0 (0.0%) |
| 25 to 29 Years | 34 (77.3%) | 17 (50.0%) |
| 30 to 34 Years | 33 (86.8%) | 3 (9.1%) |
| 35 to 44 Years | 63 (71.6%) | 15 (23.8%) |
| 45 to 54 Years | 105 (74.5%) | 6 (5.7%) |
| 55 to 59 Years | 65 (60.2%) | 0 (0.0%) |
| 60 to 64 Years | 22 (32.8%) | 0 (0.0%) |
| 65 to 74 Years | 24 (24.2%) | 0 (0.0%) |
| 75 Years and over | 20 (17.4%) | 0 (0.0%) |
| Total | 419 (52.0%) | 46 (11.0%) |
Employment Status by Educational Attainment in Cave Spring
According to labor force statistics for Cave Spring, 66.3% of individuals (322) out of the total population between 25 and 64 years of age (486) are in the labor force, with 12.7% or 41 of them being unemployed. The group with the highest labor force participation rate are those with the educational attainment of bachelor's degree or higher, with 81.7% or 67 individuals in the labor force. Within the labor force, individuals with less than high school education have the highest percentage of unemployment, with 34.5% or 10 of them being unemployed.
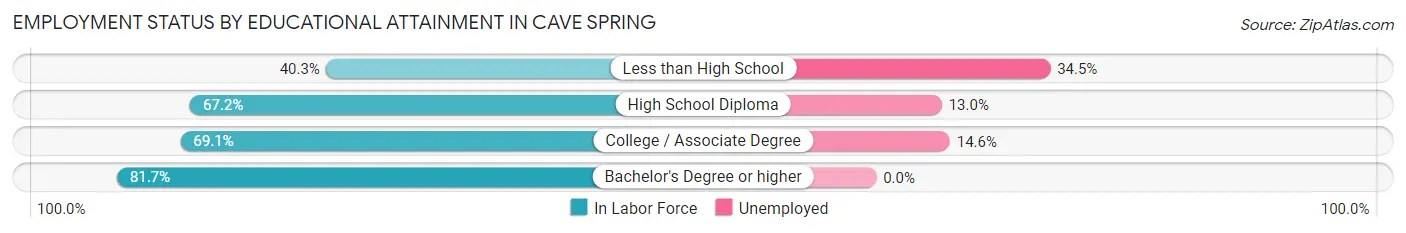
| Educational Attainment | In Labor Force | Unemployed |
| Less than High School | 29 (40.3%) | 25 (34.5%) |
| High School Diploma | 123 (67.2%) | 24 (13.0%) |
| College / Associate Degree | 103 (69.1%) | 22 (14.6%) |
| Bachelor's Degree or higher | 67 (81.7%) | 0 (0.0%) |
| Total | 322 (66.3%) | 62 (12.7%) |
Employment Occupations by Sex in Cave Spring
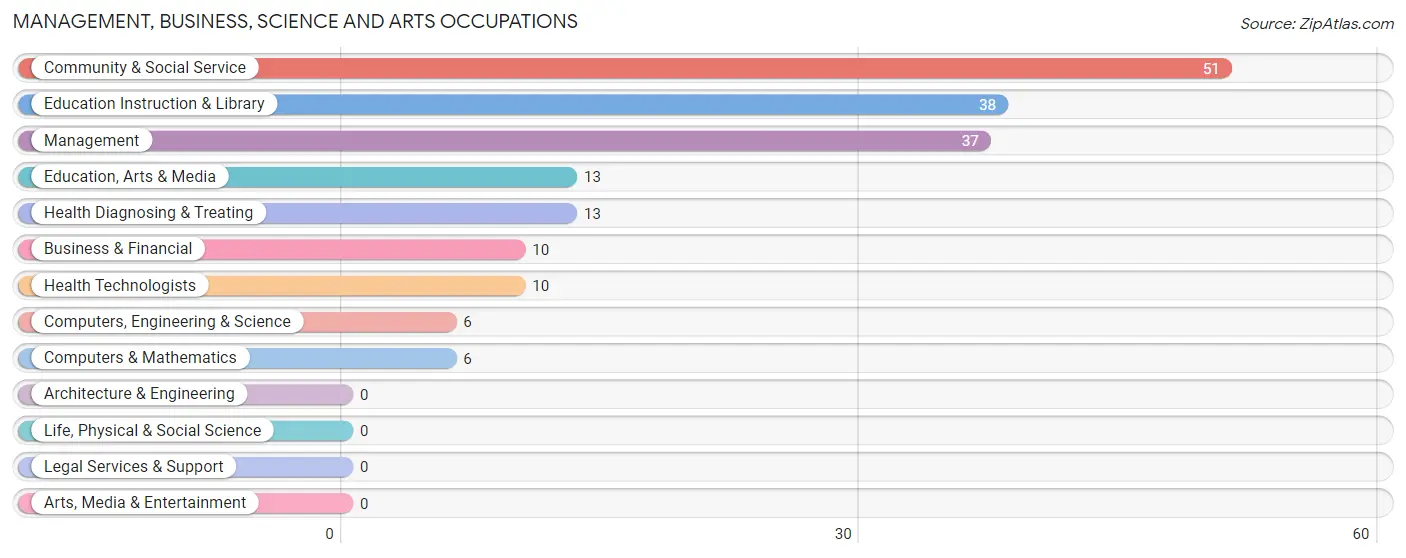
Management, Business, Science and Arts Occupations
The most common Management, Business, Science and Arts occupations in Cave Spring are Community & Social Service (51 | 13.7%), Education Instruction & Library (38 | 10.2%), Management (37 | 9.9%), Education, Arts & Media (13 | 3.5%), and Health Diagnosing & Treating (13 | 3.5%).
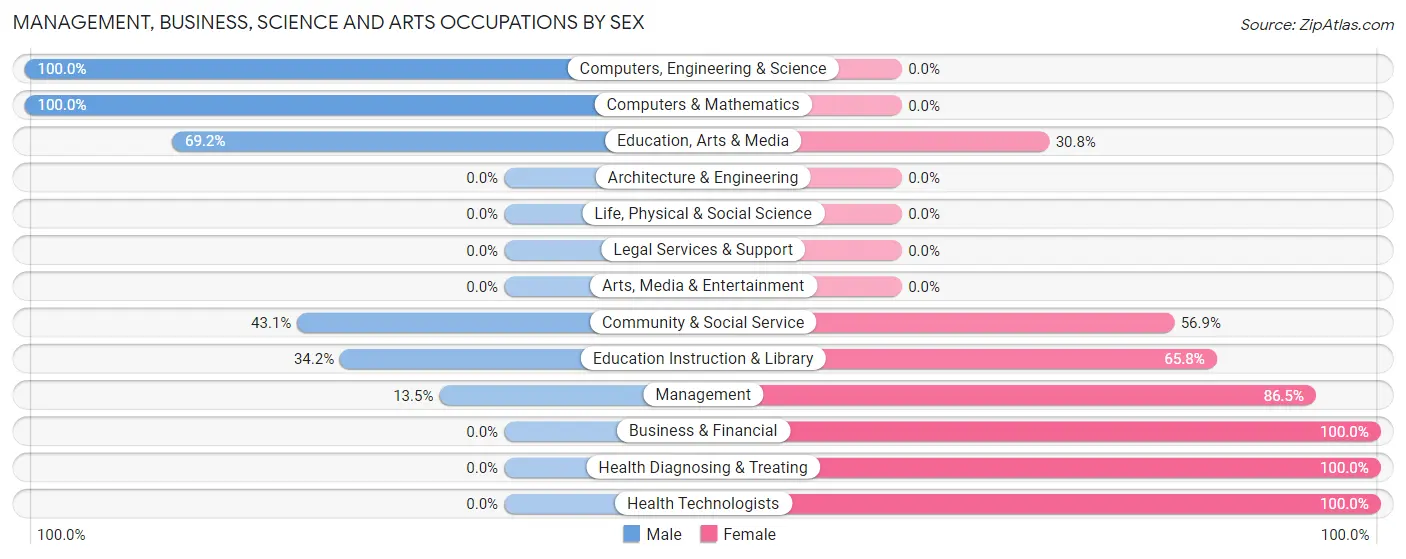
Management, Business, Science and Arts Occupations by Sex
Within the Management, Business, Science and Arts occupations in Cave Spring, the most male-oriented occupations are Computers, Engineering & Science (100.0%), Computers & Mathematics (100.0%), and Education, Arts & Media (69.2%), while the most female-oriented occupations are Business & Financial (100.0%), Health Diagnosing & Treating (100.0%), and Health Technologists (100.0%).
| Occupation | Male | Female |
| Management | 5 (13.5%) | 32 (86.5%) |
| Business & Financial | 0 (0.0%) | 10 (100.0%) |
| Computers, Engineering & Science | 6 (100.0%) | 0 (0.0%) |
| Computers & Mathematics | 6 (100.0%) | 0 (0.0%) |
| Architecture & Engineering | 0 (0.0%) | 0 (0.0%) |
| Life, Physical & Social Science | 0 (0.0%) | 0 (0.0%) |
| Community & Social Service | 22 (43.1%) | 29 (56.9%) |
| Education, Arts & Media | 9 (69.2%) | 4 (30.8%) |
| Legal Services & Support | 0 (0.0%) | 0 (0.0%) |
| Education Instruction & Library | 13 (34.2%) | 25 (65.8%) |
| Arts, Media & Entertainment | 0 (0.0%) | 0 (0.0%) |
| Health Diagnosing & Treating | 0 (0.0%) | 13 (100.0%) |
| Health Technologists | 0 (0.0%) | 10 (100.0%) |
| Total (Category) | 33 (28.2%) | 84 (71.8%) |
| Total (Overall) | 150 (40.2%) | 223 (59.8%) |
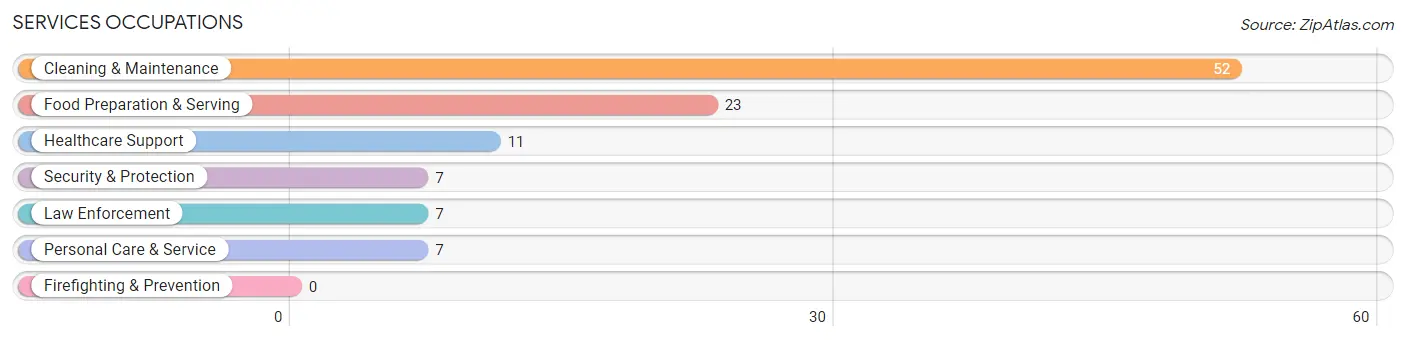
Services Occupations
The most common Services occupations in Cave Spring are Cleaning & Maintenance (52 | 13.9%), Food Preparation & Serving (23 | 6.2%), Healthcare Support (11 | 2.9%), Security & Protection (7 | 1.9%), and Law Enforcement (7 | 1.9%).
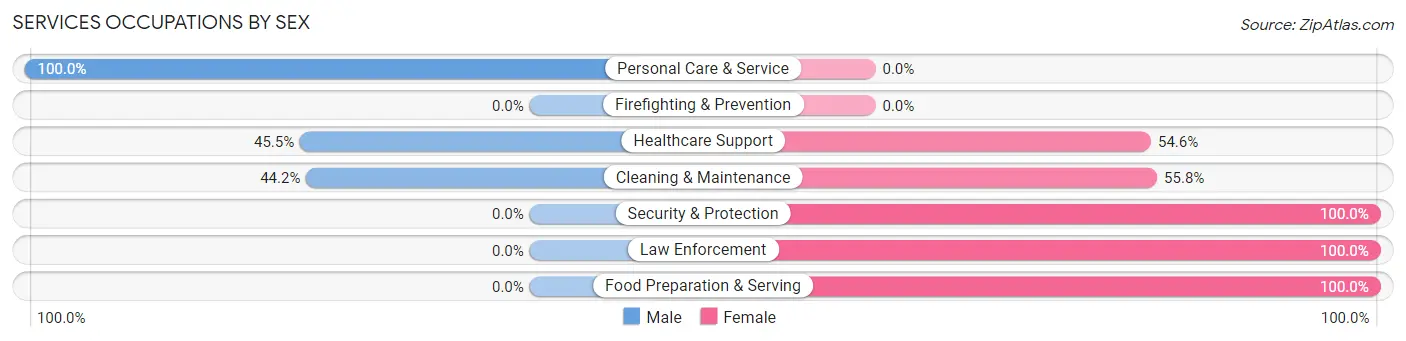
Services Occupations by Sex
Within the Services occupations in Cave Spring, the most male-oriented occupations are Personal Care & Service (100.0%), Healthcare Support (45.5%), and Cleaning & Maintenance (44.2%), while the most female-oriented occupations are Security & Protection (100.0%), Law Enforcement (100.0%), and Food Preparation & Serving (100.0%).
| Occupation | Male | Female |
| Healthcare Support | 5 (45.5%) | 6 (54.5%) |
| Security & Protection | 0 (0.0%) | 7 (100.0%) |
| Firefighting & Prevention | 0 (0.0%) | 0 (0.0%) |
| Law Enforcement | 0 (0.0%) | 7 (100.0%) |
| Food Preparation & Serving | 0 (0.0%) | 23 (100.0%) |
| Cleaning & Maintenance | 23 (44.2%) | 29 (55.8%) |
| Personal Care & Service | 7 (100.0%) | 0 (0.0%) |
| Total (Category) | 35 (35.0%) | 65 (65.0%) |
| Total (Overall) | 150 (40.2%) | 223 (59.8%) |
Sales and Office Occupations
The most common Sales and Office occupations in Cave Spring are Sales & Related (52 | 13.9%), and Office & Administration (20 | 5.4%).
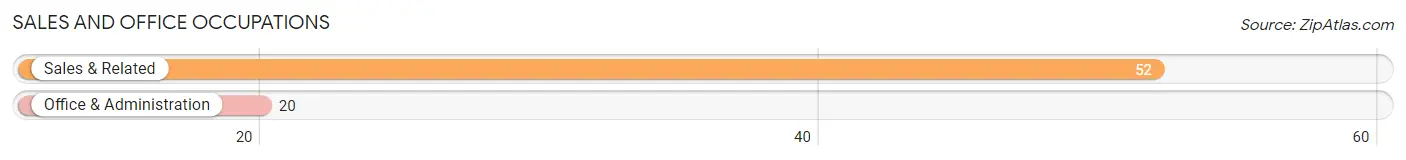
Sales and Office Occupations by Sex
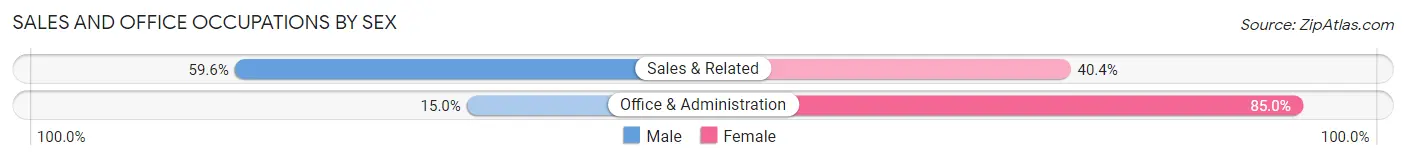
| Occupation | Male | Female |
| Sales & Related | 31 (59.6%) | 21 (40.4%) |
| Office & Administration | 3 (15.0%) | 17 (85.0%) |
| Total (Category) | 34 (47.2%) | 38 (52.8%) |
| Total (Overall) | 150 (40.2%) | 223 (59.8%) |
Natural Resources, Construction and Maintenance Occupations
The most common Natural Resources, Construction and Maintenance occupations in Cave Spring are Installation, Maintenance & Repair (10 | 2.7%), and Construction & Extraction (8 | 2.1%).
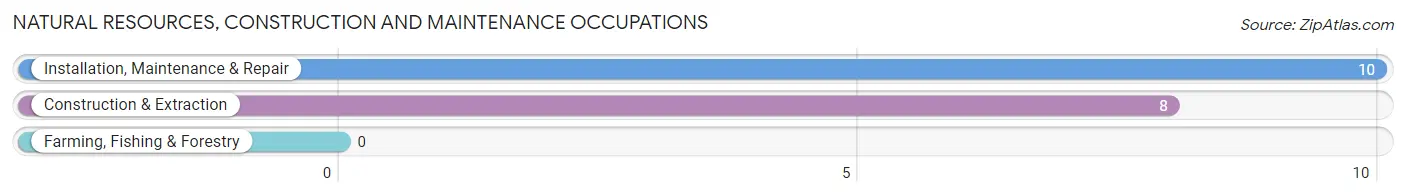
Natural Resources, Construction and Maintenance Occupations by Sex
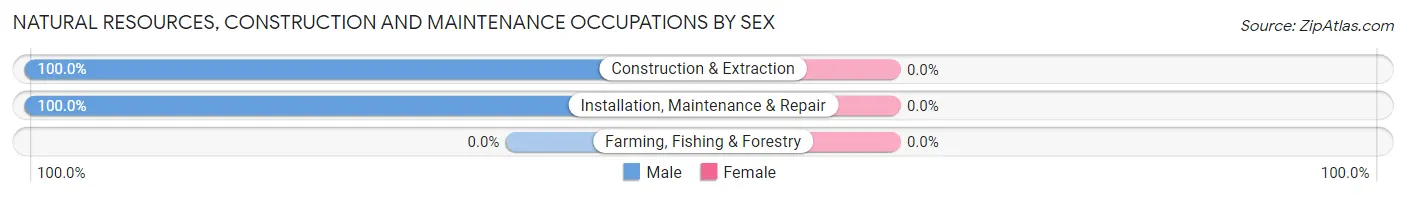
| Occupation | Male | Female |
| Farming, Fishing & Forestry | 0 (0.0%) | 0 (0.0%) |
| Construction & Extraction | 8 (100.0%) | 0 (0.0%) |
| Installation, Maintenance & Repair | 10 (100.0%) | 0 (0.0%) |
| Total (Category) | 18 (100.0%) | 0 (0.0%) |
| Total (Overall) | 150 (40.2%) | 223 (59.8%) |
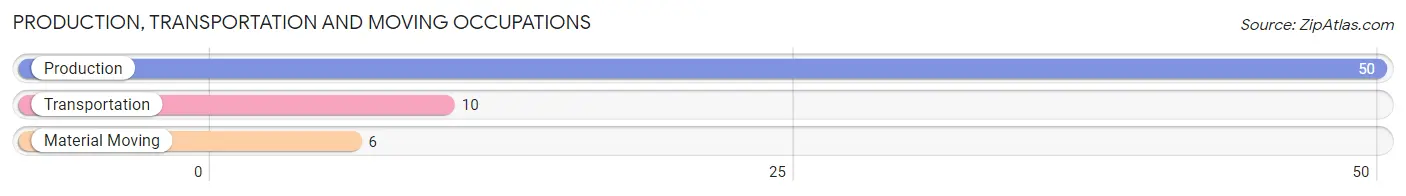
Production, Transportation and Moving Occupations
The most common Production, Transportation and Moving occupations in Cave Spring are Production (50 | 13.4%), Transportation (10 | 2.7%), and Material Moving (6 | 1.6%).
Production, Transportation and Moving Occupations by Sex
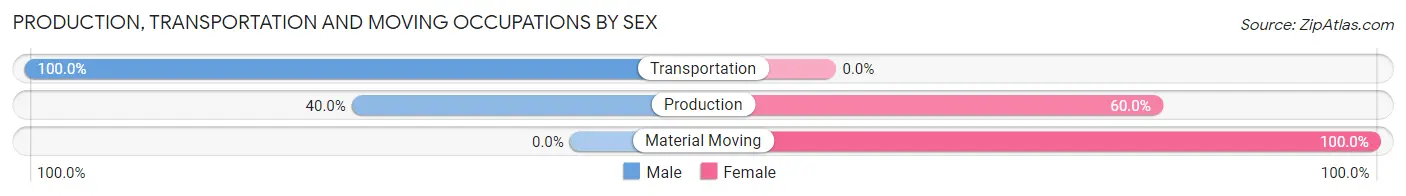
| Occupation | Male | Female |
| Production | 20 (40.0%) | 30 (60.0%) |
| Transportation | 10 (100.0%) | 0 (0.0%) |
| Material Moving | 0 (0.0%) | 6 (100.0%) |
| Total (Category) | 30 (45.5%) | 36 (54.5%) |
| Total (Overall) | 150 (40.2%) | 223 (59.8%) |
Employment Industries by Sex in Cave Spring
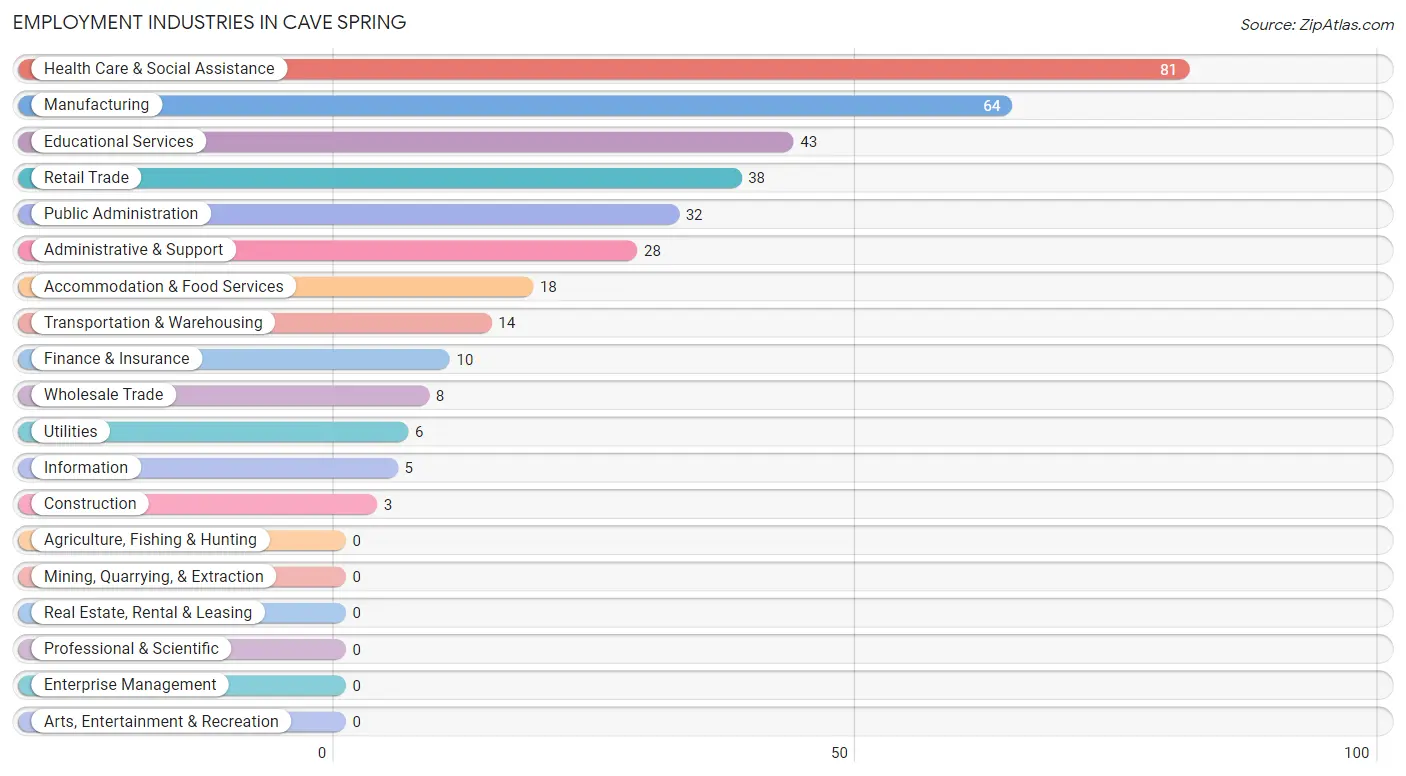
Employment Industries in Cave Spring
The major employment industries in Cave Spring include Health Care & Social Assistance (81 | 21.7%), Manufacturing (64 | 17.2%), Educational Services (43 | 11.5%), Retail Trade (38 | 10.2%), and Public Administration (32 | 8.6%).
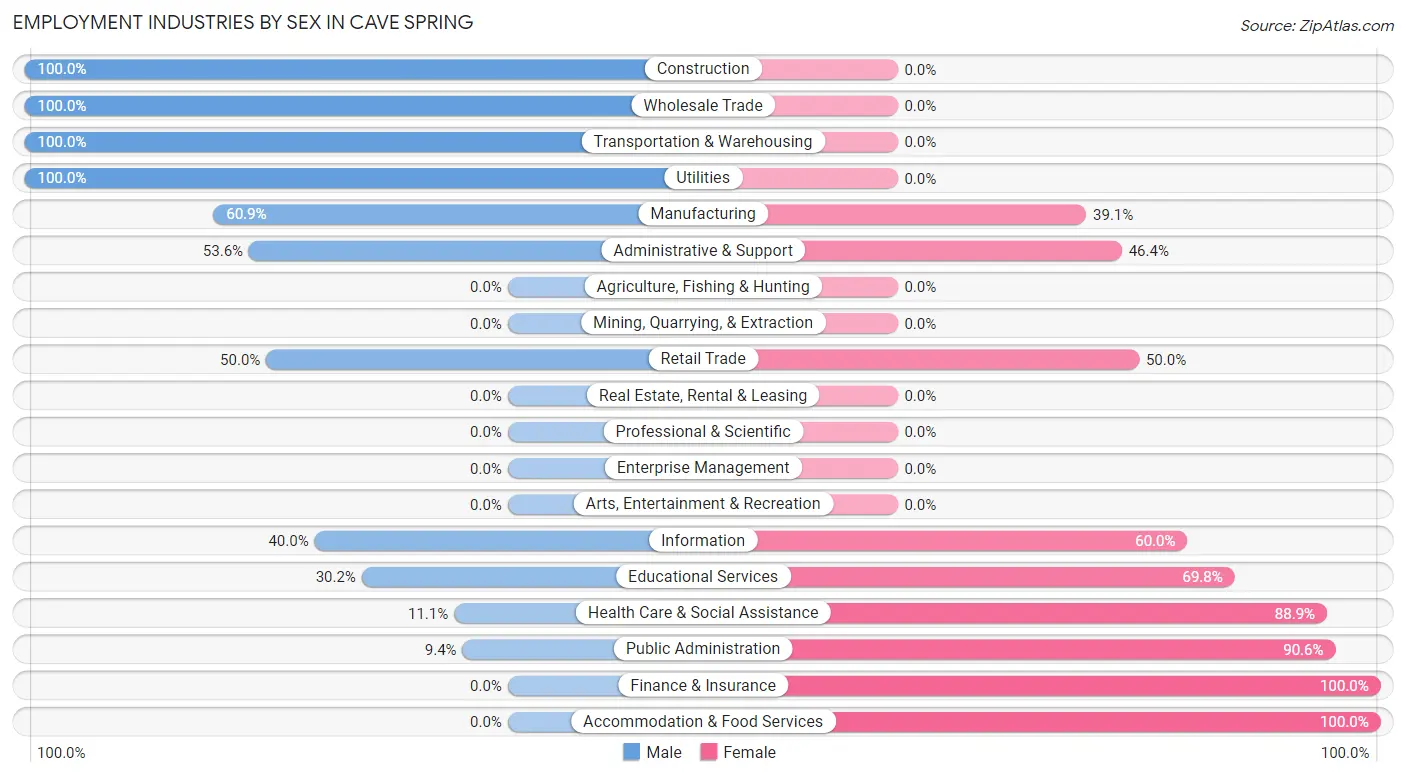
Employment Industries by Sex in Cave Spring
The Cave Spring industries that see more men than women are Construction (100.0%), Wholesale Trade (100.0%), and Transportation & Warehousing (100.0%), whereas the industries that tend to have a higher number of women are Finance & Insurance (100.0%), Accommodation & Food Services (100.0%), and Public Administration (90.6%).
| Industry | Male | Female |
| Agriculture, Fishing & Hunting | 0 (0.0%) | 0 (0.0%) |
| Mining, Quarrying, & Extraction | 0 (0.0%) | 0 (0.0%) |
| Construction | 3 (100.0%) | 0 (0.0%) |
| Manufacturing | 39 (60.9%) | 25 (39.1%) |
| Wholesale Trade | 8 (100.0%) | 0 (0.0%) |
| Retail Trade | 19 (50.0%) | 19 (50.0%) |
| Transportation & Warehousing | 14 (100.0%) | 0 (0.0%) |
| Utilities | 6 (100.0%) | 0 (0.0%) |
| Information | 2 (40.0%) | 3 (60.0%) |
| Finance & Insurance | 0 (0.0%) | 10 (100.0%) |
| Real Estate, Rental & Leasing | 0 (0.0%) | 0 (0.0%) |
| Professional & Scientific | 0 (0.0%) | 0 (0.0%) |
| Enterprise Management | 0 (0.0%) | 0 (0.0%) |
| Administrative & Support | 15 (53.6%) | 13 (46.4%) |
| Educational Services | 13 (30.2%) | 30 (69.8%) |
| Health Care & Social Assistance | 9 (11.1%) | 72 (88.9%) |
| Arts, Entertainment & Recreation | 0 (0.0%) | 0 (0.0%) |
| Accommodation & Food Services | 0 (0.0%) | 18 (100.0%) |
| Public Administration | 3 (9.4%) | 29 (90.6%) |
| Total | 150 (40.2%) | 223 (59.8%) |
Education in Cave Spring
School Enrollment in Cave Spring
The most common levels of schooling among the 287 students in Cave Spring are elementary school (67 | 23.3%), college / undergraduate (51 | 17.8%), and middle school (50 | 17.4%).
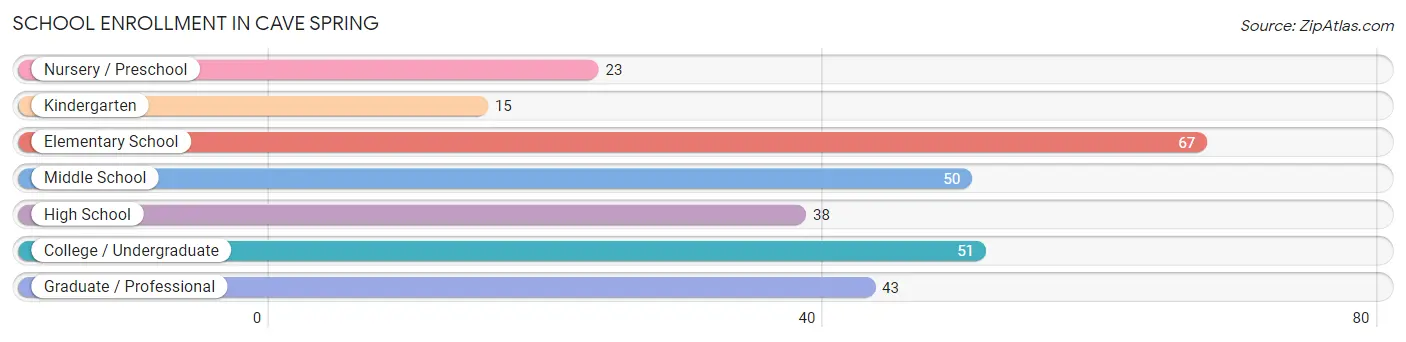
| School Level | # Students | % Students |
| Nursery / Preschool | 23 | 8.0% |
| Kindergarten | 15 | 5.2% |
| Elementary School | 67 | 23.3% |
| Middle School | 50 | 17.4% |
| High School | 38 | 13.2% |
| College / Undergraduate | 51 | 17.8% |
| Graduate / Professional | 43 | 15.0% |
| Total | 287 | 100.0% |
School Enrollment by Age by Funding Source in Cave Spring
Out of a total of 287 students who are enrolled in schools in Cave Spring, 27 (9.4%) attend a private institution, while the remaining 260 (90.6%) are enrolled in public schools. The age group of 3 to 4 year olds has the highest likelihood of being enrolled in private schools, with 6 (100.0% in the age bracket) enrolled. Conversely, the age group of 5 to 9 year old has the lowest likelihood of being enrolled in a private school, with 71 (100.0% in the age bracket) attending a public institution.
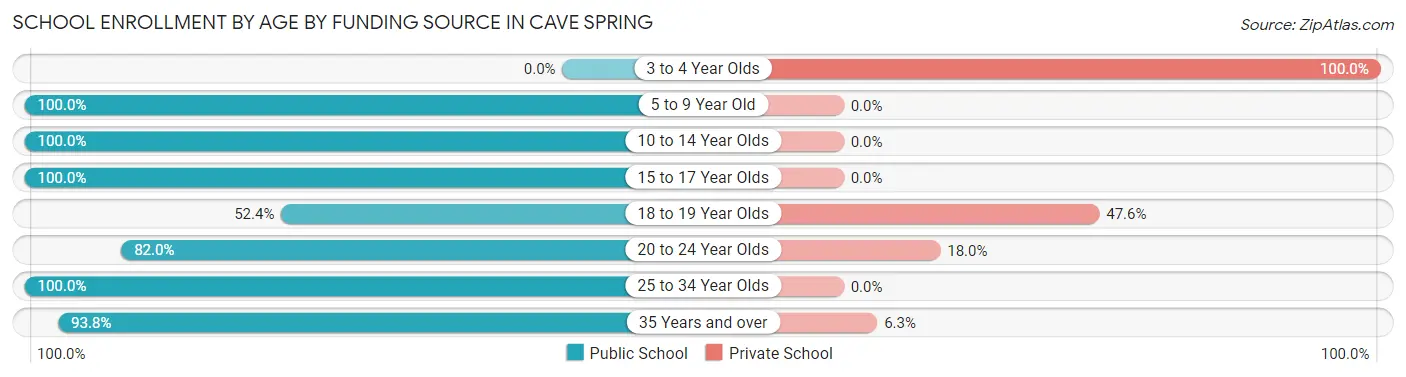
| Age Bracket | Public School | Private School |
| 3 to 4 Year Olds | 0 (0.0%) | 6 (100.0%) |
| 5 to 9 Year Old | 71 (100.0%) | 0 (0.0%) |
| 10 to 14 Year Olds | 82 (100.0%) | 0 (0.0%) |
| 15 to 17 Year Olds | 22 (100.0%) | 0 (0.0%) |
| 18 to 19 Year Olds | 11 (52.4%) | 10 (47.6%) |
| 20 to 24 Year Olds | 41 (82.0%) | 9 (18.0%) |
| 25 to 34 Year Olds | 3 (100.0%) | 0 (0.0%) |
| 35 Years and over | 30 (93.8%) | 2 (6.2%) |
| Total | 260 (90.6%) | 27 (9.4%) |
Educational Attainment by Field of Study in Cave Spring
Business (36 | 28.8%), education (19 | 15.2%), science & technology (17 | 13.6%), psychology (16 | 12.8%), and bio, nature & agricultural (15 | 12.0%) are the most common fields of study among 125 individuals in Cave Spring who have obtained a bachelor's degree or higher.
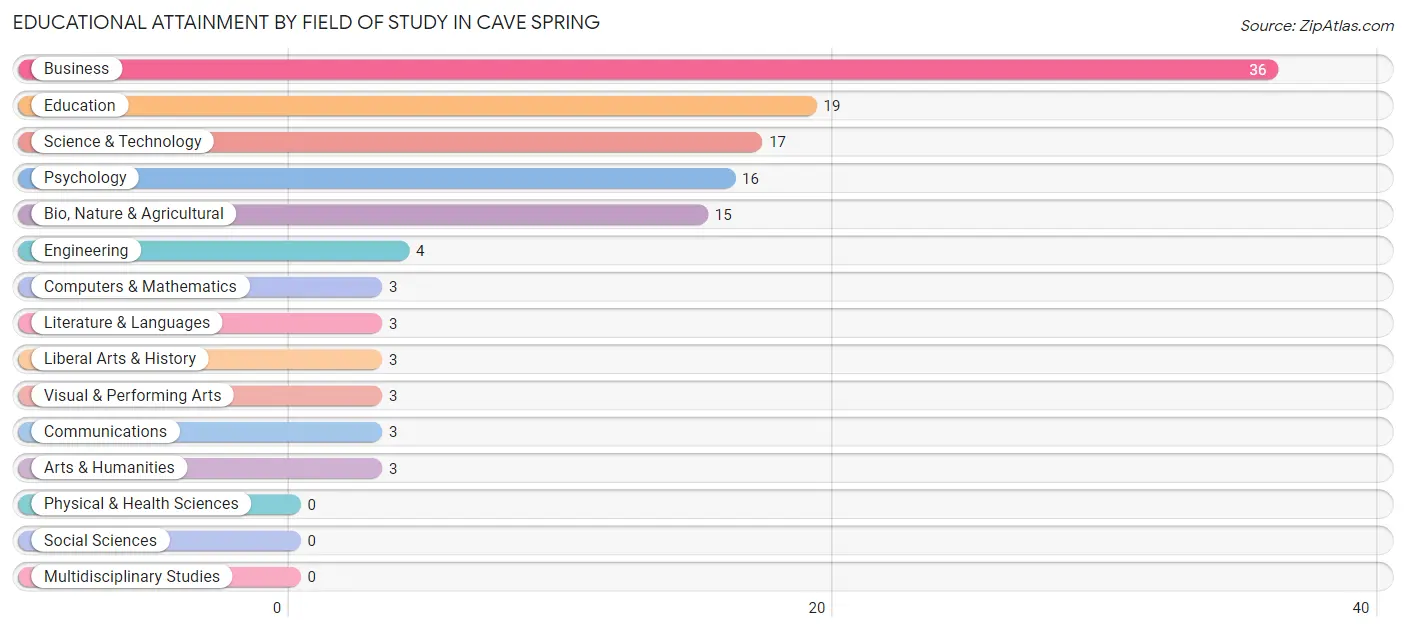
| Field of Study | # Graduates | % Graduates |
| Computers & Mathematics | 3 | 2.4% |
| Bio, Nature & Agricultural | 15 | 12.0% |
| Physical & Health Sciences | 0 | 0.0% |
| Psychology | 16 | 12.8% |
| Social Sciences | 0 | 0.0% |
| Engineering | 4 | 3.2% |
| Multidisciplinary Studies | 0 | 0.0% |
| Science & Technology | 17 | 13.6% |
| Business | 36 | 28.8% |
| Education | 19 | 15.2% |
| Literature & Languages | 3 | 2.4% |
| Liberal Arts & History | 3 | 2.4% |
| Visual & Performing Arts | 3 | 2.4% |
| Communications | 3 | 2.4% |
| Arts & Humanities | 3 | 2.4% |
| Total | 125 | 100.0% |
Transportation & Commute in Cave Spring
Vehicle Availability by Sex in Cave Spring
The most prevalent vehicle ownership categories in Cave Spring are males with 3 vehicles (45, accounting for 30.0%) and females with 3 vehicles (86, making up 20.4%).
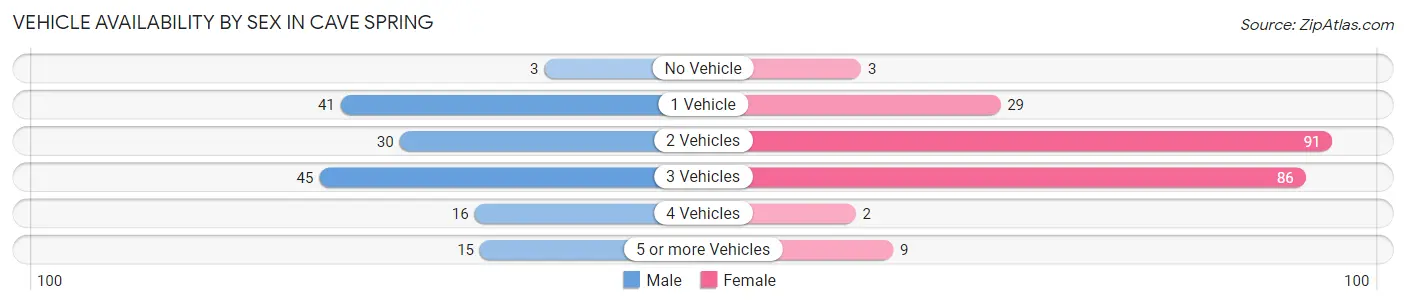
| Vehicles Available | Male | Female |
| No Vehicle | 3 (2.0%) | 3 (1.4%) |
| 1 Vehicle | 41 (27.3%) | 29 (13.2%) |
| 2 Vehicles | 30 (20.0%) | 91 (41.4%) |
| 3 Vehicles | 45 (30.0%) | 86 (39.1%) |
| 4 Vehicles | 16 (10.7%) | 2 (0.9%) |
| 5 or more Vehicles | 15 (10.0%) | 9 (4.1%) |
| Total | 150 (100.0%) | 220 (100.0%) |
Commute Time in Cave Spring
The most frequently occuring commute durations in Cave Spring are 30 to 34 minutes (106 commuters, 29.2%), 25 to 29 minutes (60 commuters, 16.5%), and 5 to 9 minutes (45 commuters, 12.4%).
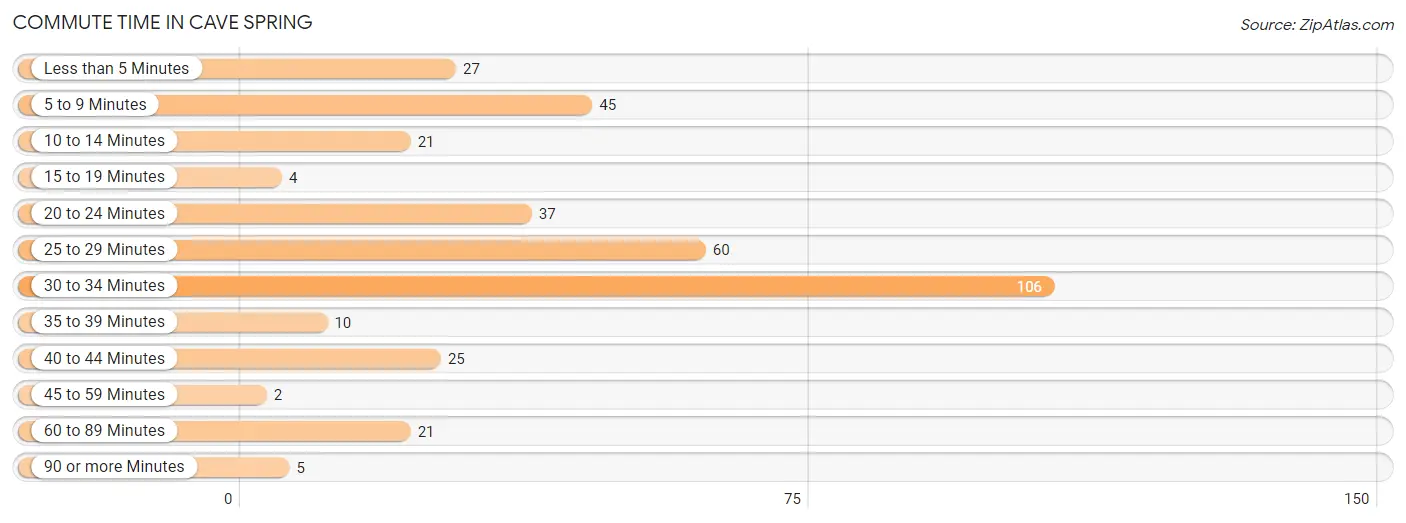
| Commute Time | # Commuters | % Commuters |
| Less than 5 Minutes | 27 | 7.4% |
| 5 to 9 Minutes | 45 | 12.4% |
| 10 to 14 Minutes | 21 | 5.8% |
| 15 to 19 Minutes | 4 | 1.1% |
| 20 to 24 Minutes | 37 | 10.2% |
| 25 to 29 Minutes | 60 | 16.5% |
| 30 to 34 Minutes | 106 | 29.2% |
| 35 to 39 Minutes | 10 | 2.8% |
| 40 to 44 Minutes | 25 | 6.9% |
| 45 to 59 Minutes | 2 | 0.5% |
| 60 to 89 Minutes | 21 | 5.8% |
| 90 or more Minutes | 5 | 1.4% |
Commute Time by Sex in Cave Spring
The most common commute times in Cave Spring are 30 to 34 minutes (45 commuters, 31.5%) for males and 30 to 34 minutes (61 commuters, 27.7%) for females.
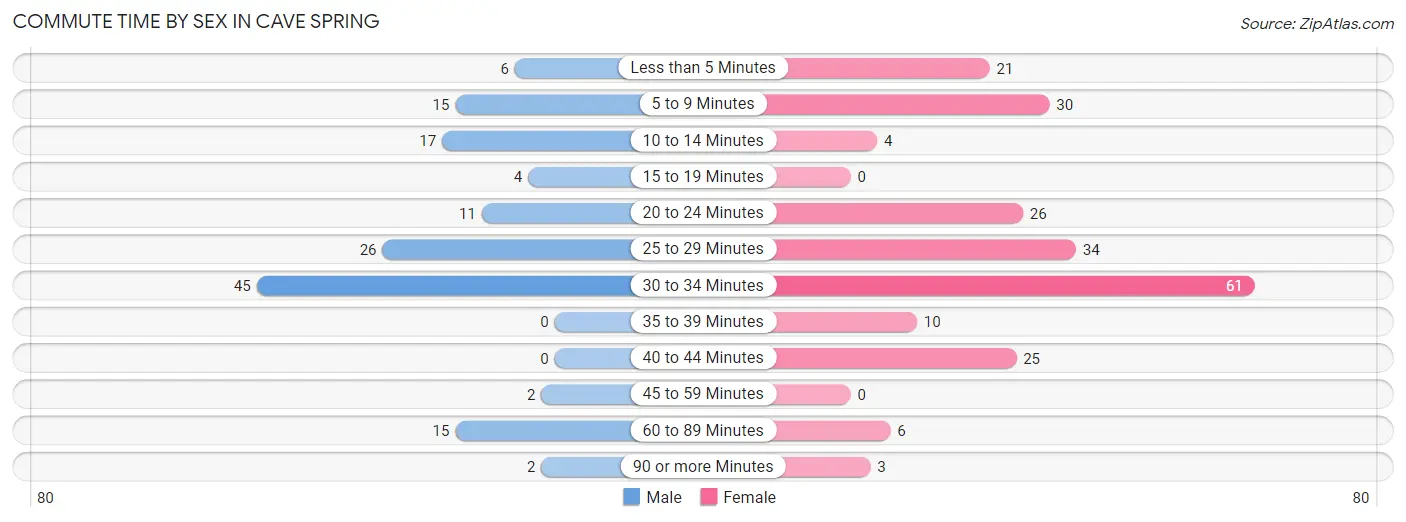
| Commute Time | Male | Female |
| Less than 5 Minutes | 6 (4.2%) | 21 (9.6%) |
| 5 to 9 Minutes | 15 (10.5%) | 30 (13.6%) |
| 10 to 14 Minutes | 17 (11.9%) | 4 (1.8%) |
| 15 to 19 Minutes | 4 (2.8%) | 0 (0.0%) |
| 20 to 24 Minutes | 11 (7.7%) | 26 (11.8%) |
| 25 to 29 Minutes | 26 (18.2%) | 34 (15.4%) |
| 30 to 34 Minutes | 45 (31.5%) | 61 (27.7%) |
| 35 to 39 Minutes | 0 (0.0%) | 10 (4.5%) |
| 40 to 44 Minutes | 0 (0.0%) | 25 (11.4%) |
| 45 to 59 Minutes | 2 (1.4%) | 0 (0.0%) |
| 60 to 89 Minutes | 15 (10.5%) | 6 (2.7%) |
| 90 or more Minutes | 2 (1.4%) | 3 (1.4%) |
Time of Departure to Work by Sex in Cave Spring
The most frequent times of departure to work in Cave Spring are 5:00 AM to 5:29 AM (26, 18.2%) for males and 7:00 AM to 7:29 AM (66, 30.0%) for females.
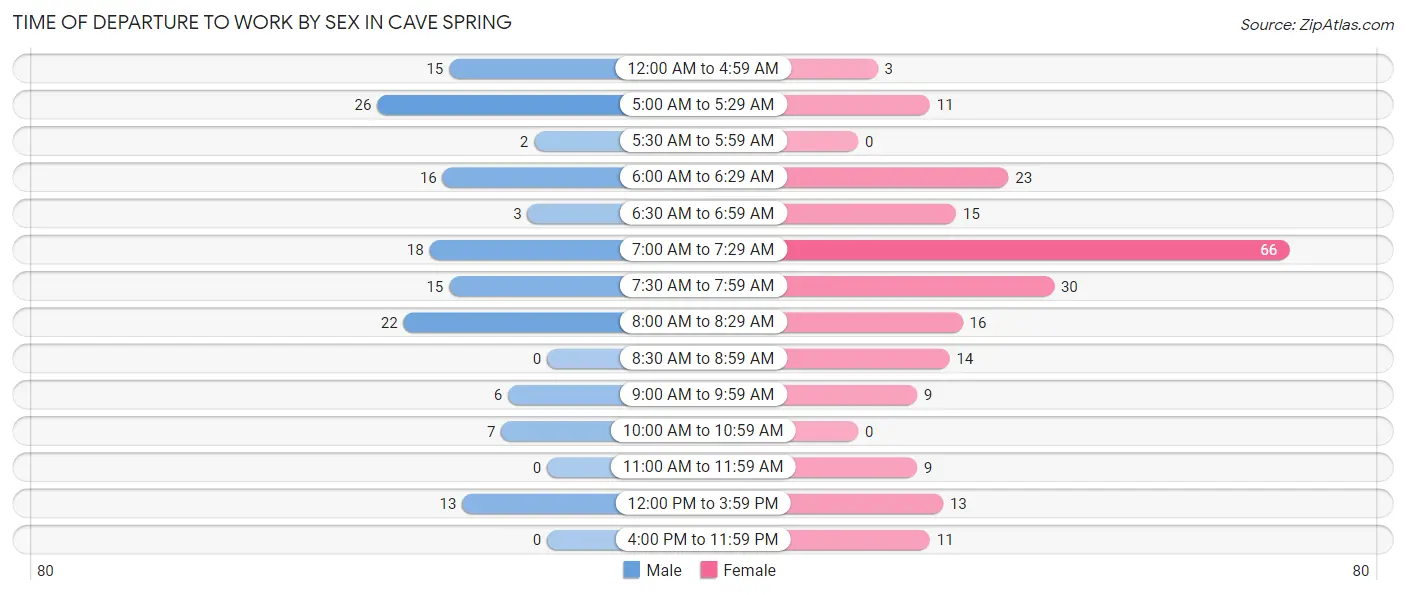
| Time of Departure | Male | Female |
| 12:00 AM to 4:59 AM | 15 (10.5%) | 3 (1.4%) |
| 5:00 AM to 5:29 AM | 26 (18.2%) | 11 (5.0%) |
| 5:30 AM to 5:59 AM | 2 (1.4%) | 0 (0.0%) |
| 6:00 AM to 6:29 AM | 16 (11.2%) | 23 (10.4%) |
| 6:30 AM to 6:59 AM | 3 (2.1%) | 15 (6.8%) |
| 7:00 AM to 7:29 AM | 18 (12.6%) | 66 (30.0%) |
| 7:30 AM to 7:59 AM | 15 (10.5%) | 30 (13.6%) |
| 8:00 AM to 8:29 AM | 22 (15.4%) | 16 (7.3%) |
| 8:30 AM to 8:59 AM | 0 (0.0%) | 14 (6.4%) |
| 9:00 AM to 9:59 AM | 6 (4.2%) | 9 (4.1%) |
| 10:00 AM to 10:59 AM | 7 (4.9%) | 0 (0.0%) |
| 11:00 AM to 11:59 AM | 0 (0.0%) | 9 (4.1%) |
| 12:00 PM to 3:59 PM | 13 (9.1%) | 13 (5.9%) |
| 4:00 PM to 11:59 PM | 0 (0.0%) | 11 (5.0%) |
| Total | 143 (100.0%) | 220 (100.0%) |
Housing Occupancy in Cave Spring
Occupancy by Ownership in Cave Spring
Of the total 369 dwellings in Cave Spring, owner-occupied units account for 234 (63.4%), while renter-occupied units make up 135 (36.6%).
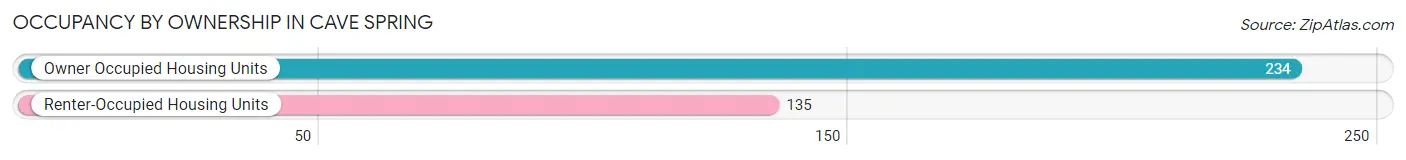
| Occupancy | # Housing Units | % Housing Units |
| Owner Occupied Housing Units | 234 | 63.4% |
| Renter-Occupied Housing Units | 135 | 36.6% |
| Total Occupied Housing Units | 369 | 100.0% |
Occupancy by Household Size in Cave Spring
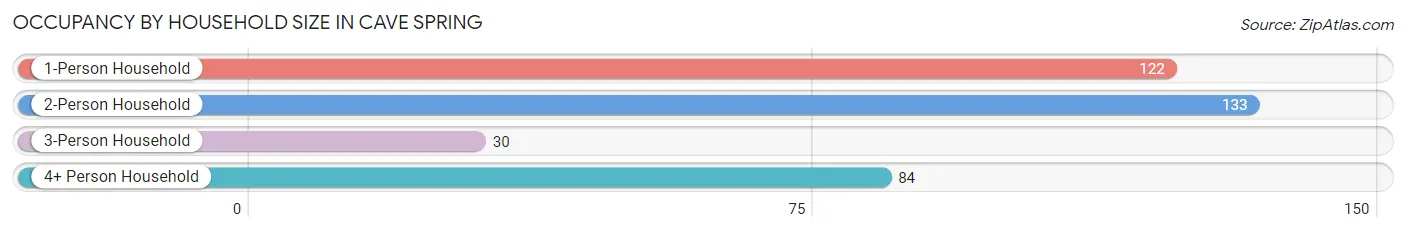
| Household Size | # Housing Units | % Housing Units |
| 1-Person Household | 122 | 33.1% |
| 2-Person Household | 133 | 36.0% |
| 3-Person Household | 30 | 8.1% |
| 4+ Person Household | 84 | 22.8% |
| Total Housing Units | 369 | 100.0% |
Occupancy by Ownership by Household Size in Cave Spring
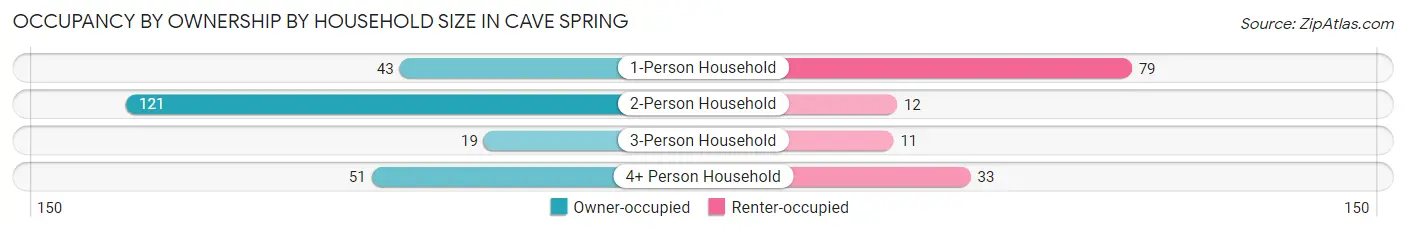
| Household Size | Owner-occupied | Renter-occupied |
| 1-Person Household | 43 (35.2%) | 79 (64.7%) |
| 2-Person Household | 121 (91.0%) | 12 (9.0%) |
| 3-Person Household | 19 (63.3%) | 11 (36.7%) |
| 4+ Person Household | 51 (60.7%) | 33 (39.3%) |
| Total Housing Units | 234 (63.4%) | 135 (36.6%) |
Occupancy by Educational Attainment in Cave Spring
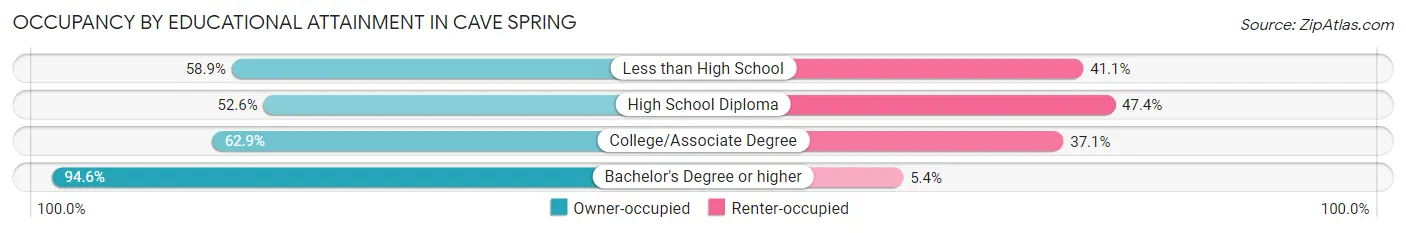
| Household Size | Owner-occupied | Renter-occupied |
| Less than High School | 33 (58.9%) | 23 (41.1%) |
| High School Diploma | 70 (52.6%) | 63 (47.4%) |
| College/Associate Degree | 78 (62.9%) | 46 (37.1%) |
| Bachelor's Degree or higher | 53 (94.6%) | 3 (5.4%) |
Occupancy by Age of Householder in Cave Spring
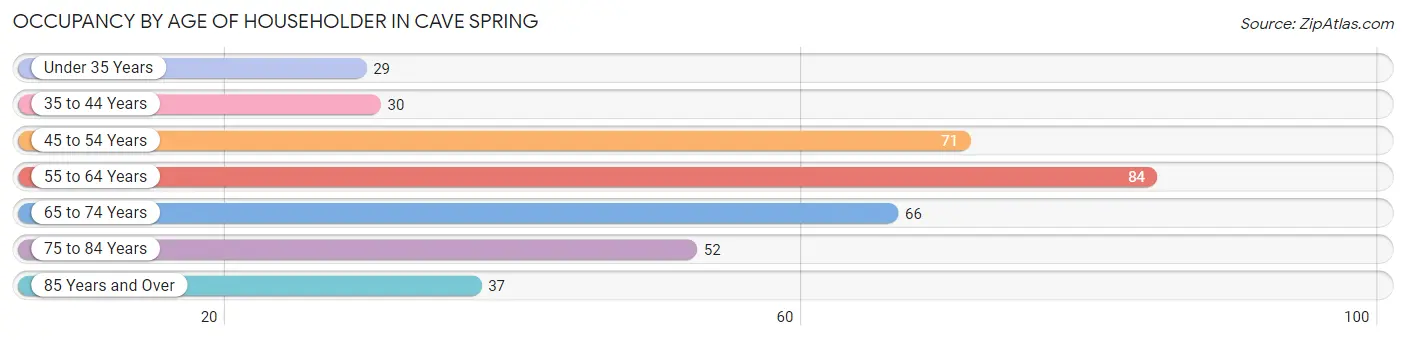
| Age Bracket | # Households | % Households |
| Under 35 Years | 29 | 7.9% |
| 35 to 44 Years | 30 | 8.1% |
| 45 to 54 Years | 71 | 19.2% |
| 55 to 64 Years | 84 | 22.8% |
| 65 to 74 Years | 66 | 17.9% |
| 75 to 84 Years | 52 | 14.1% |
| 85 Years and Over | 37 | 10.0% |
| Total | 369 | 100.0% |
Housing Finances in Cave Spring
Median Income by Occupancy in Cave Spring
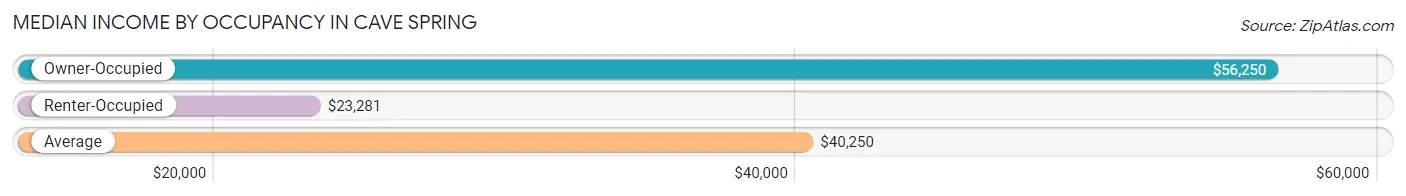
| Occupancy Type | # Households | Median Income |
| Owner-Occupied | 234 (63.4%) | $56,250 |
| Renter-Occupied | 135 (36.6%) | $23,281 |
| Average | 369 (100.0%) | $40,250 |
Occupancy by Householder Income Bracket in Cave Spring
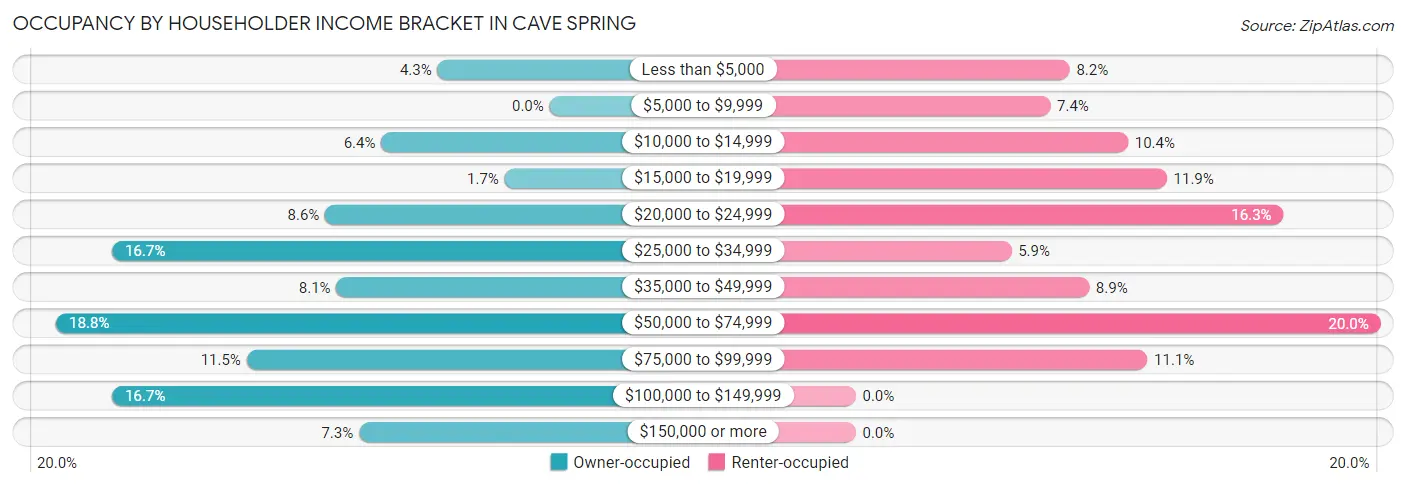
| Income Bracket | Owner-occupied | Renter-occupied |
| Less than $5,000 | 10 (4.3%) | 11 (8.2%) |
| $5,000 to $9,999 | 0 (0.0%) | 10 (7.4%) |
| $10,000 to $14,999 | 15 (6.4%) | 14 (10.4%) |
| $15,000 to $19,999 | 4 (1.7%) | 16 (11.8%) |
| $20,000 to $24,999 | 20 (8.6%) | 22 (16.3%) |
| $25,000 to $34,999 | 39 (16.7%) | 8 (5.9%) |
| $35,000 to $49,999 | 19 (8.1%) | 12 (8.9%) |
| $50,000 to $74,999 | 44 (18.8%) | 27 (20.0%) |
| $75,000 to $99,999 | 27 (11.5%) | 15 (11.1%) |
| $100,000 to $149,999 | 39 (16.7%) | 0 (0.0%) |
| $150,000 or more | 17 (7.3%) | 0 (0.0%) |
| Total | 234 (100.0%) | 135 (100.0%) |
Monthly Housing Cost Tiers in Cave Spring
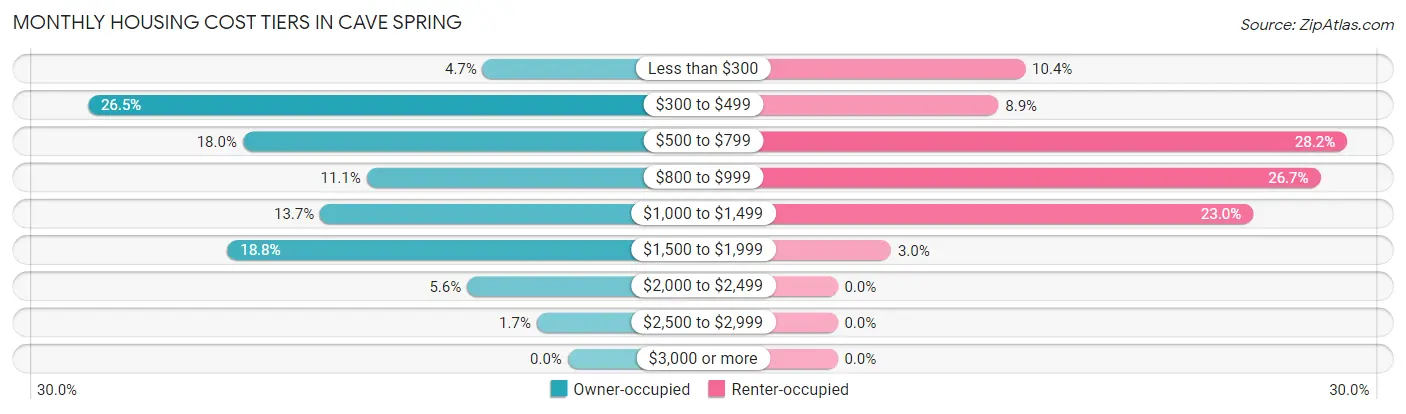
| Monthly Cost | Owner-occupied | Renter-occupied |
| Less than $300 | 11 (4.7%) | 14 (10.4%) |
| $300 to $499 | 62 (26.5%) | 12 (8.9%) |
| $500 to $799 | 42 (17.9%) | 38 (28.1%) |
| $800 to $999 | 26 (11.1%) | 36 (26.7%) |
| $1,000 to $1,499 | 32 (13.7%) | 31 (23.0%) |
| $1,500 to $1,999 | 44 (18.8%) | 4 (3.0%) |
| $2,000 to $2,499 | 13 (5.6%) | 0 (0.0%) |
| $2,500 to $2,999 | 4 (1.7%) | 0 (0.0%) |
| $3,000 or more | 0 (0.0%) | 0 (0.0%) |
| Total | 234 (100.0%) | 135 (100.0%) |
Physical Housing Characteristics in Cave Spring
Housing Structures in Cave Spring
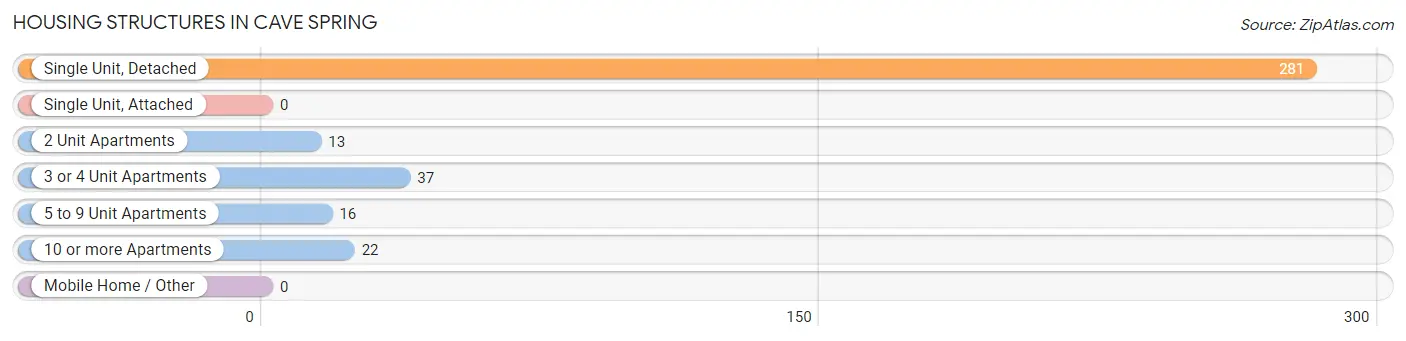
| Structure Type | # Housing Units | % Housing Units |
| Single Unit, Detached | 281 | 76.1% |
| Single Unit, Attached | 0 | 0.0% |
| 2 Unit Apartments | 13 | 3.5% |
| 3 or 4 Unit Apartments | 37 | 10.0% |
| 5 to 9 Unit Apartments | 16 | 4.3% |
| 10 or more Apartments | 22 | 6.0% |
| Mobile Home / Other | 0 | 0.0% |
| Total | 369 | 100.0% |
Housing Structures by Occupancy in Cave Spring
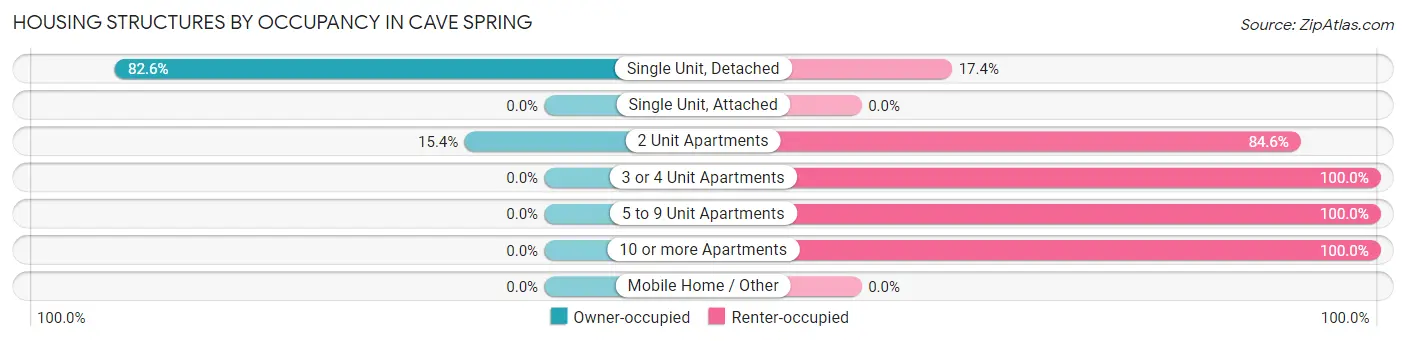
| Structure Type | Owner-occupied | Renter-occupied |
| Single Unit, Detached | 232 (82.6%) | 49 (17.4%) |
| Single Unit, Attached | 0 (0.0%) | 0 (0.0%) |
| 2 Unit Apartments | 2 (15.4%) | 11 (84.6%) |
| 3 or 4 Unit Apartments | 0 (0.0%) | 37 (100.0%) |
| 5 to 9 Unit Apartments | 0 (0.0%) | 16 (100.0%) |
| 10 or more Apartments | 0 (0.0%) | 22 (100.0%) |
| Mobile Home / Other | 0 (0.0%) | 0 (0.0%) |
| Total | 234 (63.4%) | 135 (36.6%) |
Housing Structures by Number of Rooms in Cave Spring
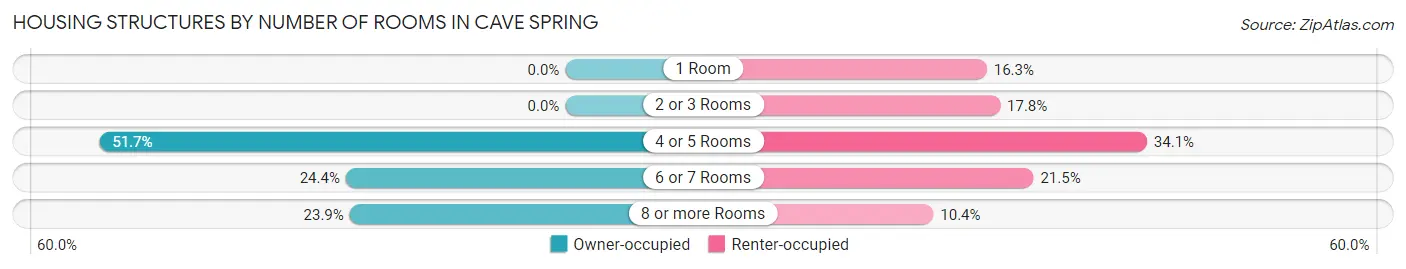
| Number of Rooms | Owner-occupied | Renter-occupied |
| 1 Room | 0 (0.0%) | 22 (16.3%) |
| 2 or 3 Rooms | 0 (0.0%) | 24 (17.8%) |
| 4 or 5 Rooms | 121 (51.7%) | 46 (34.1%) |
| 6 or 7 Rooms | 57 (24.4%) | 29 (21.5%) |
| 8 or more Rooms | 56 (23.9%) | 14 (10.4%) |
| Total | 234 (100.0%) | 135 (100.0%) |
Housing Structure by Heating Type in Cave Spring
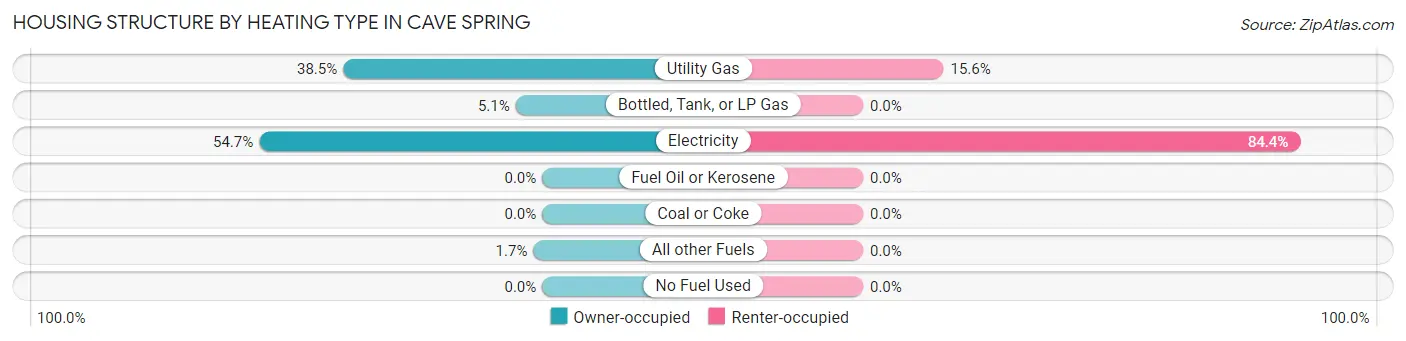
| Heating Type | Owner-occupied | Renter-occupied |
| Utility Gas | 90 (38.5%) | 21 (15.6%) |
| Bottled, Tank, or LP Gas | 12 (5.1%) | 0 (0.0%) |
| Electricity | 128 (54.7%) | 114 (84.4%) |
| Fuel Oil or Kerosene | 0 (0.0%) | 0 (0.0%) |
| Coal or Coke | 0 (0.0%) | 0 (0.0%) |
| All other Fuels | 4 (1.7%) | 0 (0.0%) |
| No Fuel Used | 0 (0.0%) | 0 (0.0%) |
| Total | 234 (100.0%) | 135 (100.0%) |
Household Vehicle Usage in Cave Spring
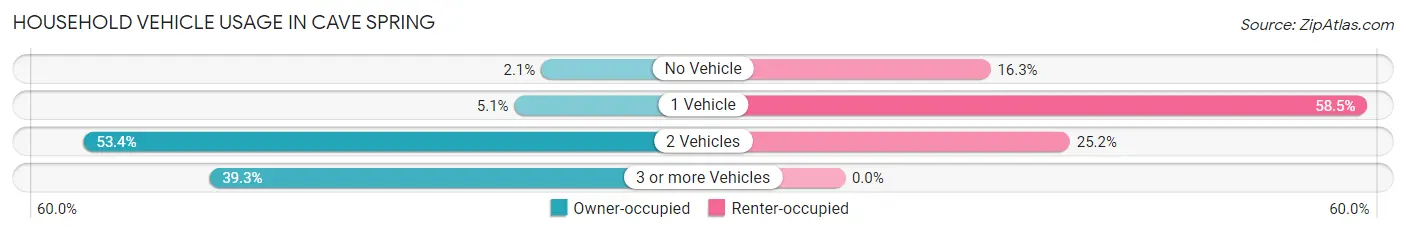
| Vehicles per Household | Owner-occupied | Renter-occupied |
| No Vehicle | 5 (2.1%) | 22 (16.3%) |
| 1 Vehicle | 12 (5.1%) | 79 (58.5%) |
| 2 Vehicles | 125 (53.4%) | 34 (25.2%) |
| 3 or more Vehicles | 92 (39.3%) | 0 (0.0%) |
| Total | 234 (100.0%) | 135 (100.0%) |
Real Estate & Mortgages in Cave Spring
Real Estate and Mortgage Overview in Cave Spring
| Characteristic | Without Mortgage | With Mortgage |
| Housing Units | 96 | 138 |
| Median Property Value | $77,400 | $170,300 |
| Median Household Income | $41,250 | $17 |
| Monthly Housing Costs | $359 | $0 |
| Real Estate Taxes | $336 | $0 |
Property Value by Mortgage Status in Cave Spring
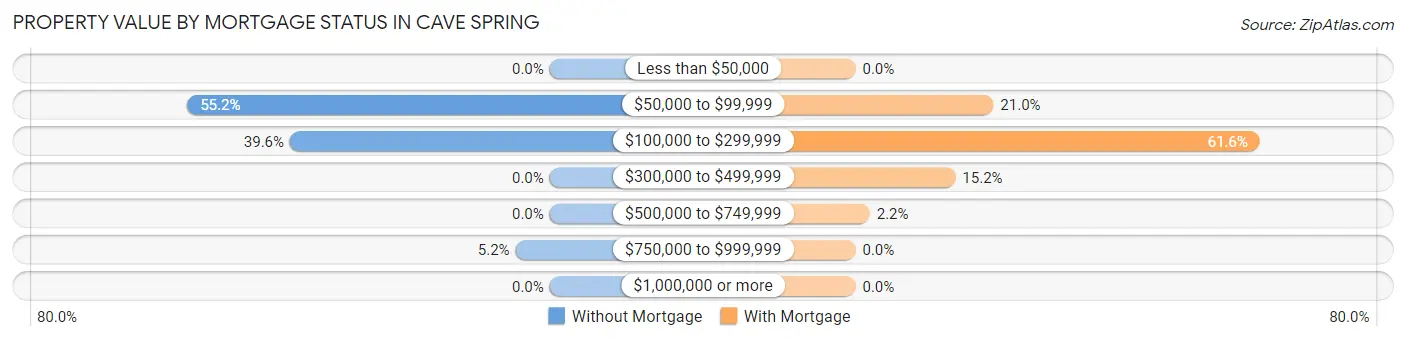
| Property Value | Without Mortgage | With Mortgage |
| Less than $50,000 | 0 (0.0%) | 0 (0.0%) |
| $50,000 to $99,999 | 53 (55.2%) | 29 (21.0%) |
| $100,000 to $299,999 | 38 (39.6%) | 85 (61.6%) |
| $300,000 to $499,999 | 0 (0.0%) | 21 (15.2%) |
| $500,000 to $749,999 | 0 (0.0%) | 3 (2.2%) |
| $750,000 to $999,999 | 5 (5.2%) | 0 (0.0%) |
| $1,000,000 or more | 0 (0.0%) | 0 (0.0%) |
| Total | 96 (100.0%) | 138 (100.0%) |
Household Income by Mortgage Status in Cave Spring
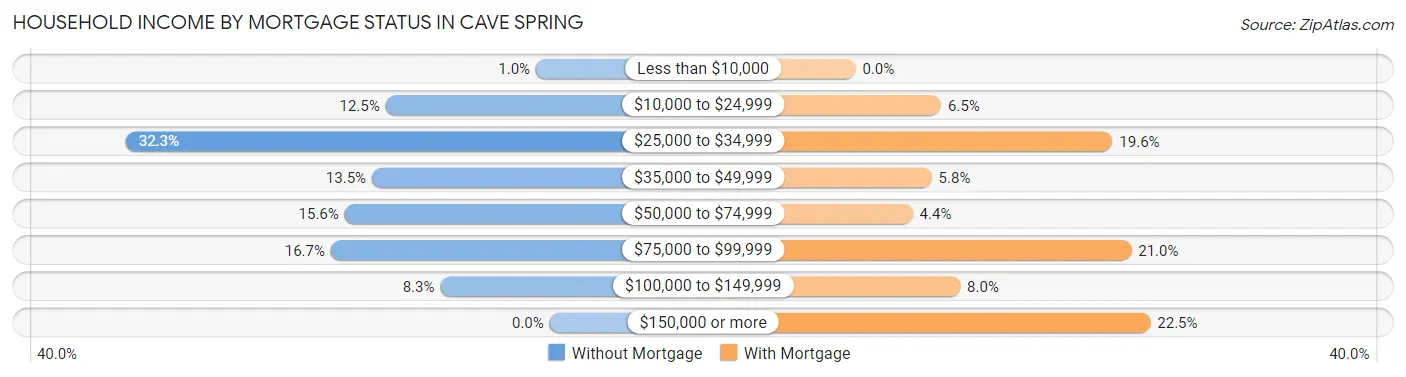
| Household Income | Without Mortgage | With Mortgage |
| Less than $10,000 | 1 (1.0%) | 0 (0.0%) |
| $10,000 to $24,999 | 12 (12.5%) | 9 (6.5%) |
| $25,000 to $34,999 | 31 (32.3%) | 27 (19.6%) |
| $35,000 to $49,999 | 13 (13.5%) | 8 (5.8%) |
| $50,000 to $74,999 | 15 (15.6%) | 6 (4.3%) |
| $75,000 to $99,999 | 16 (16.7%) | 29 (21.0%) |
| $100,000 to $149,999 | 8 (8.3%) | 11 (8.0%) |
| $150,000 or more | 0 (0.0%) | 31 (22.5%) |
| Total | 96 (100.0%) | 138 (100.0%) |
Property Value to Household Income Ratio in Cave Spring
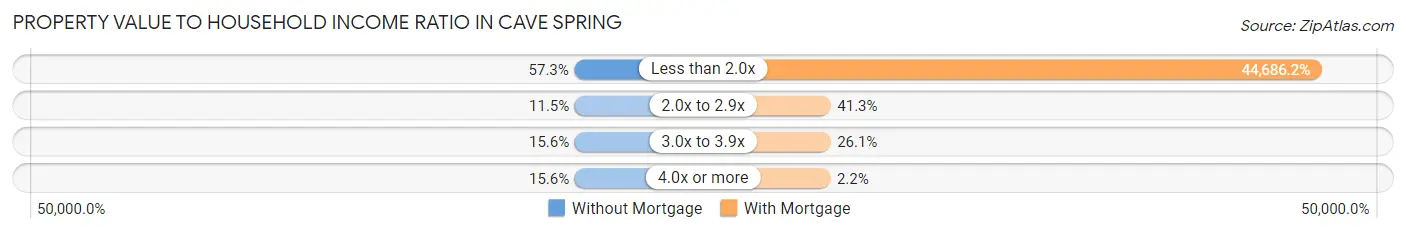
| Value-to-Income Ratio | Without Mortgage | With Mortgage |
| Less than 2.0x | 55 (57.3%) | 61,667 (44,686.2%) |
| 2.0x to 2.9x | 11 (11.5%) | 57 (41.3%) |
| 3.0x to 3.9x | 15 (15.6%) | 36 (26.1%) |
| 4.0x or more | 15 (15.6%) | 3 (2.2%) |
| Total | 96 (100.0%) | 138 (100.0%) |
Real Estate Taxes by Mortgage Status in Cave Spring
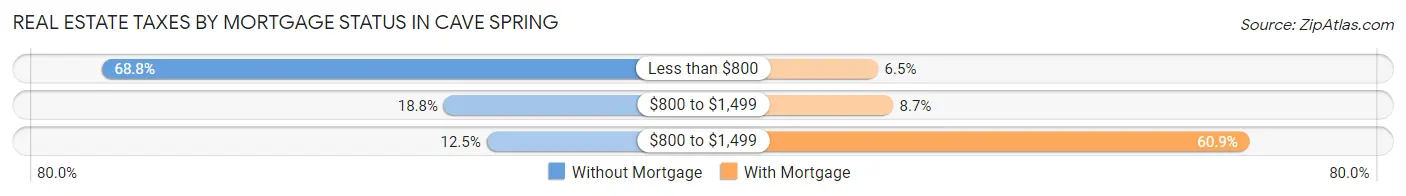
| Property Taxes | Without Mortgage | With Mortgage |
| Less than $800 | 66 (68.8%) | 9 (6.5%) |
| $800 to $1,499 | 18 (18.8%) | 12 (8.7%) |
| $800 to $1,499 | 12 (12.5%) | 84 (60.9%) |
| Total | 96 (100.0%) | 138 (100.0%) |
Health & Disability in Cave Spring
Health Insurance Coverage by Age in Cave Spring
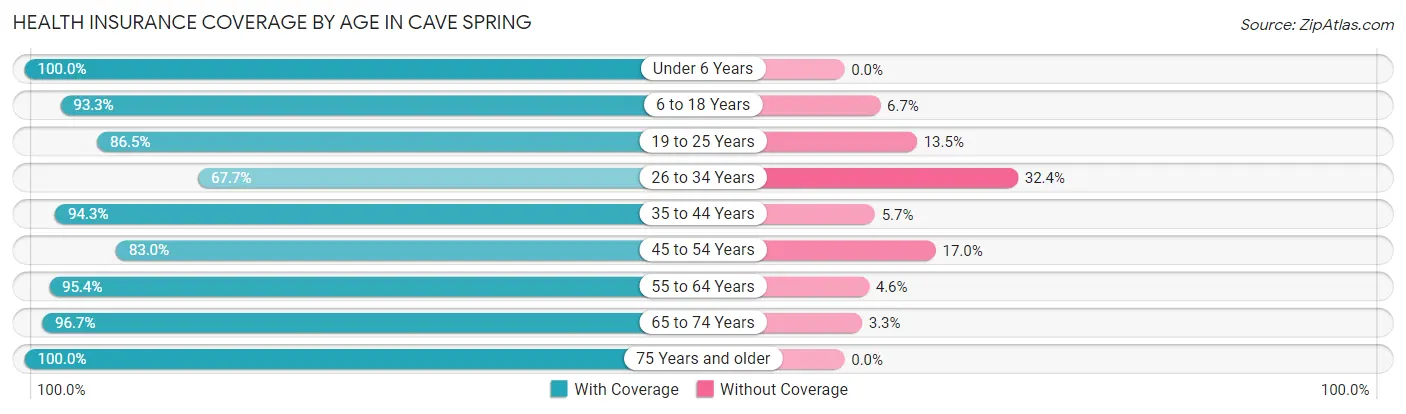
| Age Bracket | With Coverage | Without Coverage |
| Under 6 Years | 16 (100.0%) | 0 (0.0%) |
| 6 to 18 Years | 168 (93.3%) | 12 (6.7%) |
| 19 to 25 Years | 64 (86.5%) | 10 (13.5%) |
| 26 to 34 Years | 46 (67.6%) | 22 (32.4%) |
| 35 to 44 Years | 83 (94.3%) | 5 (5.7%) |
| 45 to 54 Years | 117 (83.0%) | 24 (17.0%) |
| 55 to 64 Years | 167 (95.4%) | 8 (4.6%) |
| 65 to 74 Years | 89 (96.7%) | 3 (3.3%) |
| 75 Years and older | 95 (100.0%) | 0 (0.0%) |
| Total | 845 (91.0%) | 84 (9.0%) |
Health Insurance Coverage by Citizenship Status in Cave Spring
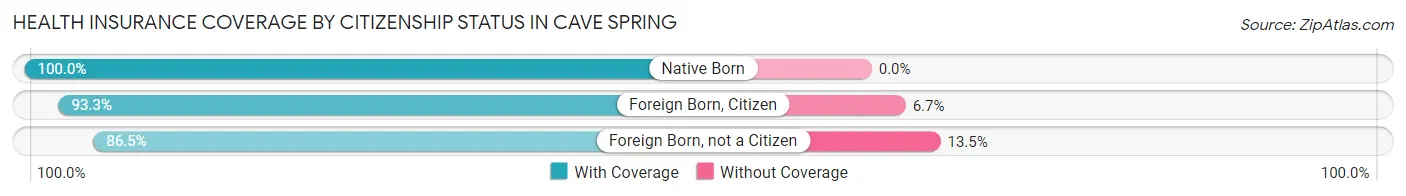
| Citizenship Status | With Coverage | Without Coverage |
| Native Born | 16 (100.0%) | 0 (0.0%) |
| Foreign Born, Citizen | 168 (93.3%) | 12 (6.7%) |
| Foreign Born, not a Citizen | 64 (86.5%) | 10 (13.5%) |
Health Insurance Coverage by Household Income in Cave Spring
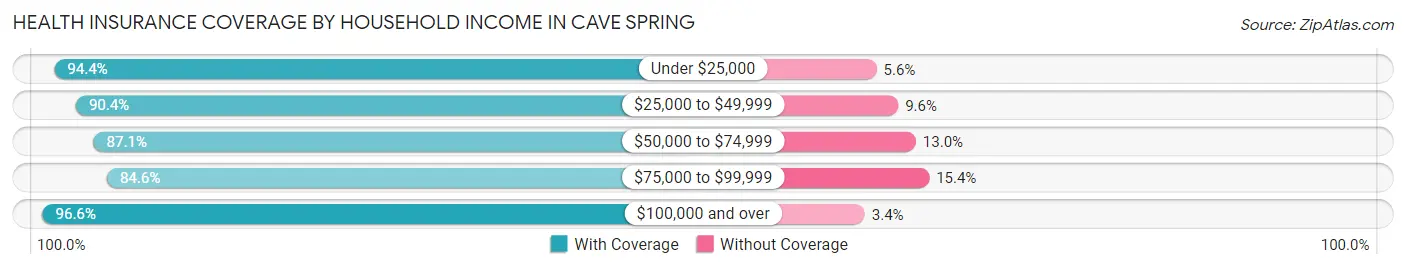
| Household Income | With Coverage | Without Coverage |
| Under $25,000 | 135 (94.4%) | 8 (5.6%) |
| $25,000 to $49,999 | 169 (90.4%) | 18 (9.6%) |
| $50,000 to $74,999 | 195 (87.1%) | 29 (13.0%) |
| $75,000 to $99,999 | 115 (84.6%) | 21 (15.4%) |
| $100,000 and over | 229 (96.6%) | 8 (3.4%) |
Public vs Private Health Insurance Coverage by Age in Cave Spring
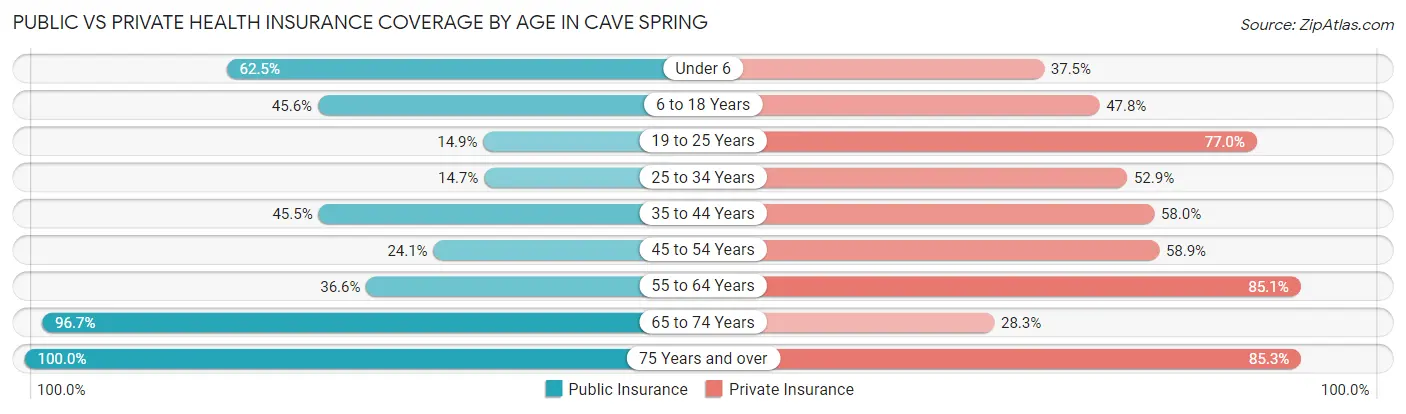
| Age Bracket | Public Insurance | Private Insurance |
| Under 6 | 10 (62.5%) | 6 (37.5%) |
| 6 to 18 Years | 82 (45.6%) | 86 (47.8%) |
| 19 to 25 Years | 11 (14.9%) | 57 (77.0%) |
| 25 to 34 Years | 10 (14.7%) | 36 (52.9%) |
| 35 to 44 Years | 40 (45.5%) | 51 (58.0%) |
| 45 to 54 Years | 34 (24.1%) | 83 (58.9%) |
| 55 to 64 Years | 64 (36.6%) | 149 (85.1%) |
| 65 to 74 Years | 89 (96.7%) | 26 (28.3%) |
| 75 Years and over | 95 (100.0%) | 81 (85.3%) |
| Total | 435 (46.8%) | 575 (61.9%) |
Disability Status by Sex by Age in Cave Spring
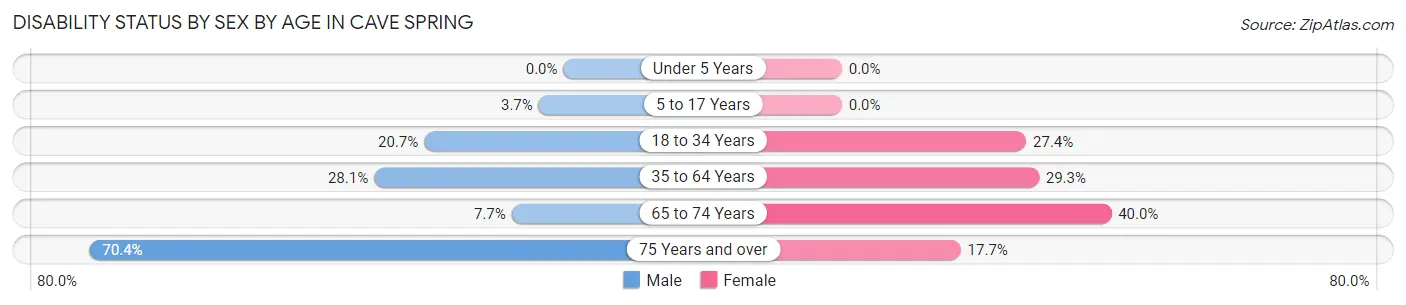
| Age Bracket | Male | Female |
| Under 5 Years | 0 (0.0%) | 0 (0.0%) |
| 5 to 17 Years | 4 (3.7%) | 0 (0.0%) |
| 18 to 34 Years | 12 (20.7%) | 26 (27.4%) |
| 35 to 64 Years | 54 (28.1%) | 62 (29.2%) |
| 65 to 74 Years | 4 (7.7%) | 16 (40.0%) |
| 75 Years and over | 19 (70.4%) | 12 (17.6%) |
Disability Class by Sex by Age in Cave Spring
Disability Class: Hearing Difficulty
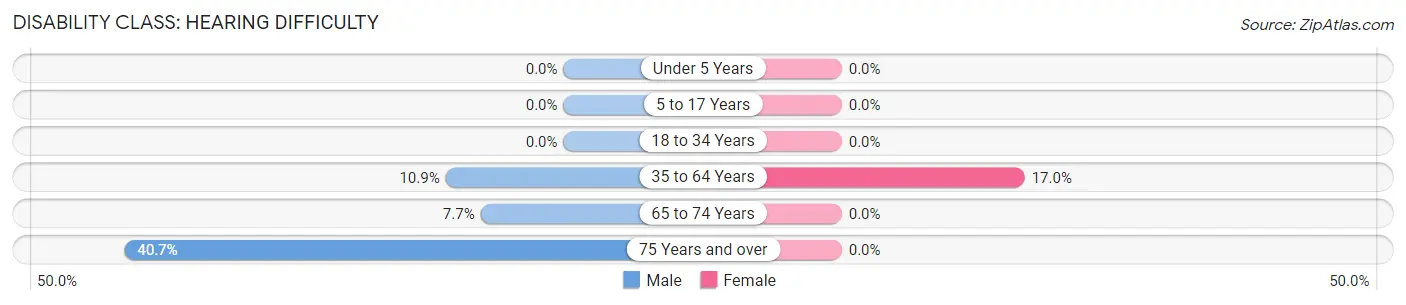
| Age Bracket | Male | Female |
| Under 5 Years | 0 (0.0%) | 0 (0.0%) |
| 5 to 17 Years | 0 (0.0%) | 0 (0.0%) |
| 18 to 34 Years | 0 (0.0%) | 0 (0.0%) |
| 35 to 64 Years | 21 (10.9%) | 36 (17.0%) |
| 65 to 74 Years | 4 (7.7%) | 0 (0.0%) |
| 75 Years and over | 11 (40.7%) | 0 (0.0%) |
Disability Class: Vision Difficulty
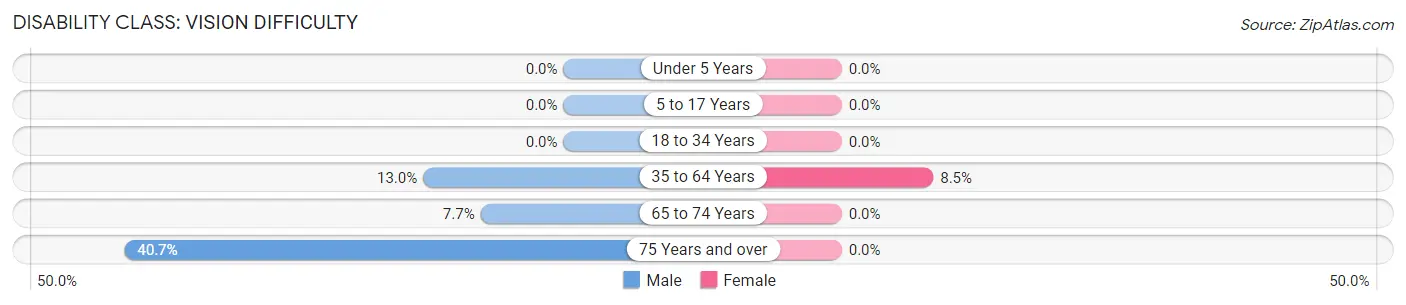
| Age Bracket | Male | Female |
| Under 5 Years | 0 (0.0%) | 0 (0.0%) |
| 5 to 17 Years | 0 (0.0%) | 0 (0.0%) |
| 18 to 34 Years | 0 (0.0%) | 0 (0.0%) |
| 35 to 64 Years | 25 (13.0%) | 18 (8.5%) |
| 65 to 74 Years | 4 (7.7%) | 0 (0.0%) |
| 75 Years and over | 11 (40.7%) | 0 (0.0%) |
Disability Class: Cognitive Difficulty
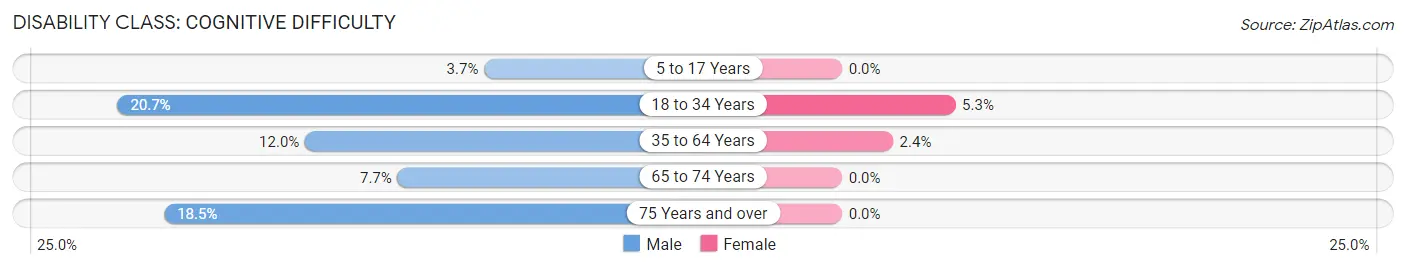
| Age Bracket | Male | Female |
| 5 to 17 Years | 4 (3.7%) | 0 (0.0%) |
| 18 to 34 Years | 12 (20.7%) | 5 (5.3%) |
| 35 to 64 Years | 23 (12.0%) | 5 (2.4%) |
| 65 to 74 Years | 4 (7.7%) | 0 (0.0%) |
| 75 Years and over | 5 (18.5%) | 0 (0.0%) |
Disability Class: Ambulatory Difficulty
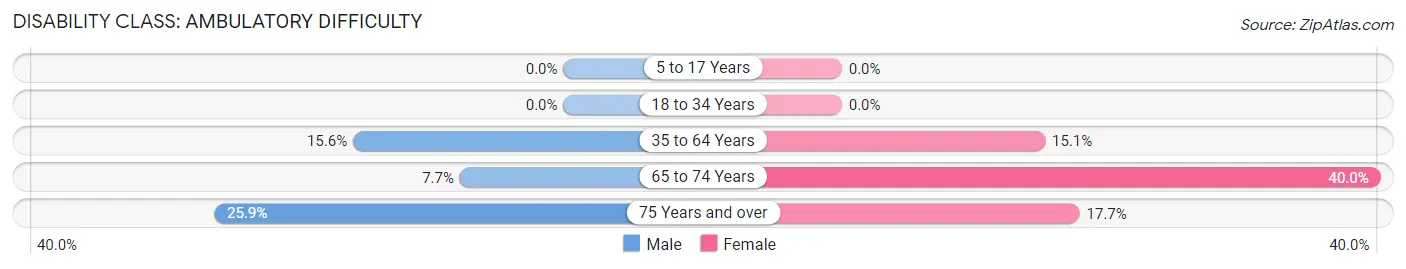
| Age Bracket | Male | Female |
| 5 to 17 Years | 0 (0.0%) | 0 (0.0%) |
| 18 to 34 Years | 0 (0.0%) | 0 (0.0%) |
| 35 to 64 Years | 30 (15.6%) | 32 (15.1%) |
| 65 to 74 Years | 4 (7.7%) | 16 (40.0%) |
| 75 Years and over | 7 (25.9%) | 12 (17.6%) |
Disability Class: Self-Care Difficulty
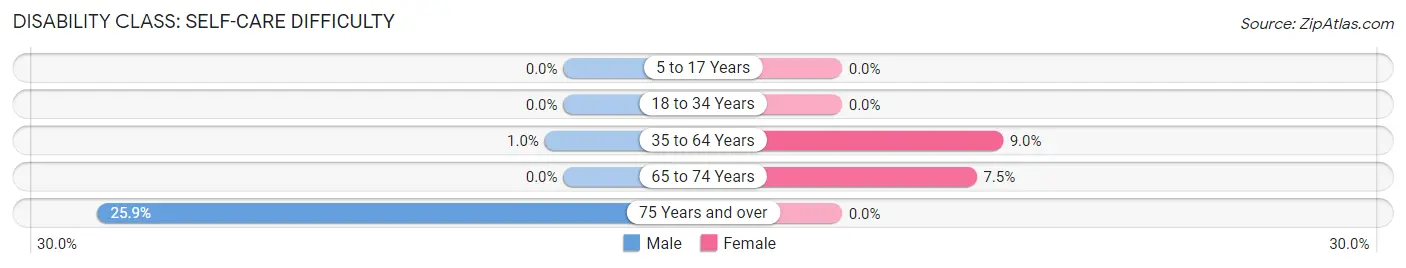
| Age Bracket | Male | Female |
| 5 to 17 Years | 0 (0.0%) | 0 (0.0%) |
| 18 to 34 Years | 0 (0.0%) | 0 (0.0%) |
| 35 to 64 Years | 2 (1.0%) | 19 (9.0%) |
| 65 to 74 Years | 0 (0.0%) | 3 (7.5%) |
| 75 Years and over | 7 (25.9%) | 0 (0.0%) |
Technology Access in Cave Spring
Computing Device Access in Cave Spring
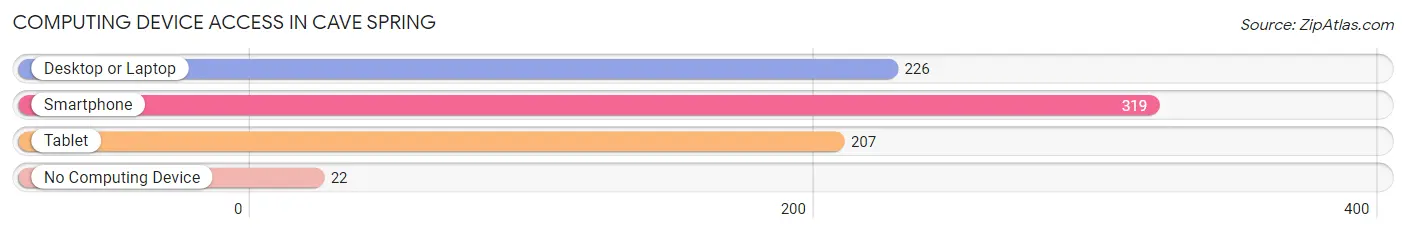
| Device Type | # Households | % Households |
| Desktop or Laptop | 226 | 61.3% |
| Smartphone | 319 | 86.5% |
| Tablet | 207 | 56.1% |
| No Computing Device | 22 | 6.0% |
| Total | 369 | 100.0% |
Internet Access in Cave Spring
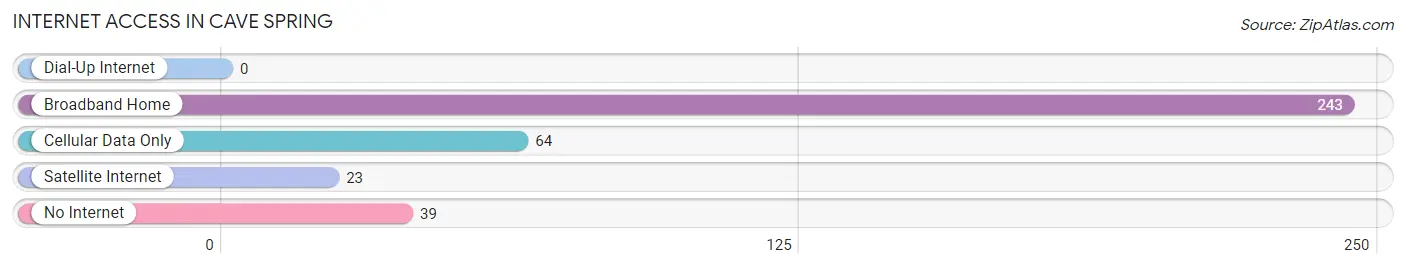
| Internet Type | # Households | % Households |
| Dial-Up Internet | 0 | 0.0% |
| Broadband Home | 243 | 65.8% |
| Cellular Data Only | 64 | 17.3% |
| Satellite Internet | 23 | 6.2% |
| No Internet | 39 | 10.6% |
| Total | 369 | 100.0% |
Cave Spring Summary
Cave Spring is a small city located in the northwestern part of Georgia, United States. It is situated in Floyd County, and is part of the Rome, Georgia Metropolitan Statistical Area. The city has a population of approximately 1,500 people, and is known for its historic downtown area and its natural beauty.
History
Cave Spring was first settled in the early 1800s by settlers from North Carolina. The town was named after a nearby cave, which was used by the Cherokee Indians as a place of worship. The town was officially incorporated in 1834, and the first post office was established in 1837.
In the late 1800s, Cave Spring became a popular tourist destination due to its natural beauty and its proximity to Rome, Georgia. The town was home to several resorts, including the Cave Spring Hotel, which was built in 1887. The hotel was destroyed by fire in the early 1900s, but the town continued to attract visitors due to its natural beauty.
In the early 1900s, Cave Spring became a popular destination for outdoor activities, such as fishing, hunting, and camping. The town was also home to several churches, including the Cave Spring Methodist Church, which was established in 1845.
Geography
Cave Spring is located in northwestern Georgia, in Floyd County. The city is situated at the intersection of US Highway 411 and Georgia State Route 1. The city is located approximately 25 miles northwest of Rome, Georgia, and approximately 75 miles northwest of Atlanta.
The city is situated in a valley, surrounded by hills and mountains. The nearby Cave Spring Cave is a popular tourist attraction, and is the source of the town's name. The cave is located approximately one mile from the city center.
Economy
Cave Spring's economy is largely based on tourism and agriculture. The city is home to several tourist attractions, including the Cave Spring Cave, the Cave Spring Methodist Church, and the historic downtown area. The city is also home to several farms, which produce a variety of crops, including corn, soybeans, and cotton.
Demographics
As of the 2010 census, Cave Spring had a population of 1,500 people. The racial makeup of the city was 94.7% White, 2.7% African American, 0.3% Native American, 0.3% Asian, 0.7% from other races, and 1.3% from two or more races. Hispanic or Latino of any race were 1.7% of the population.
The median household income in Cave Spring was $37,500, and the median family income was $45,000. The per capita income for the city was $19,000. About 11.7% of families and 14.3% of the population were below the poverty line, including 18.2% of those under age 18 and 8.3% of those age 65 or over.
Common Questions
What is Per Capita Income in Cave Spring?
Per Capita income in Cave Spring is $22,613.
What is the Median Family Income in Cave Spring?
Median Family Income in Cave Spring is $53,375.
What is the Median Household income in Cave Spring?
Median Household Income in Cave Spring is $40,250.
What is Income or Wage Gap in Cave Spring?
Income or Wage Gap in Cave Spring is 10.2%.
Women in Cave Spring earn 89.8 cents for every dollar earned by a man.
What is Inequality or Gini Index in Cave Spring?
Inequality or Gini Index in Cave Spring is 0.45.
What is the Total Population of Cave Spring?
Total Population of Cave Spring is 982.
What is the Total Male Population of Cave Spring?
Total Male Population of Cave Spring is 478.
What is the Total Female Population of Cave Spring?
Total Female Population of Cave Spring is 504.
What is the Ratio of Males per 100 Females in Cave Spring?
There are 94.84 Males per 100 Females in Cave Spring.
What is the Ratio of Females per 100 Males in Cave Spring?
There are 105.44 Females per 100 Males in Cave Spring.
What is the Median Population Age in Cave Spring?
Median Population Age in Cave Spring is 49.2 Years.
What is the Average Family Size in Cave Spring
Average Family Size in Cave Spring is 3.1 People.
What is the Average Household Size in Cave Spring
Average Household Size in Cave Spring is 2.5 People.
How Large is the Labor Force in Cave Spring?
There are 419 People in the Labor Forcein in Cave Spring.
What is the Percentage of People in the Labor Force in Cave Spring?
52.0% of People are in the Labor Force in Cave Spring.
What is the Unemployment Rate in Cave Spring?
Unemployment Rate in Cave Spring is 11.0%.