Morgan County, GA Map & Demographics
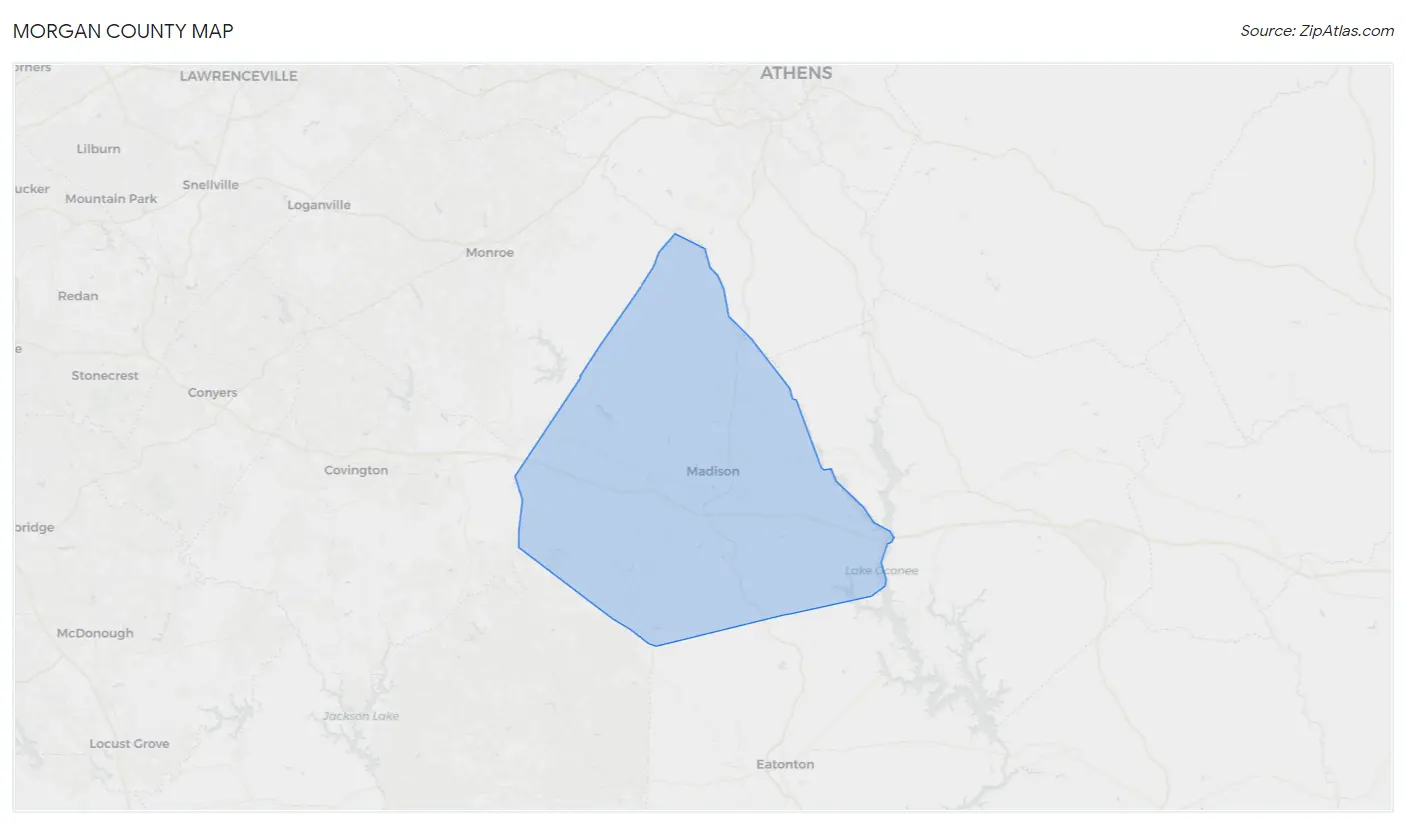
Morgan County Map
Morgan County Overview
$38,932
PER CAPITA INCOME
$93,601
AVG FAMILY INCOME
$81,524
AVG HOUSEHOLD INCOME
38.3%
WAGE / INCOME GAP [ % ]
61.7¢/ $1
WAGE / INCOME GAP [ $ ]
$10,304
FAMILY INCOME DEFICIT
0.42
INEQUALITY / GINI INDEX
20,171
TOTAL POPULATION
9,990
MALE POPULATION
10,181
FEMALE POPULATION
98.12
MALES / 100 FEMALES
101.91
FEMALES / 100 MALES
43.1
MEDIAN AGE
3.1
AVG FAMILY SIZE
2.6
AVG HOUSEHOLD SIZE
10,147
LABOR FORCE [ PEOPLE ]
62.3%
PERCENT IN LABOR FORCE
2.9%
UNEMPLOYMENT RATE
Morgan County Area Codes
Income in Morgan County
Income Overview in Morgan County
Per Capita Income in Morgan County is $38,932, while median incomes of families and households are $93,601 and $81,524 respectively.
| Characteristic | Number | Measure |
| Per Capita Income | 20,171 | $38,932 |
| Median Family Income | 5,613 | $93,601 |
| Mean Family Income | 5,613 | $112,658 |
| Median Household Income | 7,587 | $81,524 |
| Mean Household Income | 7,587 | $100,742 |
| Income Deficit | 5,613 | $10,304 |
| Wage / Income Gap (%) | 20,171 | 38.25% |
| Wage / Income Gap ($) | 20,171 | 61.75¢ per $1 |
| Gini / Inequality Index | 20,171 | 0.42 |
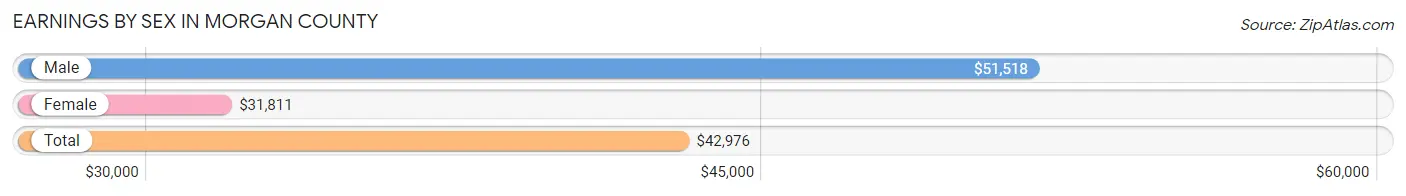
Earnings by Sex in Morgan County
Average Earnings in Morgan County are $42,976, $51,518 for men and $31,811 for women, a difference of 38.3%.
| Sex | Number | Average Earnings |
| Male | 5,607 (53.0%) | $51,518 |
| Female | 4,974 (47.0%) | $31,811 |
| Total | 10,581 (100.0%) | $42,976 |
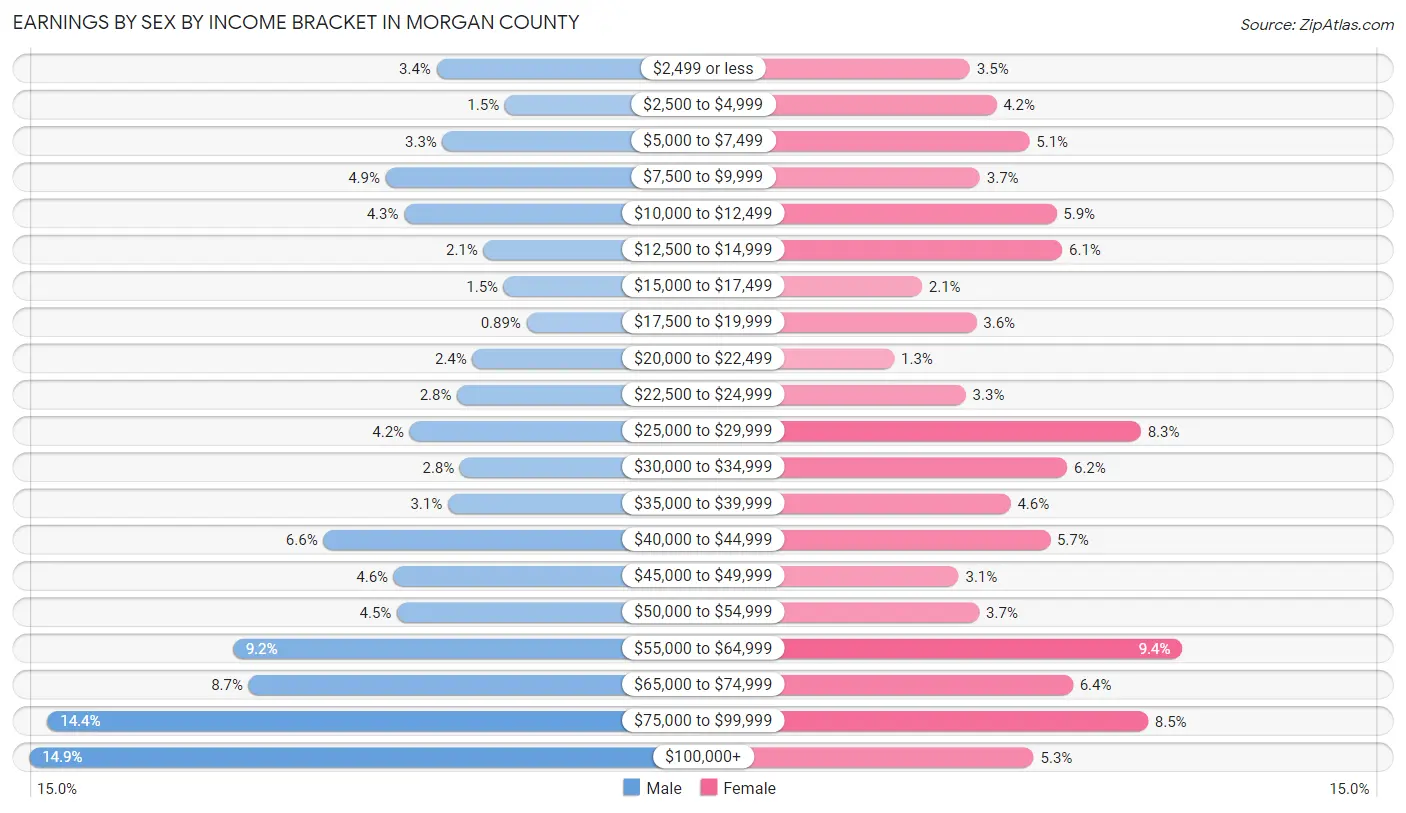
Earnings by Sex by Income Bracket in Morgan County
The most common earnings brackets in Morgan County are $100,000+ for men (834 | 14.9%) and $55,000 to $64,999 for women (469 | 9.4%).
| Income | Male | Female |
| $2,499 or less | 192 (3.4%) | 172 (3.5%) |
| $2,500 to $4,999 | 84 (1.5%) | 209 (4.2%) |
| $5,000 to $7,499 | 182 (3.3%) | 255 (5.1%) |
| $7,500 to $9,999 | 272 (4.9%) | 186 (3.7%) |
| $10,000 to $12,499 | 243 (4.3%) | 293 (5.9%) |
| $12,500 to $14,999 | 118 (2.1%) | 301 (6.0%) |
| $15,000 to $17,499 | 86 (1.5%) | 105 (2.1%) |
| $17,500 to $19,999 | 50 (0.9%) | 181 (3.6%) |
| $20,000 to $22,499 | 135 (2.4%) | 66 (1.3%) |
| $22,500 to $24,999 | 159 (2.8%) | 166 (3.3%) |
| $25,000 to $29,999 | 234 (4.2%) | 411 (8.3%) |
| $30,000 to $34,999 | 155 (2.8%) | 308 (6.2%) |
| $35,000 to $39,999 | 174 (3.1%) | 229 (4.6%) |
| $40,000 to $44,999 | 370 (6.6%) | 284 (5.7%) |
| $45,000 to $49,999 | 259 (4.6%) | 156 (3.1%) |
| $50,000 to $54,999 | 254 (4.5%) | 185 (3.7%) |
| $55,000 to $64,999 | 513 (9.1%) | 469 (9.4%) |
| $65,000 to $74,999 | 488 (8.7%) | 316 (6.4%) |
| $75,000 to $99,999 | 805 (14.4%) | 421 (8.5%) |
| $100,000+ | 834 (14.9%) | 261 (5.2%) |
| Total | 5,607 (100.0%) | 4,974 (100.0%) |
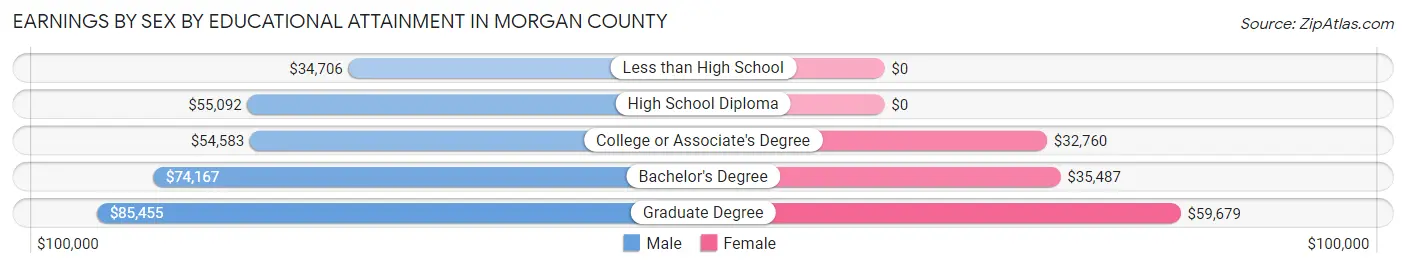
Earnings by Sex by Educational Attainment in Morgan County
Average earnings in Morgan County are $56,919 for men and $35,713 for women, a difference of 37.3%. Men with an educational attainment of graduate degree enjoy the highest average annual earnings of $85,455, while those with less than high school education earn the least with $34,706. Women with an educational attainment of graduate degree earn the most with the average annual earnings of $59,679, while those with college or associate's degree education have the smallest earnings of $32,760.
| Educational Attainment | Male Income | Female Income |
| Less than High School | $34,706 | $0 |
| High School Diploma | $55,092 | $0 |
| College or Associate's Degree | $54,583 | $32,760 |
| Bachelor's Degree | $74,167 | $35,487 |
| Graduate Degree | $85,455 | $59,679 |
| Total | $56,919 | $35,713 |
Family Income in Morgan County
Family Income Brackets in Morgan County
According to the Morgan County family income data, there are 1,207 families falling into the $100,000 to $149,999 income range, which is the most common income bracket and makes up 21.5% of all families. Conversely, the less than $10,000 income bracket is the least frequent group with only 62 families (1.1%) belonging to this category.
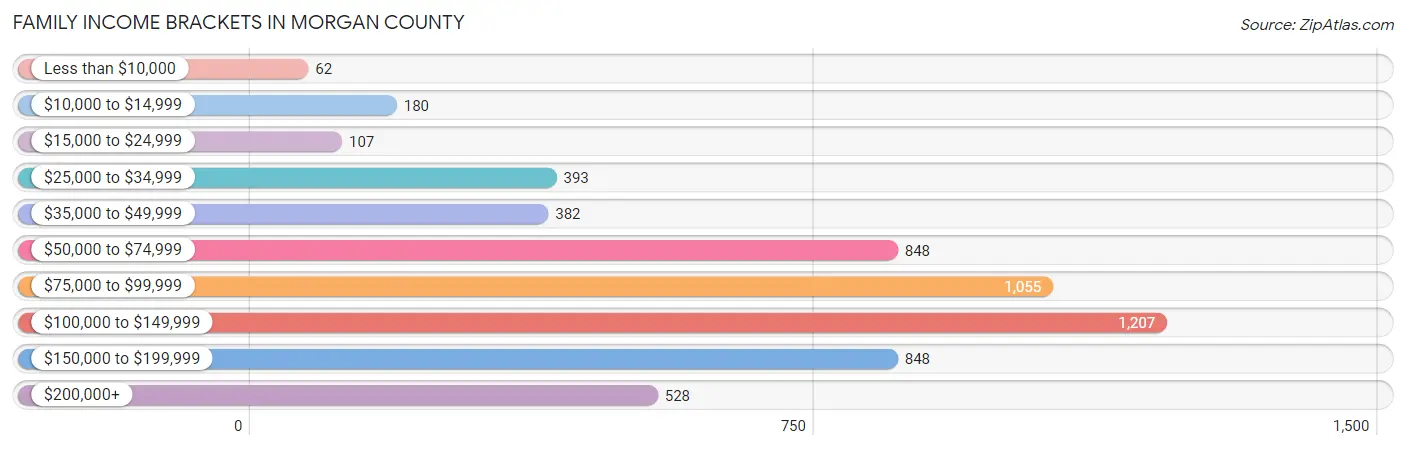
| Income Bracket | # Families | % Families |
| Less than $10,000 | 62 | 1.1% |
| $10,000 to $14,999 | 180 | 3.2% |
| $15,000 to $24,999 | 107 | 1.9% |
| $25,000 to $34,999 | 393 | 7.0% |
| $35,000 to $49,999 | 382 | 6.8% |
| $50,000 to $74,999 | 848 | 15.1% |
| $75,000 to $99,999 | 1,055 | 18.8% |
| $100,000 to $149,999 | 1,207 | 21.5% |
| $150,000 to $199,999 | 848 | 15.1% |
| $200,000+ | 528 | 9.4% |
Family Income by Famaliy Size in Morgan County
4-person families (983 | 17.5%) account for the highest median family income in Morgan County with $134,766 per family, while 2-person families (2,935 | 52.3%) have the highest median income of $40,335 per family member.
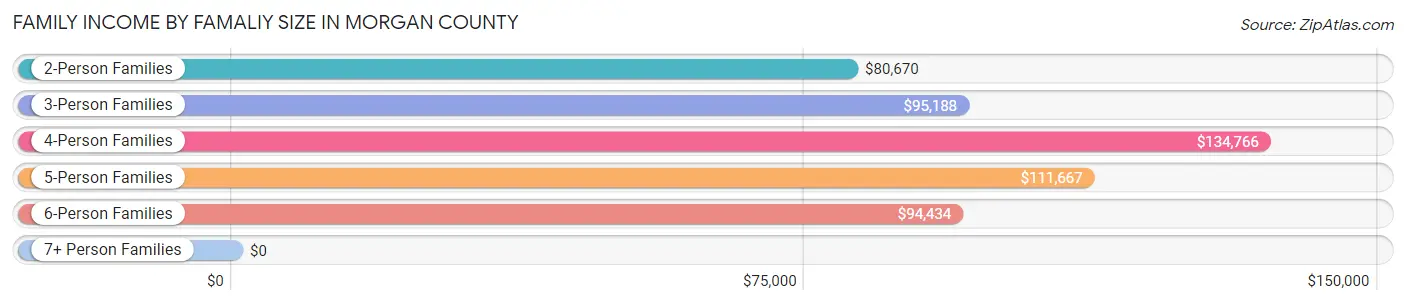
| Income Bracket | # Families | Median Income |
| 2-Person Families | 2,935 (52.3%) | $80,670 |
| 3-Person Families | 841 (15.0%) | $95,188 |
| 4-Person Families | 983 (17.5%) | $134,766 |
| 5-Person Families | 468 (8.3%) | $111,667 |
| 6-Person Families | 373 (6.7%) | $94,434 |
| 7+ Person Families | 13 (0.2%) | $0 |
| Total | 5,613 (100.0%) | $93,601 |
Family Income by Number of Earners in Morgan County
The median family income in Morgan County is $93,601, with families comprising 3+ earners (496) having the highest median family income of $143,148, while families with no earners (906) have the lowest median family income of $45,905, accounting for 8.8% and 16.1% of families, respectively.
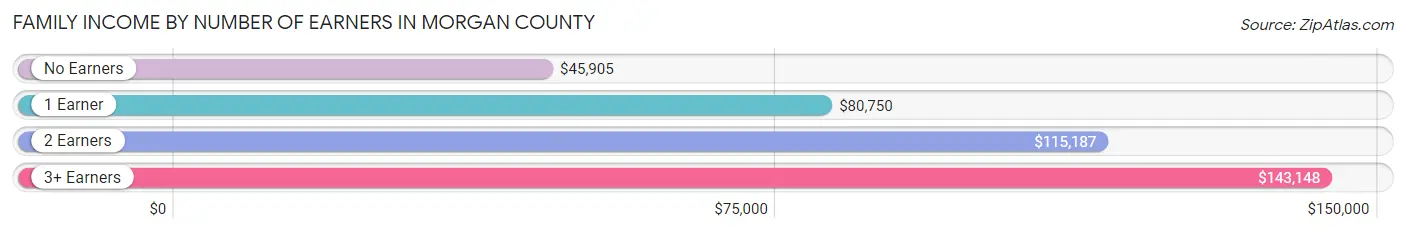
| Number of Earners | # Families | Median Income |
| No Earners | 906 (16.1%) | $45,905 |
| 1 Earner | 1,619 (28.8%) | $80,750 |
| 2 Earners | 2,592 (46.2%) | $115,187 |
| 3+ Earners | 496 (8.8%) | $143,148 |
| Total | 5,613 (100.0%) | $93,601 |
Household Income in Morgan County
Household Income Brackets in Morgan County
With 1,388 households falling in the category, the $100,000 to $149,999 income range is the most frequent in Morgan County, accounting for 18.3% of all households. In contrast, only 228 households (3.0%) fall into the less than $10,000 income bracket, making it the least populous group.
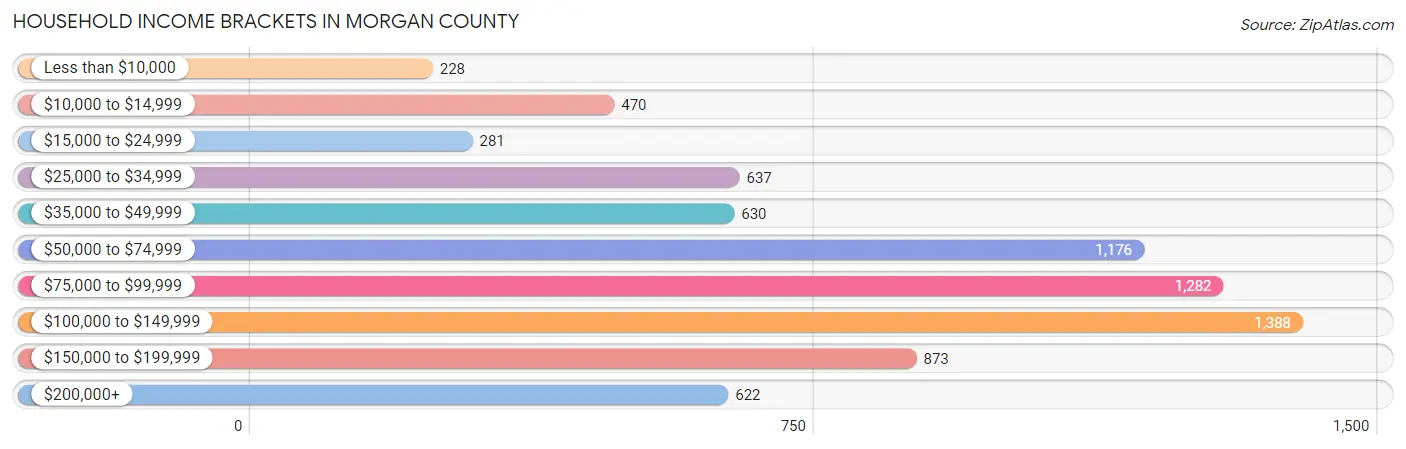
| Income Bracket | # Households | % Households |
| Less than $10,000 | 228 | 3.0% |
| $10,000 to $14,999 | 470 | 6.2% |
| $15,000 to $24,999 | 281 | 3.7% |
| $25,000 to $34,999 | 637 | 8.4% |
| $35,000 to $49,999 | 630 | 8.3% |
| $50,000 to $74,999 | 1,176 | 15.5% |
| $75,000 to $99,999 | 1,282 | 16.9% |
| $100,000 to $149,999 | 1,388 | 18.3% |
| $150,000 to $199,999 | 873 | 11.5% |
| $200,000+ | 622 | 8.2% |
Household Income by Householder Age in Morgan County
The median household income in Morgan County is $81,524, with the highest median household income of $94,520 found in the 25 to 44 years age bracket for the primary householder. A total of 2,151 households (28.3%) fall into this category. Meanwhile, the 65+ years age bracket for the primary householder has the lowest median household income of $58,975, with 2,454 households (32.3%) in this group.
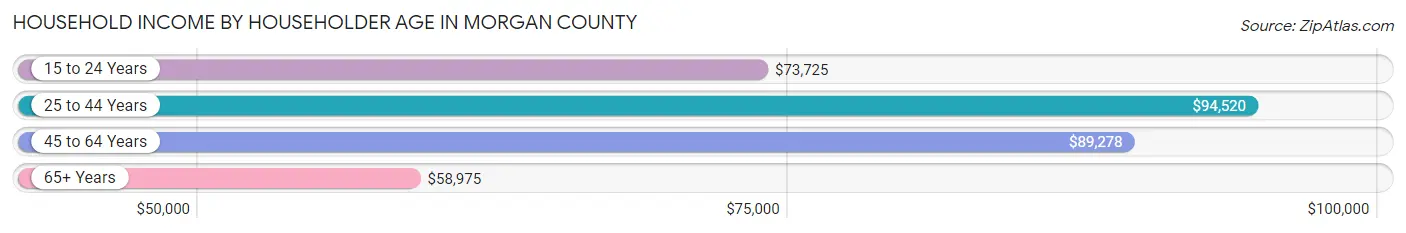
| Income Bracket | # Households | Median Income |
| 15 to 24 Years | 119 (1.6%) | $73,725 |
| 25 to 44 Years | 2,151 (28.3%) | $94,520 |
| 45 to 64 Years | 2,863 (37.7%) | $89,278 |
| 65+ Years | 2,454 (32.3%) | $58,975 |
| Total | 7,587 (100.0%) | $81,524 |
Poverty in Morgan County
Income Below Poverty by Sex and Age in Morgan County
With 6.5% poverty level for males and 10.6% for females among the residents of Morgan County, 15 year old males and 6 to 11 year old females are the most vulnerable to poverty, with 34 males (25.8%) and 191 females (30.7%) in their respective age groups living below the poverty level.
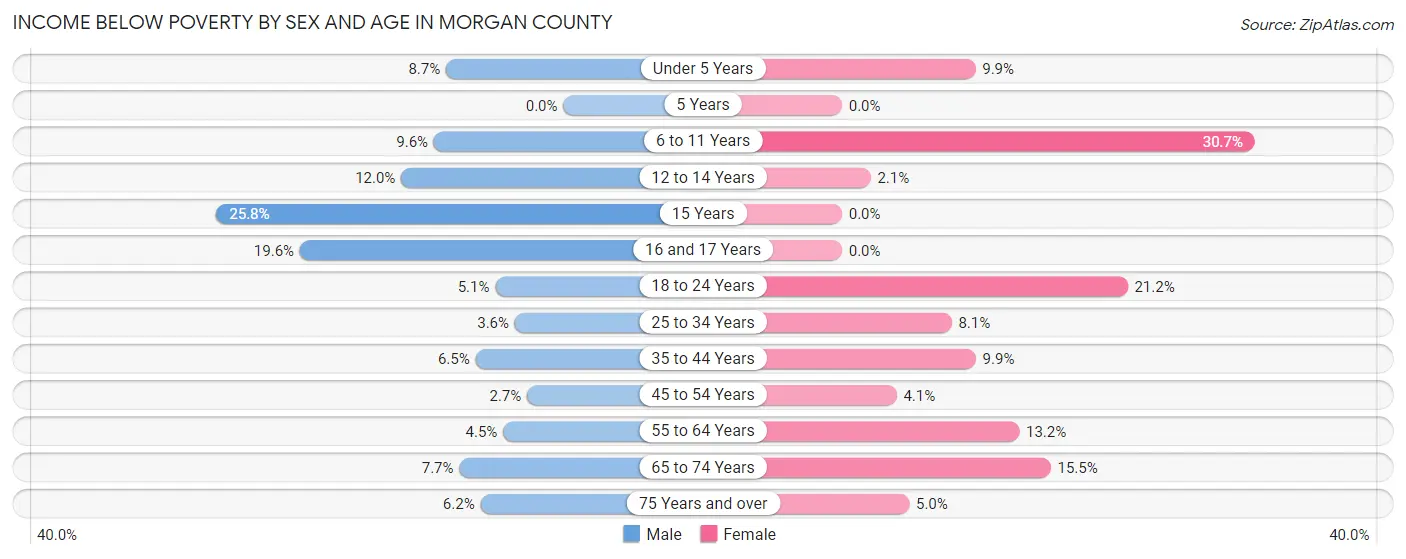
| Age Bracket | Male | Female |
| Under 5 Years | 46 (8.7%) | 44 (9.9%) |
| 5 Years | 0 (0.0%) | 0 (0.0%) |
| 6 to 11 Years | 72 (9.6%) | 191 (30.7%) |
| 12 to 14 Years | 75 (12.0%) | 7 (2.1%) |
| 15 Years | 34 (25.8%) | 0 (0.0%) |
| 16 and 17 Years | 44 (19.6%) | 0 (0.0%) |
| 18 to 24 Years | 35 (5.1%) | 119 (21.2%) |
| 25 to 34 Years | 37 (3.6%) | 103 (8.1%) |
| 35 to 44 Years | 71 (6.5%) | 124 (9.9%) |
| 45 to 54 Years | 40 (2.7%) | 51 (4.1%) |
| 55 to 64 Years | 62 (4.5%) | 193 (13.2%) |
| 65 to 74 Years | 84 (7.7%) | 193 (15.5%) |
| 75 Years and over | 42 (6.1%) | 48 (5.0%) |
| Total | 642 (6.5%) | 1,073 (10.6%) |
Income Above Poverty by Sex and Age in Morgan County
According to the poverty statistics in Morgan County, males aged 5 years and females aged 5 years are the age groups that are most secure financially, with 100.0% of males and 100.0% of females in these age groups living above the poverty line.
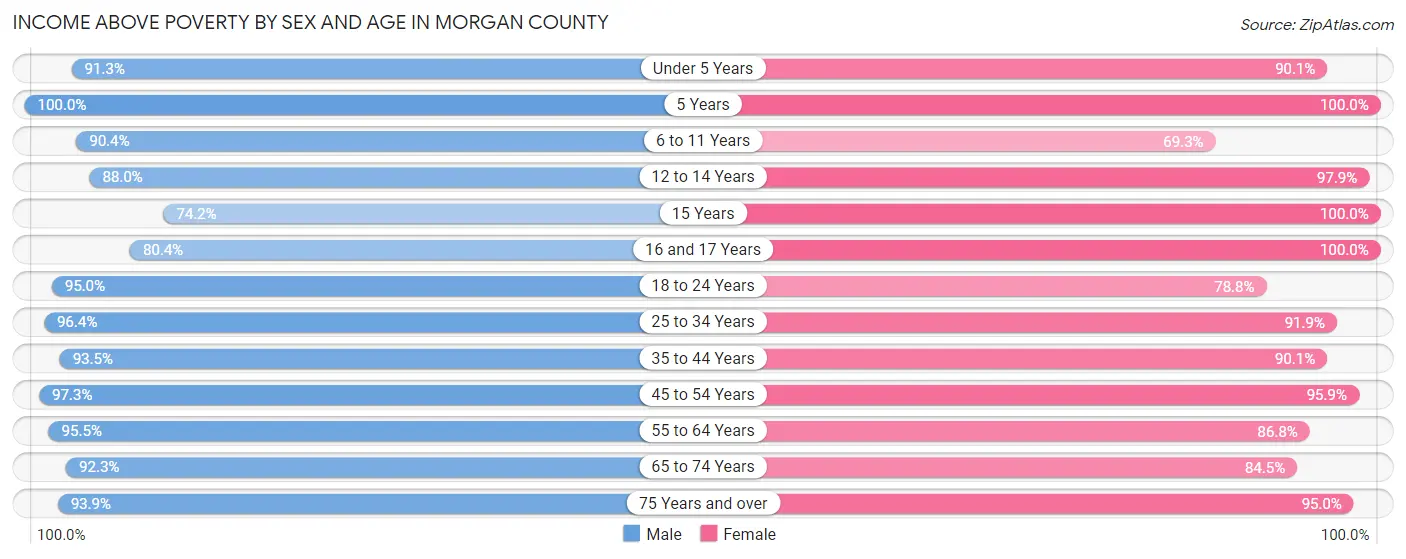
| Age Bracket | Male | Female |
| Under 5 Years | 482 (91.3%) | 400 (90.1%) |
| 5 Years | 118 (100.0%) | 198 (100.0%) |
| 6 to 11 Years | 677 (90.4%) | 432 (69.3%) |
| 12 to 14 Years | 548 (88.0%) | 322 (97.9%) |
| 15 Years | 98 (74.2%) | 85 (100.0%) |
| 16 and 17 Years | 181 (80.4%) | 426 (100.0%) |
| 18 to 24 Years | 658 (95.0%) | 442 (78.8%) |
| 25 to 34 Years | 991 (96.4%) | 1,163 (91.9%) |
| 35 to 44 Years | 1,018 (93.5%) | 1,123 (90.1%) |
| 45 to 54 Years | 1,447 (97.3%) | 1,204 (95.9%) |
| 55 to 64 Years | 1,325 (95.5%) | 1,274 (86.8%) |
| 65 to 74 Years | 1,004 (92.3%) | 1,052 (84.5%) |
| 75 Years and over | 641 (93.9%) | 914 (95.0%) |
| Total | 9,188 (93.5%) | 9,035 (89.4%) |
Income Below Poverty Among Married-Couple Families in Morgan County
The poverty statistics for married-couple families in Morgan County show that 2.5% or 110 of the total 4,429 families live below the poverty line. Families with 1 or 2 children have the highest poverty rate of 3.1%, comprising of 43 families. On the other hand, families with 3 or 4 children have the lowest poverty rate of 0.7%, which includes 3 families.
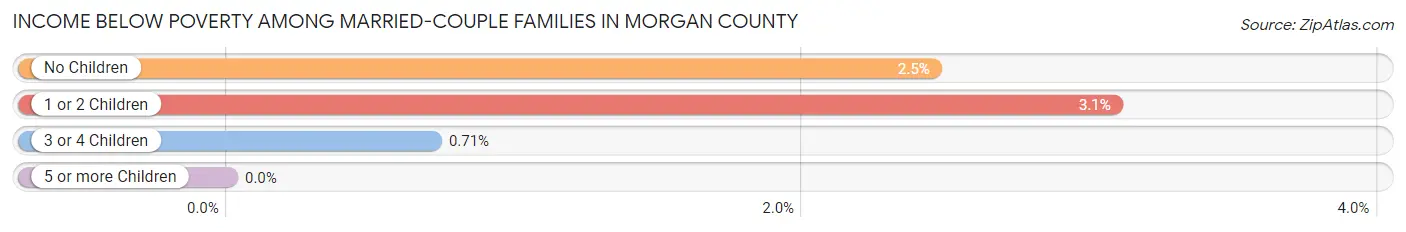
| Children | Above Poverty | Below Poverty |
| No Children | 2,547 (97.6%) | 64 (2.5%) |
| 1 or 2 Children | 1,351 (96.9%) | 43 (3.1%) |
| 3 or 4 Children | 421 (99.3%) | 3 (0.7%) |
| 5 or more Children | 0 (0.0%) | 0 (0.0%) |
| Total | 4,319 (97.5%) | 110 (2.5%) |
Income Below Poverty Among Single-Parent Households in Morgan County
According to the poverty data in Morgan County, 18.2% or 36 single-father households and 18.5% or 182 single-mother households are living below the poverty line. Among single-father households, those with 3 or 4 children have the highest poverty rate, with 30 households (100.0%) experiencing poverty. Likewise, among single-mother households, those with 3 or 4 children have the highest poverty rate, with 64 households (100.0%) falling below the poverty line.
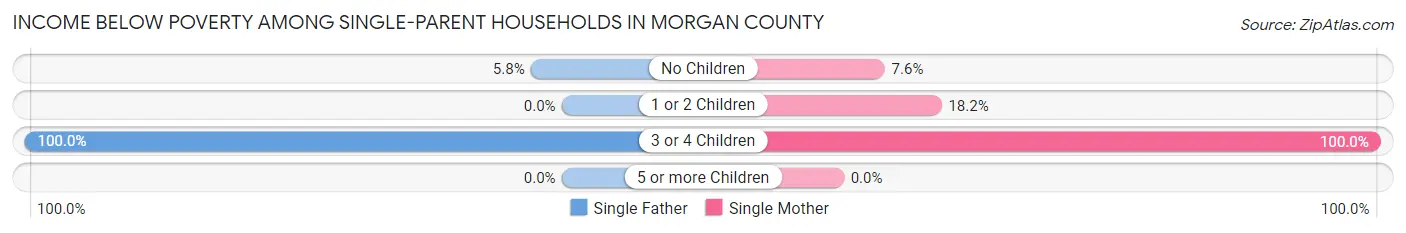
| Children | Single Father | Single Mother |
| No Children | 6 (5.8%) | 36 (7.6%) |
| 1 or 2 Children | 0 (0.0%) | 82 (18.2%) |
| 3 or 4 Children | 30 (100.0%) | 64 (100.0%) |
| 5 or more Children | 0 (0.0%) | 0 (0.0%) |
| Total | 36 (18.2%) | 182 (18.5%) |
Income Below Poverty Among Married-Couple vs Single-Parent Households in Morgan County
The poverty data for Morgan County shows that 110 of the married-couple family households (2.5%) and 218 of the single-parent households (18.4%) are living below the poverty level. Within the married-couple family households, those with 1 or 2 children have the highest poverty rate, with 43 households (3.1%) falling below the poverty line. Among the single-parent households, those with 3 or 4 children have the highest poverty rate, with 94 household (100.0%) living below poverty.
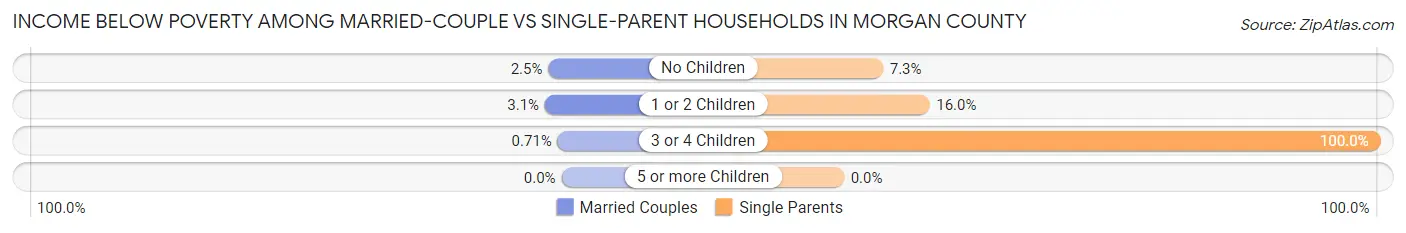
| Children | Married-Couple Families | Single-Parent Households |
| No Children | 64 (2.5%) | 42 (7.3%) |
| 1 or 2 Children | 43 (3.1%) | 82 (16.0%) |
| 3 or 4 Children | 3 (0.7%) | 94 (100.0%) |
| 5 or more Children | 0 (0.0%) | 0 (0.0%) |
| Total | 110 (2.5%) | 218 (18.4%) |
Race in Morgan County
The most populous races in Morgan County are White / Caucasian (14,703 | 72.9%), Black / African American (4,471 | 22.2%), and Two or more Races (793 | 3.9%).
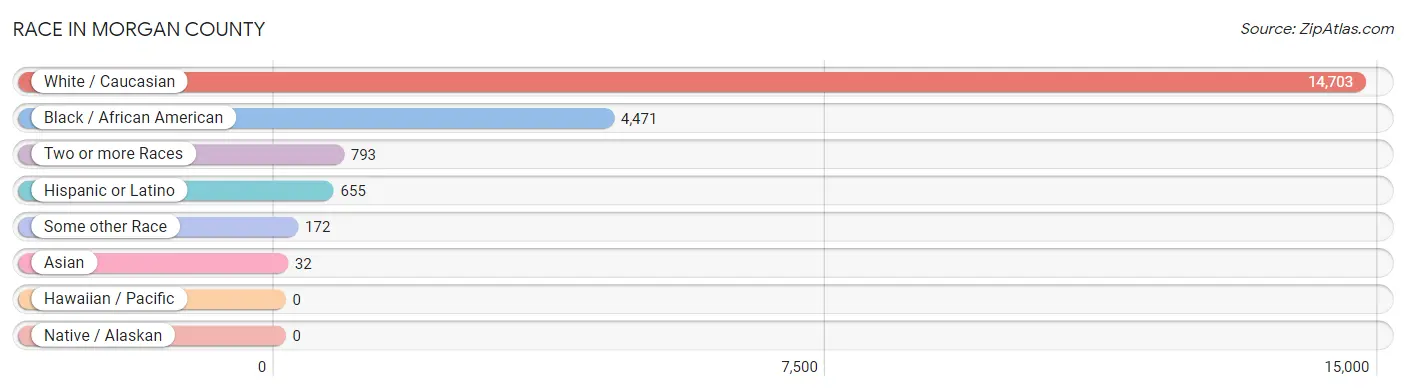
| Race | # Population | % Population |
| Asian | 32 | 0.2% |
| Black / African American | 4,471 | 22.2% |
| Hawaiian / Pacific | 0 | 0.0% |
| Hispanic or Latino | 655 | 3.3% |
| Native / Alaskan | 0 | 0.0% |
| White / Caucasian | 14,703 | 72.9% |
| Two or more Races | 793 | 3.9% |
| Some other Race | 172 | 0.9% |
| Total | 20,171 | 100.0% |
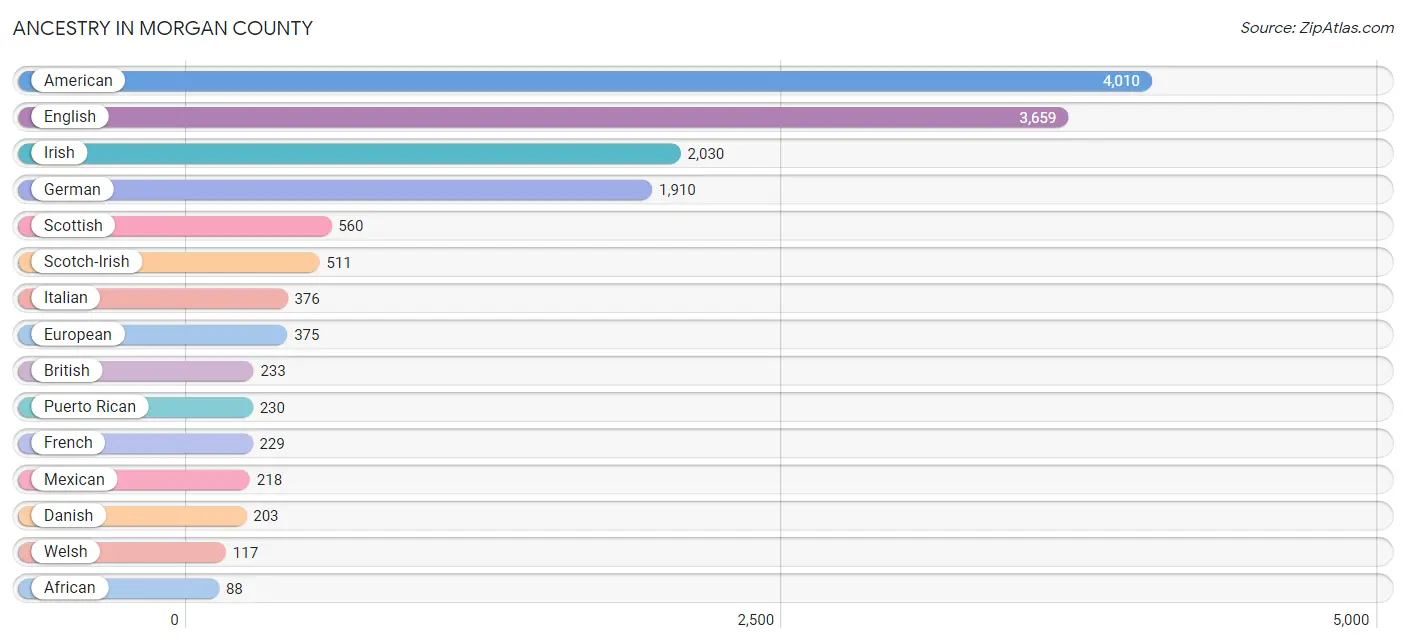
Ancestry in Morgan County
The most populous ancestries reported in Morgan County are American (4,010 | 19.9%), English (3,659 | 18.1%), Irish (2,030 | 10.1%), German (1,910 | 9.5%), and Scottish (560 | 2.8%), together accounting for 60.3% of all Morgan County residents.
| Ancestry | # Population | % Population |
| African | 88 | 0.4% |
| American | 4,010 | 19.9% |
| Apache | 8 | 0.0% |
| Australian | 7 | 0.0% |
| Austrian | 22 | 0.1% |
| Bahamian | 19 | 0.1% |
| Basque | 11 | 0.1% |
| Bhutanese | 15 | 0.1% |
| British | 233 | 1.2% |
| Burmese | 67 | 0.3% |
| Cherokee | 38 | 0.2% |
| Colombian | 85 | 0.4% |
| Creek | 39 | 0.2% |
| Croatian | 8 | 0.0% |
| Cuban | 48 | 0.2% |
| Czech | 11 | 0.1% |
| Danish | 203 | 1.0% |
| Dutch | 33 | 0.2% |
| English | 3,659 | 18.1% |
| European | 375 | 1.9% |
| French | 229 | 1.1% |
| French Canadian | 25 | 0.1% |
| German | 1,910 | 9.5% |
| Greek | 22 | 0.1% |
| Hungarian | 6 | 0.0% |
| Indian (Asian) | 3 | 0.0% |
| Irish | 2,030 | 10.1% |
| Italian | 376 | 1.9% |
| Korean | 81 | 0.4% |
| Lithuanian | 12 | 0.1% |
| Luxembourger | 10 | 0.1% |
| Mexican | 218 | 1.1% |
| Norwegian | 50 | 0.3% |
| Polish | 65 | 0.3% |
| Portuguese | 18 | 0.1% |
| Puerto Rican | 230 | 1.1% |
| Russian | 20 | 0.1% |
| Scandinavian | 20 | 0.1% |
| Scotch-Irish | 511 | 2.5% |
| Scottish | 560 | 2.8% |
| Slovak | 13 | 0.1% |
| South American | 85 | 0.4% |
| Spanish | 74 | 0.4% |
| Sri Lankan | 2 | 0.0% |
| Subsaharan African | 88 | 0.4% |
| Swedish | 16 | 0.1% |
| Swiss | 5 | 0.0% |
| Thai | 24 | 0.1% |
| Ukrainian | 9 | 0.0% |
| Welsh | 117 | 0.6% | View All 50 Rows |
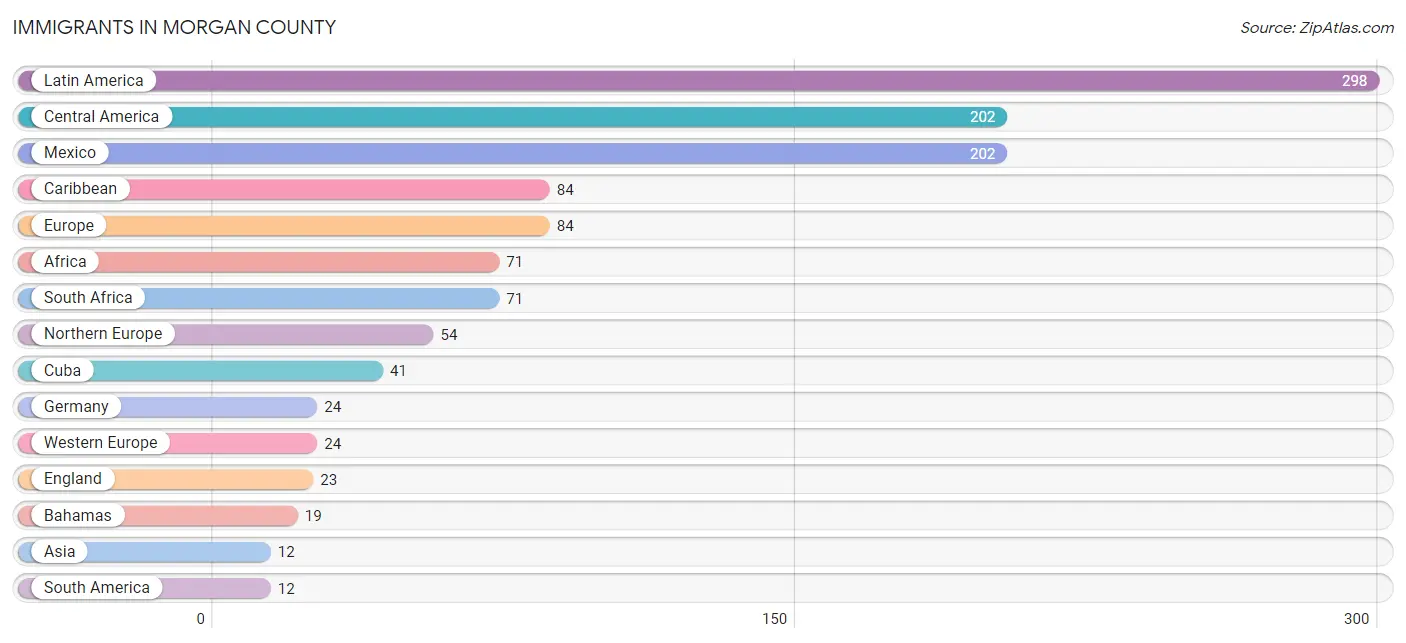
Immigrants in Morgan County
The most numerous immigrant groups reported in Morgan County came from Latin America (298 | 1.5%), Central America (202 | 1.0%), Mexico (202 | 1.0%), Caribbean (84 | 0.4%), and Europe (84 | 0.4%), together accounting for 4.3% of all Morgan County residents.
| Immigration Origin | # Population | % Population |
| Africa | 71 | 0.4% |
| Asia | 12 | 0.1% |
| Australia | 7 | 0.0% |
| Bahamas | 19 | 0.1% |
| Bangladesh | 10 | 0.1% |
| Caribbean | 84 | 0.4% |
| Central America | 202 | 1.0% |
| Cuba | 41 | 0.2% |
| Eastern Europe | 6 | 0.0% |
| England | 23 | 0.1% |
| Europe | 84 | 0.4% |
| Germany | 24 | 0.1% |
| Hungary | 6 | 0.0% |
| Ireland | 8 | 0.0% |
| Latin America | 298 | 1.5% |
| Mexico | 202 | 1.0% |
| Northern Europe | 54 | 0.3% |
| Oceania | 7 | 0.0% |
| Scotland | 11 | 0.1% |
| South Africa | 71 | 0.4% |
| South America | 12 | 0.1% |
| South Central Asia | 10 | 0.1% |
| South Eastern Asia | 2 | 0.0% |
| Vietnam | 2 | 0.0% |
| Western Europe | 24 | 0.1% | View All 25 Rows |
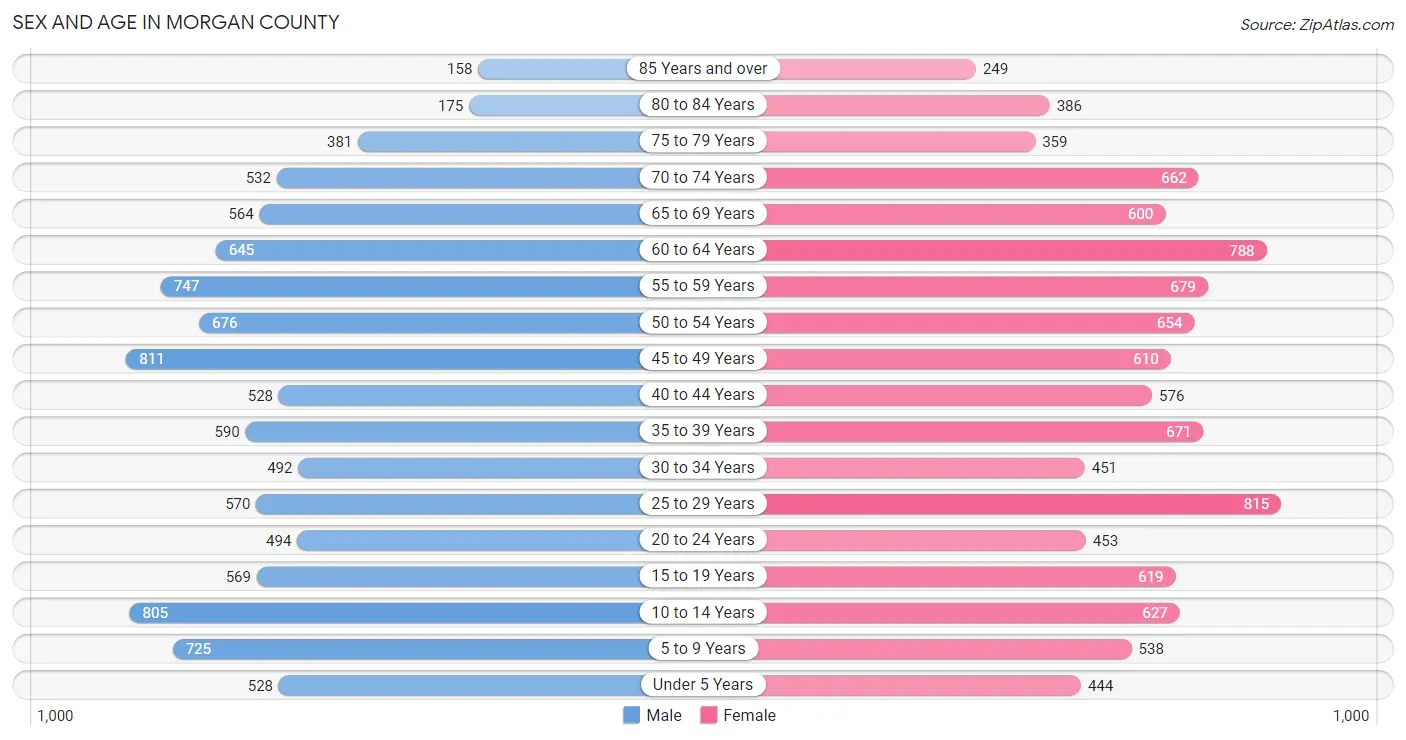
Sex and Age in Morgan County
Sex and Age in Morgan County
The most populous age groups in Morgan County are 45 to 49 Years (811 | 8.1%) for men and 25 to 29 Years (815 | 8.0%) for women.
| Age Bracket | Male | Female |
| Under 5 Years | 528 (5.3%) | 444 (4.4%) |
| 5 to 9 Years | 725 (7.3%) | 538 (5.3%) |
| 10 to 14 Years | 805 (8.1%) | 627 (6.2%) |
| 15 to 19 Years | 569 (5.7%) | 619 (6.1%) |
| 20 to 24 Years | 494 (4.9%) | 453 (4.4%) |
| 25 to 29 Years | 570 (5.7%) | 815 (8.0%) |
| 30 to 34 Years | 492 (4.9%) | 451 (4.4%) |
| 35 to 39 Years | 590 (5.9%) | 671 (6.6%) |
| 40 to 44 Years | 528 (5.3%) | 576 (5.7%) |
| 45 to 49 Years | 811 (8.1%) | 610 (6.0%) |
| 50 to 54 Years | 676 (6.8%) | 654 (6.4%) |
| 55 to 59 Years | 747 (7.5%) | 679 (6.7%) |
| 60 to 64 Years | 645 (6.5%) | 788 (7.7%) |
| 65 to 69 Years | 564 (5.7%) | 600 (5.9%) |
| 70 to 74 Years | 532 (5.3%) | 662 (6.5%) |
| 75 to 79 Years | 381 (3.8%) | 359 (3.5%) |
| 80 to 84 Years | 175 (1.8%) | 386 (3.8%) |
| 85 Years and over | 158 (1.6%) | 249 (2.5%) |
| Total | 9,990 (100.0%) | 10,181 (100.0%) |
Families and Households in Morgan County
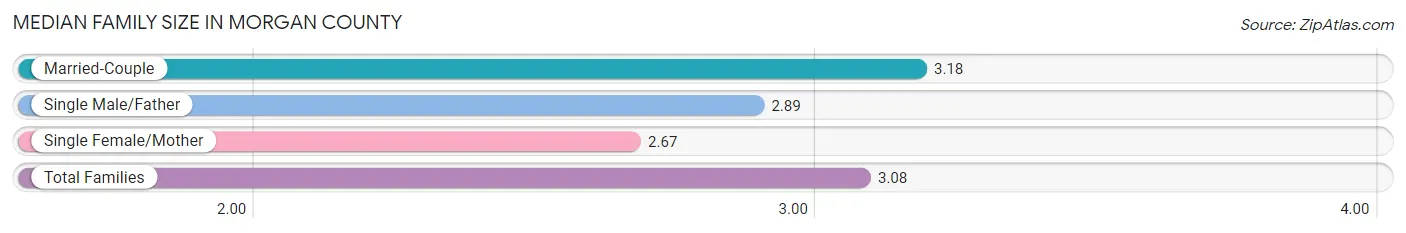
Median Family Size in Morgan County
The median family size in Morgan County is 3.08 persons per family, with married-couple families (4,429 | 78.9%) accounting for the largest median family size of 3.18 persons per family. On the other hand, single female/mother families (986 | 17.6%) represent the smallest median family size with 2.67 persons per family.
| Family Type | # Families | Family Size |
| Married-Couple | 4,429 (78.9%) | 3.18 |
| Single Male/Father | 198 (3.5%) | 2.89 |
| Single Female/Mother | 986 (17.6%) | 2.67 |
| Total Families | 5,613 (100.0%) | 3.08 |
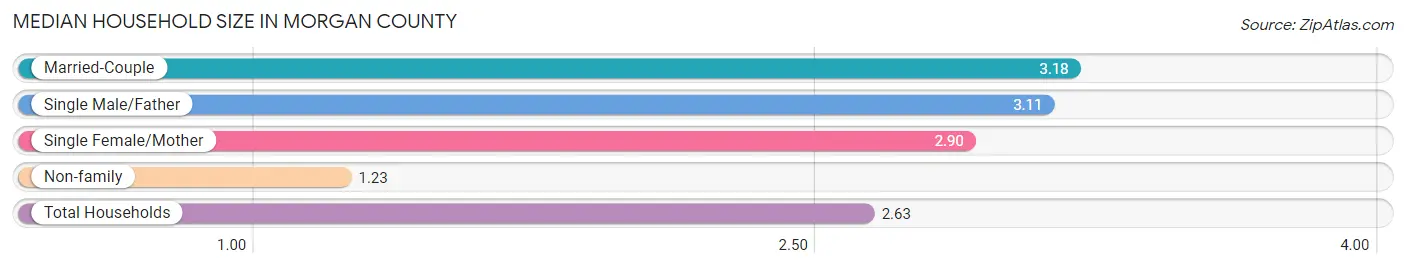
Median Household Size in Morgan County
The median household size in Morgan County is 2.63 persons per household, with married-couple households (4,429 | 58.4%) accounting for the largest median household size of 3.18 persons per household. non-family households (1,974 | 26.0%) represent the smallest median household size with 1.23 persons per household.
| Household Type | # Households | Household Size |
| Married-Couple | 4,429 (58.4%) | 3.18 |
| Single Male/Father | 198 (2.6%) | 3.11 |
| Single Female/Mother | 986 (13.0%) | 2.90 |
| Non-family | 1,974 (26.0%) | 1.23 |
| Total Households | 7,587 (100.0%) | 2.63 |
Household Size by Marriage Status in Morgan County
Out of a total of 7,587 households in Morgan County, 5,613 (74.0%) are family households, while 1,974 (26.0%) are nonfamily households. The most numerous type of family households are 2-person households, comprising 2,874, and the most common type of nonfamily households are 1-person households, comprising 1,627.
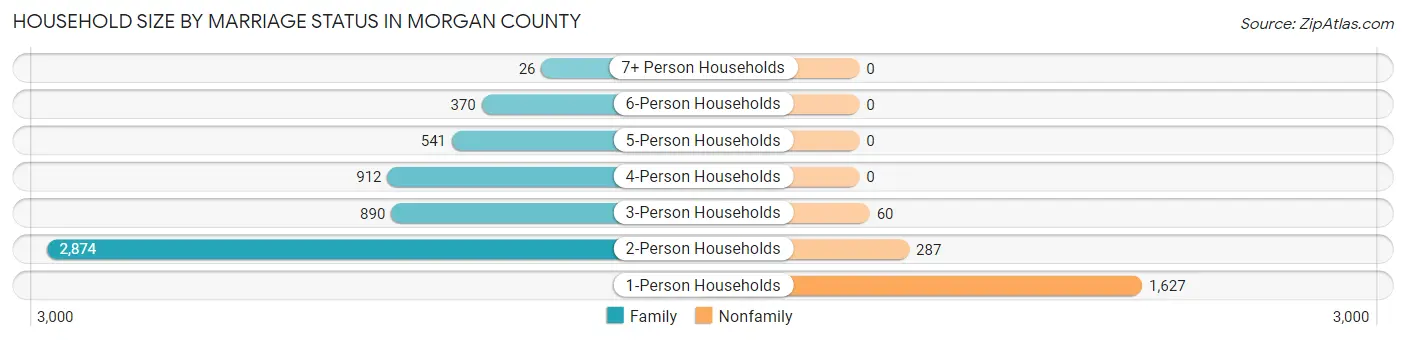
| Household Size | Family Households | Nonfamily Households |
| 1-Person Households | - | 1,627 (21.4%) |
| 2-Person Households | 2,874 (37.9%) | 287 (3.8%) |
| 3-Person Households | 890 (11.7%) | 60 (0.8%) |
| 4-Person Households | 912 (12.0%) | 0 (0.0%) |
| 5-Person Households | 541 (7.1%) | 0 (0.0%) |
| 6-Person Households | 370 (4.9%) | 0 (0.0%) |
| 7+ Person Households | 26 (0.3%) | 0 (0.0%) |
| Total | 5,613 (74.0%) | 1,974 (26.0%) |
Female Fertility in Morgan County
Fertility by Age in Morgan County
Average fertility rate in Morgan County is 91.0 births per 1,000 women. Women in the age bracket of 20 to 34 years have the highest fertility rate with 180.0 births per 1,000 women. Women in the age bracket of 20 to 34 years acount for 78.3% of all women with births.
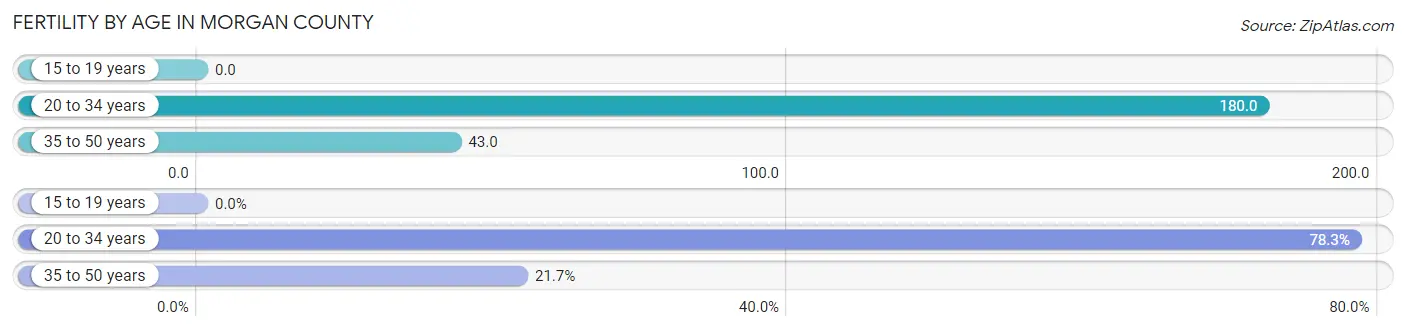
| Age Bracket | Women with Births | Births / 1,000 Women |
| 15 to 19 years | 0 (0.0%) | 0.0 |
| 20 to 34 years | 310 (78.3%) | 180.0 |
| 35 to 50 years | 86 (21.7%) | 43.0 |
| Total | 396 (100.0%) | 91.0 |
Fertility by Age by Marriage Status in Morgan County
92.4% of women with births (396) in Morgan County are married. The highest percentage of unmarried women with births falls into 35 to 50 years age bracket with 23.3% of them unmarried at the time of birth, while the lowest percentage of unmarried women with births belong to 20 to 34 years age bracket with 3.2% of them unmarried.
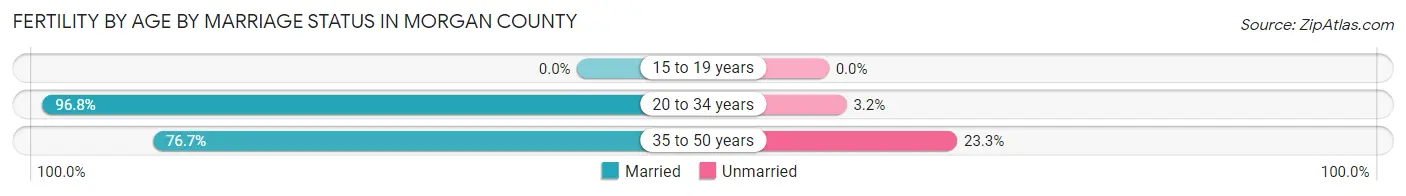
| Age Bracket | Married | Unmarried |
| 15 to 19 years | 0 (0.0%) | 0 (0.0%) |
| 20 to 34 years | 300 (96.8%) | 10 (3.2%) |
| 35 to 50 years | 66 (76.7%) | 20 (23.3%) |
| Total | 366 (92.4%) | 30 (7.6%) |
Fertility by Education in Morgan County
Average fertility rate in Morgan County is 91.0 births per 1,000 women. Women with the education attainment of high school diploma have the highest fertility rate of 236.0 births per 1,000 women, while women with the education attainment of less than high school have the lowest fertility at 11.0 births per 1,000 women. Women with the education attainment of high school diploma represent 55.8% of all women with births.
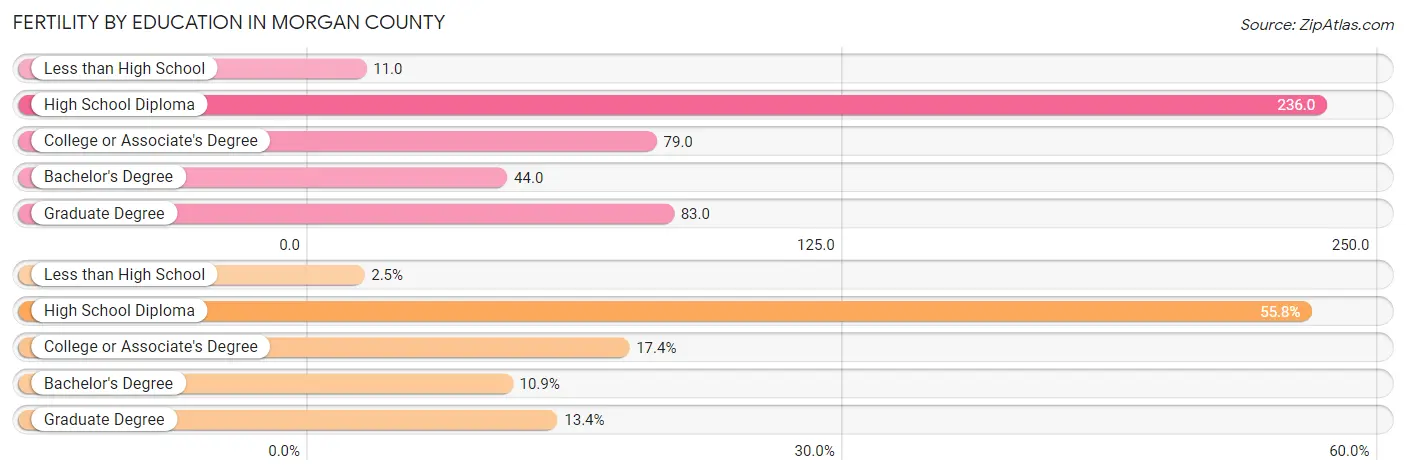
| Educational Attainment | Women with Births | Births / 1,000 Women |
| Less than High School | 10 (2.5%) | 11.0 |
| High School Diploma | 221 (55.8%) | 236.0 |
| College or Associate's Degree | 69 (17.4%) | 79.0 |
| Bachelor's Degree | 43 (10.9%) | 44.0 |
| Graduate Degree | 53 (13.4%) | 83.0 |
| Total | 396 (100.0%) | 91.0 |
Fertility by Education by Marriage Status in Morgan County
7.6% of women with births in Morgan County are unmarried. Women with the educational attainment of high school diploma are most likely to be married with 100.0% of them married at childbirth, while women with the educational attainment of less than high school are least likely to be married with 100.0% of them unmarried at childbirth.
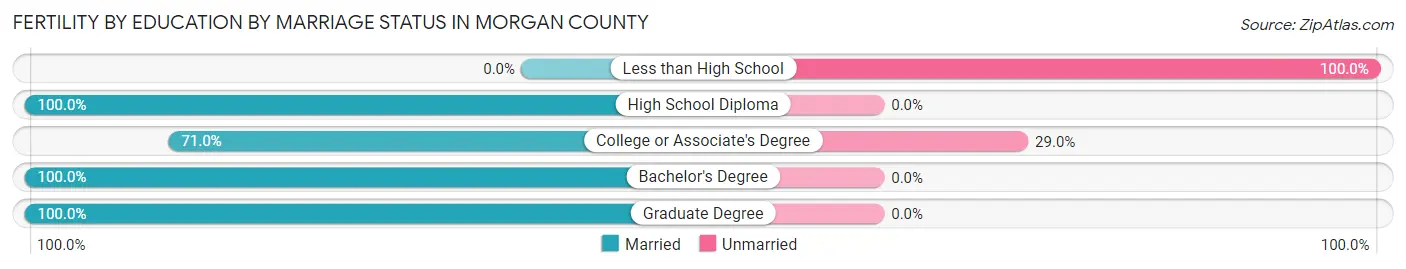
| Educational Attainment | Married | Unmarried |
| Less than High School | 0 (0.0%) | 10 (100.0%) |
| High School Diploma | 221 (100.0%) | 0 (0.0%) |
| College or Associate's Degree | 49 (71.0%) | 20 (29.0%) |
| Bachelor's Degree | 43 (100.0%) | 0 (0.0%) |
| Graduate Degree | 53 (100.0%) | 0 (0.0%) |
| Total | 366 (92.4%) | 30 (7.6%) |
Employment Characteristics in Morgan County
Employment by Class of Employer in Morgan County
Among the 9,658 employed individuals in Morgan County, private company employees (5,906 | 61.2%), local government employees (1,190 | 12.3%), and self-employed (not incorporated) (798 | 8.3%) make up the most common classes of employment.
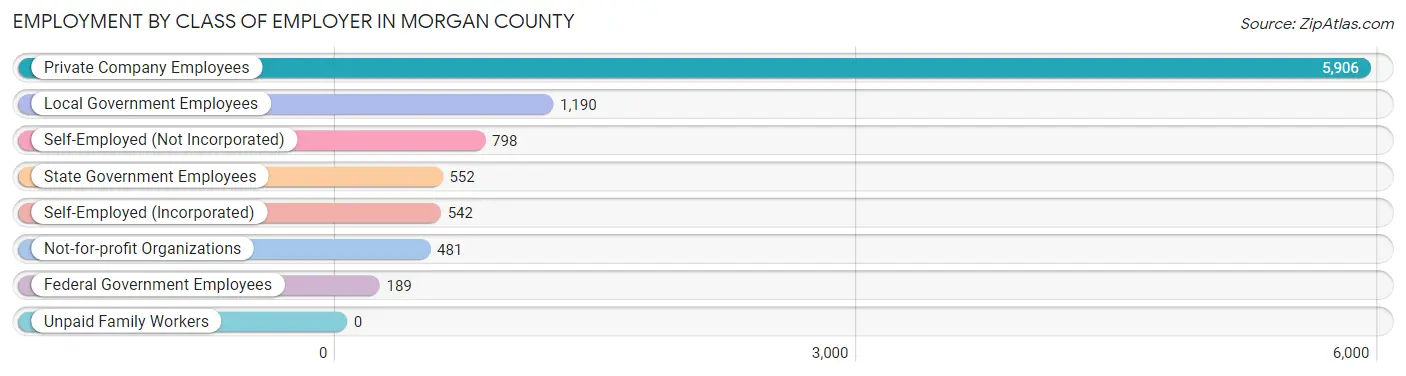
| Employer Class | # Employees | % Employees |
| Private Company Employees | 5,906 | 61.2% |
| Self-Employed (Incorporated) | 542 | 5.6% |
| Self-Employed (Not Incorporated) | 798 | 8.3% |
| Not-for-profit Organizations | 481 | 5.0% |
| Local Government Employees | 1,190 | 12.3% |
| State Government Employees | 552 | 5.7% |
| Federal Government Employees | 189 | 2.0% |
| Unpaid Family Workers | 0 | 0.0% |
| Total | 9,658 | 100.0% |
Employment Status by Age in Morgan County
According to the labor force statistics for Morgan County, out of the total population over 16 years of age (16,287), 62.3% or 10,147 individuals are in the labor force, with 2.9% or 294 of them unemployed. The age group with the highest labor force participation rate is 25 to 29 years, with 91.2% or 1,263 individuals in the labor force. Within the labor force, the 16 to 19 years age range has the highest percentage of unemployed individuals, with 10.7% or 43 of them being unemployed.
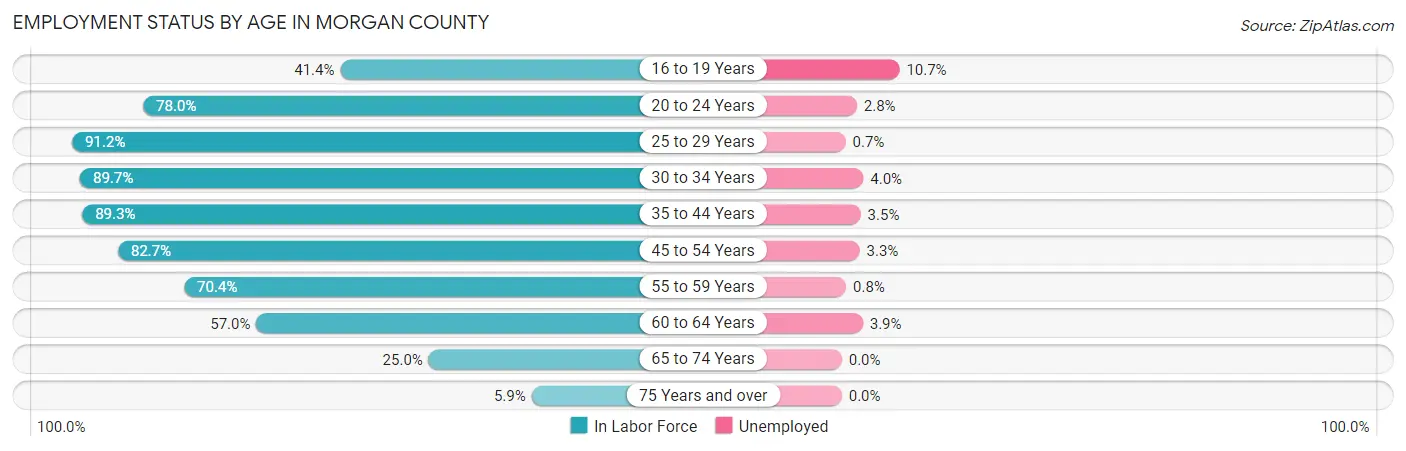
| Age Bracket | In Labor Force | Unemployed |
| 16 to 19 Years | 402 (41.4%) | 43 (10.7%) |
| 20 to 24 Years | 739 (78.0%) | 21 (2.8%) |
| 25 to 29 Years | 1,263 (91.2%) | 9 (0.7%) |
| 30 to 34 Years | 846 (89.7%) | 34 (4.0%) |
| 35 to 44 Years | 2,112 (89.3%) | 74 (3.5%) |
| 45 to 54 Years | 2,275 (82.7%) | 75 (3.3%) |
| 55 to 59 Years | 1,004 (70.4%) | 8 (0.8%) |
| 60 to 64 Years | 817 (57.0%) | 32 (3.9%) |
| 65 to 74 Years | 590 (25.0%) | 0 (0.0%) |
| 75 Years and over | 101 (5.9%) | 0 (0.0%) |
| Total | 10,147 (62.3%) | 294 (2.9%) |
Employment Status by Educational Attainment in Morgan County
According to labor force statistics for Morgan County, 80.7% of individuals (8,315) out of the total population between 25 and 64 years of age (10,303) are in the labor force, with 2.8% or 233 of them being unemployed. The group with the highest labor force participation rate are those with the educational attainment of bachelor's degree or higher, with 88.5% or 2,913 individuals in the labor force. Within the labor force, individuals with high school diploma education have the highest percentage of unemployment, with 4.8% or 135 of them being unemployed.
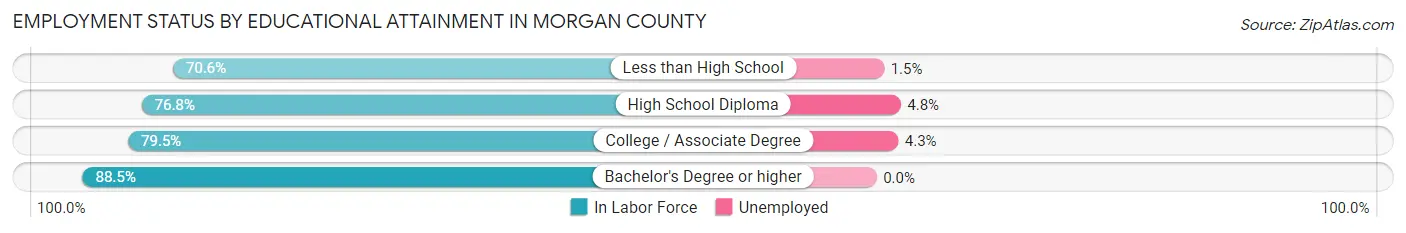
| Educational Attainment | In Labor Force | Unemployed |
| Less than High School | 549 (70.6%) | 12 (1.5%) |
| High School Diploma | 2,815 (76.8%) | 176 (4.8%) |
| College / Associate Degree | 2,042 (79.5%) | 110 (4.3%) |
| Bachelor's Degree or higher | 2,913 (88.5%) | 0 (0.0%) |
| Total | 8,315 (80.7%) | 288 (2.8%) |
Employment Occupations by Sex in Morgan County
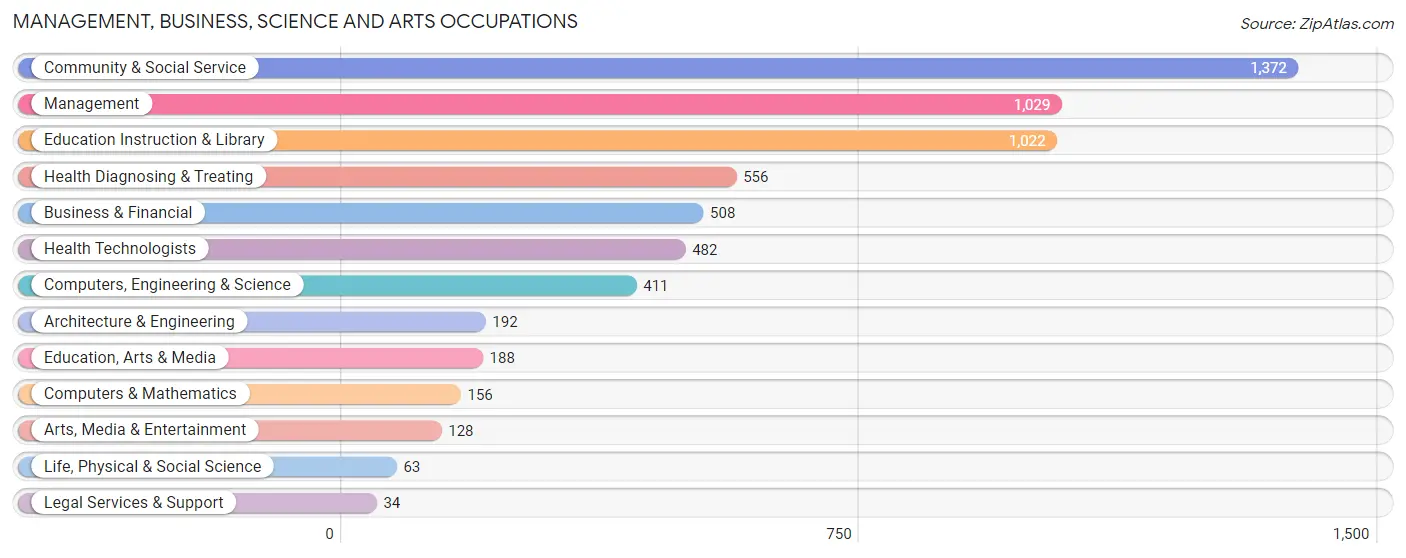
Management, Business, Science and Arts Occupations
The most common Management, Business, Science and Arts occupations in Morgan County are Community & Social Service (1,372 | 13.9%), Management (1,029 | 10.4%), Education Instruction & Library (1,022 | 10.4%), Health Diagnosing & Treating (556 | 5.6%), and Business & Financial (508 | 5.1%).
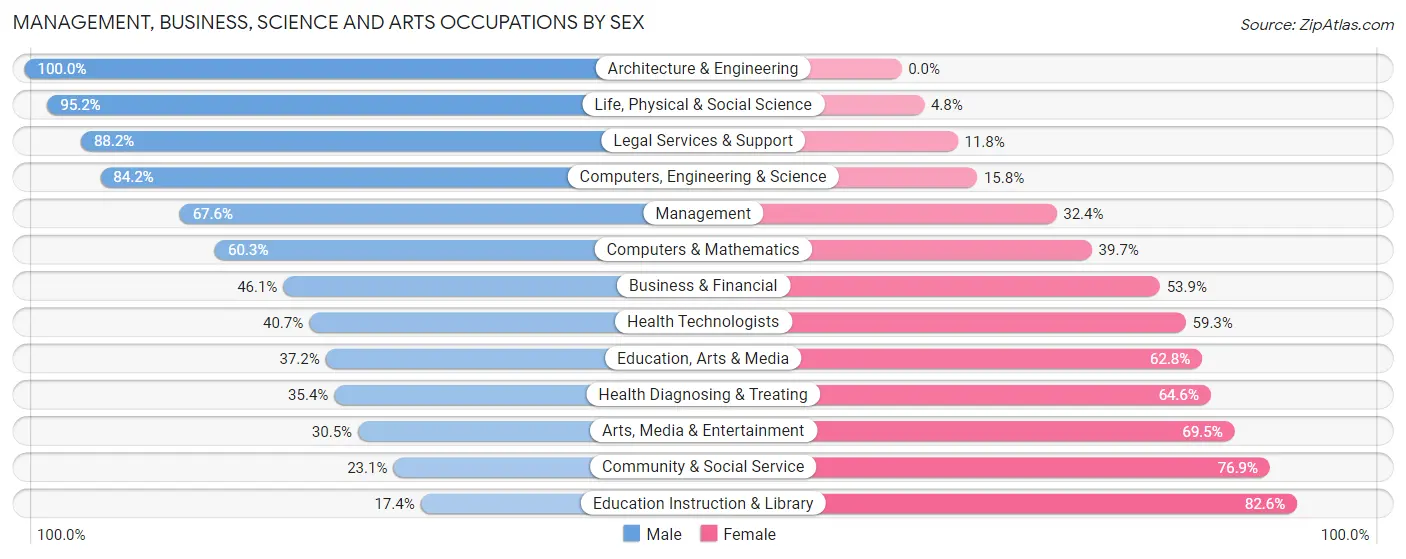
Management, Business, Science and Arts Occupations by Sex
Within the Management, Business, Science and Arts occupations in Morgan County, the most male-oriented occupations are Architecture & Engineering (100.0%), Life, Physical & Social Science (95.2%), and Legal Services & Support (88.2%), while the most female-oriented occupations are Education Instruction & Library (82.6%), Community & Social Service (76.9%), and Arts, Media & Entertainment (69.5%).
| Occupation | Male | Female |
| Management | 696 (67.6%) | 333 (32.4%) |
| Business & Financial | 234 (46.1%) | 274 (53.9%) |
| Computers, Engineering & Science | 346 (84.2%) | 65 (15.8%) |
| Computers & Mathematics | 94 (60.3%) | 62 (39.7%) |
| Architecture & Engineering | 192 (100.0%) | 0 (0.0%) |
| Life, Physical & Social Science | 60 (95.2%) | 3 (4.8%) |
| Community & Social Service | 317 (23.1%) | 1,055 (76.9%) |
| Education, Arts & Media | 70 (37.2%) | 118 (62.8%) |
| Legal Services & Support | 30 (88.2%) | 4 (11.8%) |
| Education Instruction & Library | 178 (17.4%) | 844 (82.6%) |
| Arts, Media & Entertainment | 39 (30.5%) | 89 (69.5%) |
| Health Diagnosing & Treating | 197 (35.4%) | 359 (64.6%) |
| Health Technologists | 196 (40.7%) | 286 (59.3%) |
| Total (Category) | 1,790 (46.2%) | 2,086 (53.8%) |
| Total (Overall) | 5,141 (52.2%) | 4,714 (47.8%) |
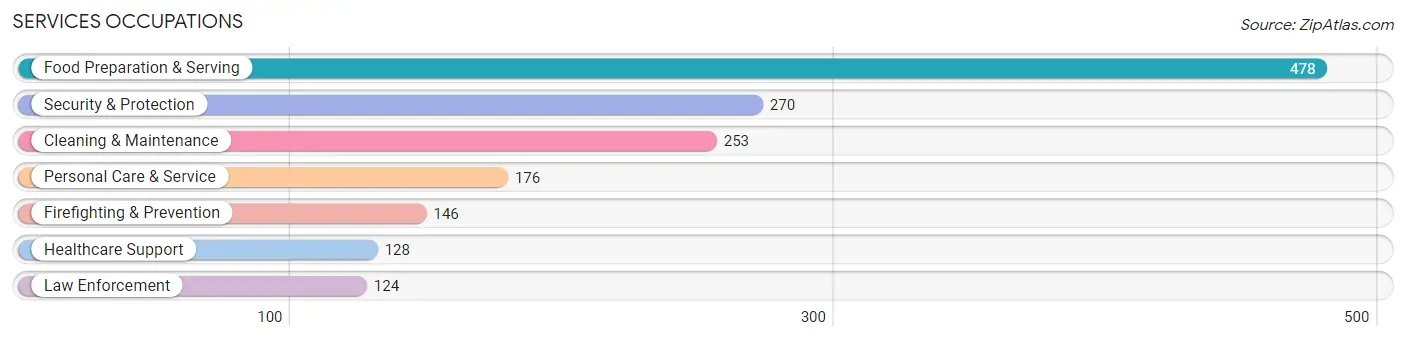
Services Occupations
The most common Services occupations in Morgan County are Food Preparation & Serving (478 | 4.9%), Security & Protection (270 | 2.7%), Cleaning & Maintenance (253 | 2.6%), Personal Care & Service (176 | 1.8%), and Firefighting & Prevention (146 | 1.5%).
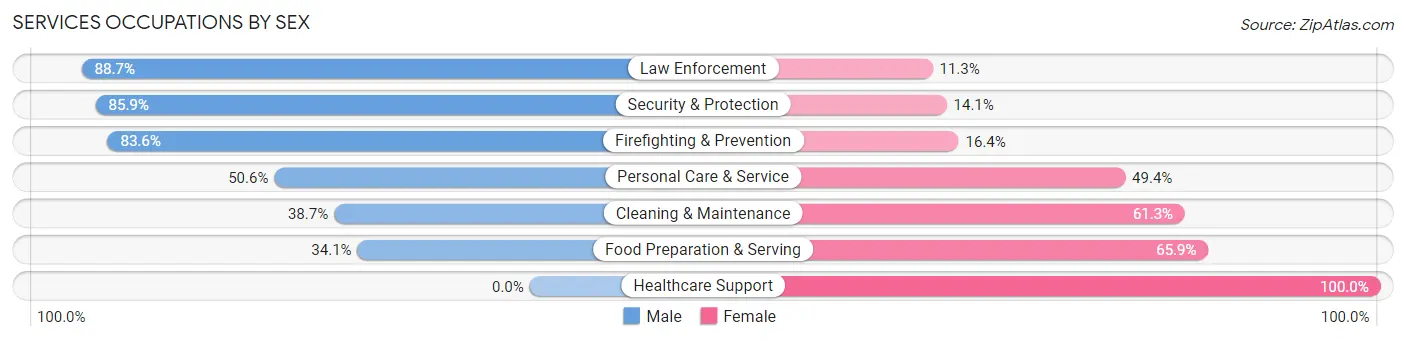
Services Occupations by Sex
Within the Services occupations in Morgan County, the most male-oriented occupations are Law Enforcement (88.7%), Security & Protection (85.9%), and Firefighting & Prevention (83.6%), while the most female-oriented occupations are Healthcare Support (100.0%), Food Preparation & Serving (65.9%), and Cleaning & Maintenance (61.3%).
| Occupation | Male | Female |
| Healthcare Support | 0 (0.0%) | 128 (100.0%) |
| Security & Protection | 232 (85.9%) | 38 (14.1%) |
| Firefighting & Prevention | 122 (83.6%) | 24 (16.4%) |
| Law Enforcement | 110 (88.7%) | 14 (11.3%) |
| Food Preparation & Serving | 163 (34.1%) | 315 (65.9%) |
| Cleaning & Maintenance | 98 (38.7%) | 155 (61.3%) |
| Personal Care & Service | 89 (50.6%) | 87 (49.4%) |
| Total (Category) | 582 (44.6%) | 723 (55.4%) |
| Total (Overall) | 5,141 (52.2%) | 4,714 (47.8%) |
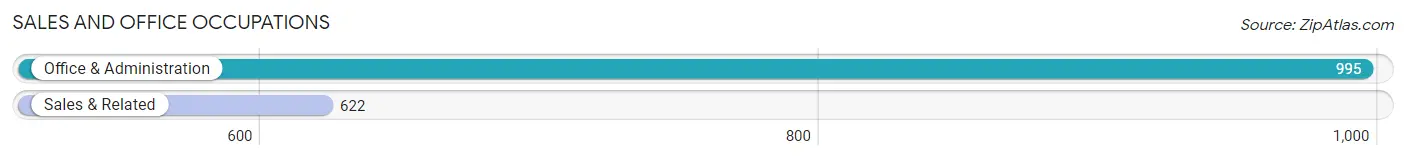
Sales and Office Occupations
The most common Sales and Office occupations in Morgan County are Office & Administration (995 | 10.1%), and Sales & Related (622 | 6.3%).
Sales and Office Occupations by Sex
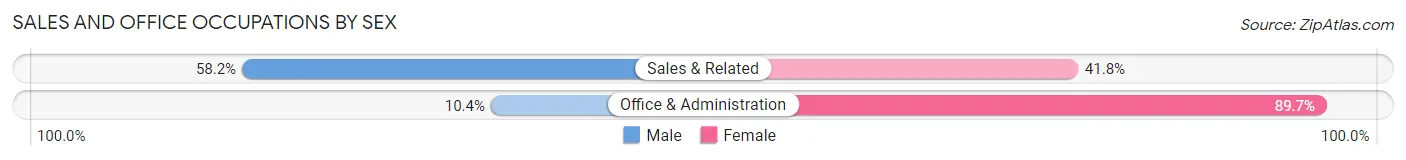
| Occupation | Male | Female |
| Sales & Related | 362 (58.2%) | 260 (41.8%) |
| Office & Administration | 103 (10.3%) | 892 (89.6%) |
| Total (Category) | 465 (28.8%) | 1,152 (71.2%) |
| Total (Overall) | 5,141 (52.2%) | 4,714 (47.8%) |
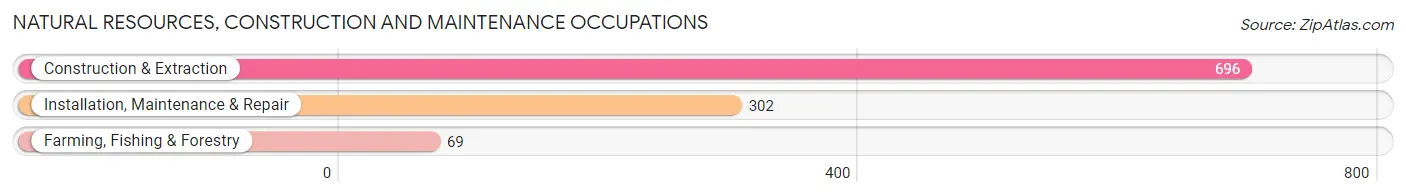
Natural Resources, Construction and Maintenance Occupations
The most common Natural Resources, Construction and Maintenance occupations in Morgan County are Construction & Extraction (696 | 7.1%), Installation, Maintenance & Repair (302 | 3.1%), and Farming, Fishing & Forestry (69 | 0.7%).
Natural Resources, Construction and Maintenance Occupations by Sex
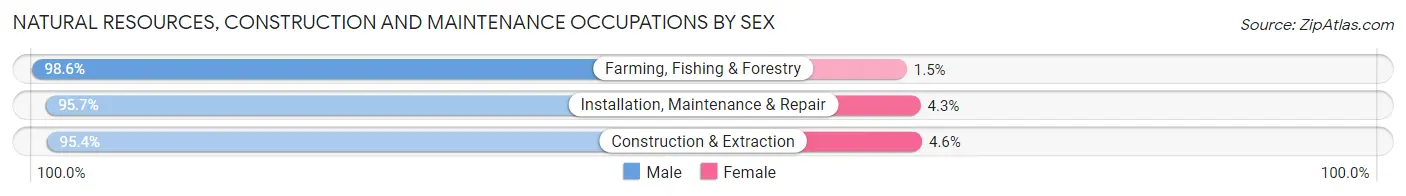
| Occupation | Male | Female |
| Farming, Fishing & Forestry | 68 (98.6%) | 1 (1.5%) |
| Construction & Extraction | 664 (95.4%) | 32 (4.6%) |
| Installation, Maintenance & Repair | 289 (95.7%) | 13 (4.3%) |
| Total (Category) | 1,021 (95.7%) | 46 (4.3%) |
| Total (Overall) | 5,141 (52.2%) | 4,714 (47.8%) |
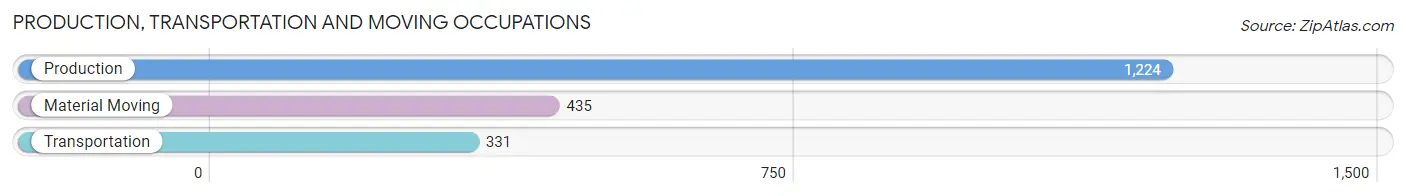
Production, Transportation and Moving Occupations
The most common Production, Transportation and Moving occupations in Morgan County are Production (1,224 | 12.4%), Material Moving (435 | 4.4%), and Transportation (331 | 3.4%).
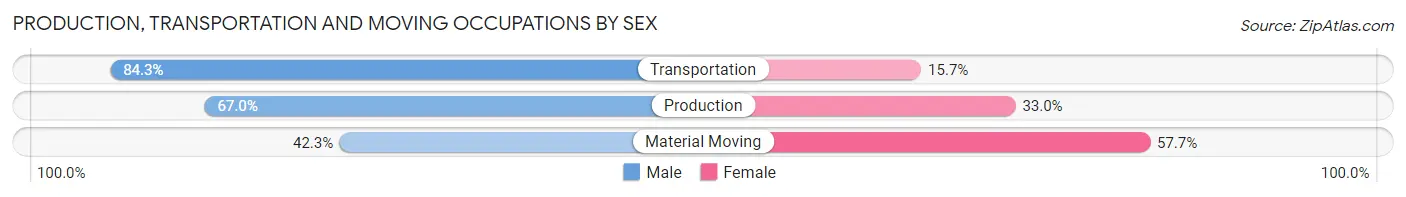
Production, Transportation and Moving Occupations by Sex
| Occupation | Male | Female |
| Production | 820 (67.0%) | 404 (33.0%) |
| Transportation | 279 (84.3%) | 52 (15.7%) |
| Material Moving | 184 (42.3%) | 251 (57.7%) |
| Total (Category) | 1,283 (64.5%) | 707 (35.5%) |
| Total (Overall) | 5,141 (52.2%) | 4,714 (47.8%) |
Employment Industries by Sex in Morgan County
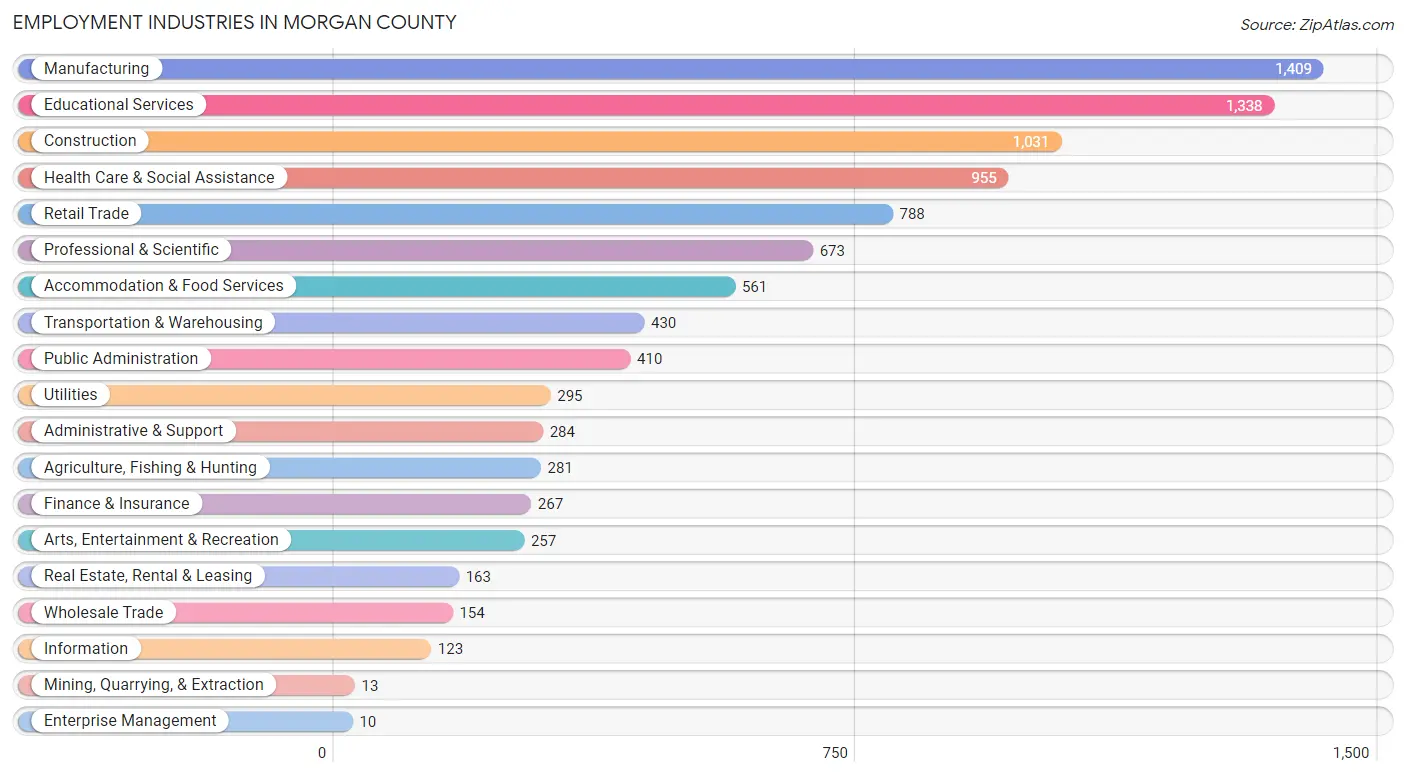
Employment Industries in Morgan County
The major employment industries in Morgan County include Manufacturing (1,409 | 14.3%), Educational Services (1,338 | 13.6%), Construction (1,031 | 10.5%), Health Care & Social Assistance (955 | 9.7%), and Retail Trade (788 | 8.0%).
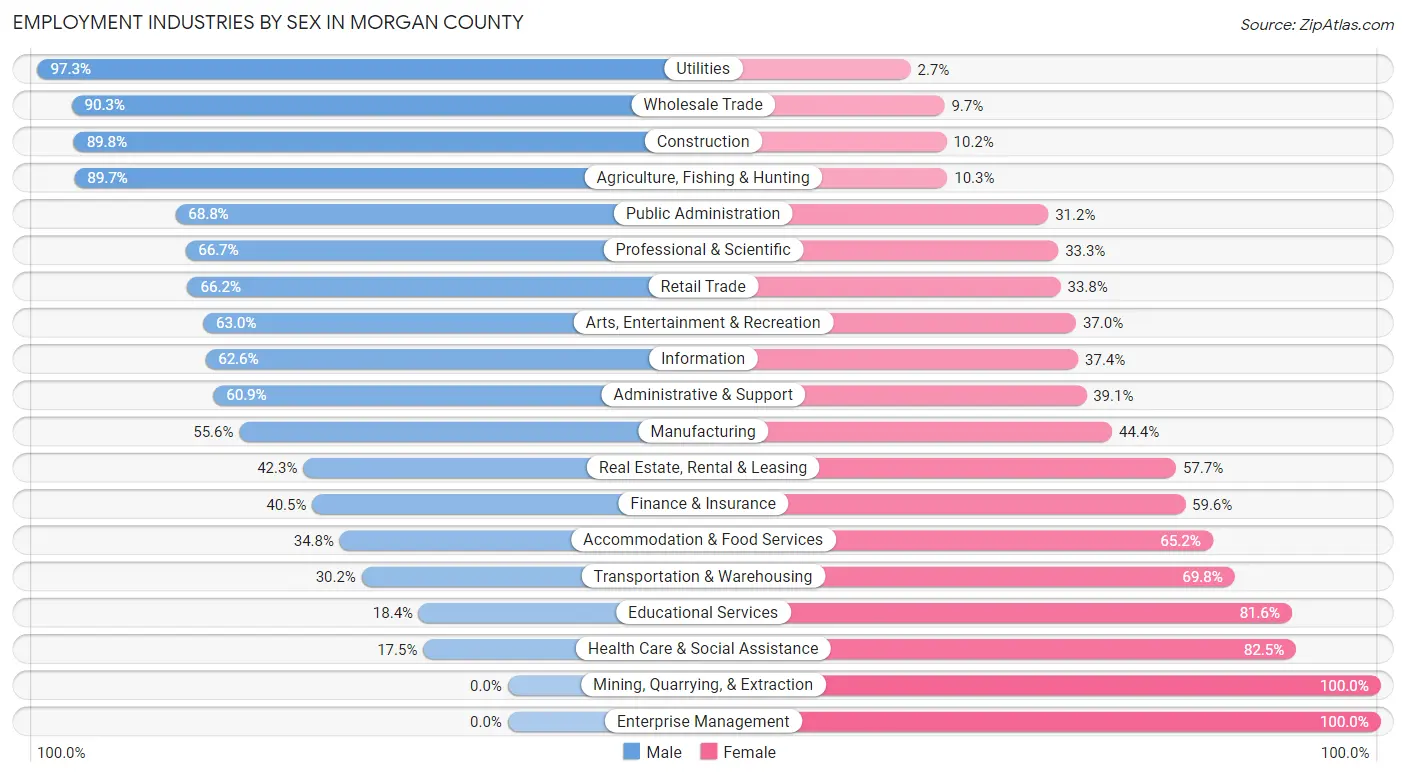
Employment Industries by Sex in Morgan County
The Morgan County industries that see more men than women are Utilities (97.3%), Wholesale Trade (90.3%), and Construction (89.8%), whereas the industries that tend to have a higher number of women are Mining, Quarrying, & Extraction (100.0%), Enterprise Management (100.0%), and Health Care & Social Assistance (82.5%).
| Industry | Male | Female |
| Agriculture, Fishing & Hunting | 252 (89.7%) | 29 (10.3%) |
| Mining, Quarrying, & Extraction | 0 (0.0%) | 13 (100.0%) |
| Construction | 926 (89.8%) | 105 (10.2%) |
| Manufacturing | 783 (55.6%) | 626 (44.4%) |
| Wholesale Trade | 139 (90.3%) | 15 (9.7%) |
| Retail Trade | 522 (66.2%) | 266 (33.8%) |
| Transportation & Warehousing | 130 (30.2%) | 300 (69.8%) |
| Utilities | 287 (97.3%) | 8 (2.7%) |
| Information | 77 (62.6%) | 46 (37.4%) |
| Finance & Insurance | 108 (40.5%) | 159 (59.6%) |
| Real Estate, Rental & Leasing | 69 (42.3%) | 94 (57.7%) |
| Professional & Scientific | 449 (66.7%) | 224 (33.3%) |
| Enterprise Management | 0 (0.0%) | 10 (100.0%) |
| Administrative & Support | 173 (60.9%) | 111 (39.1%) |
| Educational Services | 246 (18.4%) | 1,092 (81.6%) |
| Health Care & Social Assistance | 167 (17.5%) | 788 (82.5%) |
| Arts, Entertainment & Recreation | 162 (63.0%) | 95 (37.0%) |
| Accommodation & Food Services | 195 (34.8%) | 366 (65.2%) |
| Public Administration | 282 (68.8%) | 128 (31.2%) |
| Total | 5,141 (52.2%) | 4,714 (47.8%) |
Education in Morgan County
School Enrollment in Morgan County
The most common levels of schooling among the 4,564 students in Morgan County are middle school (1,351 | 29.6%), high school (1,116 | 24.4%), and elementary school (720 | 15.8%).
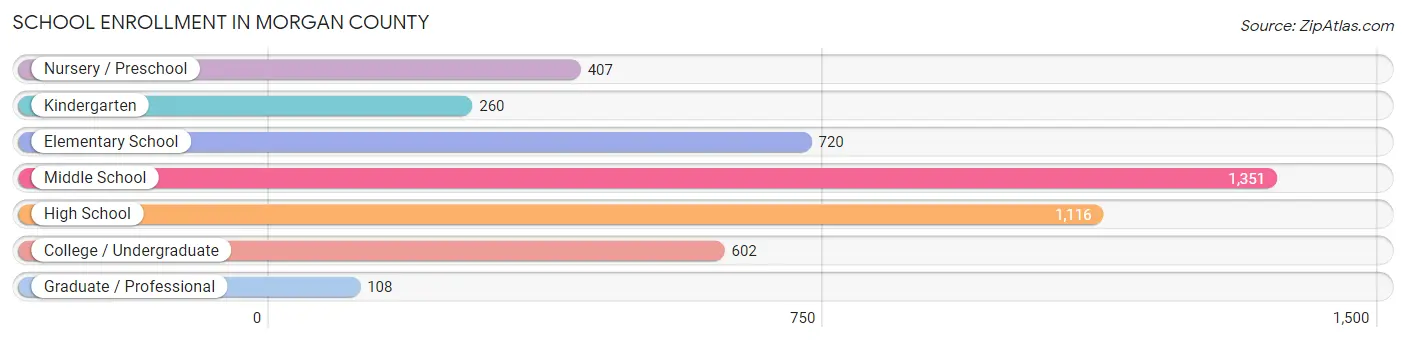
| School Level | # Students | % Students |
| Nursery / Preschool | 407 | 8.9% |
| Kindergarten | 260 | 5.7% |
| Elementary School | 720 | 15.8% |
| Middle School | 1,351 | 29.6% |
| High School | 1,116 | 24.4% |
| College / Undergraduate | 602 | 13.2% |
| Graduate / Professional | 108 | 2.4% |
| Total | 4,564 | 100.0% |
School Enrollment by Age by Funding Source in Morgan County
Out of a total of 4,564 students who are enrolled in schools in Morgan County, 479 (10.5%) attend a private institution, while the remaining 4,085 (89.5%) are enrolled in public schools. The age group of 3 to 4 year olds has the highest likelihood of being enrolled in private schools, with 150 (55.6% in the age bracket) enrolled. Conversely, the age group of 35 years and over has the lowest likelihood of being enrolled in a private school, with 203 (100.0% in the age bracket) attending a public institution.
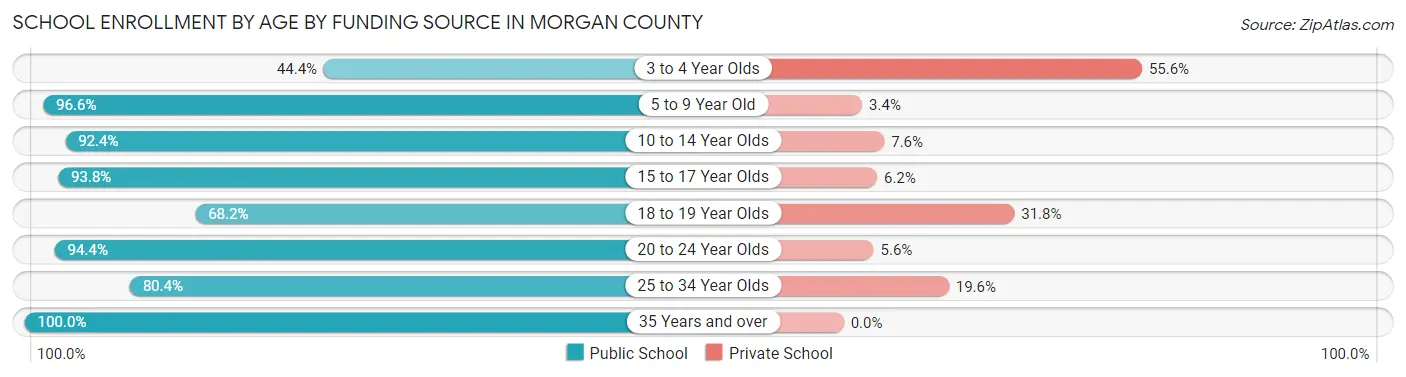
| Age Bracket | Public School | Private School |
| 3 to 4 Year Olds | 120 (44.4%) | 150 (55.6%) |
| 5 to 9 Year Old | 1,067 (96.6%) | 38 (3.4%) |
| 10 to 14 Year Olds | 1,306 (92.4%) | 107 (7.6%) |
| 15 to 17 Year Olds | 814 (93.8%) | 54 (6.2%) |
| 18 to 19 Year Olds | 146 (68.2%) | 68 (31.8%) |
| 20 to 24 Year Olds | 237 (94.4%) | 14 (5.6%) |
| 25 to 34 Year Olds | 193 (80.4%) | 47 (19.6%) |
| 35 Years and over | 203 (100.0%) | 0 (0.0%) |
| Total | 4,085 (89.5%) | 479 (10.5%) |
Educational Attainment by Field of Study in Morgan County
Business (756 | 17.0%), education (745 | 16.7%), arts & humanities (480 | 10.8%), science & technology (451 | 10.1%), and bio, nature & agricultural (398 | 8.9%) are the most common fields of study among 4,453 individuals in Morgan County who have obtained a bachelor's degree or higher.
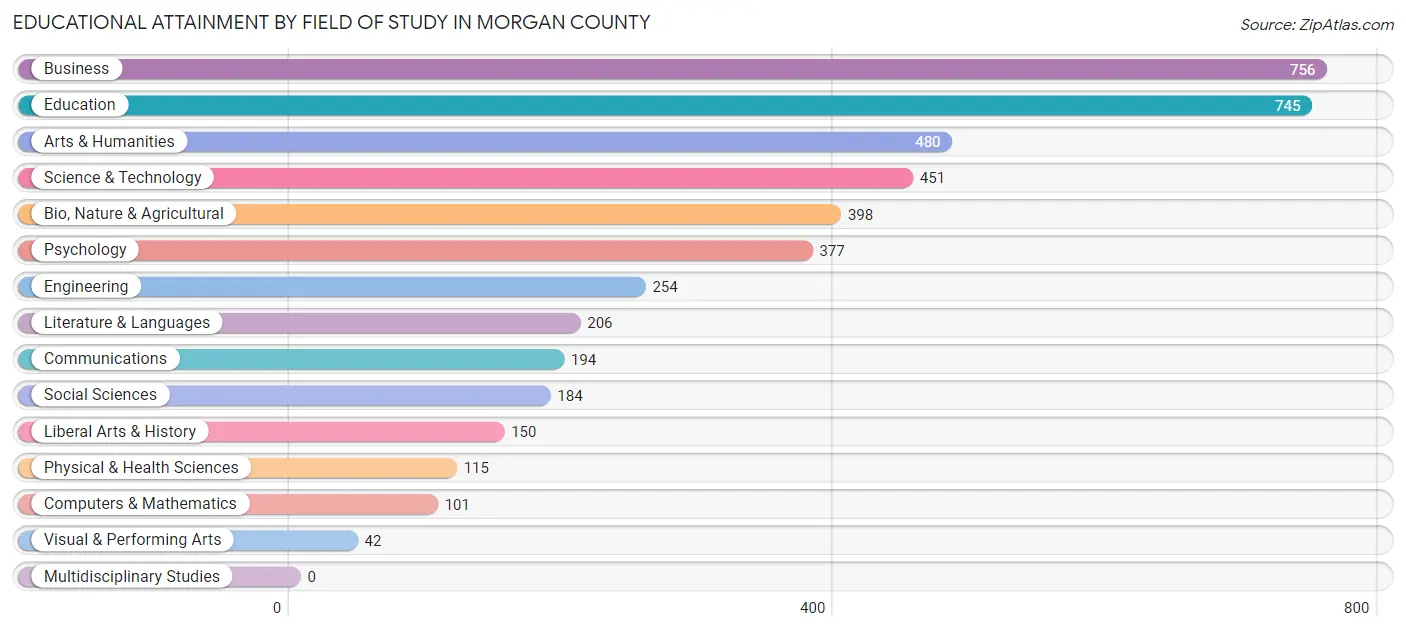
| Field of Study | # Graduates | % Graduates |
| Computers & Mathematics | 101 | 2.3% |
| Bio, Nature & Agricultural | 398 | 8.9% |
| Physical & Health Sciences | 115 | 2.6% |
| Psychology | 377 | 8.5% |
| Social Sciences | 184 | 4.1% |
| Engineering | 254 | 5.7% |
| Multidisciplinary Studies | 0 | 0.0% |
| Science & Technology | 451 | 10.1% |
| Business | 756 | 17.0% |
| Education | 745 | 16.7% |
| Literature & Languages | 206 | 4.6% |
| Liberal Arts & History | 150 | 3.4% |
| Visual & Performing Arts | 42 | 0.9% |
| Communications | 194 | 4.4% |
| Arts & Humanities | 480 | 10.8% |
| Total | 4,453 | 100.0% |
Transportation & Commute in Morgan County
Vehicle Availability by Sex in Morgan County
The most prevalent vehicle ownership categories in Morgan County are males with 2 vehicles (2,009, accounting for 40.1%) and females with 2 vehicles (1,890, making up 43.2%).
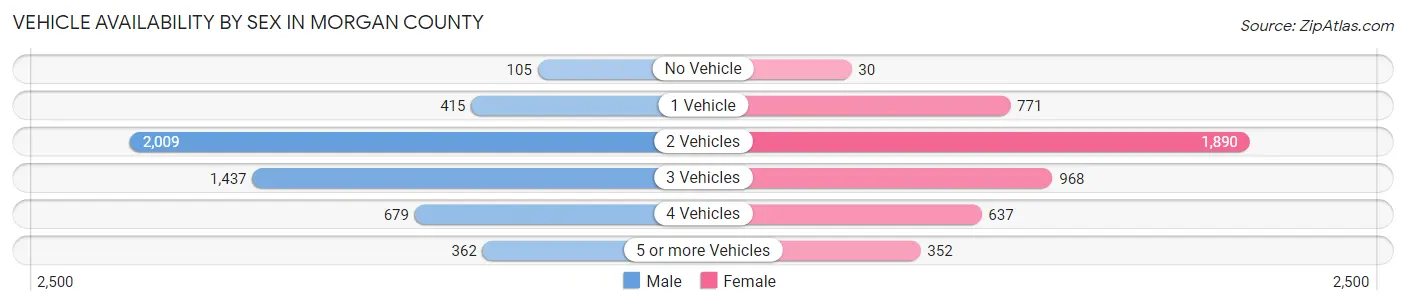
| Vehicles Available | Male | Female |
| No Vehicle | 105 (2.1%) | 30 (0.6%) |
| 1 Vehicle | 415 (8.3%) | 771 (16.6%) |
| 2 Vehicles | 2,009 (40.1%) | 1,890 (40.7%) |
| 3 Vehicles | 1,437 (28.7%) | 968 (20.8%) |
| 4 Vehicles | 679 (13.6%) | 637 (13.7%) |
| 5 or more Vehicles | 362 (7.2%) | 352 (7.6%) |
| Total | 5,007 (100.0%) | 4,648 (100.0%) |
Commute Time in Morgan County
The most frequently occuring commute durations in Morgan County are 5 to 9 minutes (1,424 commuters, 15.8%), 15 to 19 minutes (1,132 commuters, 12.6%), and 30 to 34 minutes (926 commuters, 10.3%).
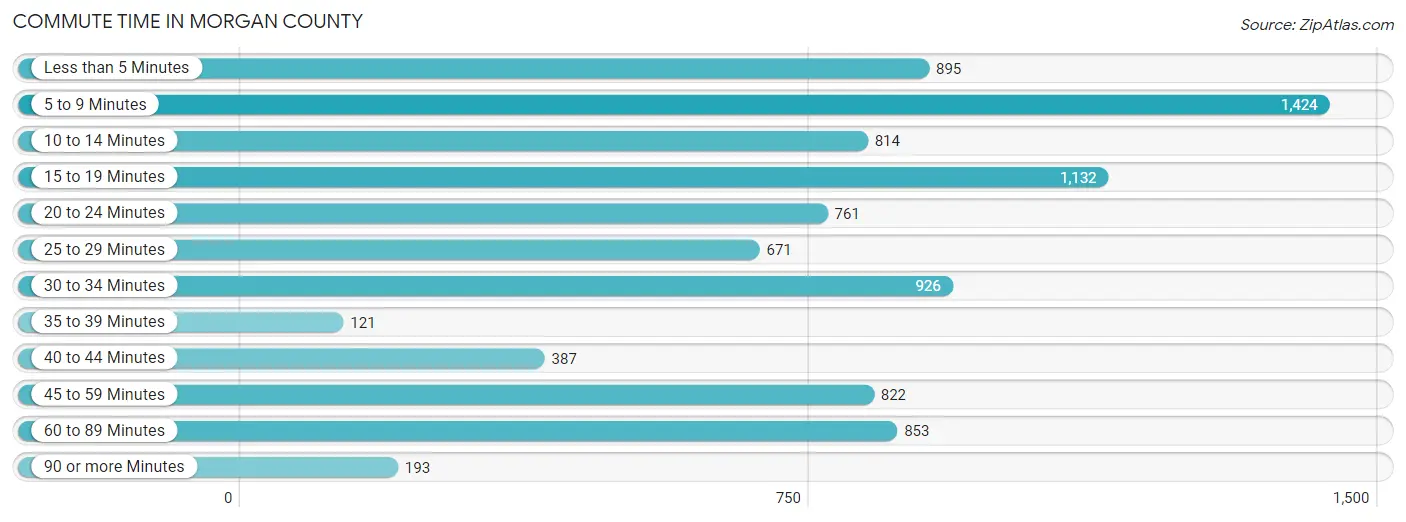
| Commute Time | # Commuters | % Commuters |
| Less than 5 Minutes | 895 | 10.0% |
| 5 to 9 Minutes | 1,424 | 15.8% |
| 10 to 14 Minutes | 814 | 9.0% |
| 15 to 19 Minutes | 1,132 | 12.6% |
| 20 to 24 Minutes | 761 | 8.5% |
| 25 to 29 Minutes | 671 | 7.5% |
| 30 to 34 Minutes | 926 | 10.3% |
| 35 to 39 Minutes | 121 | 1.3% |
| 40 to 44 Minutes | 387 | 4.3% |
| 45 to 59 Minutes | 822 | 9.1% |
| 60 to 89 Minutes | 853 | 9.5% |
| 90 or more Minutes | 193 | 2.1% |
Commute Time by Sex in Morgan County
The most common commute times in Morgan County are 60 to 89 minutes (643 commuters, 13.7%) for males and 5 to 9 minutes (799 commuters, 18.5%) for females.
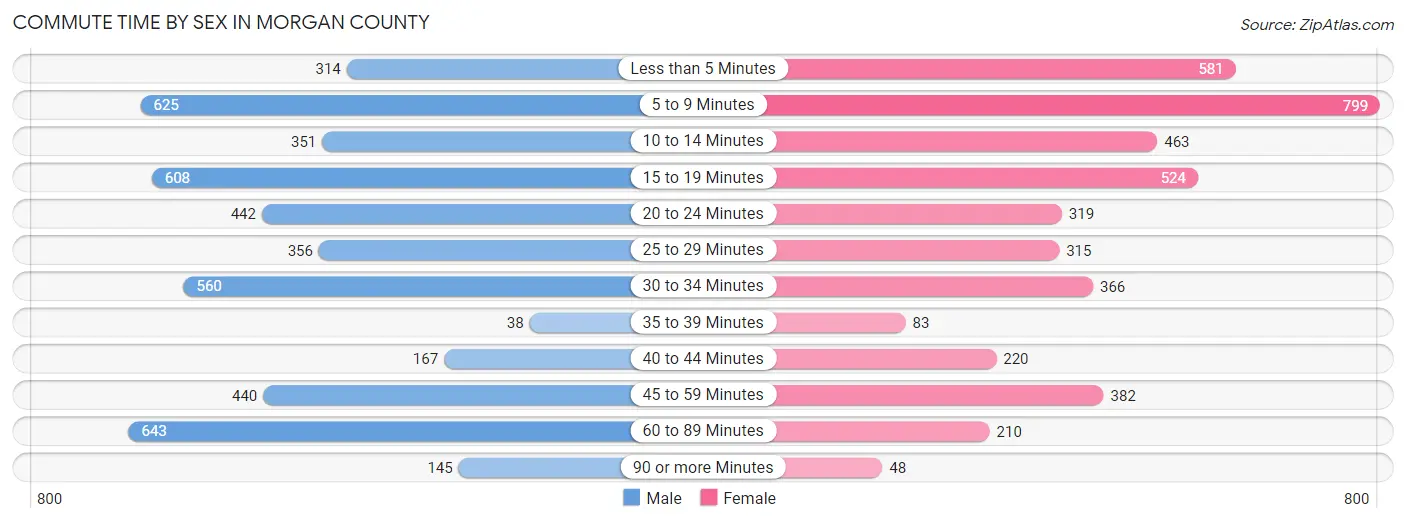
| Commute Time | Male | Female |
| Less than 5 Minutes | 314 (6.7%) | 581 (13.5%) |
| 5 to 9 Minutes | 625 (13.3%) | 799 (18.5%) |
| 10 to 14 Minutes | 351 (7.5%) | 463 (10.7%) |
| 15 to 19 Minutes | 608 (13.0%) | 524 (12.2%) |
| 20 to 24 Minutes | 442 (9.4%) | 319 (7.4%) |
| 25 to 29 Minutes | 356 (7.6%) | 315 (7.3%) |
| 30 to 34 Minutes | 560 (11.9%) | 366 (8.5%) |
| 35 to 39 Minutes | 38 (0.8%) | 83 (1.9%) |
| 40 to 44 Minutes | 167 (3.6%) | 220 (5.1%) |
| 45 to 59 Minutes | 440 (9.4%) | 382 (8.9%) |
| 60 to 89 Minutes | 643 (13.7%) | 210 (4.9%) |
| 90 or more Minutes | 145 (3.1%) | 48 (1.1%) |
Time of Departure to Work by Sex in Morgan County
The most frequent times of departure to work in Morgan County are 7:00 AM to 7:29 AM (612, 13.1%) for males and 7:00 AM to 7:29 AM (1,038, 24.1%) for females.
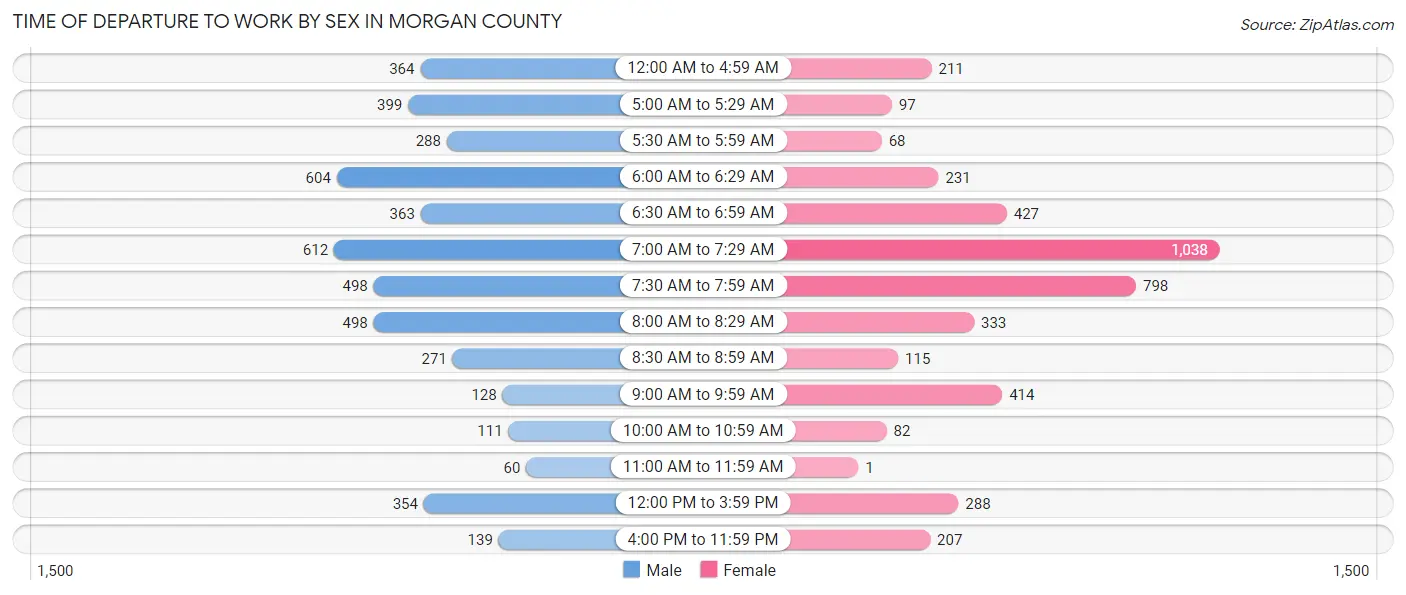
| Time of Departure | Male | Female |
| 12:00 AM to 4:59 AM | 364 (7.8%) | 211 (4.9%) |
| 5:00 AM to 5:29 AM | 399 (8.5%) | 97 (2.2%) |
| 5:30 AM to 5:59 AM | 288 (6.1%) | 68 (1.6%) |
| 6:00 AM to 6:29 AM | 604 (12.9%) | 231 (5.4%) |
| 6:30 AM to 6:59 AM | 363 (7.7%) | 427 (9.9%) |
| 7:00 AM to 7:29 AM | 612 (13.1%) | 1,038 (24.1%) |
| 7:30 AM to 7:59 AM | 498 (10.6%) | 798 (18.5%) |
| 8:00 AM to 8:29 AM | 498 (10.6%) | 333 (7.7%) |
| 8:30 AM to 8:59 AM | 271 (5.8%) | 115 (2.7%) |
| 9:00 AM to 9:59 AM | 128 (2.7%) | 414 (9.6%) |
| 10:00 AM to 10:59 AM | 111 (2.4%) | 82 (1.9%) |
| 11:00 AM to 11:59 AM | 60 (1.3%) | 1 (0.0%) |
| 12:00 PM to 3:59 PM | 354 (7.5%) | 288 (6.7%) |
| 4:00 PM to 11:59 PM | 139 (3.0%) | 207 (4.8%) |
| Total | 4,689 (100.0%) | 4,310 (100.0%) |
Housing Occupancy in Morgan County
Occupancy by Ownership in Morgan County
Of the total 7,587 dwellings in Morgan County, owner-occupied units account for 5,640 (74.3%), while renter-occupied units make up 1,947 (25.7%).
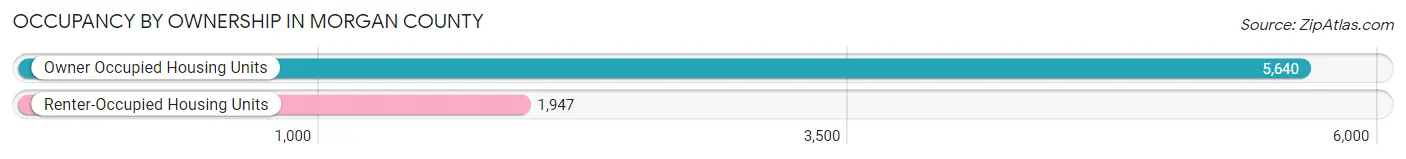
| Occupancy | # Housing Units | % Housing Units |
| Owner Occupied Housing Units | 5,640 | 74.3% |
| Renter-Occupied Housing Units | 1,947 | 25.7% |
| Total Occupied Housing Units | 7,587 | 100.0% |
Occupancy by Household Size in Morgan County
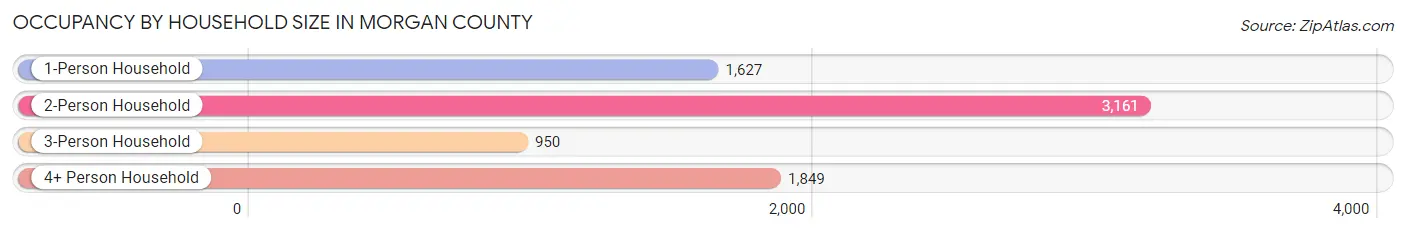
| Household Size | # Housing Units | % Housing Units |
| 1-Person Household | 1,627 | 21.4% |
| 2-Person Household | 3,161 | 41.7% |
| 3-Person Household | 950 | 12.5% |
| 4+ Person Household | 1,849 | 24.4% |
| Total Housing Units | 7,587 | 100.0% |
Occupancy by Ownership by Household Size in Morgan County
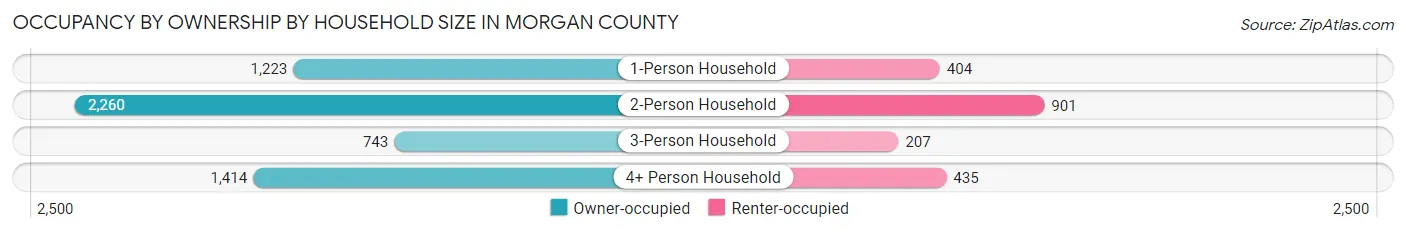
| Household Size | Owner-occupied | Renter-occupied |
| 1-Person Household | 1,223 (75.2%) | 404 (24.8%) |
| 2-Person Household | 2,260 (71.5%) | 901 (28.5%) |
| 3-Person Household | 743 (78.2%) | 207 (21.8%) |
| 4+ Person Household | 1,414 (76.5%) | 435 (23.5%) |
| Total Housing Units | 5,640 (74.3%) | 1,947 (25.7%) |
Occupancy by Educational Attainment in Morgan County
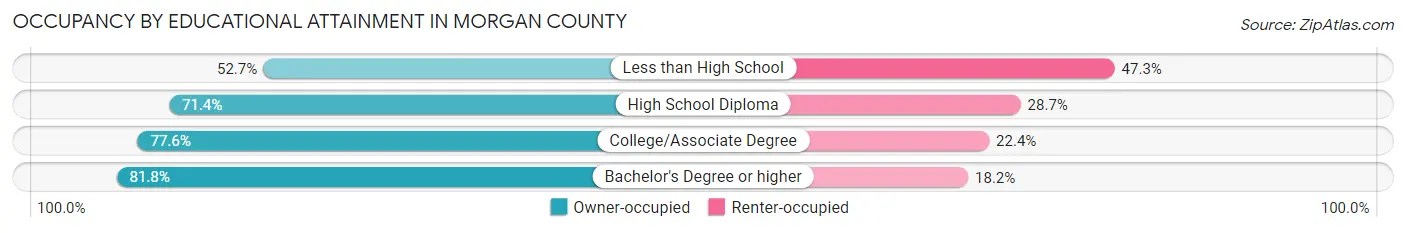
| Household Size | Owner-occupied | Renter-occupied |
| Less than High School | 426 (52.7%) | 382 (47.3%) |
| High School Diploma | 1,723 (71.4%) | 692 (28.6%) |
| College/Associate Degree | 1,441 (77.6%) | 416 (22.4%) |
| Bachelor's Degree or higher | 2,050 (81.8%) | 457 (18.2%) |
Occupancy by Age of Householder in Morgan County
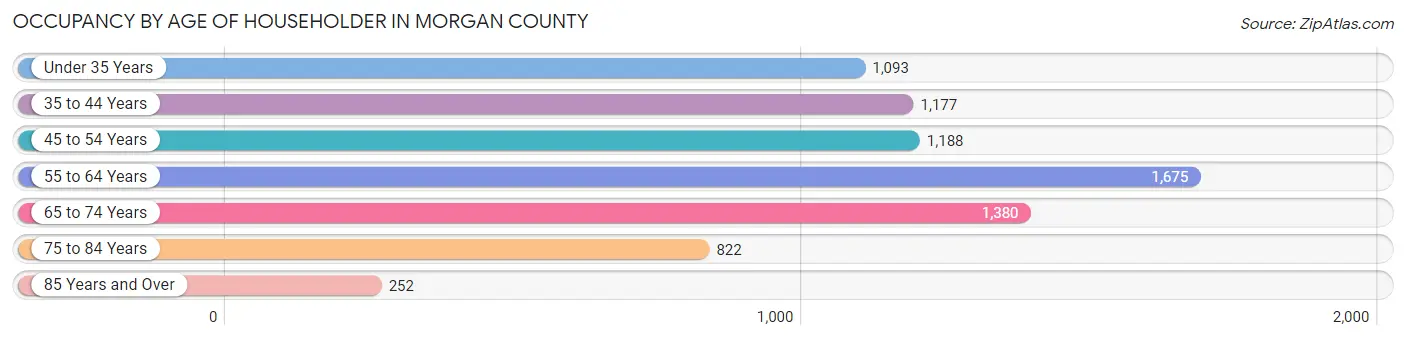
| Age Bracket | # Households | % Households |
| Under 35 Years | 1,093 | 14.4% |
| 35 to 44 Years | 1,177 | 15.5% |
| 45 to 54 Years | 1,188 | 15.7% |
| 55 to 64 Years | 1,675 | 22.1% |
| 65 to 74 Years | 1,380 | 18.2% |
| 75 to 84 Years | 822 | 10.8% |
| 85 Years and Over | 252 | 3.3% |
| Total | 7,587 | 100.0% |
Housing Finances in Morgan County
Median Income by Occupancy in Morgan County
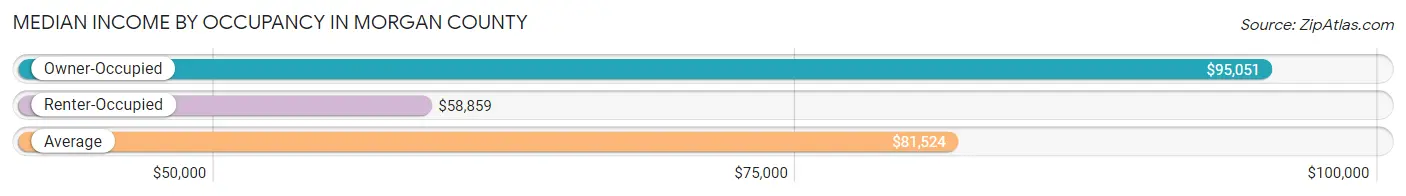
| Occupancy Type | # Households | Median Income |
| Owner-Occupied | 5,640 (74.3%) | $95,051 |
| Renter-Occupied | 1,947 (25.7%) | $58,859 |
| Average | 7,587 (100.0%) | $81,524 |
Occupancy by Householder Income Bracket in Morgan County

| Income Bracket | Owner-occupied | Renter-occupied |
| Less than $5,000 | 39 (0.7%) | 37 (1.9%) |
| $5,000 to $9,999 | 110 (1.9%) | 41 (2.1%) |
| $10,000 to $14,999 | 186 (3.3%) | 283 (14.5%) |
| $15,000 to $19,999 | 62 (1.1%) | 15 (0.8%) |
| $20,000 to $24,999 | 72 (1.3%) | 130 (6.7%) |
| $25,000 to $34,999 | 417 (7.4%) | 218 (11.2%) |
| $35,000 to $49,999 | 470 (8.3%) | 163 (8.4%) |
| $50,000 to $74,999 | 895 (15.9%) | 284 (14.6%) |
| $75,000 to $99,999 | 713 (12.6%) | 567 (29.1%) |
| $100,000 to $149,999 | 1,303 (23.1%) | 87 (4.5%) |
| $150,000 or more | 1,373 (24.3%) | 122 (6.3%) |
| Total | 5,640 (100.0%) | 1,947 (100.0%) |
Monthly Housing Cost Tiers in Morgan County
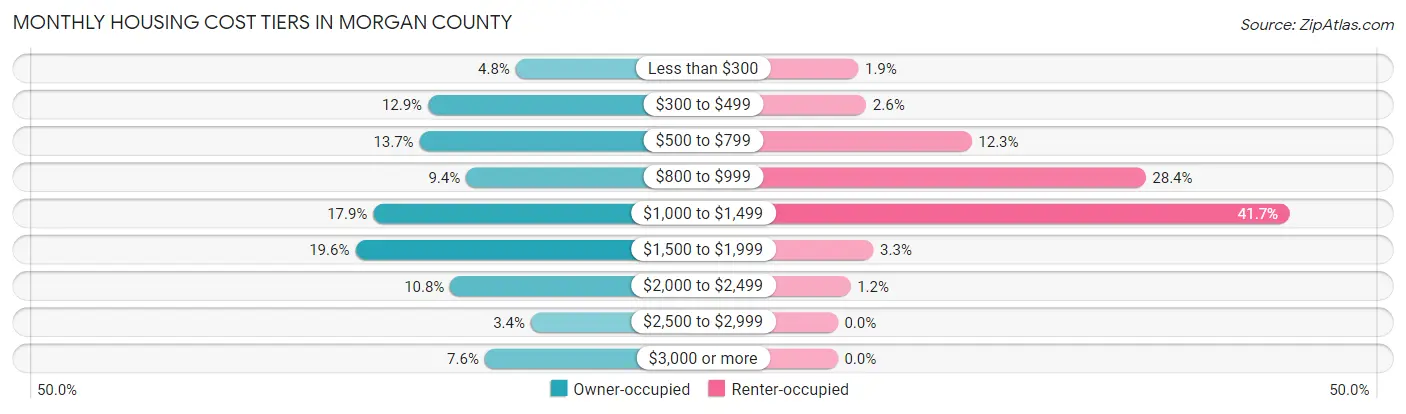
| Monthly Cost | Owner-occupied | Renter-occupied |
| Less than $300 | 270 (4.8%) | 37 (1.9%) |
| $300 to $499 | 726 (12.9%) | 51 (2.6%) |
| $500 to $799 | 770 (13.7%) | 240 (12.3%) |
| $800 to $999 | 528 (9.4%) | 552 (28.3%) |
| $1,000 to $1,499 | 1,010 (17.9%) | 811 (41.6%) |
| $1,500 to $1,999 | 1,103 (19.6%) | 64 (3.3%) |
| $2,000 to $2,499 | 610 (10.8%) | 23 (1.2%) |
| $2,500 to $2,999 | 192 (3.4%) | 0 (0.0%) |
| $3,000 or more | 431 (7.6%) | 0 (0.0%) |
| Total | 5,640 (100.0%) | 1,947 (100.0%) |
Physical Housing Characteristics in Morgan County
Housing Structures in Morgan County
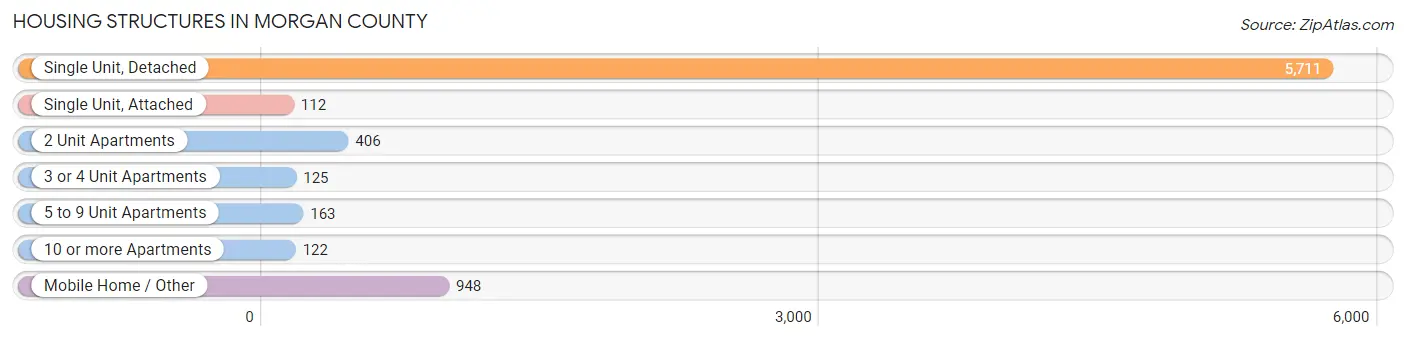
| Structure Type | # Housing Units | % Housing Units |
| Single Unit, Detached | 5,711 | 75.3% |
| Single Unit, Attached | 112 | 1.5% |
| 2 Unit Apartments | 406 | 5.3% |
| 3 or 4 Unit Apartments | 125 | 1.7% |
| 5 to 9 Unit Apartments | 163 | 2.1% |
| 10 or more Apartments | 122 | 1.6% |
| Mobile Home / Other | 948 | 12.5% |
| Total | 7,587 | 100.0% |
Housing Structures by Occupancy in Morgan County
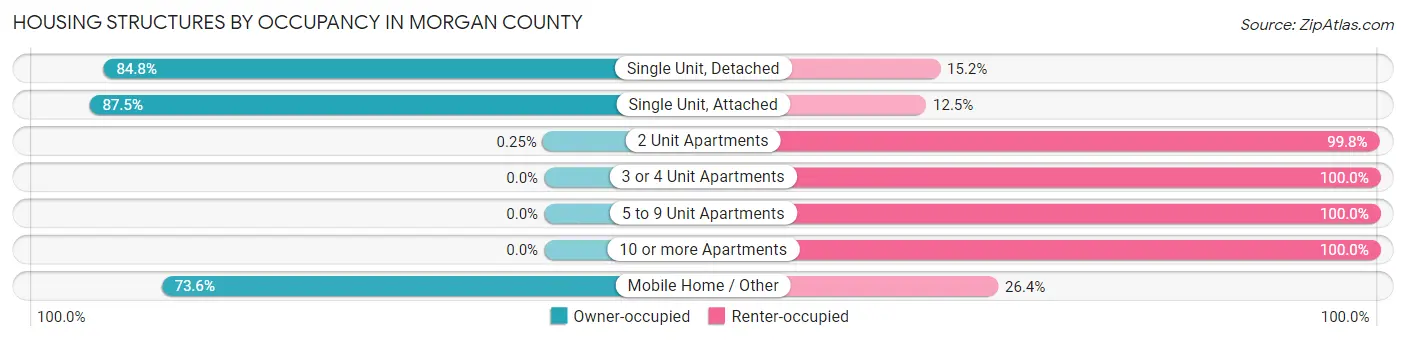
| Structure Type | Owner-occupied | Renter-occupied |
| Single Unit, Detached | 4,843 (84.8%) | 868 (15.2%) |
| Single Unit, Attached | 98 (87.5%) | 14 (12.5%) |
| 2 Unit Apartments | 1 (0.3%) | 405 (99.8%) |
| 3 or 4 Unit Apartments | 0 (0.0%) | 125 (100.0%) |
| 5 to 9 Unit Apartments | 0 (0.0%) | 163 (100.0%) |
| 10 or more Apartments | 0 (0.0%) | 122 (100.0%) |
| Mobile Home / Other | 698 (73.6%) | 250 (26.4%) |
| Total | 5,640 (74.3%) | 1,947 (25.7%) |
Housing Structures by Number of Rooms in Morgan County
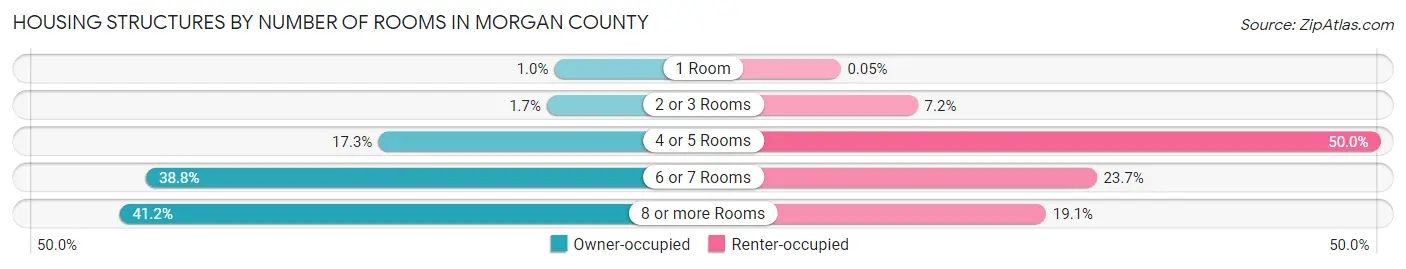
| Number of Rooms | Owner-occupied | Renter-occupied |
| 1 Room | 57 (1.0%) | 1 (0.1%) |
| 2 or 3 Rooms | 96 (1.7%) | 140 (7.2%) |
| 4 or 5 Rooms | 976 (17.3%) | 973 (50.0%) |
| 6 or 7 Rooms | 2,186 (38.8%) | 462 (23.7%) |
| 8 or more Rooms | 2,325 (41.2%) | 371 (19.1%) |
| Total | 5,640 (100.0%) | 1,947 (100.0%) |
Housing Structure by Heating Type in Morgan County
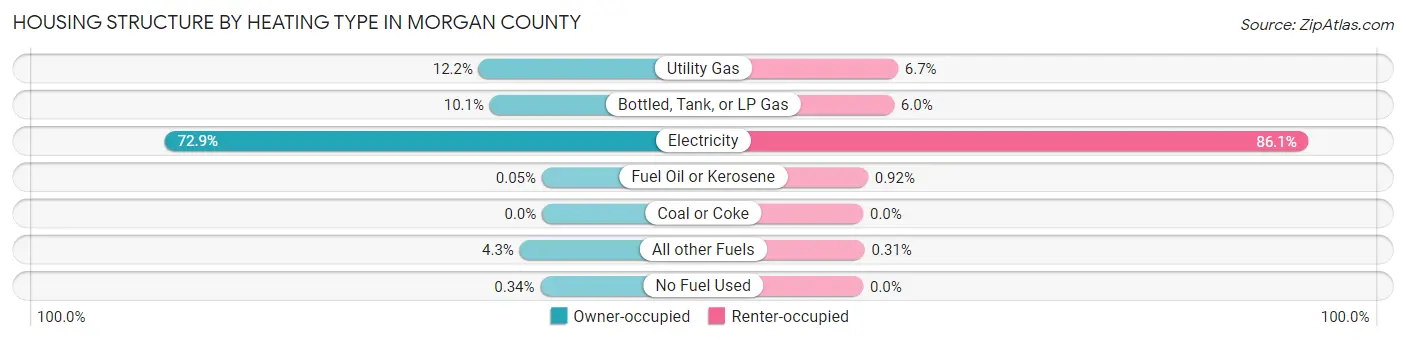
| Heating Type | Owner-occupied | Renter-occupied |
| Utility Gas | 690 (12.2%) | 131 (6.7%) |
| Bottled, Tank, or LP Gas | 570 (10.1%) | 116 (6.0%) |
| Electricity | 4,113 (72.9%) | 1,676 (86.1%) |
| Fuel Oil or Kerosene | 3 (0.1%) | 18 (0.9%) |
| Coal or Coke | 0 (0.0%) | 0 (0.0%) |
| All other Fuels | 245 (4.3%) | 6 (0.3%) |
| No Fuel Used | 19 (0.3%) | 0 (0.0%) |
| Total | 5,640 (100.0%) | 1,947 (100.0%) |
Household Vehicle Usage in Morgan County
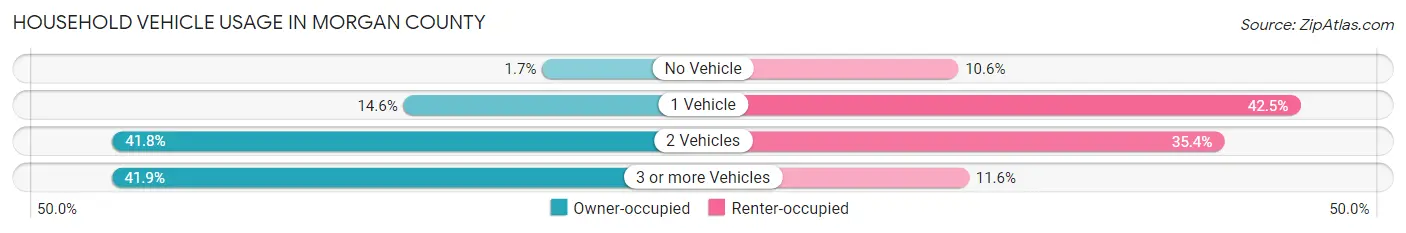
| Vehicles per Household | Owner-occupied | Renter-occupied |
| No Vehicle | 95 (1.7%) | 206 (10.6%) |
| 1 Vehicle | 825 (14.6%) | 827 (42.5%) |
| 2 Vehicles | 2,358 (41.8%) | 689 (35.4%) |
| 3 or more Vehicles | 2,362 (41.9%) | 225 (11.6%) |
| Total | 5,640 (100.0%) | 1,947 (100.0%) |
Real Estate & Mortgages in Morgan County
Real Estate and Mortgage Overview in Morgan County
| Characteristic | Without Mortgage | With Mortgage |
| Housing Units | 2,231 | 3,409 |
| Median Property Value | $283,000 | $302,300 |
| Median Household Income | $72,813 | $987 |
| Monthly Housing Costs | $559 | $422 |
| Real Estate Taxes | $2,314 | $15 |
Property Value by Mortgage Status in Morgan County
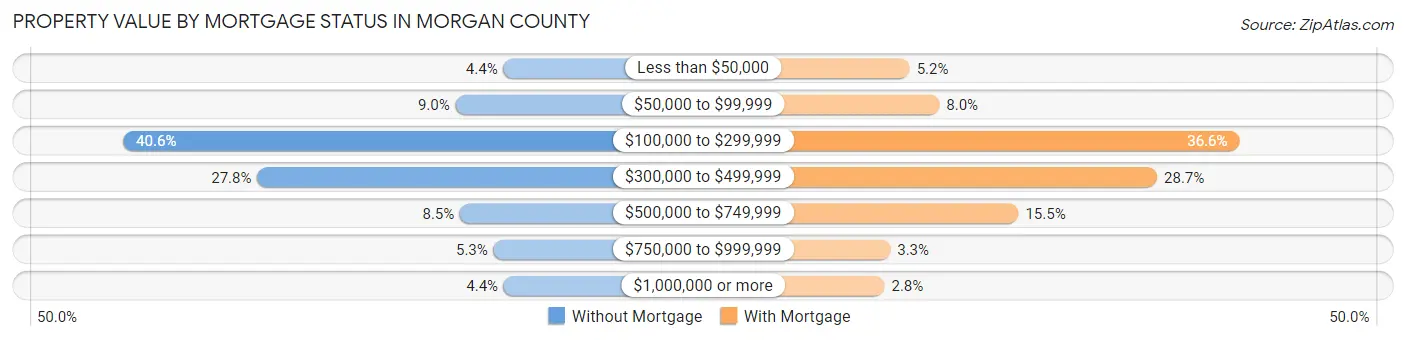
| Property Value | Without Mortgage | With Mortgage |
| Less than $50,000 | 98 (4.4%) | 176 (5.2%) |
| $50,000 to $99,999 | 200 (9.0%) | 272 (8.0%) |
| $100,000 to $299,999 | 906 (40.6%) | 1,246 (36.5%) |
| $300,000 to $499,999 | 621 (27.8%) | 979 (28.7%) |
| $500,000 to $749,999 | 190 (8.5%) | 529 (15.5%) |
| $750,000 to $999,999 | 119 (5.3%) | 113 (3.3%) |
| $1,000,000 or more | 97 (4.3%) | 94 (2.8%) |
| Total | 2,231 (100.0%) | 3,409 (100.0%) |
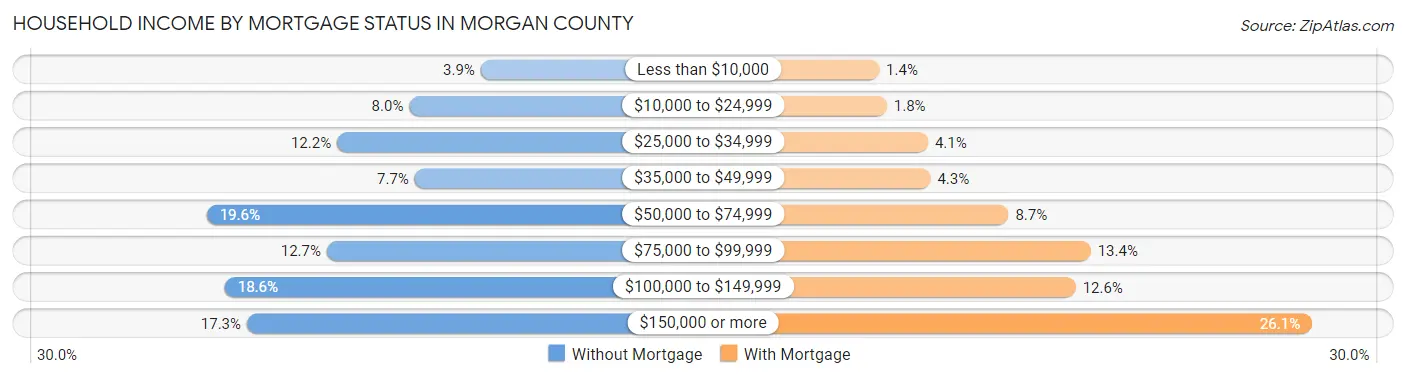
Household Income by Mortgage Status in Morgan County
| Household Income | Without Mortgage | With Mortgage |
| Less than $10,000 | 88 (3.9%) | 46 (1.3%) |
| $10,000 to $24,999 | 179 (8.0%) | 61 (1.8%) |
| $25,000 to $34,999 | 271 (12.1%) | 141 (4.1%) |
| $35,000 to $49,999 | 172 (7.7%) | 146 (4.3%) |
| $50,000 to $74,999 | 437 (19.6%) | 298 (8.7%) |
| $75,000 to $99,999 | 284 (12.7%) | 458 (13.4%) |
| $100,000 to $149,999 | 414 (18.6%) | 429 (12.6%) |
| $150,000 or more | 386 (17.3%) | 889 (26.1%) |
| Total | 2,231 (100.0%) | 3,409 (100.0%) |
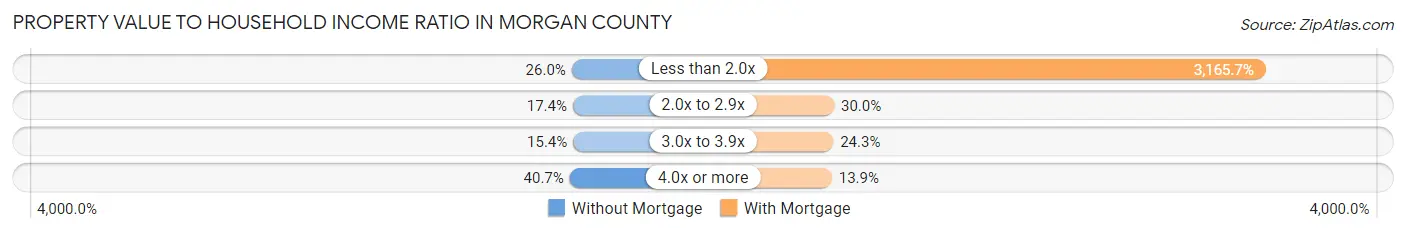
Property Value to Household Income Ratio in Morgan County
| Value-to-Income Ratio | Without Mortgage | With Mortgage |
| Less than 2.0x | 579 (26.0%) | 107,917 (3,165.7%) |
| 2.0x to 2.9x | 387 (17.3%) | 1,023 (30.0%) |
| 3.0x to 3.9x | 343 (15.4%) | 827 (24.3%) |
| 4.0x or more | 909 (40.7%) | 472 (13.9%) |
| Total | 2,231 (100.0%) | 3,409 (100.0%) |
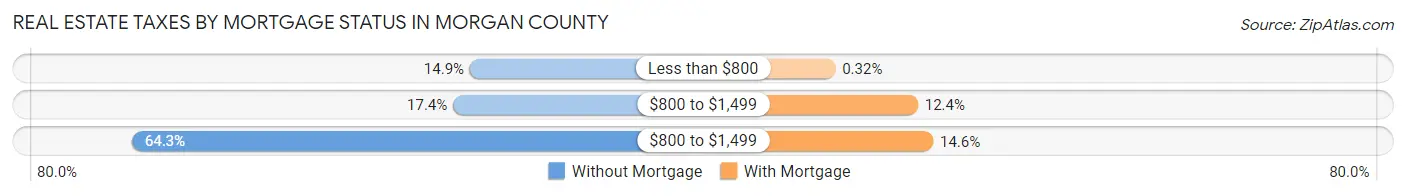
Real Estate Taxes by Mortgage Status in Morgan County
| Property Taxes | Without Mortgage | With Mortgage |
| Less than $800 | 333 (14.9%) | 11 (0.3%) |
| $800 to $1,499 | 388 (17.4%) | 422 (12.4%) |
| $800 to $1,499 | 1,435 (64.3%) | 498 (14.6%) |
| Total | 2,231 (100.0%) | 3,409 (100.0%) |
Health & Disability in Morgan County
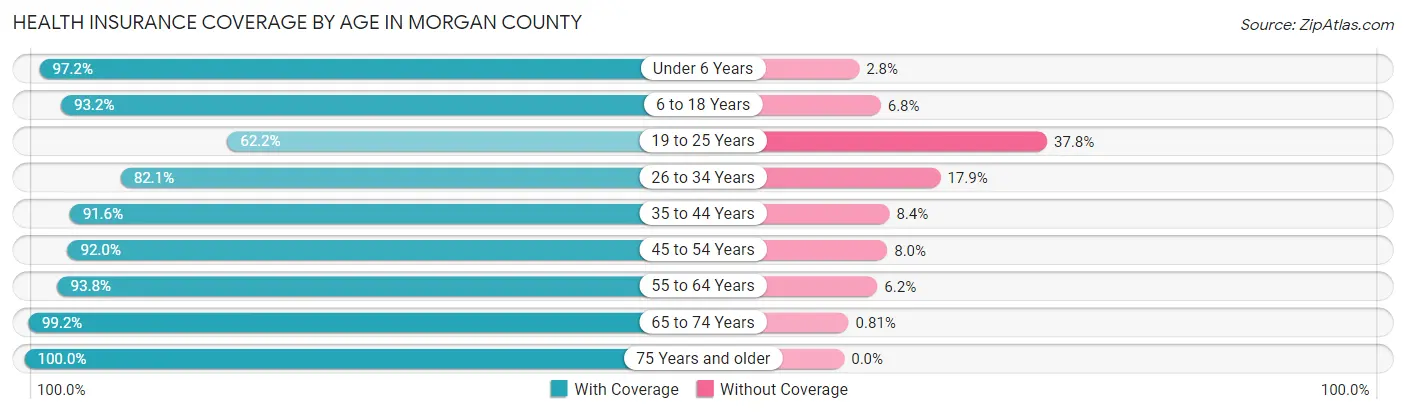
Health Insurance Coverage by Age in Morgan County
| Age Bracket | With Coverage | Without Coverage |
| Under 6 Years | 1,252 (97.2%) | 36 (2.8%) |
| 6 to 18 Years | 3,264 (93.2%) | 238 (6.8%) |
| 19 to 25 Years | 755 (62.2%) | 459 (37.8%) |
| 26 to 34 Years | 1,706 (82.1%) | 373 (17.9%) |
| 35 to 44 Years | 2,139 (91.6%) | 197 (8.4%) |
| 45 to 54 Years | 2,522 (92.0%) | 220 (8.0%) |
| 55 to 64 Years | 2,678 (93.8%) | 176 (6.2%) |
| 65 to 74 Years | 2,314 (99.2%) | 19 (0.8%) |
| 75 Years and older | 1,645 (100.0%) | 0 (0.0%) |
| Total | 18,275 (91.4%) | 1,718 (8.6%) |
Health Insurance Coverage by Citizenship Status in Morgan County
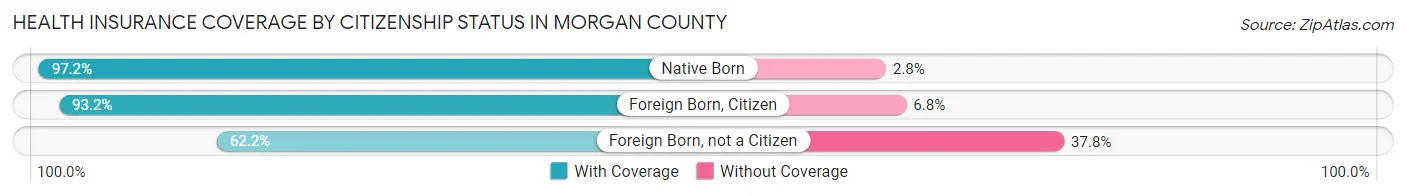
| Citizenship Status | With Coverage | Without Coverage |
| Native Born | 1,252 (97.2%) | 36 (2.8%) |
| Foreign Born, Citizen | 3,264 (93.2%) | 238 (6.8%) |
| Foreign Born, not a Citizen | 755 (62.2%) | 459 (37.8%) |
Health Insurance Coverage by Household Income in Morgan County
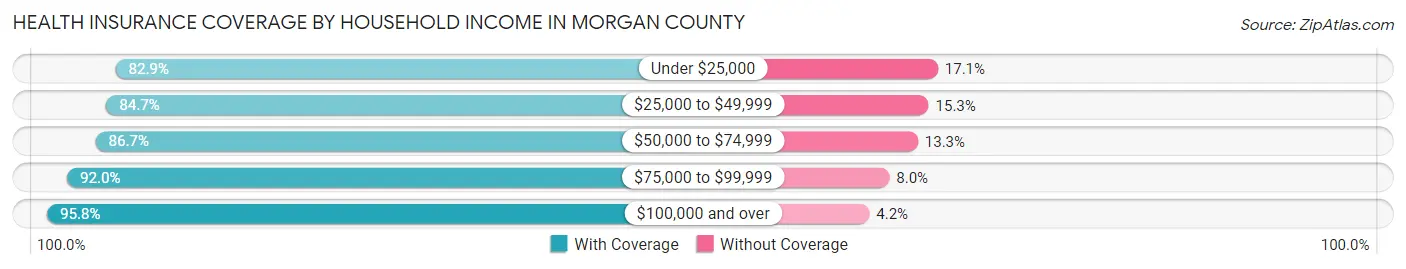
| Household Income | With Coverage | Without Coverage |
| Under $25,000 | 1,274 (82.9%) | 262 (17.1%) |
| $25,000 to $49,999 | 2,209 (84.7%) | 400 (15.3%) |
| $50,000 to $74,999 | 2,533 (86.7%) | 389 (13.3%) |
| $75,000 to $99,999 | 2,884 (92.0%) | 250 (8.0%) |
| $100,000 and over | 9,369 (95.8%) | 414 (4.2%) |
Public vs Private Health Insurance Coverage by Age in Morgan County
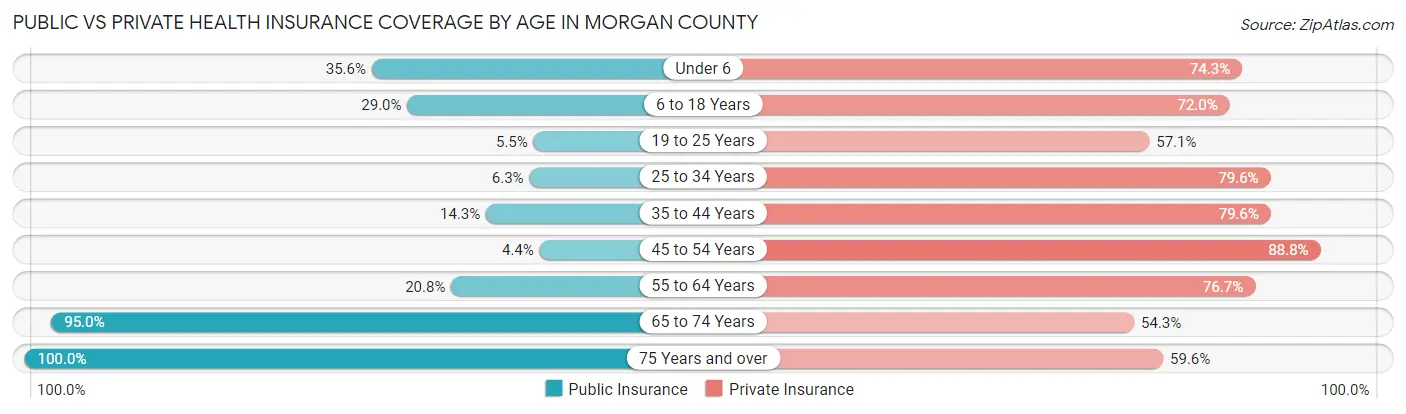
| Age Bracket | Public Insurance | Private Insurance |
| Under 6 | 458 (35.6%) | 957 (74.3%) |
| 6 to 18 Years | 1,014 (28.9%) | 2,520 (72.0%) |
| 19 to 25 Years | 67 (5.5%) | 693 (57.1%) |
| 25 to 34 Years | 131 (6.3%) | 1,654 (79.6%) |
| 35 to 44 Years | 335 (14.3%) | 1,860 (79.6%) |
| 45 to 54 Years | 121 (4.4%) | 2,436 (88.8%) |
| 55 to 64 Years | 594 (20.8%) | 2,189 (76.7%) |
| 65 to 74 Years | 2,217 (95.0%) | 1,266 (54.3%) |
| 75 Years and over | 1,645 (100.0%) | 981 (59.6%) |
| Total | 6,582 (32.9%) | 14,556 (72.8%) |
Disability Status by Sex by Age in Morgan County
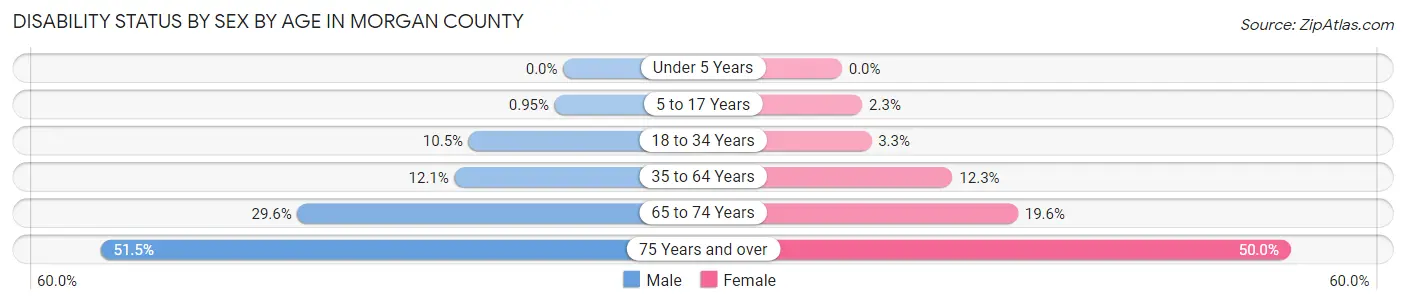
| Age Bracket | Male | Female |
| Under 5 Years | 0 (0.0%) | 0 (0.0%) |
| 5 to 17 Years | 18 (0.9%) | 38 (2.3%) |
| 18 to 34 Years | 181 (10.5%) | 60 (3.3%) |
| 35 to 64 Years | 480 (12.1%) | 489 (12.3%) |
| 65 to 74 Years | 322 (29.6%) | 244 (19.6%) |
| 75 Years and over | 352 (51.5%) | 481 (50.0%) |
Disability Class by Sex by Age in Morgan County
Disability Class: Hearing Difficulty
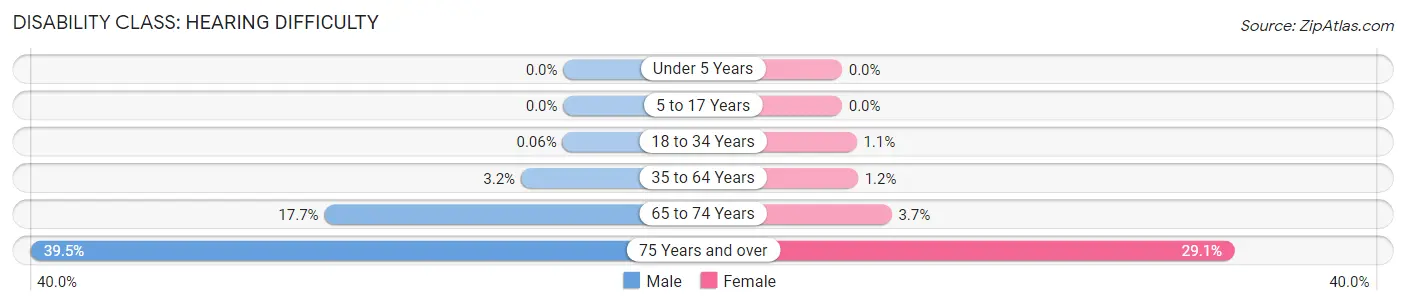
| Age Bracket | Male | Female |
| Under 5 Years | 0 (0.0%) | 0 (0.0%) |
| 5 to 17 Years | 0 (0.0%) | 0 (0.0%) |
| 18 to 34 Years | 1 (0.1%) | 20 (1.1%) |
| 35 to 64 Years | 125 (3.2%) | 47 (1.2%) |
| 65 to 74 Years | 193 (17.7%) | 46 (3.7%) |
| 75 Years and over | 270 (39.5%) | 280 (29.1%) |
Disability Class: Vision Difficulty
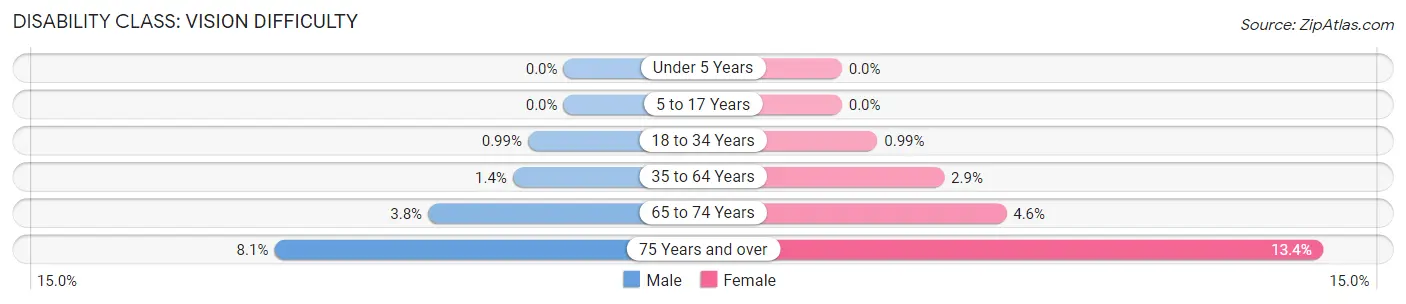
| Age Bracket | Male | Female |
| Under 5 Years | 0 (0.0%) | 0 (0.0%) |
| 5 to 17 Years | 0 (0.0%) | 0 (0.0%) |
| 18 to 34 Years | 17 (1.0%) | 18 (1.0%) |
| 35 to 64 Years | 56 (1.4%) | 113 (2.9%) |
| 65 to 74 Years | 41 (3.8%) | 57 (4.6%) |
| 75 Years and over | 55 (8.1%) | 129 (13.4%) |
Disability Class: Cognitive Difficulty
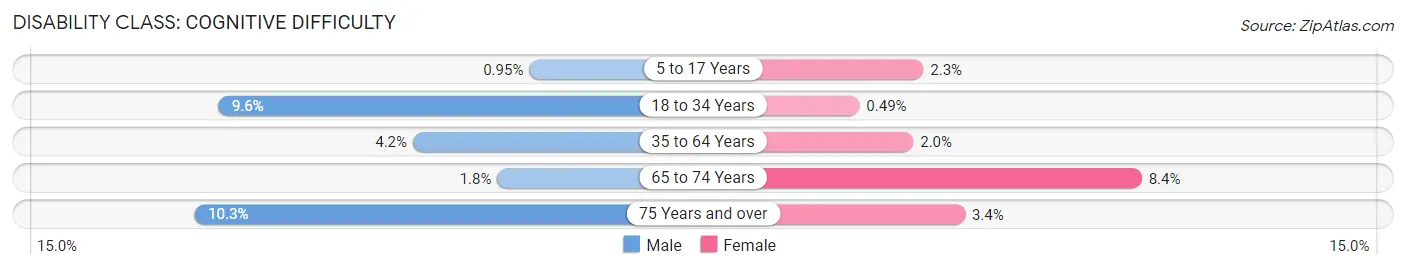
| Age Bracket | Male | Female |
| 5 to 17 Years | 18 (0.9%) | 38 (2.3%) |
| 18 to 34 Years | 165 (9.6%) | 9 (0.5%) |
| 35 to 64 Years | 166 (4.2%) | 79 (2.0%) |
| 65 to 74 Years | 20 (1.8%) | 104 (8.4%) |
| 75 Years and over | 70 (10.2%) | 33 (3.4%) |
Disability Class: Ambulatory Difficulty
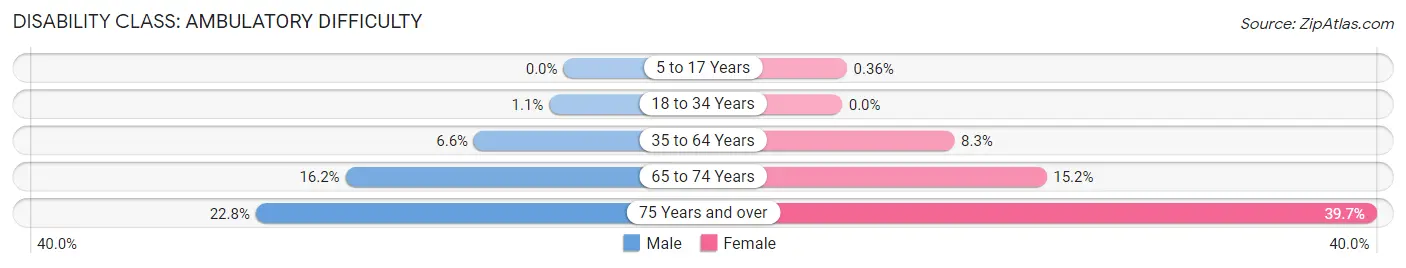
| Age Bracket | Male | Female |
| 5 to 17 Years | 0 (0.0%) | 6 (0.4%) |
| 18 to 34 Years | 18 (1.1%) | 0 (0.0%) |
| 35 to 64 Years | 263 (6.6%) | 331 (8.3%) |
| 65 to 74 Years | 176 (16.2%) | 189 (15.2%) |
| 75 Years and over | 156 (22.8%) | 382 (39.7%) |
Disability Class: Self-Care Difficulty
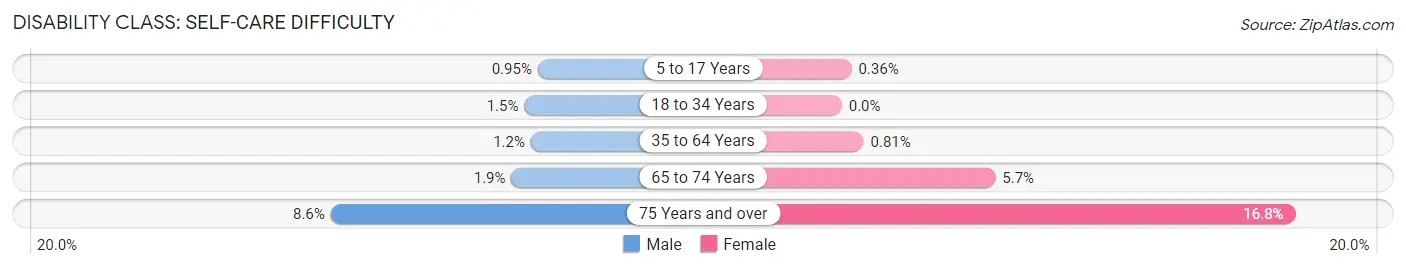
| Age Bracket | Male | Female |
| 5 to 17 Years | 18 (0.9%) | 6 (0.4%) |
| 18 to 34 Years | 25 (1.5%) | 0 (0.0%) |
| 35 to 64 Years | 48 (1.2%) | 32 (0.8%) |
| 65 to 74 Years | 21 (1.9%) | 71 (5.7%) |
| 75 Years and over | 59 (8.6%) | 162 (16.8%) |
Technology Access in Morgan County
Computing Device Access in Morgan County
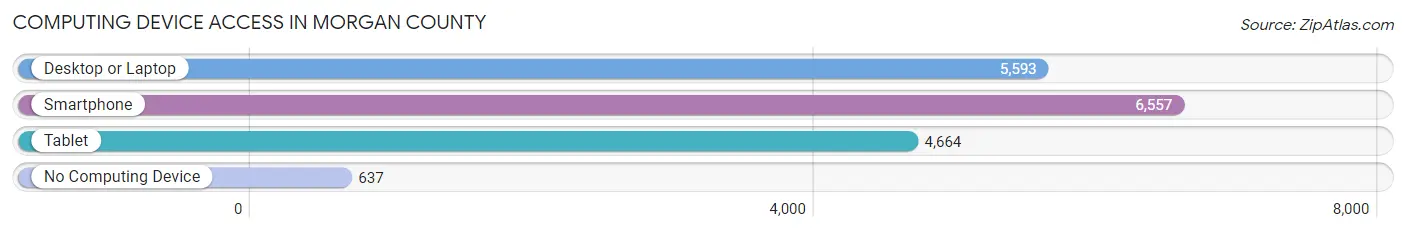
| Device Type | # Households | % Households |
| Desktop or Laptop | 5,593 | 73.7% |
| Smartphone | 6,557 | 86.4% |
| Tablet | 4,664 | 61.5% |
| No Computing Device | 637 | 8.4% |
| Total | 7,587 | 100.0% |
Internet Access in Morgan County
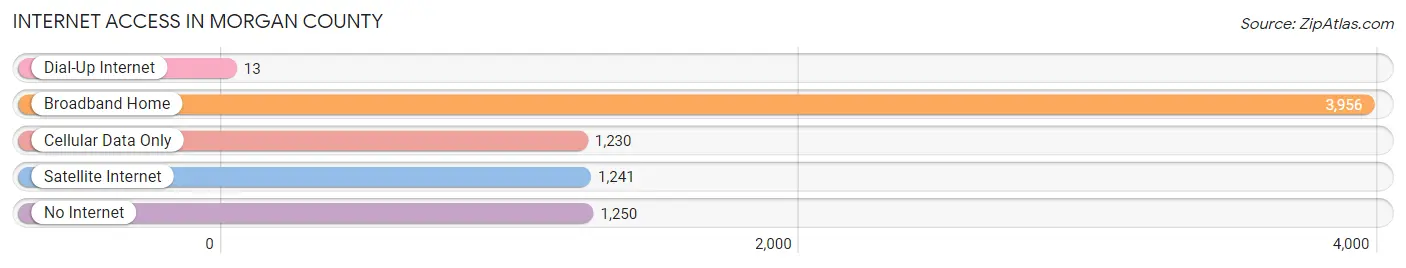
| Internet Type | # Households | % Households |
| Dial-Up Internet | 13 | 0.2% |
| Broadband Home | 3,956 | 52.1% |
| Cellular Data Only | 1,230 | 16.2% |
| Satellite Internet | 1,241 | 16.4% |
| No Internet | 1,250 | 16.5% |
| Total | 7,587 | 100.0% |
Morgan County Summary
Morgan County is located in the state of Georgia, in the United States of America. It is part of the Atlanta-Sandy Springs-Marietta Metropolitan Statistical Area. The county seat is Madison. As of the 2010 census, the population of Morgan County was 17,868.
Geography
Morgan County is located in the Piedmont region of Georgia, in the foothills of the Blue Ridge Mountains. It is bordered by Greene County to the north, Oconee County to the east, Walton County to the south, and Newton County to the west. The county covers an area of approximately 437 square miles. The terrain is mostly hilly, with some flat areas in the northern part of the county. The highest point in the county is located at the summit of Rocky Mountain, which has an elevation of 1,845 feet.
The county is drained by the Apalachee River, which flows through the western part of the county. Other major waterways include the Oconee River, which forms the eastern border of the county, and the Middle Oconee River, which flows through the northern part of the county.
History
Morgan County was created in 1807 from parts of Greene, Walton, and Jackson counties. It was named for General Daniel Morgan, a Revolutionary War hero. The county seat was originally located in Madison, which was founded in 1809.
The county was largely agricultural in the 19th century, with cotton being the main crop. The county also had several gristmills and sawmills. The railroad arrived in the county in the late 19th century, connecting Madison to Athens and Atlanta.
In the early 20th century, the county began to industrialize, with several factories being built in Madison. The county also became a popular tourist destination, with several resorts being built in the area.
Economy
The economy of Morgan County is largely based on agriculture and manufacturing. The county is home to several large farms, which produce cotton, corn, soybeans, and other crops. The county also has several manufacturing plants, which produce a variety of products, including furniture, textiles, and automotive parts.
The county is also home to several tourist attractions, including the Madison-Morgan Cultural Center, the Madison-Morgan County Historical Society, and the Madison-Morgan County Chamber of Commerce.
Demographics
As of the 2010 census, the population of Morgan County was 17,868. The racial makeup of the county was 79.3% White, 17.2% African American, 0.4% Native American, 0.7% Asian, 0.1% Pacific Islander, 1.2% from other races, and 1.1% from two or more races. Hispanic or Latino of any race were 3.2% of the population.
The median household income in the county was $41,945, and the median family income was $50,945. The per capita income was $20,945. About 11.2% of the population was below the poverty line.
Common Questions
What is Per Capita Income in Morgan County?
Per Capita income in Morgan County is $38,932.
What is the Median Family Income in Morgan County?
Median Family Income in Morgan County is $93,601.
What is the Median Household income in Morgan County?
Median Household Income in Morgan County is $81,524.
What is Income or Wage Gap in Morgan County?
Income or Wage Gap in Morgan County is 38.3%.
Women in Morgan County earn 61.7 cents for every dollar earned by a man.
What is Family Income Deficit in Morgan County?
Family Income Deficit in Morgan County is $10,304.
Families that are below poverty line in Morgan County earn $10,304 less on average than the poverty threshold level.
What is Inequality or Gini Index in Morgan County?
Inequality or Gini Index in Morgan County is 0.42.
What is the Total Population of Morgan County?
Total Population of Morgan County is 20,171.
What is the Total Male Population of Morgan County?
Total Male Population of Morgan County is 9,990.
What is the Total Female Population of Morgan County?
Total Female Population of Morgan County is 10,181.
What is the Ratio of Males per 100 Females in Morgan County?
There are 98.12 Males per 100 Females in Morgan County.
What is the Ratio of Females per 100 Males in Morgan County?
There are 101.91 Females per 100 Males in Morgan County.
What is the Median Population Age in Morgan County?
Median Population Age in Morgan County is 43.1 Years.
What is the Average Family Size in Morgan County
Average Family Size in Morgan County is 3.1 People.
What is the Average Household Size in Morgan County
Average Household Size in Morgan County is 2.6 People.
How Large is the Labor Force in Morgan County?
There are 10,147 People in the Labor Forcein in Morgan County.
What is the Percentage of People in the Labor Force in Morgan County?
62.3% of People are in the Labor Force in Morgan County.
What is the Unemployment Rate in Morgan County?
Unemployment Rate in Morgan County is 2.9%.