Buckhead, GA Map & Demographics
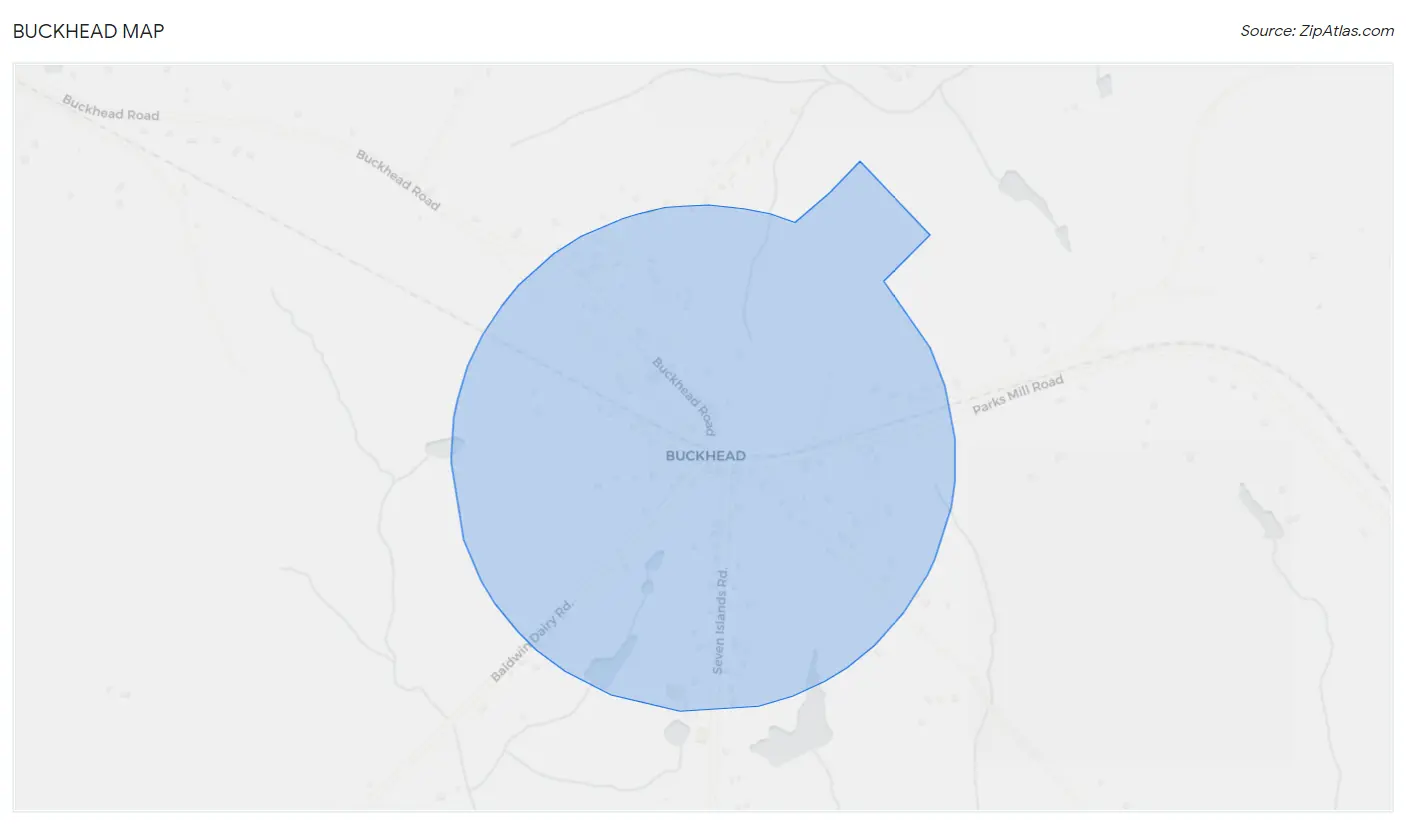
Buckhead Map
Buckhead Overview
$28,911
PER CAPITA INCOME
$71,875
AVG FAMILY INCOME
$68,854
AVG HOUSEHOLD INCOME
30.2%
WAGE / INCOME GAP [ % ]
69.8¢/ $1
WAGE / INCOME GAP [ $ ]
0.36
INEQUALITY / GINI INDEX
183
TOTAL POPULATION
104
MALE POPULATION
79
FEMALE POPULATION
131.65
MALES / 100 FEMALES
75.96
FEMALES / 100 MALES
42.1
MEDIAN AGE
2.6
AVG FAMILY SIZE
2.2
AVG HOUSEHOLD SIZE
98
LABOR FORCE [ PEOPLE ]
62.0%
PERCENT IN LABOR FORCE
7.1%
UNEMPLOYMENT RATE
Buckhead Zip Codes
Income in Buckhead
Income Overview in Buckhead
Per Capita Income in Buckhead is $28,911, while median incomes of families and households are $71,875 and $68,854 respectively.
| Characteristic | Number | Measure |
| Per Capita Income | 183 | $28,911 |
| Median Family Income | 55 | $71,875 |
| Mean Family Income | 55 | $84,416 |
| Median Household Income | 83 | $68,854 |
| Mean Household Income | 83 | $69,427 |
| Income Deficit | 55 | $0 |
| Wage / Income Gap (%) | 183 | 30.18% |
| Wage / Income Gap ($) | 183 | 69.82¢ per $1 |
| Gini / Inequality Index | 183 | 0.36 |
Earnings by Sex in Buckhead
Average Earnings in Buckhead are $56,887, $62,463 for men and $43,611 for women, a difference of 30.2%.
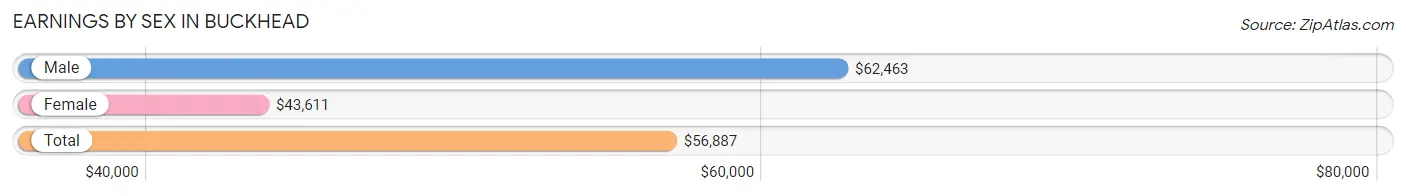
| Sex | Number | Average Earnings |
| Male | 68 (70.8%) | $62,463 |
| Female | 28 (29.2%) | $43,611 |
| Total | 96 (100.0%) | $56,887 |
Earnings by Sex by Income Bracket in Buckhead
The most common earnings brackets in Buckhead are $30,000 to $34,999 for men (15 | 22.1%) and $75,000 to $99,999 for women (7 | 25.0%).

| Income | Male | Female |
| $2,499 or less | 0 (0.0%) | 0 (0.0%) |
| $2,500 to $4,999 | 0 (0.0%) | 1 (3.6%) |
| $5,000 to $7,499 | 0 (0.0%) | 0 (0.0%) |
| $7,500 to $9,999 | 1 (1.5%) | 2 (7.1%) |
| $10,000 to $12,499 | 0 (0.0%) | 0 (0.0%) |
| $12,500 to $14,999 | 14 (20.6%) | 6 (21.4%) |
| $15,000 to $17,499 | 0 (0.0%) | 0 (0.0%) |
| $17,500 to $19,999 | 0 (0.0%) | 3 (10.7%) |
| $20,000 to $22,499 | 0 (0.0%) | 3 (10.7%) |
| $22,500 to $24,999 | 7 (10.3%) | 4 (14.3%) |
| $25,000 to $29,999 | 0 (0.0%) | 1 (3.6%) |
| $30,000 to $34,999 | 15 (22.1%) | 0 (0.0%) |
| $35,000 to $39,999 | 0 (0.0%) | 0 (0.0%) |
| $40,000 to $44,999 | 0 (0.0%) | 1 (3.6%) |
| $45,000 to $49,999 | 3 (4.4%) | 0 (0.0%) |
| $50,000 to $54,999 | 9 (13.2%) | 0 (0.0%) |
| $55,000 to $64,999 | 8 (11.8%) | 0 (0.0%) |
| $65,000 to $74,999 | 4 (5.9%) | 0 (0.0%) |
| $75,000 to $99,999 | 2 (2.9%) | 7 (25.0%) |
| $100,000+ | 5 (7.3%) | 0 (0.0%) |
| Total | 68 (100.0%) | 28 (100.0%) |
Earnings by Sex by Educational Attainment in Buckhead
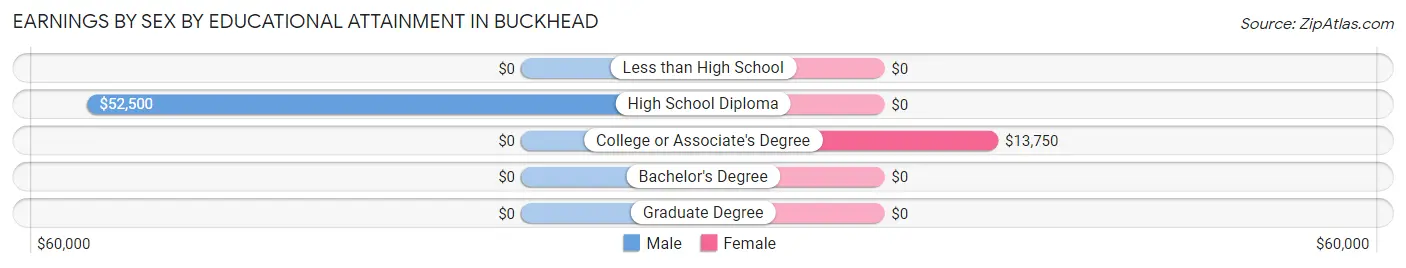
| Educational Attainment | Male Income | Female Income |
| Less than High School | - | - |
| High School Diploma | $52,500 | $0 |
| College or Associate's Degree | - | - |
| Bachelor's Degree | - | - |
| Graduate Degree | - | - |
| Total | $34,250 | $0 |
Family Income in Buckhead
Family Income Brackets in Buckhead
According to the Buckhead family income data, there are 22 families falling into the $50,000 to $74,999 income range, which is the most common income bracket and makes up 40.0% of all families.
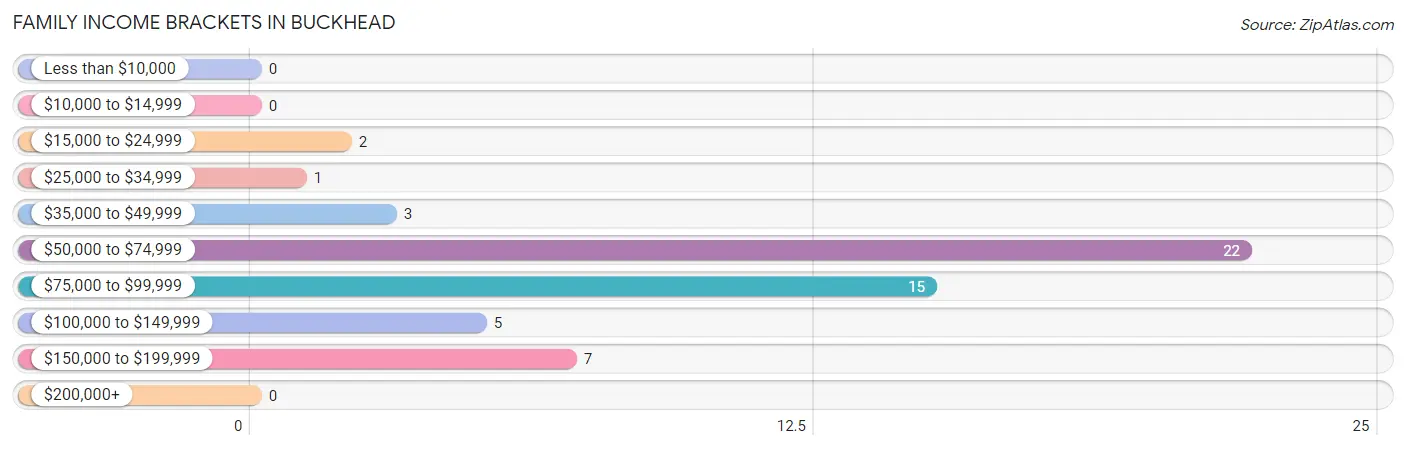
| Income Bracket | # Families | % Families |
| Less than $10,000 | 0 | 0.0% |
| $10,000 to $14,999 | 0 | 0.0% |
| $15,000 to $24,999 | 2 | 3.6% |
| $25,000 to $34,999 | 1 | 1.8% |
| $35,000 to $49,999 | 3 | 5.5% |
| $50,000 to $74,999 | 22 | 40.0% |
| $75,000 to $99,999 | 15 | 27.3% |
| $100,000 to $149,999 | 5 | 9.1% |
| $150,000 to $199,999 | 7 | 12.7% |
| $200,000+ | 0 | 0.0% |
Family Income by Famaliy Size in Buckhead
4-person families (14 | 25.5%) account for the highest median family income in Buckhead with $91,786 per family, while 2-person families (14 | 25.5%) have the highest median income of $34,375 per family member.
| Income Bracket | # Families | Median Income |
| 2-Person Families | 14 (25.5%) | $68,750 |
| 3-Person Families | 26 (47.3%) | $69,500 |
| 4-Person Families | 14 (25.5%) | $91,786 |
| 5-Person Families | 1 (1.8%) | $0 |
| 6-Person Families | 0 (0.0%) | $0 |
| 7+ Person Families | 0 (0.0%) | $0 |
| Total | 55 (100.0%) | $71,875 |
Family Income by Number of Earners in Buckhead
| Number of Earners | # Families | Median Income |
| No Earners | 2 (3.6%) | $0 |
| 1 Earner | 20 (36.4%) | $68,750 |
| 2 Earners | 25 (45.5%) | $0 |
| 3+ Earners | 8 (14.5%) | $0 |
| Total | 55 (100.0%) | $71,875 |
Household Income in Buckhead
Household Income Brackets in Buckhead
With 26 households falling in the category, the $50,000 to $74,999 income range is the most frequent in Buckhead, accounting for 31.3% of all households.
| Income Bracket | # Households | % Households |
| Less than $10,000 | 14 | 16.9% |
| $10,000 to $14,999 | 0 | 0.0% |
| $15,000 to $24,999 | 5 | 6.0% |
| $25,000 to $34,999 | 1 | 1.2% |
| $35,000 to $49,999 | 3 | 3.6% |
| $50,000 to $74,999 | 26 | 31.3% |
| $75,000 to $99,999 | 9 | 10.8% |
| $100,000 to $149,999 | 18 | 21.7% |
| $150,000 to $199,999 | 7 | 8.4% |
| $200,000+ | 0 | 0.0% |
Household Income by Householder Age in Buckhead
The median household income in Buckhead is $68,854, with the highest median household income of $65,000 found in the 45 to 64 years age bracket for the primary householder. A total of 34 households (41.0%) fall into this category.
| Income Bracket | # Households | Median Income |
| 15 to 24 Years | 0 (0.0%) | $0 |
| 25 to 44 Years | 26 (31.3%) | $0 |
| 45 to 64 Years | 34 (41.0%) | $65,000 |
| 65+ Years | 23 (27.7%) | $0 |
| Total | 83 (100.0%) | $68,854 |
Poverty in Buckhead
Income Below Poverty by Sex and Age in Buckhead
With 1.0% poverty level for males and 26.6% for females among the residents of Buckhead, 65 to 74 year old males and 25 to 34 year old females are the most vulnerable to poverty, with 1 males (14.3%) and 8 females (80.0%) in their respective age groups living below the poverty level.
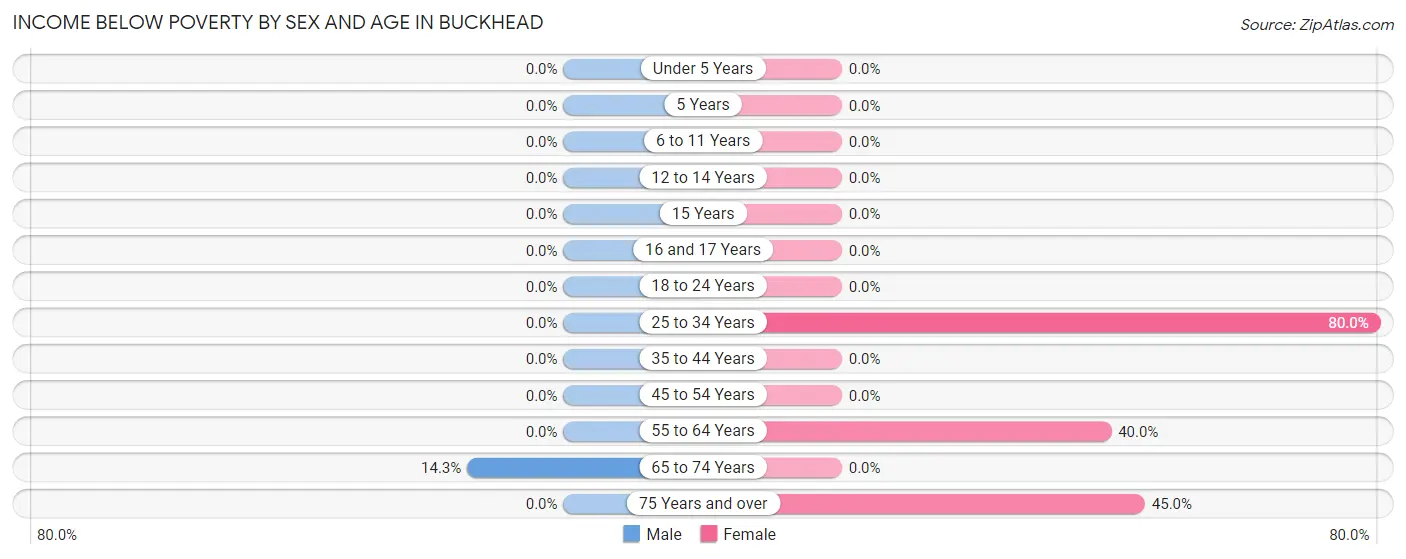
| Age Bracket | Male | Female |
| Under 5 Years | 0 (0.0%) | 0 (0.0%) |
| 5 Years | 0 (0.0%) | 0 (0.0%) |
| 6 to 11 Years | 0 (0.0%) | 0 (0.0%) |
| 12 to 14 Years | 0 (0.0%) | 0 (0.0%) |
| 15 Years | 0 (0.0%) | 0 (0.0%) |
| 16 and 17 Years | 0 (0.0%) | 0 (0.0%) |
| 18 to 24 Years | 0 (0.0%) | 0 (0.0%) |
| 25 to 34 Years | 0 (0.0%) | 8 (80.0%) |
| 35 to 44 Years | 0 (0.0%) | 0 (0.0%) |
| 45 to 54 Years | 0 (0.0%) | 0 (0.0%) |
| 55 to 64 Years | 0 (0.0%) | 4 (40.0%) |
| 65 to 74 Years | 1 (14.3%) | 0 (0.0%) |
| 75 Years and over | 0 (0.0%) | 9 (45.0%) |
| Total | 1 (1.0%) | 21 (26.6%) |
Income Above Poverty by Sex and Age in Buckhead
According to the poverty statistics in Buckhead, males aged 6 to 11 years and females aged 5 years are the age groups that are most secure financially, with 100.0% of males and 100.0% of females in these age groups living above the poverty line.
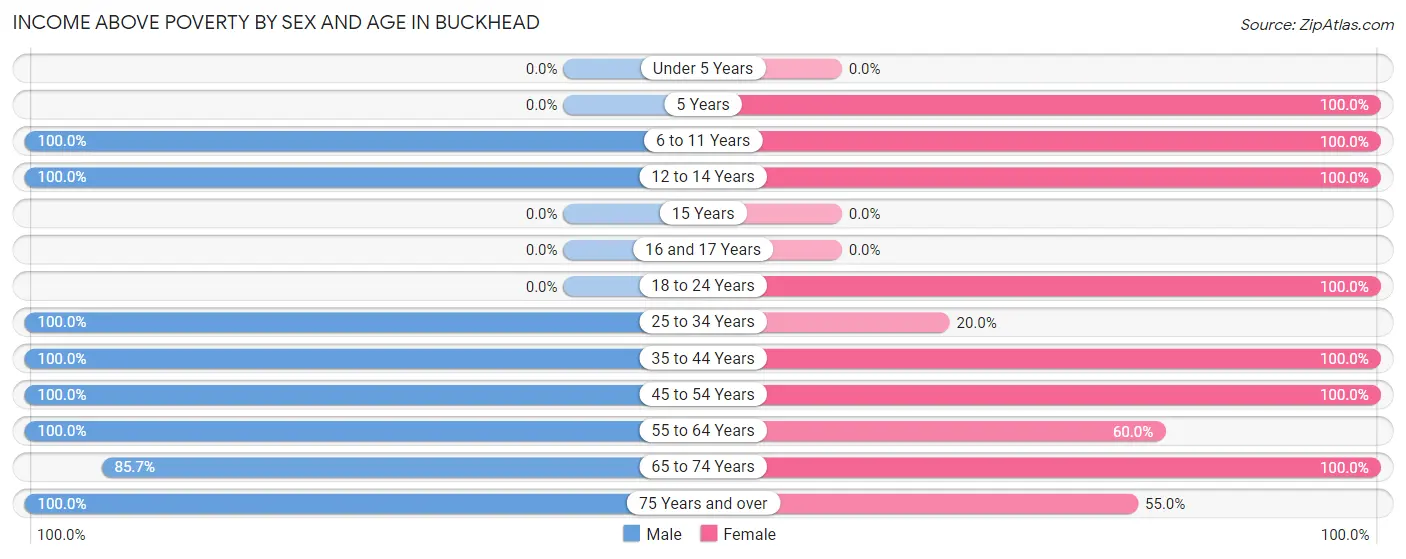
| Age Bracket | Male | Female |
| Under 5 Years | 0 (0.0%) | 0 (0.0%) |
| 5 Years | 0 (0.0%) | 1 (100.0%) |
| 6 to 11 Years | 13 (100.0%) | 5 (100.0%) |
| 12 to 14 Years | 4 (100.0%) | 2 (100.0%) |
| 15 Years | 0 (0.0%) | 0 (0.0%) |
| 16 and 17 Years | 0 (0.0%) | 0 (0.0%) |
| 18 to 24 Years | 0 (0.0%) | 4 (100.0%) |
| 25 to 34 Years | 15 (100.0%) | 2 (20.0%) |
| 35 to 44 Years | 32 (100.0%) | 14 (100.0%) |
| 45 to 54 Years | 14 (100.0%) | 8 (100.0%) |
| 55 to 64 Years | 16 (100.0%) | 6 (60.0%) |
| 65 to 74 Years | 6 (85.7%) | 5 (100.0%) |
| 75 Years and over | 3 (100.0%) | 11 (55.0%) |
| Total | 103 (99.0%) | 58 (73.4%) |
Income Below Poverty Among Married-Couple Families in Buckhead
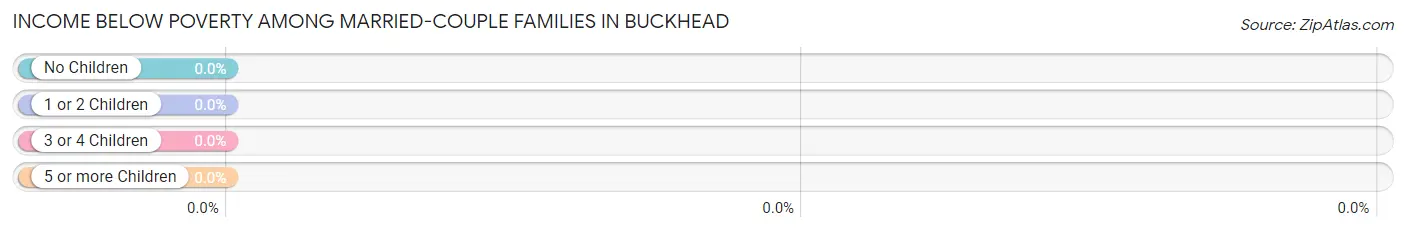
| Children | Above Poverty | Below Poverty |
| No Children | 12 (100.0%) | 0 (0.0%) |
| 1 or 2 Children | 20 (100.0%) | 0 (0.0%) |
| 3 or 4 Children | 0 (0.0%) | 0 (0.0%) |
| 5 or more Children | 0 (0.0%) | 0 (0.0%) |
| Total | 32 (100.0%) | 0 (0.0%) |
Income Below Poverty Among Single-Parent Households in Buckhead
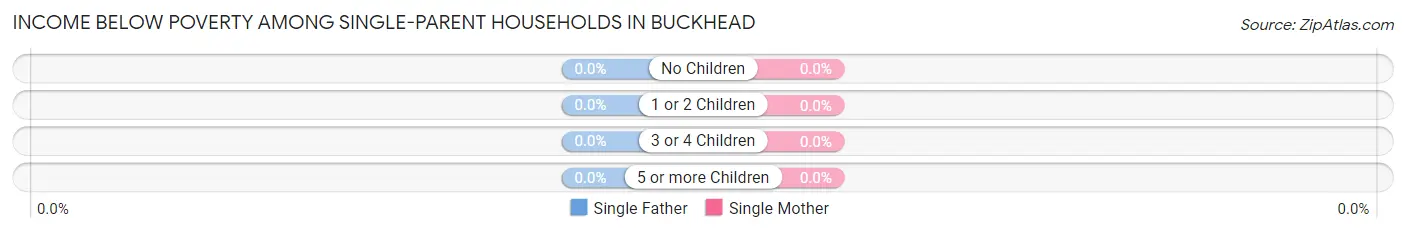
| Children | Single Father | Single Mother |
| No Children | 0 (0.0%) | 0 (0.0%) |
| 1 or 2 Children | 0 (0.0%) | 0 (0.0%) |
| 3 or 4 Children | 0 (0.0%) | 0 (0.0%) |
| 5 or more Children | 0 (0.0%) | 0 (0.0%) |
| Total | 0 (0.0%) | 0 (0.0%) |
Income Below Poverty Among Married-Couple vs Single-Parent Households in Buckhead
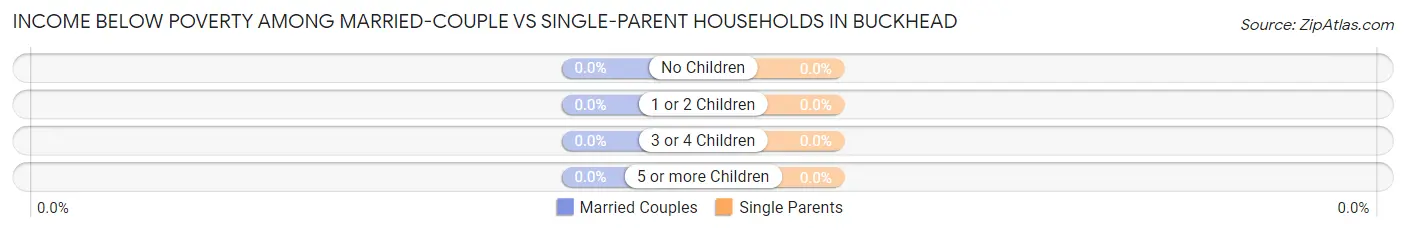
| Children | Married-Couple Families | Single-Parent Households |
| No Children | 0 (0.0%) | 0 (0.0%) |
| 1 or 2 Children | 0 (0.0%) | 0 (0.0%) |
| 3 or 4 Children | 0 (0.0%) | 0 (0.0%) |
| 5 or more Children | 0 (0.0%) | 0 (0.0%) |
| Total | 0 (0.0%) | 0 (0.0%) |
Race in Buckhead
The most populous races in Buckhead are White / Caucasian (159 | 86.9%), Black / African American (20 | 10.9%), and Hispanic or Latino (7 | 3.8%).
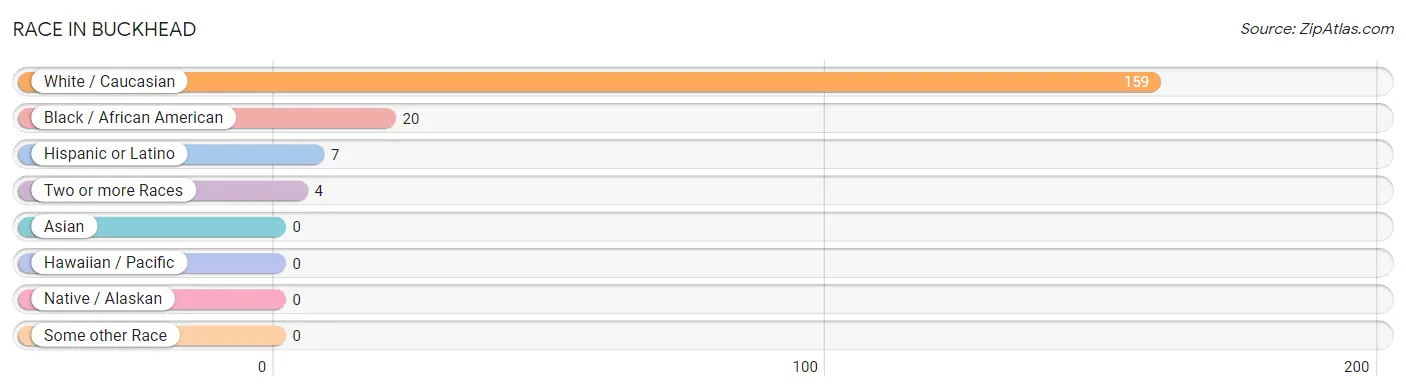
| Race | # Population | % Population |
| Asian | 0 | 0.0% |
| Black / African American | 20 | 10.9% |
| Hawaiian / Pacific | 0 | 0.0% |
| Hispanic or Latino | 7 | 3.8% |
| Native / Alaskan | 0 | 0.0% |
| White / Caucasian | 159 | 86.9% |
| Two or more Races | 4 | 2.2% |
| Some other Race | 0 | 0.0% |
| Total | 183 | 100.0% |
Ancestry in Buckhead
The most populous ancestries reported in Buckhead are American (64 | 35.0%), English (32 | 17.5%), Scottish (18 | 9.8%), Irish (13 | 7.1%), and German (12 | 6.6%), together accounting for 76.0% of all Buckhead residents.
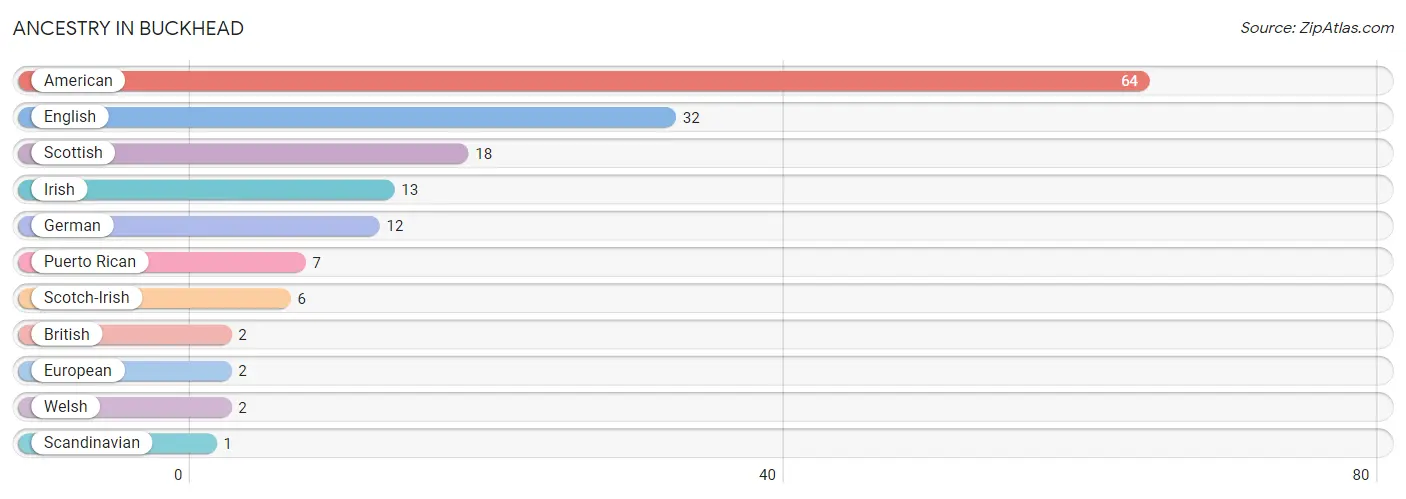
| Ancestry | # Population | % Population |
| American | 64 | 35.0% |
| British | 2 | 1.1% |
| English | 32 | 17.5% |
| European | 2 | 1.1% |
| German | 12 | 6.6% |
| Irish | 13 | 7.1% |
| Puerto Rican | 7 | 3.8% |
| Scandinavian | 1 | 0.5% |
| Scotch-Irish | 6 | 3.3% |
| Scottish | 18 | 9.8% |
| Welsh | 2 | 1.1% | View All 11 Rows |
Immigrants in Buckhead
The most numerous immigrant groups reported in Buckhead came from England (3 | 1.6%), Europe (3 | 1.6%), and Northern Europe (3 | 1.6%), together accounting for 4.9% of all Buckhead residents.
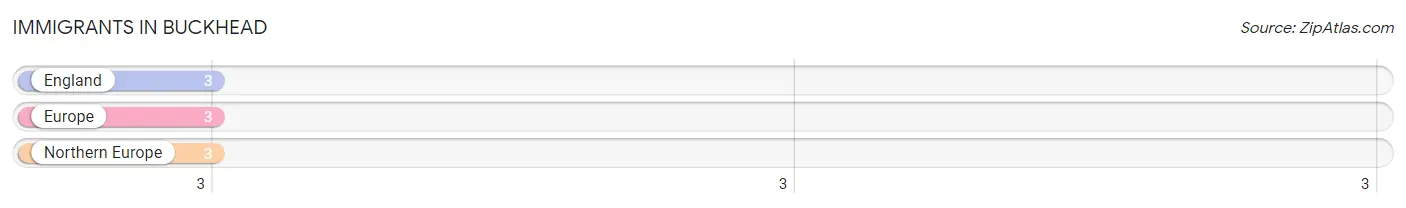
| Immigration Origin | # Population | % Population |
| England | 3 | 1.6% |
| Europe | 3 | 1.6% |
| Northern Europe | 3 | 1.6% | View All 3 Rows |
Sex and Age in Buckhead
Sex and Age in Buckhead
The most populous age groups in Buckhead are 35 to 39 Years (16 | 15.4%) for men and 35 to 39 Years (14 | 17.7%) for women.
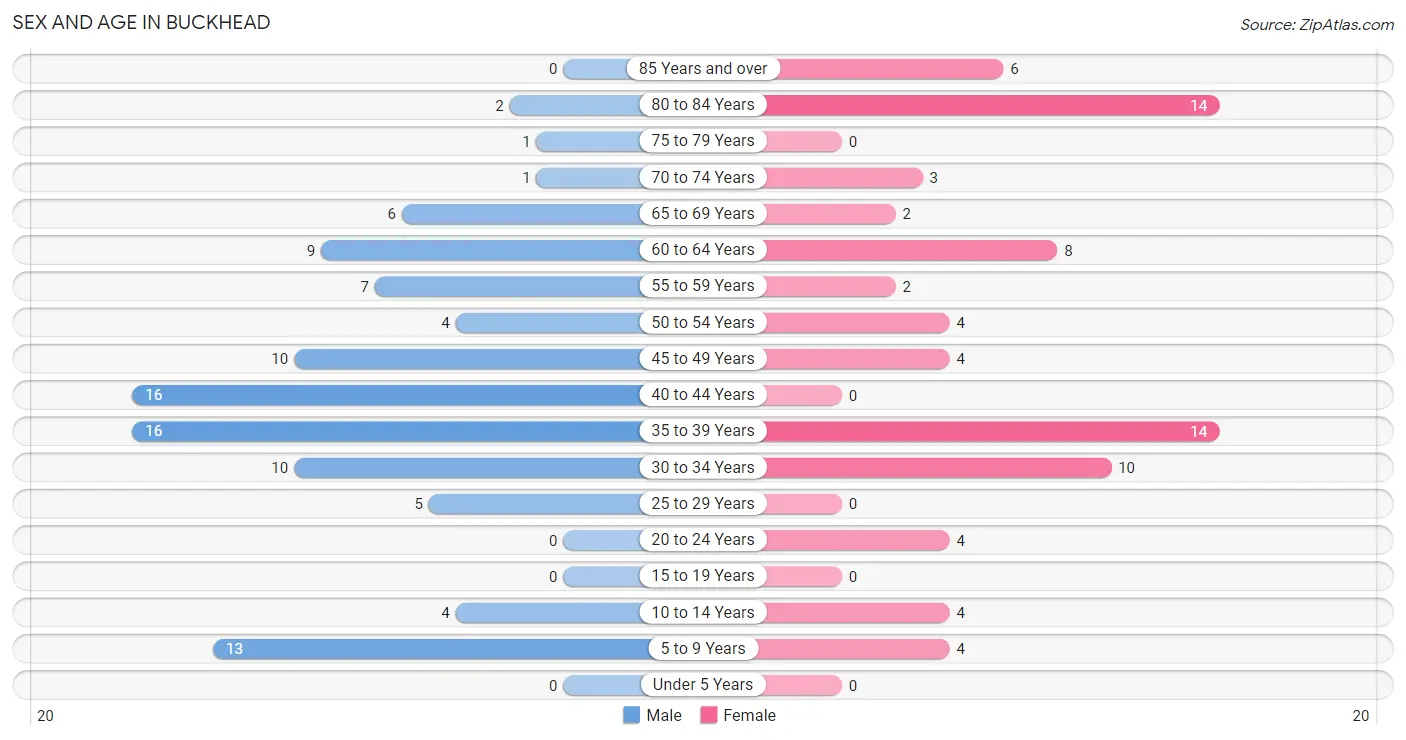
| Age Bracket | Male | Female |
| Under 5 Years | 0 (0.0%) | 0 (0.0%) |
| 5 to 9 Years | 13 (12.5%) | 4 (5.1%) |
| 10 to 14 Years | 4 (3.8%) | 4 (5.1%) |
| 15 to 19 Years | 0 (0.0%) | 0 (0.0%) |
| 20 to 24 Years | 0 (0.0%) | 4 (5.1%) |
| 25 to 29 Years | 5 (4.8%) | 0 (0.0%) |
| 30 to 34 Years | 10 (9.6%) | 10 (12.7%) |
| 35 to 39 Years | 16 (15.4%) | 14 (17.7%) |
| 40 to 44 Years | 16 (15.4%) | 0 (0.0%) |
| 45 to 49 Years | 10 (9.6%) | 4 (5.1%) |
| 50 to 54 Years | 4 (3.8%) | 4 (5.1%) |
| 55 to 59 Years | 7 (6.7%) | 2 (2.5%) |
| 60 to 64 Years | 9 (8.6%) | 8 (10.1%) |
| 65 to 69 Years | 6 (5.8%) | 2 (2.5%) |
| 70 to 74 Years | 1 (1.0%) | 3 (3.8%) |
| 75 to 79 Years | 1 (1.0%) | 0 (0.0%) |
| 80 to 84 Years | 2 (1.9%) | 14 (17.7%) |
| 85 Years and over | 0 (0.0%) | 6 (7.6%) |
| Total | 104 (100.0%) | 79 (100.0%) |
Families and Households in Buckhead
Median Family Size in Buckhead
The median family size in Buckhead is 2.65 persons per family, with married-couple families (32 | 58.2%) accounting for the largest median family size of 2.91 persons per family. On the other hand, single female/mother families (6 | 10.9%) represent the smallest median family size with 2.17 persons per family.
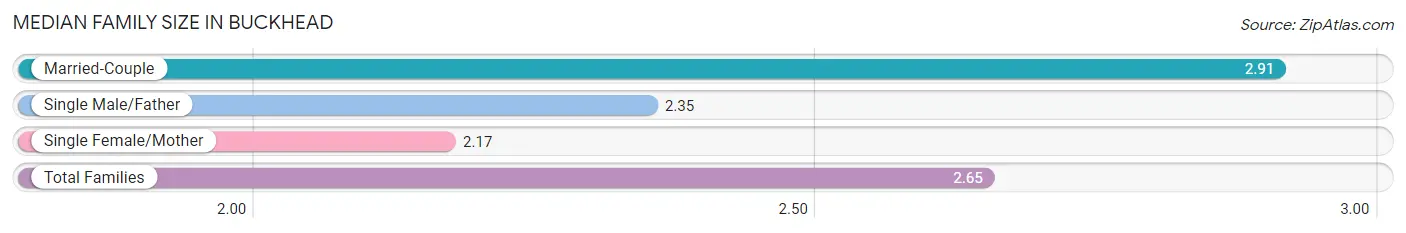
| Family Type | # Families | Family Size |
| Married-Couple | 32 (58.2%) | 2.91 |
| Single Male/Father | 17 (30.9%) | 2.35 |
| Single Female/Mother | 6 (10.9%) | 2.17 |
| Total Families | 55 (100.0%) | 2.65 |
Median Household Size in Buckhead
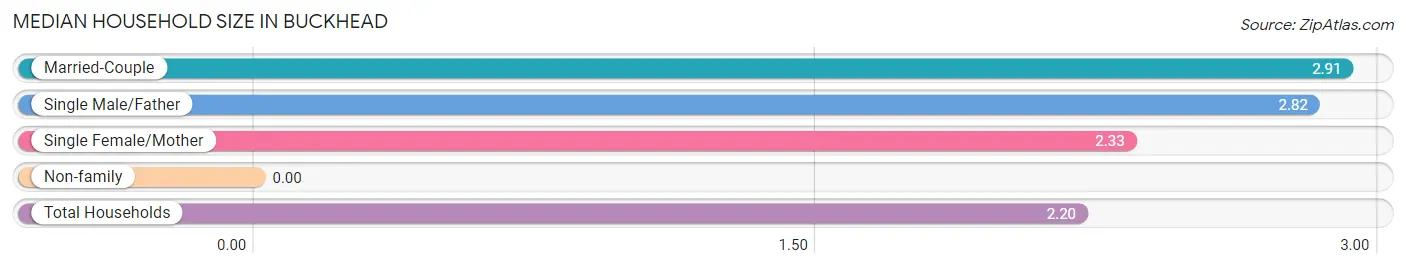
| Household Type | # Households | Household Size |
| Married-Couple | 32 (38.6%) | 2.91 |
| Single Male/Father | 17 (20.5%) | 2.82 |
| Single Female/Mother | 6 (7.2%) | 2.33 |
| Non-family | 28 (33.7%) | - |
| Total Households | 83 (100.0%) | 2.20 |
Household Size by Marriage Status in Buckhead
Out of a total of 83 households in Buckhead, 55 (66.3%) are family households, while 28 (33.7%) are nonfamily households. The most numerous type of family households are 3-person households, comprising 27, and the most common type of nonfamily households are 1-person households, comprising 28.
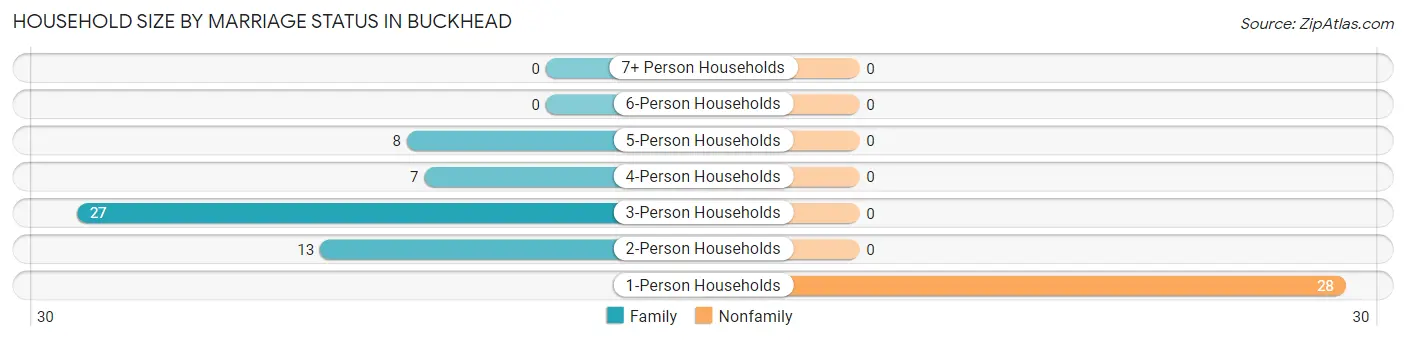
| Household Size | Family Households | Nonfamily Households |
| 1-Person Households | - | 28 (33.7%) |
| 2-Person Households | 13 (15.7%) | 0 (0.0%) |
| 3-Person Households | 27 (32.5%) | 0 (0.0%) |
| 4-Person Households | 7 (8.4%) | 0 (0.0%) |
| 5-Person Households | 8 (9.6%) | 0 (0.0%) |
| 6-Person Households | 0 (0.0%) | 0 (0.0%) |
| 7+ Person Households | 0 (0.0%) | 0 (0.0%) |
| Total | 55 (66.3%) | 28 (33.7%) |
Female Fertility in Buckhead
Fertility by Age in Buckhead
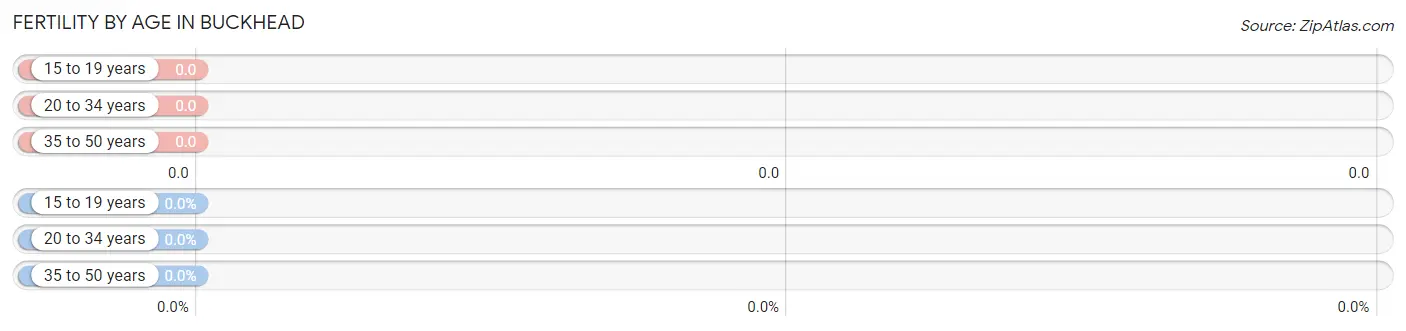
| Age Bracket | Women with Births | Births / 1,000 Women |
| 15 to 19 years | 0 (0.0%) | 0.0 |
| 20 to 34 years | 0 (0.0%) | 0.0 |
| 35 to 50 years | 0 (0.0%) | 0.0 |
| Total | 0 (0.0%) | 0.0 |
Fertility by Age by Marriage Status in Buckhead
| Age Bracket | Married | Unmarried |
| 15 to 19 years | 0 (0.0%) | 0 (0.0%) |
| 20 to 34 years | 0 (0.0%) | 0 (0.0%) |
| 35 to 50 years | 0 (0.0%) | 0 (0.0%) |
| Total | 0 (0.0%) | 0 (0.0%) |
Fertility by Education in Buckhead
| Educational Attainment | Women with Births | Births / 1,000 Women |
| Less than High School | 0 (0.0%) | 0.0 |
| High School Diploma | 0 (0.0%) | 0.0 |
| College or Associate's Degree | 0 (0.0%) | 0.0 |
| Bachelor's Degree | 0 (0.0%) | 0.0 |
| Graduate Degree | 0 (0.0%) | 0.0 |
| Total | 0 (0.0%) | 0.0 |
Fertility by Education by Marriage Status in Buckhead
| Educational Attainment | Married | Unmarried |
| Less than High School | 0 (0.0%) | 0 (0.0%) |
| High School Diploma | 0 (0.0%) | 0 (0.0%) |
| College or Associate's Degree | 0 (0.0%) | 0 (0.0%) |
| Bachelor's Degree | 0 (0.0%) | 0 (0.0%) |
| Graduate Degree | 0 (0.0%) | 0 (0.0%) |
| Total | 0 (0.0%) | 0 (0.0%) |
Employment Characteristics in Buckhead
Employment by Class of Employer in Buckhead
Among the 77 employed individuals in Buckhead, private company employees (52 | 67.5%), self-employed (not incorporated) (12 | 15.6%), and local government employees (10 | 13.0%) make up the most common classes of employment.
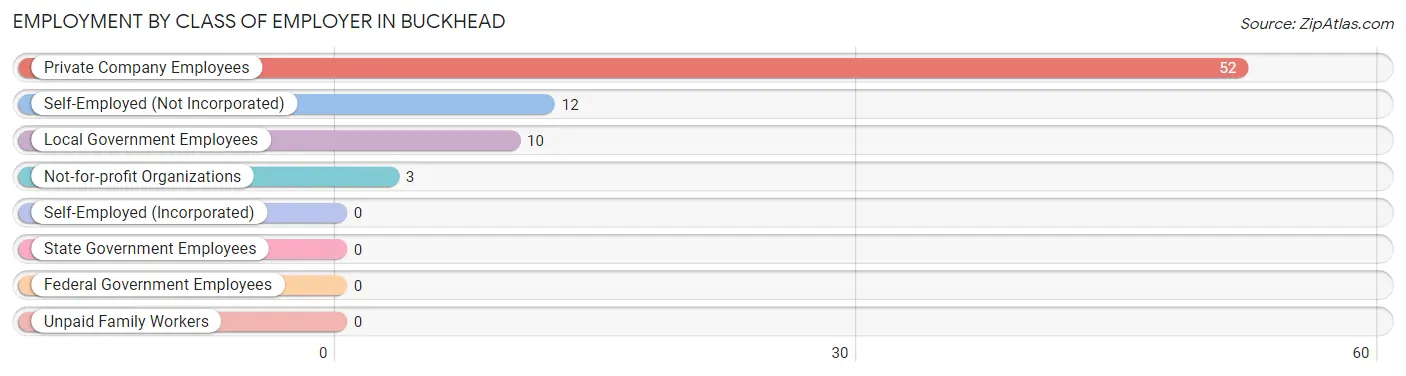
| Employer Class | # Employees | % Employees |
| Private Company Employees | 52 | 67.5% |
| Self-Employed (Incorporated) | 0 | 0.0% |
| Self-Employed (Not Incorporated) | 12 | 15.6% |
| Not-for-profit Organizations | 3 | 3.9% |
| Local Government Employees | 10 | 13.0% |
| State Government Employees | 0 | 0.0% |
| Federal Government Employees | 0 | 0.0% |
| Unpaid Family Workers | 0 | 0.0% |
| Total | 77 | 100.0% |
Employment Status by Age in Buckhead
According to the labor force statistics for Buckhead, out of the total population over 16 years of age (158), 62.0% or 98 individuals are in the labor force, with 7.1% or 7 of them unemployed. The age group with the highest labor force participation rate is 20 to 24 years, with 100.0% or 4 individuals in the labor force. Within the labor force, the 30 to 34 years age range has the highest percentage of unemployed individuals, with 58.3% or 7 of them being unemployed.
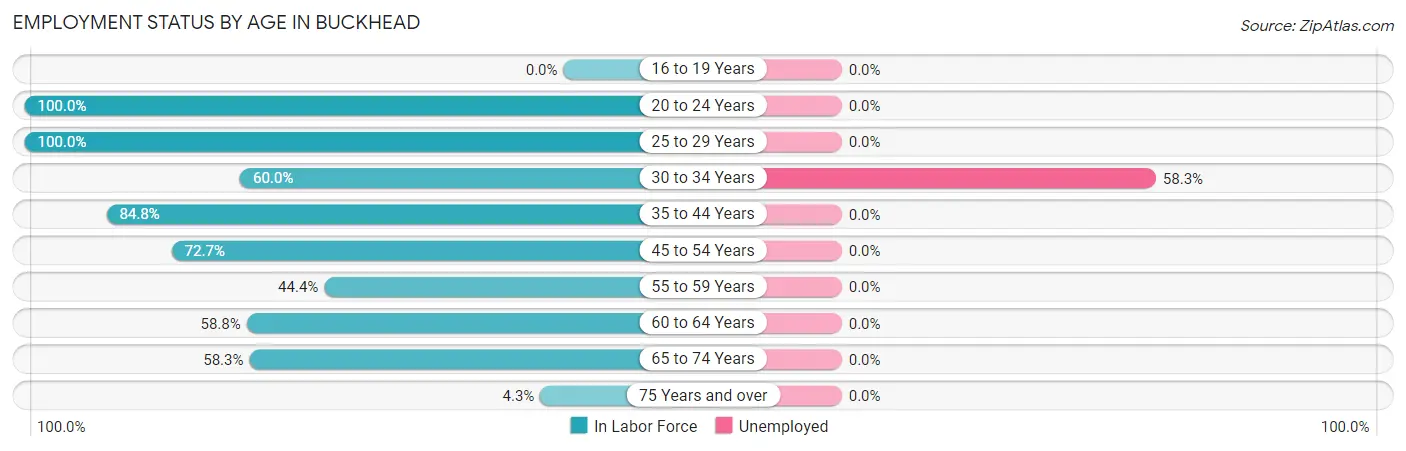
| Age Bracket | In Labor Force | Unemployed |
| 16 to 19 Years | 0 (0.0%) | 0 (0.0%) |
| 20 to 24 Years | 4 (100.0%) | 0 (0.0%) |
| 25 to 29 Years | 5 (100.0%) | 0 (0.0%) |
| 30 to 34 Years | 12 (60.0%) | 7 (58.3%) |
| 35 to 44 Years | 39 (84.8%) | 0 (0.0%) |
| 45 to 54 Years | 16 (72.7%) | 0 (0.0%) |
| 55 to 59 Years | 4 (44.4%) | 0 (0.0%) |
| 60 to 64 Years | 10 (58.8%) | 0 (0.0%) |
| 65 to 74 Years | 7 (58.3%) | 0 (0.0%) |
| 75 Years and over | 1 (4.3%) | 0 (0.0%) |
| Total | 98 (62.0%) | 7 (7.1%) |
Employment Status by Educational Attainment in Buckhead
According to labor force statistics for Buckhead, 72.3% of individuals (86) out of the total population between 25 and 64 years of age (119) are in the labor force, with 8.1% or 7 of them being unemployed. The group with the highest labor force participation rate are those with the educational attainment of college / associate degree, with 76.5% or 26 individuals in the labor force. Within the labor force, individuals with high school diploma education have the highest percentage of unemployment, with 15.9% or 7 of them being unemployed.
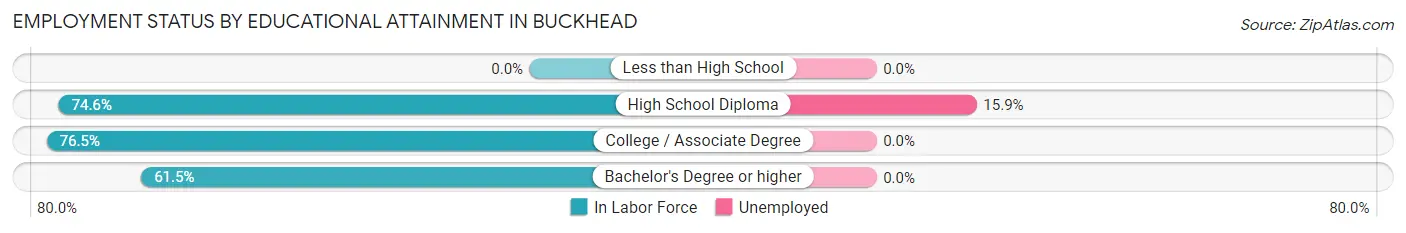
| Educational Attainment | In Labor Force | Unemployed |
| Less than High School | 0 (0.0%) | 0 (0.0%) |
| High School Diploma | 44 (74.6%) | 9 (15.9%) |
| College / Associate Degree | 26 (76.5%) | 0 (0.0%) |
| Bachelor's Degree or higher | 16 (61.5%) | 0 (0.0%) |
| Total | 86 (72.3%) | 10 (8.1%) |
Employment Occupations by Sex in Buckhead
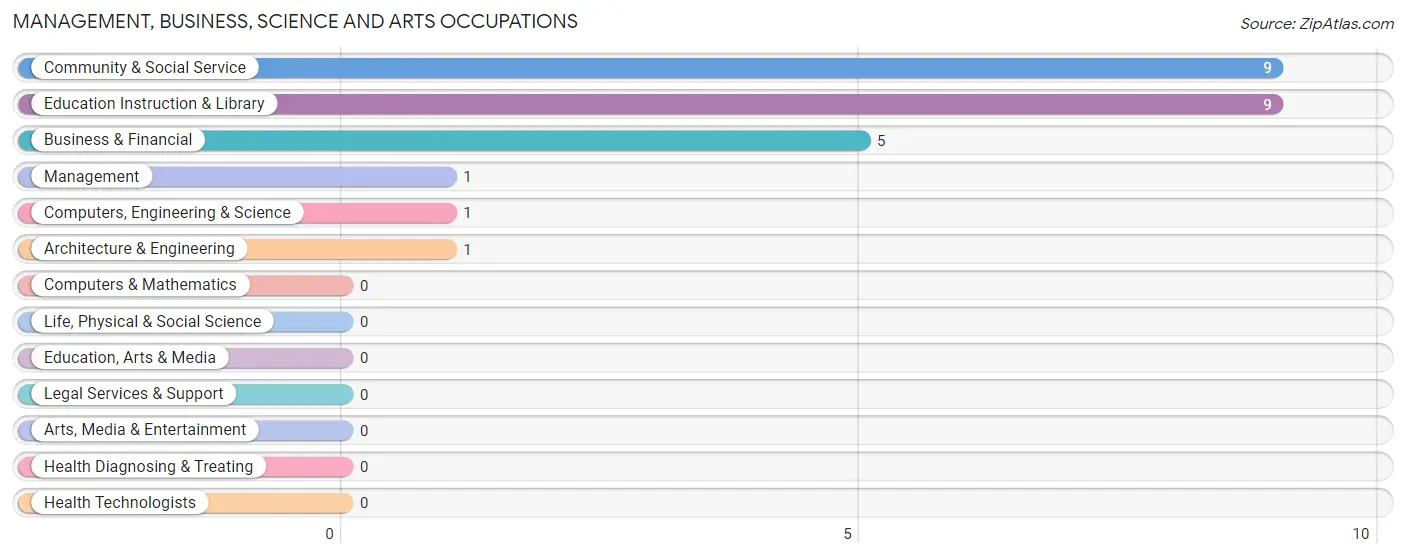
Management, Business, Science and Arts Occupations
The most common Management, Business, Science and Arts occupations in Buckhead are Community & Social Service (9 | 9.9%), Education Instruction & Library (9 | 9.9%), Business & Financial (5 | 5.5%), Management (1 | 1.1%), and Computers, Engineering & Science (1 | 1.1%).
Management, Business, Science and Arts Occupations by Sex
Within the Management, Business, Science and Arts occupations in Buckhead, the most male-oriented occupations are Management (100.0%), Business & Financial (100.0%), and Computers, Engineering & Science (100.0%), while the most female-oriented occupations are Community & Social Service (55.6%), and Education Instruction & Library (55.6%).
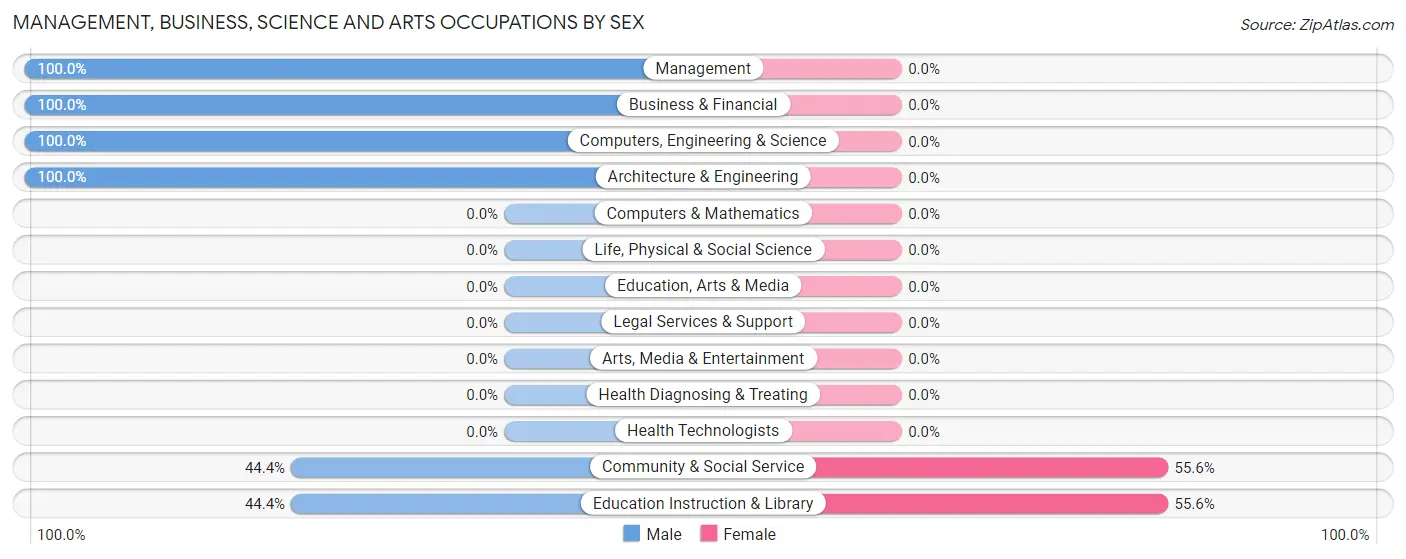
| Occupation | Male | Female |
| Management | 1 (100.0%) | 0 (0.0%) |
| Business & Financial | 5 (100.0%) | 0 (0.0%) |
| Computers, Engineering & Science | 1 (100.0%) | 0 (0.0%) |
| Computers & Mathematics | 0 (0.0%) | 0 (0.0%) |
| Architecture & Engineering | 1 (100.0%) | 0 (0.0%) |
| Life, Physical & Social Science | 0 (0.0%) | 0 (0.0%) |
| Community & Social Service | 4 (44.4%) | 5 (55.6%) |
| Education, Arts & Media | 0 (0.0%) | 0 (0.0%) |
| Legal Services & Support | 0 (0.0%) | 0 (0.0%) |
| Education Instruction & Library | 4 (44.4%) | 5 (55.6%) |
| Arts, Media & Entertainment | 0 (0.0%) | 0 (0.0%) |
| Health Diagnosing & Treating | 0 (0.0%) | 0 (0.0%) |
| Health Technologists | 0 (0.0%) | 0 (0.0%) |
| Total (Category) | 11 (68.8%) | 5 (31.2%) |
| Total (Overall) | 65 (71.4%) | 26 (28.6%) |
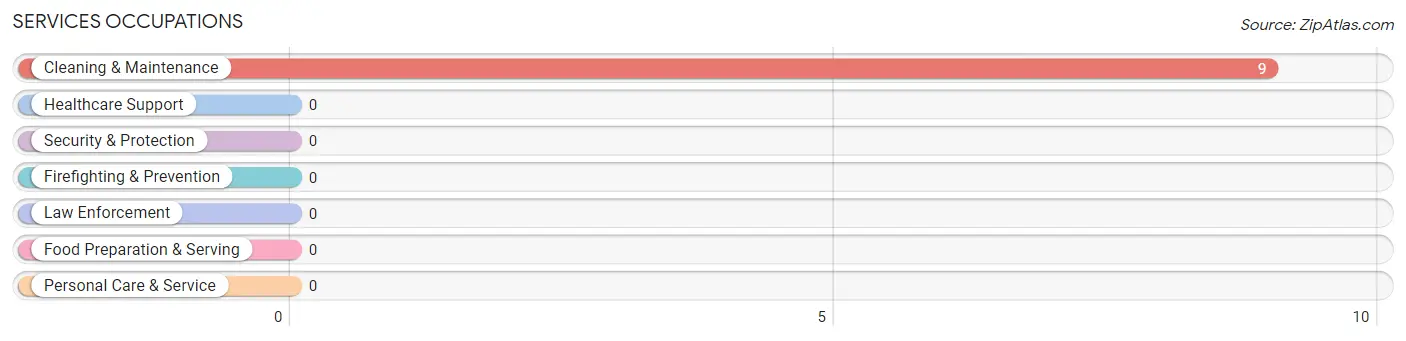
Services Occupations
The most common Services occupations in Buckhead are , and Cleaning & Maintenance (9 | 9.9%).
Services Occupations by Sex
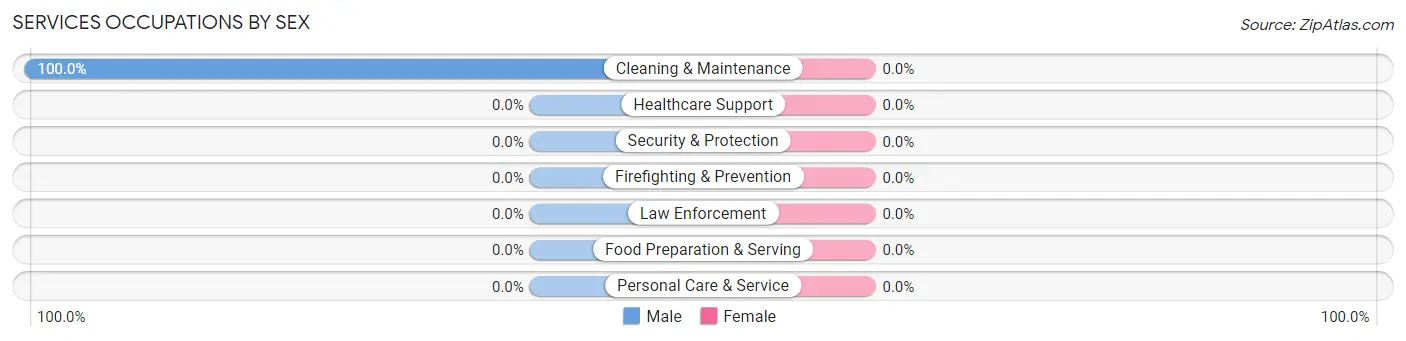
| Occupation | Male | Female |
| Healthcare Support | 0 (0.0%) | 0 (0.0%) |
| Security & Protection | 0 (0.0%) | 0 (0.0%) |
| Firefighting & Prevention | 0 (0.0%) | 0 (0.0%) |
| Law Enforcement | 0 (0.0%) | 0 (0.0%) |
| Food Preparation & Serving | 0 (0.0%) | 0 (0.0%) |
| Cleaning & Maintenance | 9 (100.0%) | 0 (0.0%) |
| Personal Care & Service | 0 (0.0%) | 0 (0.0%) |
| Total (Category) | 9 (100.0%) | 0 (0.0%) |
| Total (Overall) | 65 (71.4%) | 26 (28.6%) |
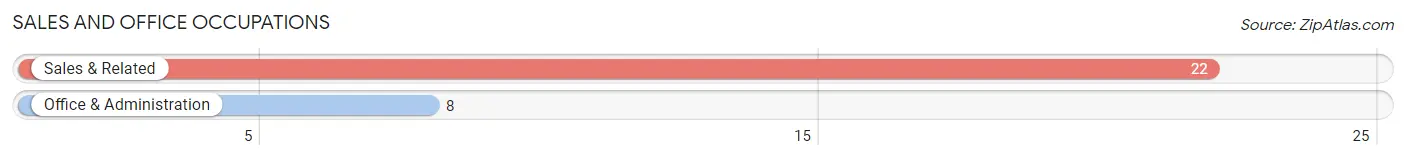
Sales and Office Occupations
The most common Sales and Office occupations in Buckhead are Sales & Related (22 | 24.2%), and Office & Administration (8 | 8.8%).
Sales and Office Occupations by Sex
| Occupation | Male | Female |
| Sales & Related | 17 (77.3%) | 5 (22.7%) |
| Office & Administration | 1 (12.5%) | 7 (87.5%) |
| Total (Category) | 18 (60.0%) | 12 (40.0%) |
| Total (Overall) | 65 (71.4%) | 26 (28.6%) |
Natural Resources, Construction and Maintenance Occupations
The most common Natural Resources, Construction and Maintenance occupations in Buckhead are Construction & Extraction (9 | 9.9%), Installation, Maintenance & Repair (8 | 8.8%), and Farming, Fishing & Forestry (1 | 1.1%).
Natural Resources, Construction and Maintenance Occupations by Sex
| Occupation | Male | Female |
| Farming, Fishing & Forestry | 0 (0.0%) | 1 (100.0%) |
| Construction & Extraction | 9 (100.0%) | 0 (0.0%) |
| Installation, Maintenance & Repair | 8 (100.0%) | 0 (0.0%) |
| Total (Category) | 17 (94.4%) | 1 (5.6%) |
| Total (Overall) | 65 (71.4%) | 26 (28.6%) |
Production, Transportation and Moving Occupations
The most common Production, Transportation and Moving occupations in Buckhead are Transportation (16 | 17.6%), and Production (2 | 2.2%).
Production, Transportation and Moving Occupations by Sex
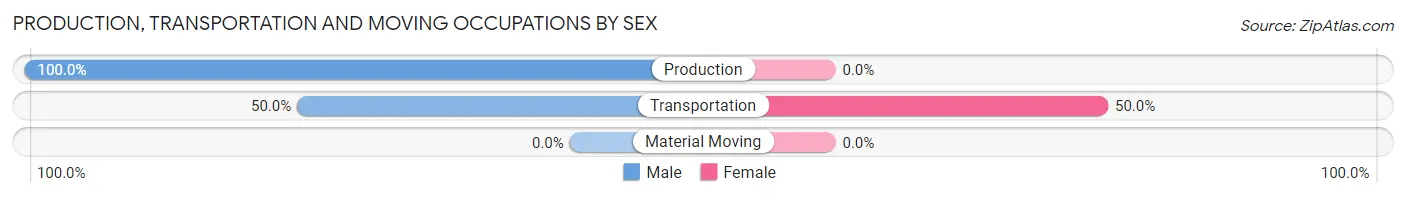
| Occupation | Male | Female |
| Production | 2 (100.0%) | 0 (0.0%) |
| Transportation | 8 (50.0%) | 8 (50.0%) |
| Material Moving | 0 (0.0%) | 0 (0.0%) |
| Total (Category) | 10 (55.6%) | 8 (44.4%) |
| Total (Overall) | 65 (71.4%) | 26 (28.6%) |
Employment Industries by Sex in Buckhead
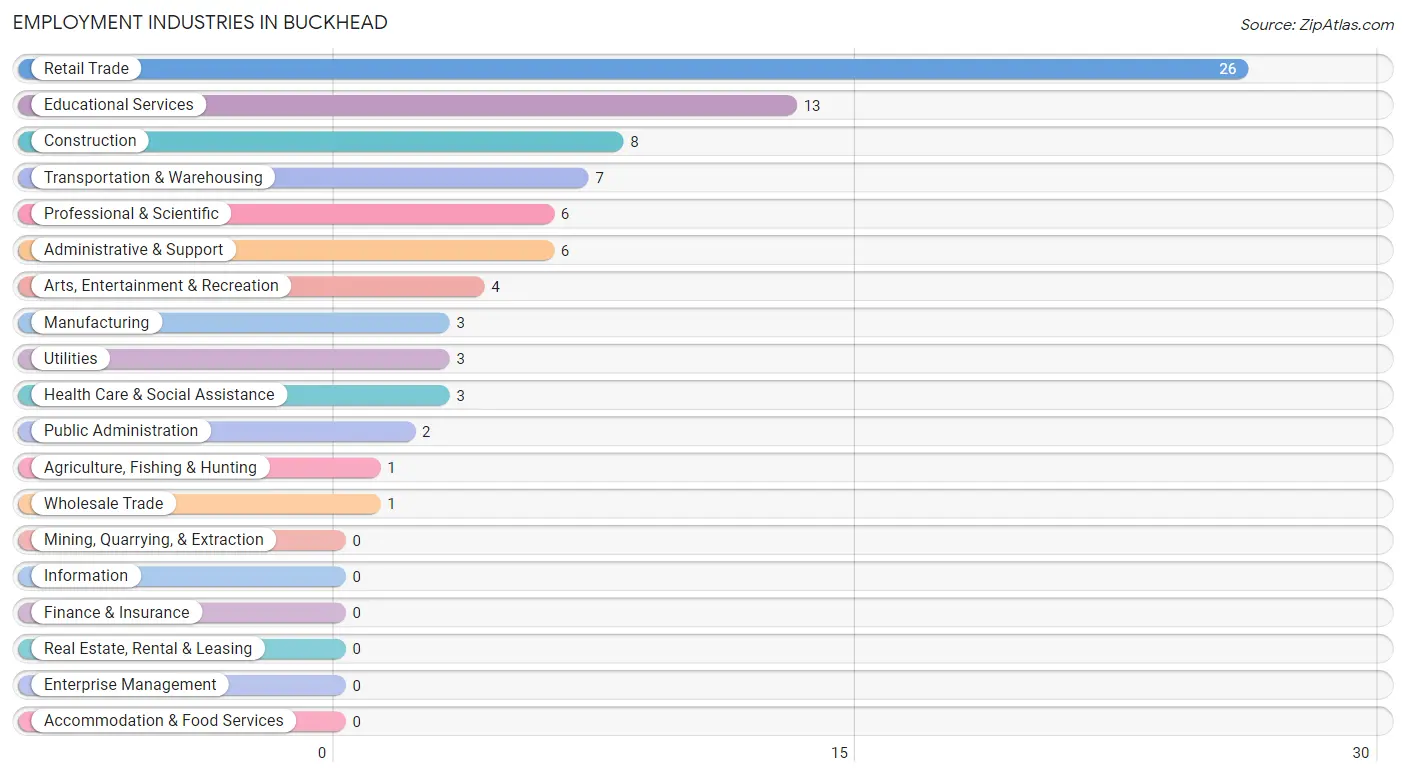
Employment Industries in Buckhead
The major employment industries in Buckhead include Retail Trade (26 | 28.6%), Educational Services (13 | 14.3%), Construction (8 | 8.8%), Transportation & Warehousing (7 | 7.7%), and Professional & Scientific (6 | 6.6%).
Employment Industries by Sex in Buckhead
The Buckhead industries that see more men than women are Construction (100.0%), Manufacturing (100.0%), and Wholesale Trade (100.0%), whereas the industries that tend to have a higher number of women are Agriculture, Fishing & Hunting (100.0%), Health Care & Social Assistance (100.0%), and Arts, Entertainment & Recreation (100.0%).
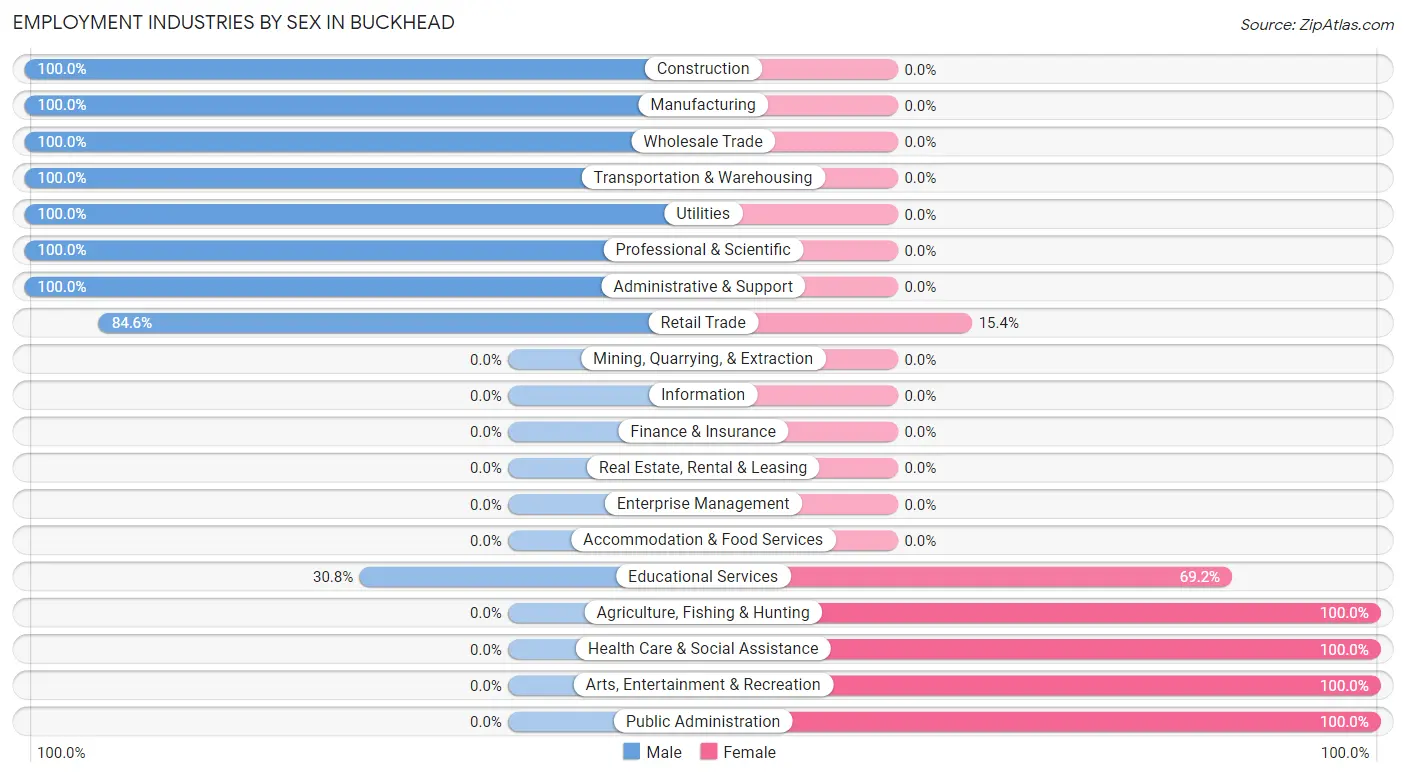
| Industry | Male | Female |
| Agriculture, Fishing & Hunting | 0 (0.0%) | 1 (100.0%) |
| Mining, Quarrying, & Extraction | 0 (0.0%) | 0 (0.0%) |
| Construction | 8 (100.0%) | 0 (0.0%) |
| Manufacturing | 3 (100.0%) | 0 (0.0%) |
| Wholesale Trade | 1 (100.0%) | 0 (0.0%) |
| Retail Trade | 22 (84.6%) | 4 (15.4%) |
| Transportation & Warehousing | 7 (100.0%) | 0 (0.0%) |
| Utilities | 3 (100.0%) | 0 (0.0%) |
| Information | 0 (0.0%) | 0 (0.0%) |
| Finance & Insurance | 0 (0.0%) | 0 (0.0%) |
| Real Estate, Rental & Leasing | 0 (0.0%) | 0 (0.0%) |
| Professional & Scientific | 6 (100.0%) | 0 (0.0%) |
| Enterprise Management | 0 (0.0%) | 0 (0.0%) |
| Administrative & Support | 6 (100.0%) | 0 (0.0%) |
| Educational Services | 4 (30.8%) | 9 (69.2%) |
| Health Care & Social Assistance | 0 (0.0%) | 3 (100.0%) |
| Arts, Entertainment & Recreation | 0 (0.0%) | 4 (100.0%) |
| Accommodation & Food Services | 0 (0.0%) | 0 (0.0%) |
| Public Administration | 0 (0.0%) | 2 (100.0%) |
| Total | 65 (71.4%) | 26 (28.6%) |
Education in Buckhead
School Enrollment in Buckhead
The most common levels of schooling among the 24 students in Buckhead are elementary school (16 | 66.7%), high school (5 | 20.8%), and middle school (3 | 12.5%).
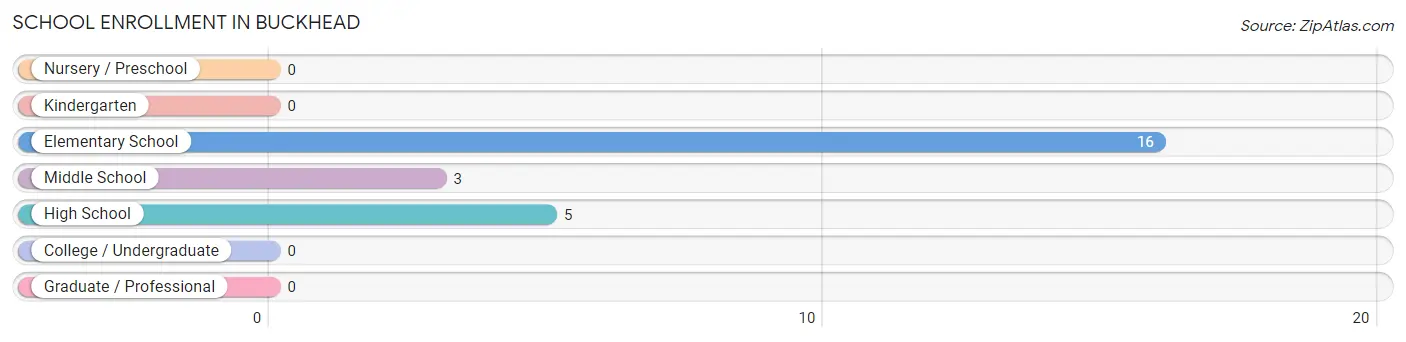
| School Level | # Students | % Students |
| Nursery / Preschool | 0 | 0.0% |
| Kindergarten | 0 | 0.0% |
| Elementary School | 16 | 66.7% |
| Middle School | 3 | 12.5% |
| High School | 5 | 20.8% |
| College / Undergraduate | 0 | 0.0% |
| Graduate / Professional | 0 | 0.0% |
| Total | 24 | 100.0% |
School Enrollment by Age by Funding Source in Buckhead
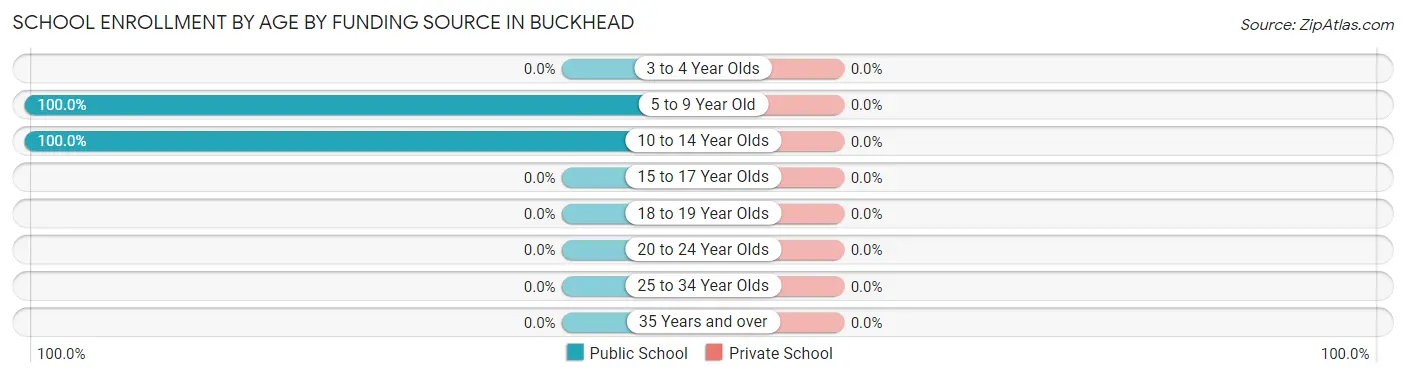
| Age Bracket | Public School | Private School |
| 3 to 4 Year Olds | 0 (0.0%) | 0 (0.0%) |
| 5 to 9 Year Old | 16 (100.0%) | 0 (0.0%) |
| 10 to 14 Year Olds | 8 (100.0%) | 0 (0.0%) |
| 15 to 17 Year Olds | 0 (0.0%) | 0 (0.0%) |
| 18 to 19 Year Olds | 0 (0.0%) | 0 (0.0%) |
| 20 to 24 Year Olds | 0 (0.0%) | 0 (0.0%) |
| 25 to 34 Year Olds | 0 (0.0%) | 0 (0.0%) |
| 35 Years and over | 0 (0.0%) | 0 (0.0%) |
| Total | 24 (100.0%) | 0 (0.0%) |
Educational Attainment by Field of Study in Buckhead
Science & technology (9 | 23.1%), education (9 | 23.1%), business (7 | 17.9%), arts & humanities (7 | 17.9%), and social sciences (3 | 7.7%) are the most common fields of study among 39 individuals in Buckhead who have obtained a bachelor's degree or higher.
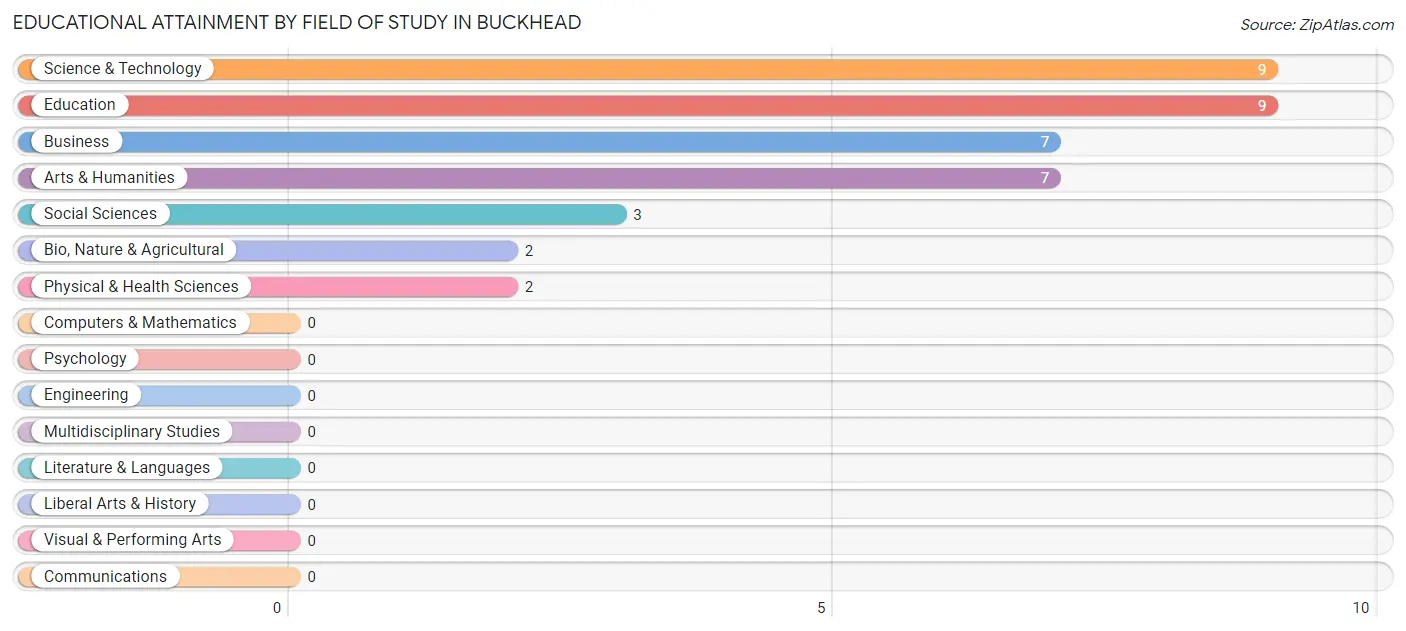
| Field of Study | # Graduates | % Graduates |
| Computers & Mathematics | 0 | 0.0% |
| Bio, Nature & Agricultural | 2 | 5.1% |
| Physical & Health Sciences | 2 | 5.1% |
| Psychology | 0 | 0.0% |
| Social Sciences | 3 | 7.7% |
| Engineering | 0 | 0.0% |
| Multidisciplinary Studies | 0 | 0.0% |
| Science & Technology | 9 | 23.1% |
| Business | 7 | 17.9% |
| Education | 9 | 23.1% |
| Literature & Languages | 0 | 0.0% |
| Liberal Arts & History | 0 | 0.0% |
| Visual & Performing Arts | 0 | 0.0% |
| Communications | 0 | 0.0% |
| Arts & Humanities | 7 | 17.9% |
| Total | 39 | 100.0% |
Transportation & Commute in Buckhead
Vehicle Availability by Sex in Buckhead
The most prevalent vehicle ownership categories in Buckhead are males with 3 vehicles (25, accounting for 43.1%) and females with 3 vehicles (9, making up 131.6%).
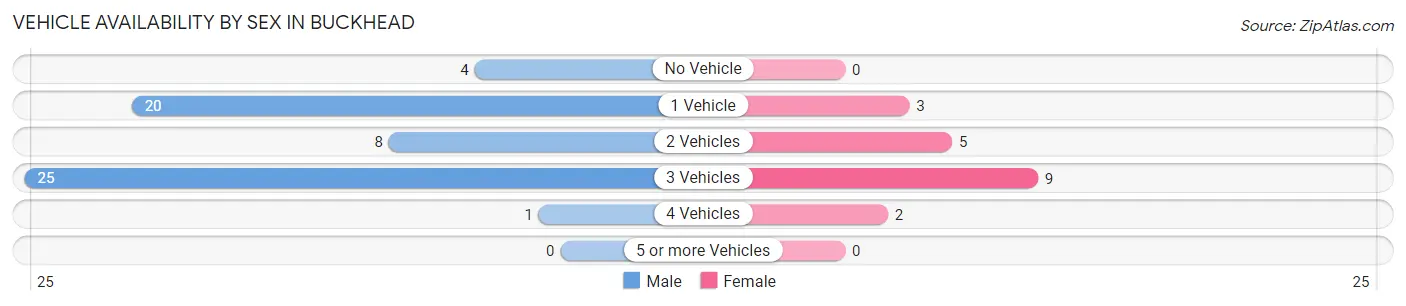
| Vehicles Available | Male | Female |
| No Vehicle | 4 (6.9%) | 0 (0.0%) |
| 1 Vehicle | 20 (34.5%) | 3 (15.8%) |
| 2 Vehicles | 8 (13.8%) | 5 (26.3%) |
| 3 Vehicles | 25 (43.1%) | 9 (47.4%) |
| 4 Vehicles | 1 (1.7%) | 2 (10.5%) |
| 5 or more Vehicles | 0 (0.0%) | 0 (0.0%) |
| Total | 58 (100.0%) | 19 (100.0%) |
Commute Time in Buckhead
The most frequently occuring commute durations in Buckhead are 15 to 19 minutes (36 commuters, 47.4%), 20 to 24 minutes (8 commuters, 10.5%), and 45 to 59 minutes (8 commuters, 10.5%).
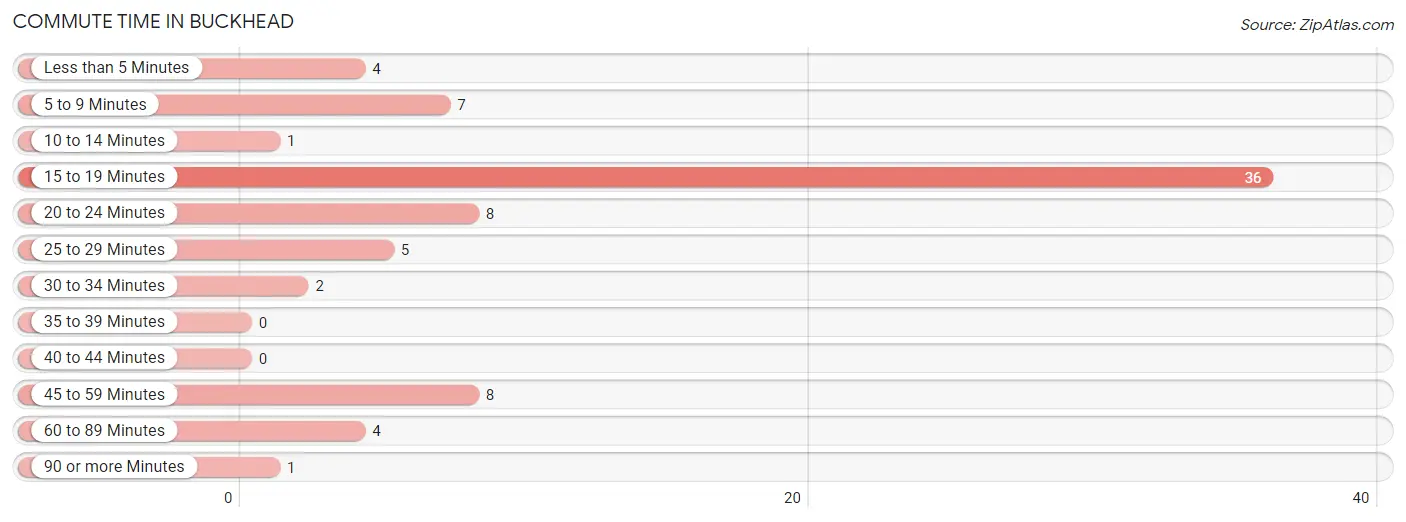
| Commute Time | # Commuters | % Commuters |
| Less than 5 Minutes | 4 | 5.3% |
| 5 to 9 Minutes | 7 | 9.2% |
| 10 to 14 Minutes | 1 | 1.3% |
| 15 to 19 Minutes | 36 | 47.4% |
| 20 to 24 Minutes | 8 | 10.5% |
| 25 to 29 Minutes | 5 | 6.6% |
| 30 to 34 Minutes | 2 | 2.6% |
| 35 to 39 Minutes | 0 | 0.0% |
| 40 to 44 Minutes | 0 | 0.0% |
| 45 to 59 Minutes | 8 | 10.5% |
| 60 to 89 Minutes | 4 | 5.3% |
| 90 or more Minutes | 1 | 1.3% |
Commute Time by Sex in Buckhead
The most common commute times in Buckhead are 15 to 19 minutes (25 commuters, 43.1%) for males and 15 to 19 minutes (11 commuters, 61.1%) for females.
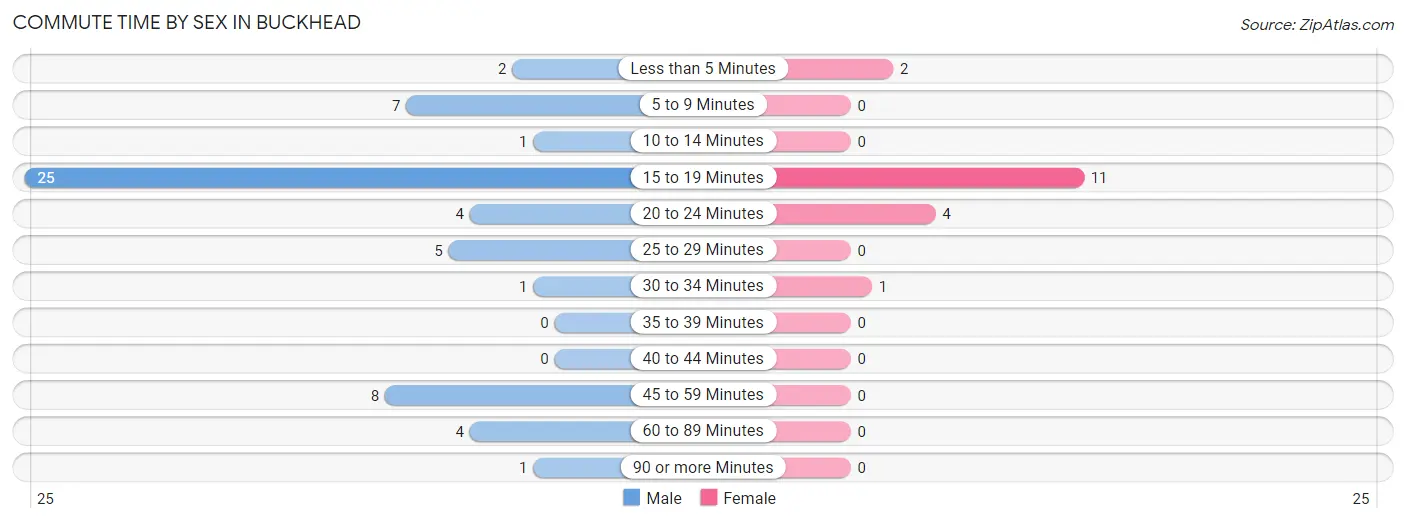
| Commute Time | Male | Female |
| Less than 5 Minutes | 2 (3.5%) | 2 (11.1%) |
| 5 to 9 Minutes | 7 (12.1%) | 0 (0.0%) |
| 10 to 14 Minutes | 1 (1.7%) | 0 (0.0%) |
| 15 to 19 Minutes | 25 (43.1%) | 11 (61.1%) |
| 20 to 24 Minutes | 4 (6.9%) | 4 (22.2%) |
| 25 to 29 Minutes | 5 (8.6%) | 0 (0.0%) |
| 30 to 34 Minutes | 1 (1.7%) | 1 (5.6%) |
| 35 to 39 Minutes | 0 (0.0%) | 0 (0.0%) |
| 40 to 44 Minutes | 0 (0.0%) | 0 (0.0%) |
| 45 to 59 Minutes | 8 (13.8%) | 0 (0.0%) |
| 60 to 89 Minutes | 4 (6.9%) | 0 (0.0%) |
| 90 or more Minutes | 1 (1.7%) | 0 (0.0%) |
Time of Departure to Work by Sex in Buckhead
The most frequent times of departure to work in Buckhead are 6:00 AM to 6:29 AM (18, 31.0%) for males and 7:30 AM to 7:59 AM (7, 38.9%) for females.
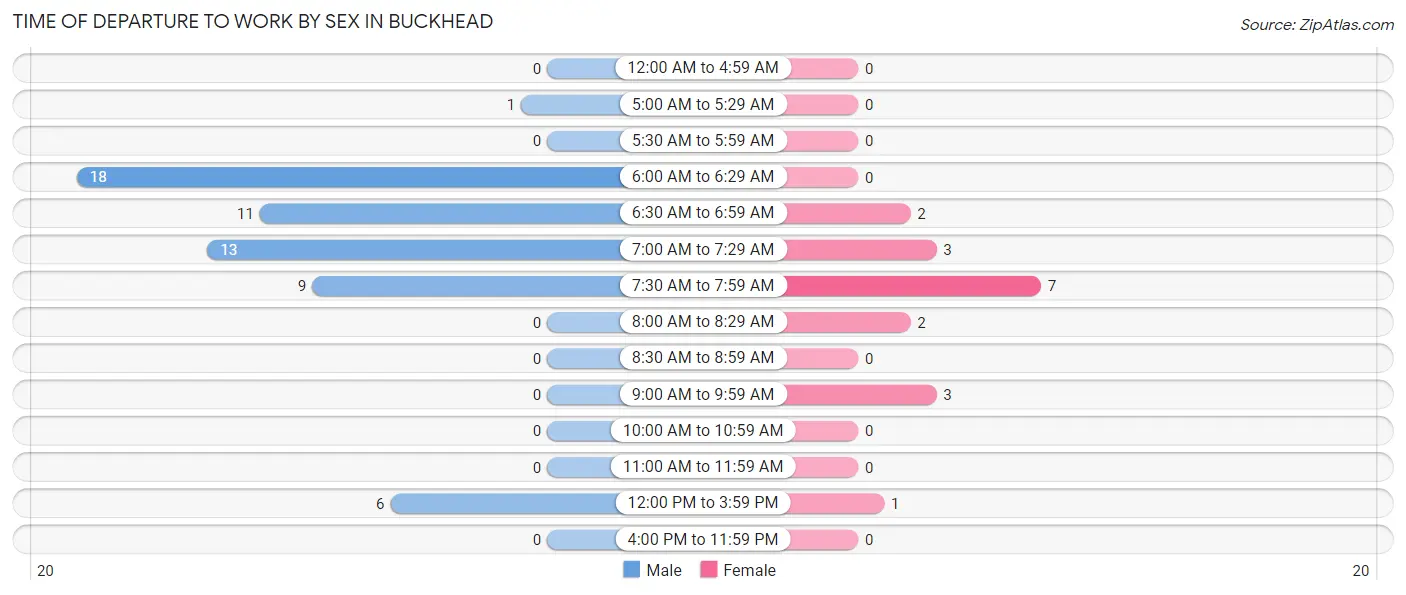
| Time of Departure | Male | Female |
| 12:00 AM to 4:59 AM | 0 (0.0%) | 0 (0.0%) |
| 5:00 AM to 5:29 AM | 1 (1.7%) | 0 (0.0%) |
| 5:30 AM to 5:59 AM | 0 (0.0%) | 0 (0.0%) |
| 6:00 AM to 6:29 AM | 18 (31.0%) | 0 (0.0%) |
| 6:30 AM to 6:59 AM | 11 (19.0%) | 2 (11.1%) |
| 7:00 AM to 7:29 AM | 13 (22.4%) | 3 (16.7%) |
| 7:30 AM to 7:59 AM | 9 (15.5%) | 7 (38.9%) |
| 8:00 AM to 8:29 AM | 0 (0.0%) | 2 (11.1%) |
| 8:30 AM to 8:59 AM | 0 (0.0%) | 0 (0.0%) |
| 9:00 AM to 9:59 AM | 0 (0.0%) | 3 (16.7%) |
| 10:00 AM to 10:59 AM | 0 (0.0%) | 0 (0.0%) |
| 11:00 AM to 11:59 AM | 0 (0.0%) | 0 (0.0%) |
| 12:00 PM to 3:59 PM | 6 (10.3%) | 1 (5.6%) |
| 4:00 PM to 11:59 PM | 0 (0.0%) | 0 (0.0%) |
| Total | 58 (100.0%) | 18 (100.0%) |
Housing Occupancy in Buckhead
Occupancy by Ownership in Buckhead
Of the total 1,297 dwellings in Buckhead, owner-occupied units account for 1,191 (91.8%), while renter-occupied units make up 106 (8.2%).
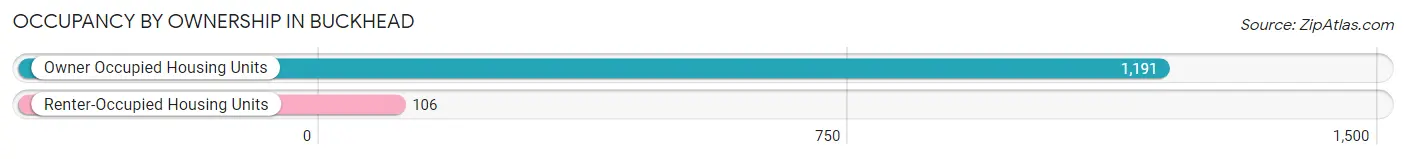
| Occupancy | # Housing Units | % Housing Units |
| Owner Occupied Housing Units | 1,191 | 91.8% |
| Renter-Occupied Housing Units | 106 | 8.2% |
| Total Occupied Housing Units | 1,297 | 100.0% |
Occupancy by Household Size in Buckhead
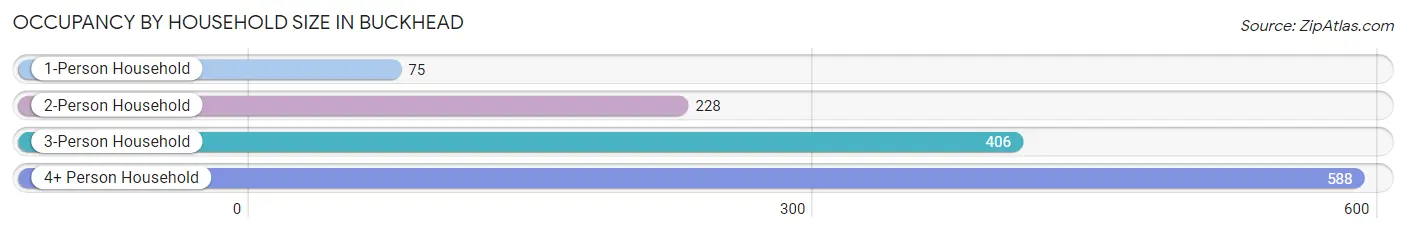
| Household Size | # Housing Units | % Housing Units |
| 1-Person Household | 75 | 5.8% |
| 2-Person Household | 228 | 17.6% |
| 3-Person Household | 406 | 31.3% |
| 4+ Person Household | 588 | 45.3% |
| Total Housing Units | 1,297 | 100.0% |
Occupancy by Ownership by Household Size in Buckhead
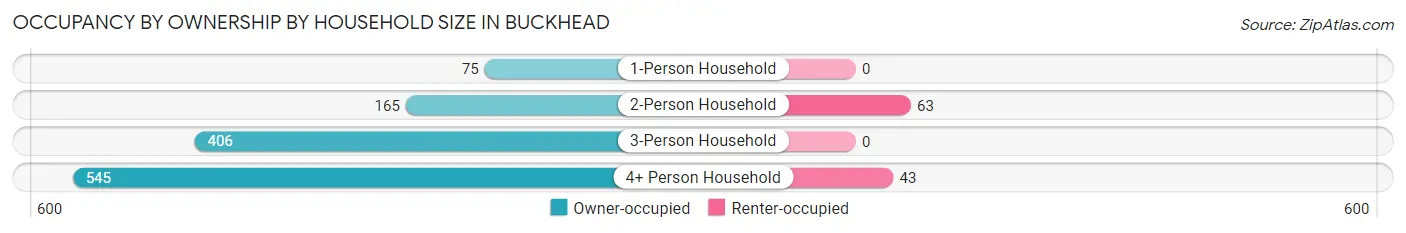
| Household Size | Owner-occupied | Renter-occupied |
| 1-Person Household | 75 (100.0%) | 0 (0.0%) |
| 2-Person Household | 165 (72.4%) | 63 (27.6%) |
| 3-Person Household | 406 (100.0%) | 0 (0.0%) |
| 4+ Person Household | 545 (92.7%) | 43 (7.3%) |
| Total Housing Units | 1,191 (91.8%) | 106 (8.2%) |
Occupancy by Educational Attainment in Buckhead
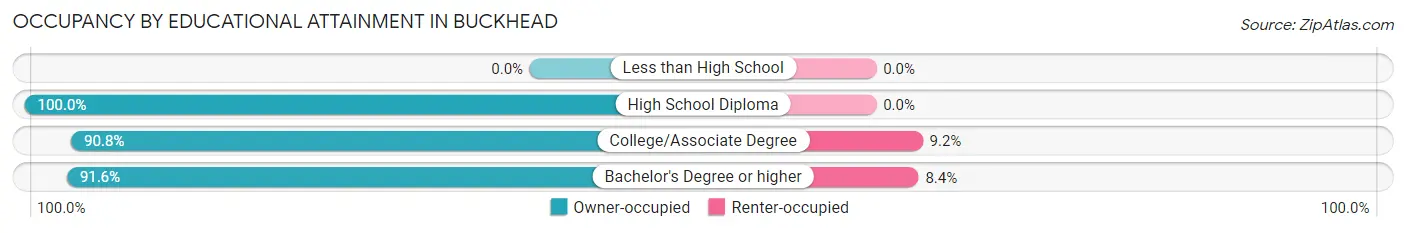
| Household Size | Owner-occupied | Renter-occupied |
| Less than High School | 0 (0.0%) | 0 (0.0%) |
| High School Diploma | 64 (100.0%) | 0 (0.0%) |
| College/Associate Degree | 286 (90.8%) | 29 (9.2%) |
| Bachelor's Degree or higher | 841 (91.6%) | 77 (8.4%) |
Occupancy by Age of Householder in Buckhead
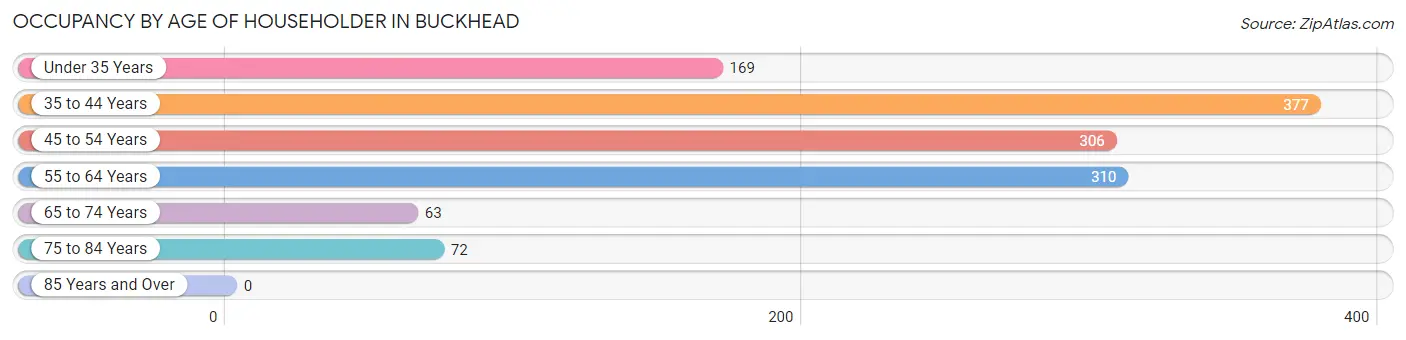
| Age Bracket | # Households | % Households |
| Under 35 Years | 169 | 13.0% |
| 35 to 44 Years | 377 | 29.1% |
| 45 to 54 Years | 306 | 23.6% |
| 55 to 64 Years | 310 | 23.9% |
| 65 to 74 Years | 63 | 4.9% |
| 75 to 84 Years | 72 | 5.6% |
| 85 Years and Over | 0 | 0.0% |
| Total | 1,297 | 100.0% |
Housing Finances in Buckhead
Median Income by Occupancy in Buckhead
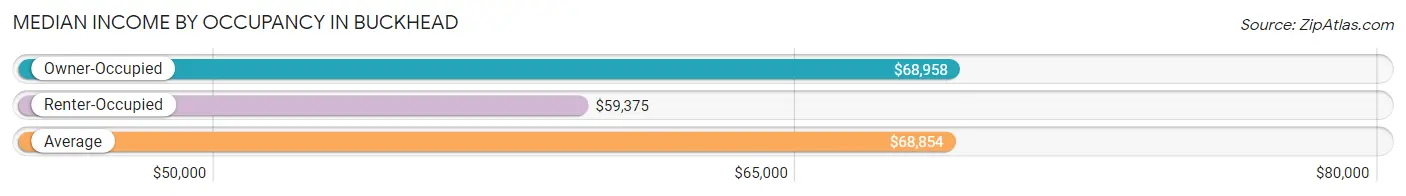
| Occupancy Type | # Households | Median Income |
| Owner-Occupied | 76 (91.6%) | $68,958 |
| Renter-Occupied | 7 (8.4%) | $59,375 |
| Average | 83 (100.0%) | $68,854 |
Occupancy by Householder Income Bracket in Buckhead
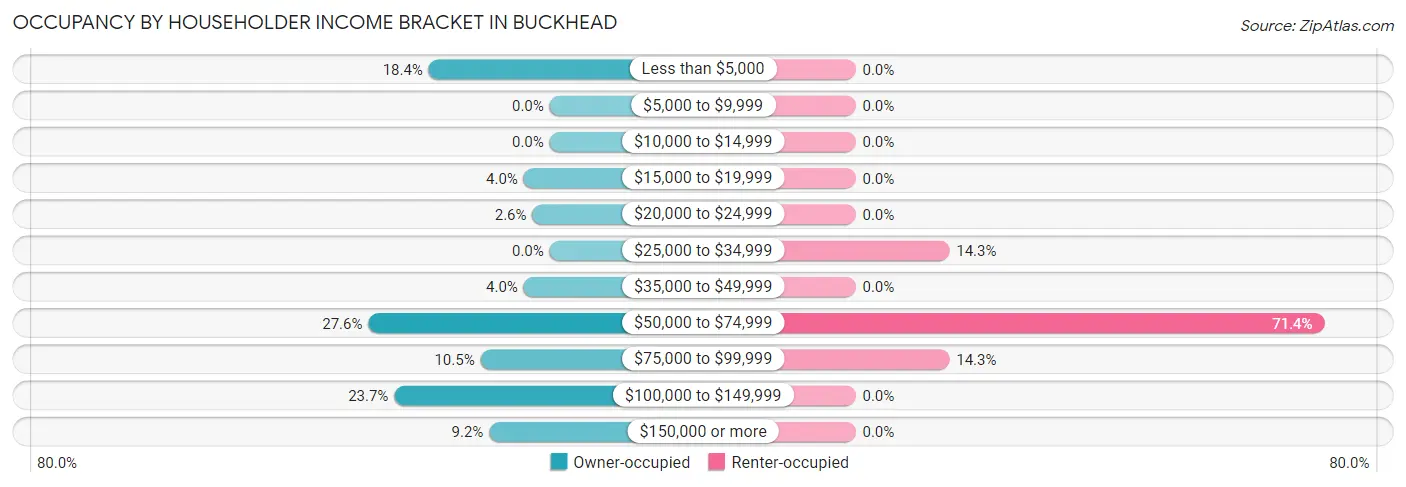
| Income Bracket | Owner-occupied | Renter-occupied |
| Less than $5,000 | 14 (18.4%) | 0 (0.0%) |
| $5,000 to $9,999 | 0 (0.0%) | 0 (0.0%) |
| $10,000 to $14,999 | 0 (0.0%) | 0 (0.0%) |
| $15,000 to $19,999 | 3 (4.0%) | 0 (0.0%) |
| $20,000 to $24,999 | 2 (2.6%) | 0 (0.0%) |
| $25,000 to $34,999 | 0 (0.0%) | 1 (14.3%) |
| $35,000 to $49,999 | 3 (4.0%) | 0 (0.0%) |
| $50,000 to $74,999 | 21 (27.6%) | 5 (71.4%) |
| $75,000 to $99,999 | 8 (10.5%) | 1 (14.3%) |
| $100,000 to $149,999 | 18 (23.7%) | 0 (0.0%) |
| $150,000 or more | 7 (9.2%) | 0 (0.0%) |
| Total | 76 (100.0%) | 7 (100.0%) |
Monthly Housing Cost Tiers in Buckhead
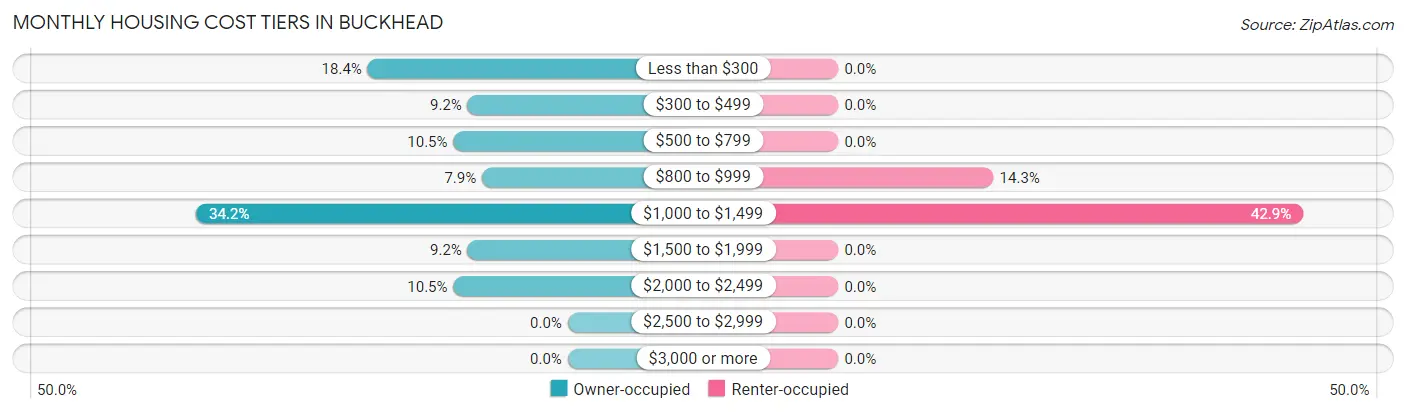
| Monthly Cost | Owner-occupied | Renter-occupied |
| Less than $300 | 14 (18.4%) | 0 (0.0%) |
| $300 to $499 | 7 (9.2%) | 0 (0.0%) |
| $500 to $799 | 8 (10.5%) | 0 (0.0%) |
| $800 to $999 | 6 (7.9%) | 1 (14.3%) |
| $1,000 to $1,499 | 26 (34.2%) | 3 (42.9%) |
| $1,500 to $1,999 | 7 (9.2%) | 0 (0.0%) |
| $2,000 to $2,499 | 8 (10.5%) | 0 (0.0%) |
| $2,500 to $2,999 | 0 (0.0%) | 0 (0.0%) |
| $3,000 or more | 0 (0.0%) | 0 (0.0%) |
| Total | 76 (100.0%) | 7 (100.0%) |
Physical Housing Characteristics in Buckhead
Housing Structures in Buckhead
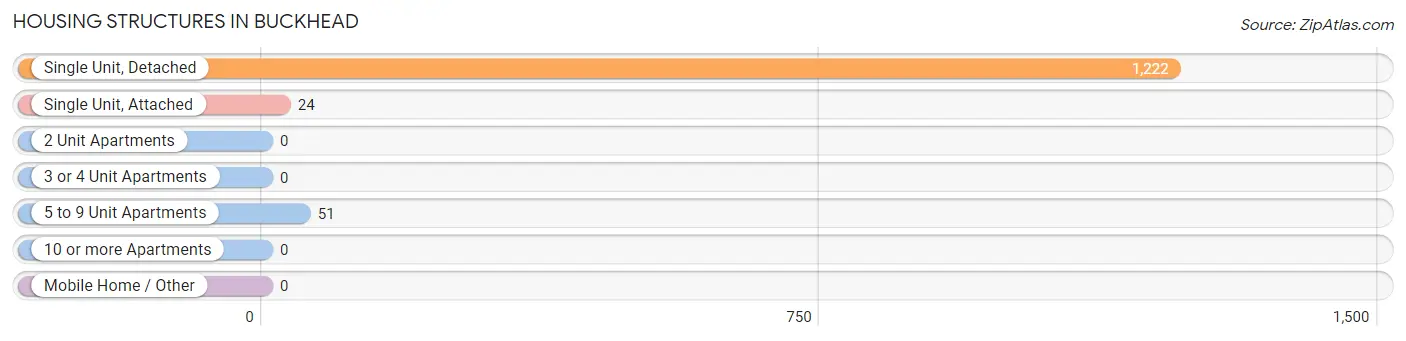
| Structure Type | # Housing Units | % Housing Units |
| Single Unit, Detached | 1,222 | 94.2% |
| Single Unit, Attached | 24 | 1.8% |
| 2 Unit Apartments | 0 | 0.0% |
| 3 or 4 Unit Apartments | 0 | 0.0% |
| 5 to 9 Unit Apartments | 51 | 3.9% |
| 10 or more Apartments | 0 | 0.0% |
| Mobile Home / Other | 0 | 0.0% |
| Total | 1,297 | 100.0% |
Housing Structures by Occupancy in Buckhead
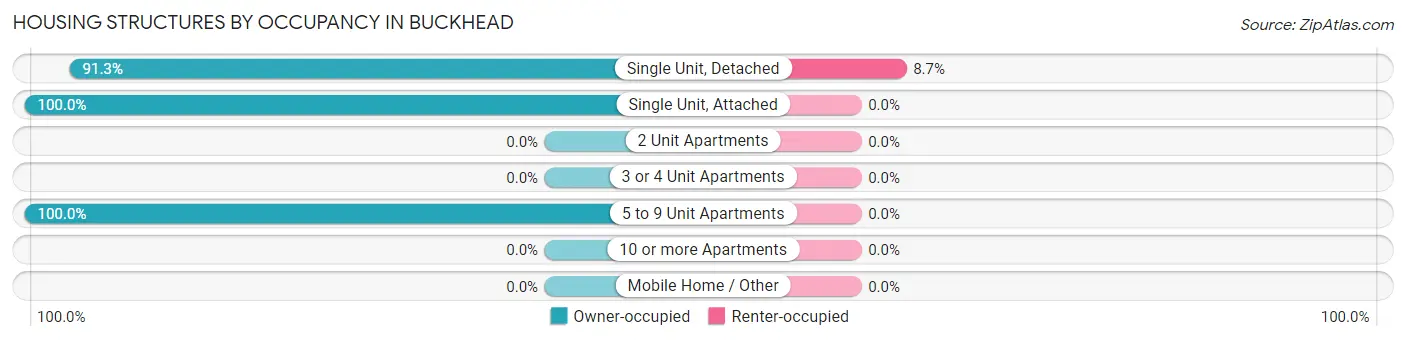
| Structure Type | Owner-occupied | Renter-occupied |
| Single Unit, Detached | 1,116 (91.3%) | 106 (8.7%) |
| Single Unit, Attached | 24 (100.0%) | 0 (0.0%) |
| 2 Unit Apartments | 0 (0.0%) | 0 (0.0%) |
| 3 or 4 Unit Apartments | 0 (0.0%) | 0 (0.0%) |
| 5 to 9 Unit Apartments | 51 (100.0%) | 0 (0.0%) |
| 10 or more Apartments | 0 (0.0%) | 0 (0.0%) |
| Mobile Home / Other | 0 (0.0%) | 0 (0.0%) |
| Total | 1,191 (91.8%) | 106 (8.2%) |
Housing Structures by Number of Rooms in Buckhead
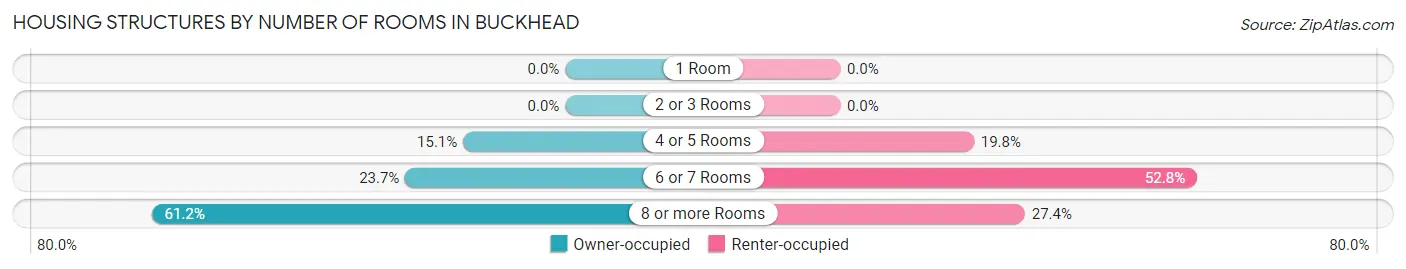
| Number of Rooms | Owner-occupied | Renter-occupied |
| 1 Room | 0 (0.0%) | 0 (0.0%) |
| 2 or 3 Rooms | 0 (0.0%) | 0 (0.0%) |
| 4 or 5 Rooms | 180 (15.1%) | 21 (19.8%) |
| 6 or 7 Rooms | 282 (23.7%) | 56 (52.8%) |
| 8 or more Rooms | 729 (61.2%) | 29 (27.4%) |
| Total | 1,191 (100.0%) | 106 (100.0%) |
Housing Structure by Heating Type in Buckhead
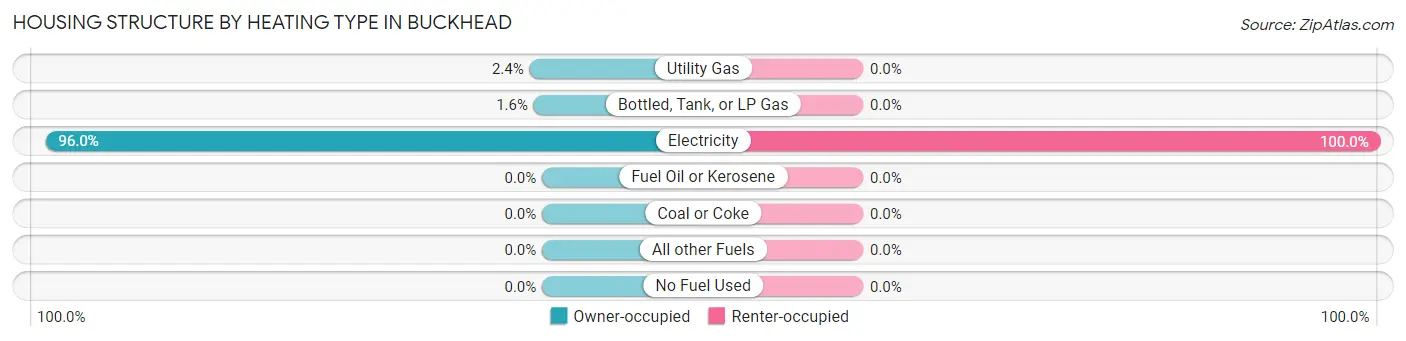
| Heating Type | Owner-occupied | Renter-occupied |
| Utility Gas | 29 (2.4%) | 0 (0.0%) |
| Bottled, Tank, or LP Gas | 19 (1.6%) | 0 (0.0%) |
| Electricity | 1,143 (96.0%) | 106 (100.0%) |
| Fuel Oil or Kerosene | 0 (0.0%) | 0 (0.0%) |
| Coal or Coke | 0 (0.0%) | 0 (0.0%) |
| All other Fuels | 0 (0.0%) | 0 (0.0%) |
| No Fuel Used | 0 (0.0%) | 0 (0.0%) |
| Total | 1,191 (100.0%) | 106 (100.0%) |
Household Vehicle Usage in Buckhead
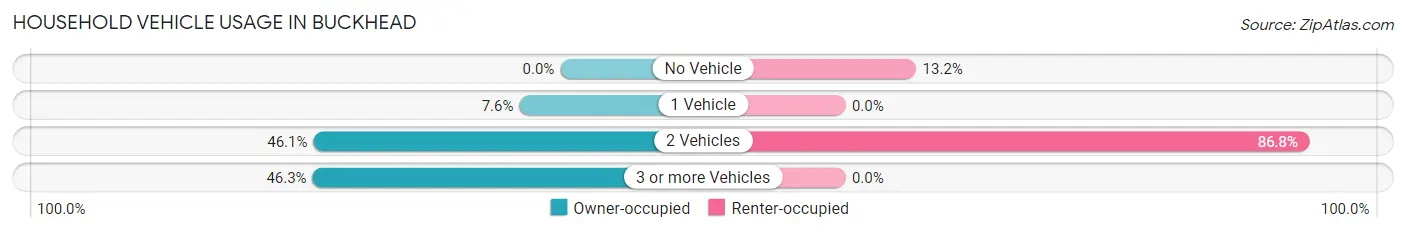
| Vehicles per Household | Owner-occupied | Renter-occupied |
| No Vehicle | 0 (0.0%) | 14 (13.2%) |
| 1 Vehicle | 91 (7.6%) | 0 (0.0%) |
| 2 Vehicles | 549 (46.1%) | 92 (86.8%) |
| 3 or more Vehicles | 551 (46.3%) | 0 (0.0%) |
| Total | 1,191 (100.0%) | 106 (100.0%) |
Real Estate & Mortgages in Buckhead
Real Estate and Mortgage Overview in Buckhead
| Characteristic | Without Mortgage | With Mortgage |
| Housing Units | 28 | 48 |
| Median Property Value | $188,900 | $173,500 |
| Median Household Income | - | - |
| Monthly Housing Costs | $325 | $0 |
| Real Estate Taxes | - | - |
Property Value by Mortgage Status in Buckhead
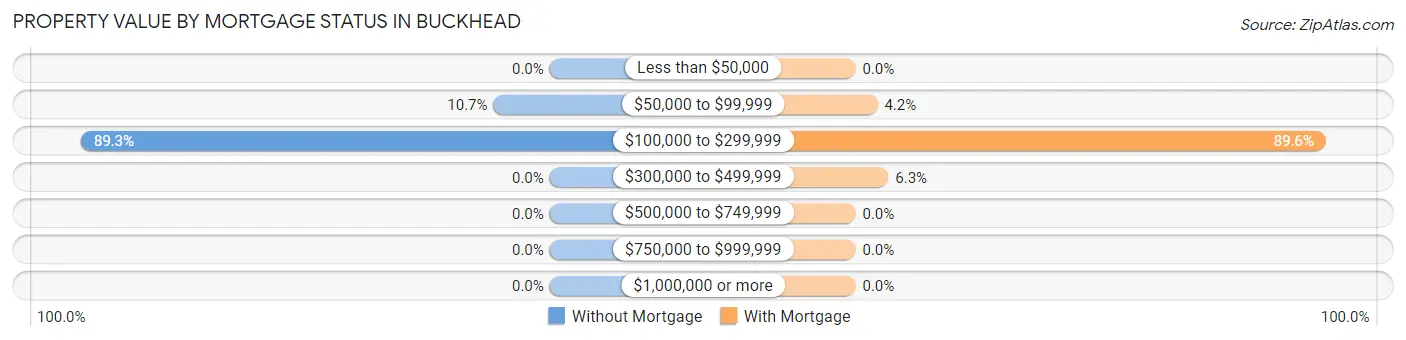
| Property Value | Without Mortgage | With Mortgage |
| Less than $50,000 | 0 (0.0%) | 0 (0.0%) |
| $50,000 to $99,999 | 3 (10.7%) | 2 (4.2%) |
| $100,000 to $299,999 | 25 (89.3%) | 43 (89.6%) |
| $300,000 to $499,999 | 0 (0.0%) | 3 (6.2%) |
| $500,000 to $749,999 | 0 (0.0%) | 0 (0.0%) |
| $750,000 to $999,999 | 0 (0.0%) | 0 (0.0%) |
| $1,000,000 or more | 0 (0.0%) | 0 (0.0%) |
| Total | 28 (100.0%) | 48 (100.0%) |
Household Income by Mortgage Status in Buckhead
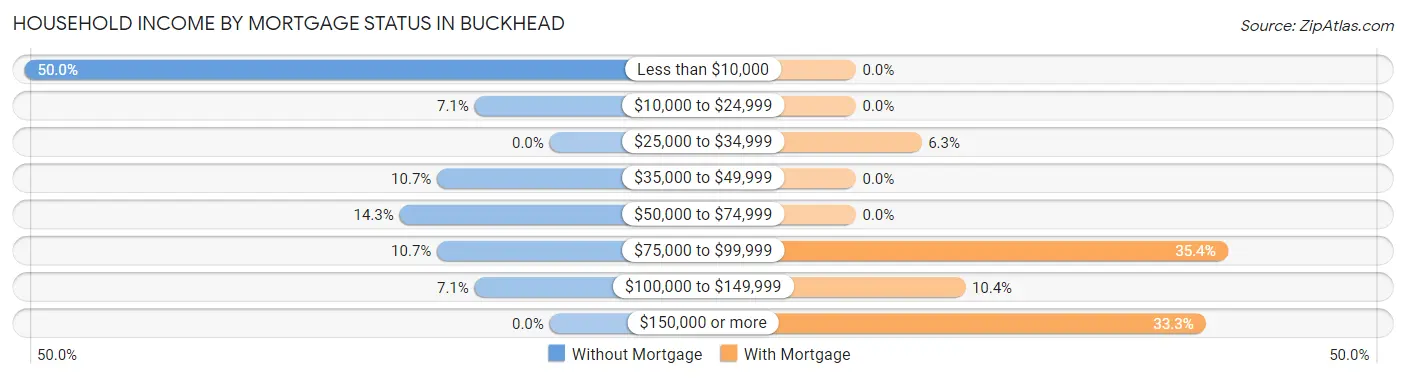
| Household Income | Without Mortgage | With Mortgage |
| Less than $10,000 | 14 (50.0%) | 0 (0.0%) |
| $10,000 to $24,999 | 2 (7.1%) | 0 (0.0%) |
| $25,000 to $34,999 | 0 (0.0%) | 3 (6.2%) |
| $35,000 to $49,999 | 3 (10.7%) | 0 (0.0%) |
| $50,000 to $74,999 | 4 (14.3%) | 0 (0.0%) |
| $75,000 to $99,999 | 3 (10.7%) | 17 (35.4%) |
| $100,000 to $149,999 | 2 (7.1%) | 5 (10.4%) |
| $150,000 or more | 0 (0.0%) | 16 (33.3%) |
| Total | 28 (100.0%) | 48 (100.0%) |
Property Value to Household Income Ratio in Buckhead
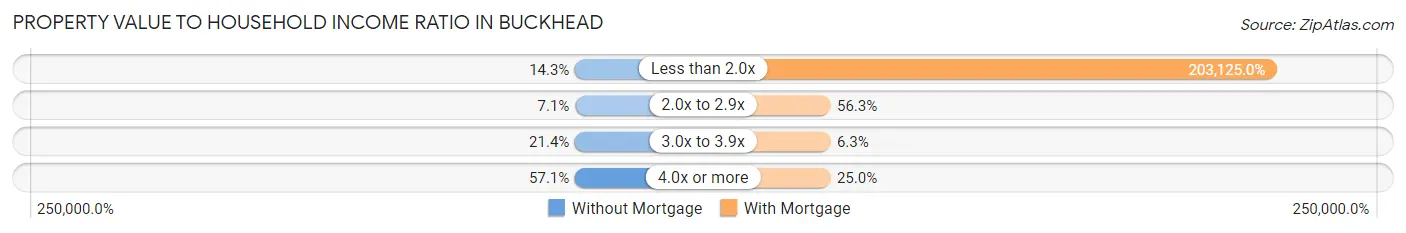
| Value-to-Income Ratio | Without Mortgage | With Mortgage |
| Less than 2.0x | 4 (14.3%) | 97,500 (203,125.0%) |
| 2.0x to 2.9x | 2 (7.1%) | 27 (56.2%) |
| 3.0x to 3.9x | 6 (21.4%) | 3 (6.2%) |
| 4.0x or more | 16 (57.1%) | 12 (25.0%) |
| Total | 28 (100.0%) | 48 (100.0%) |
Real Estate Taxes by Mortgage Status in Buckhead
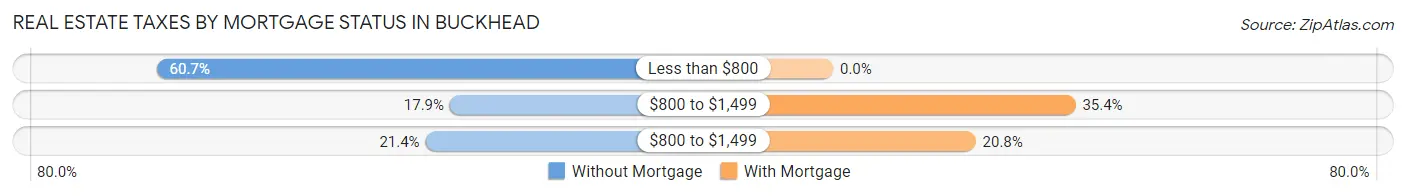
| Property Taxes | Without Mortgage | With Mortgage |
| Less than $800 | 17 (60.7%) | 0 (0.0%) |
| $800 to $1,499 | 5 (17.9%) | 17 (35.4%) |
| $800 to $1,499 | 6 (21.4%) | 10 (20.8%) |
| Total | 28 (100.0%) | 48 (100.0%) |
Health & Disability in Buckhead
Health Insurance Coverage by Age in Buckhead
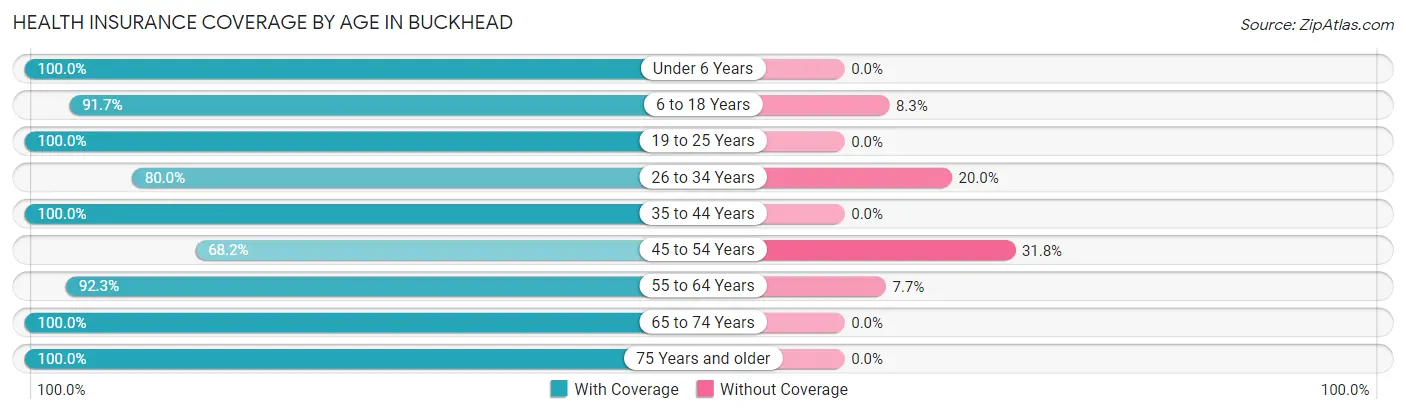
| Age Bracket | With Coverage | Without Coverage |
| Under 6 Years | 1 (100.0%) | 0 (0.0%) |
| 6 to 18 Years | 22 (91.7%) | 2 (8.3%) |
| 19 to 25 Years | 4 (100.0%) | 0 (0.0%) |
| 26 to 34 Years | 20 (80.0%) | 5 (20.0%) |
| 35 to 44 Years | 46 (100.0%) | 0 (0.0%) |
| 45 to 54 Years | 15 (68.2%) | 7 (31.8%) |
| 55 to 64 Years | 24 (92.3%) | 2 (7.7%) |
| 65 to 74 Years | 12 (100.0%) | 0 (0.0%) |
| 75 Years and older | 23 (100.0%) | 0 (0.0%) |
| Total | 167 (91.3%) | 16 (8.7%) |
Health Insurance Coverage by Citizenship Status in Buckhead
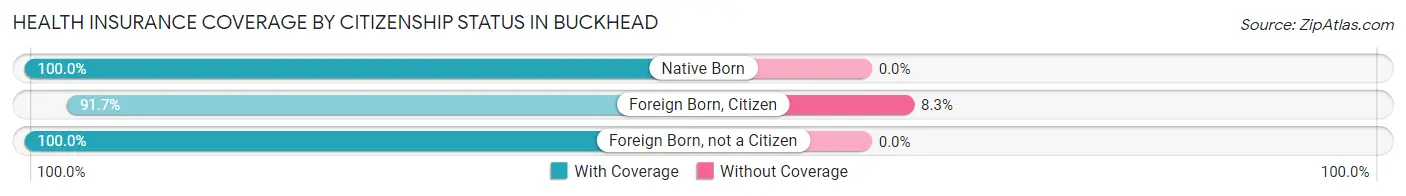
| Citizenship Status | With Coverage | Without Coverage |
| Native Born | 1 (100.0%) | 0 (0.0%) |
| Foreign Born, Citizen | 22 (91.7%) | 2 (8.3%) |
| Foreign Born, not a Citizen | 4 (100.0%) | 0 (0.0%) |
Health Insurance Coverage by Household Income in Buckhead
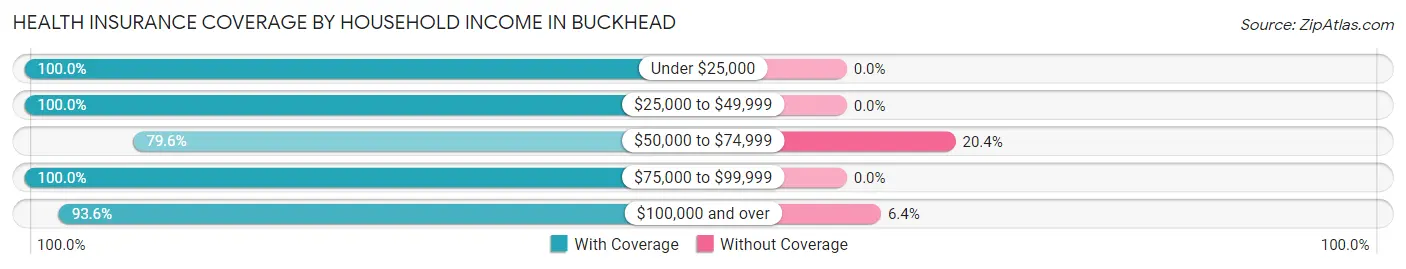
| Household Income | With Coverage | Without Coverage |
| Under $25,000 | 20 (100.0%) | 0 (0.0%) |
| $25,000 to $49,999 | 8 (100.0%) | 0 (0.0%) |
| $50,000 to $74,999 | 43 (79.6%) | 11 (20.4%) |
| $75,000 to $99,999 | 23 (100.0%) | 0 (0.0%) |
| $100,000 and over | 73 (93.6%) | 5 (6.4%) |
Public vs Private Health Insurance Coverage by Age in Buckhead
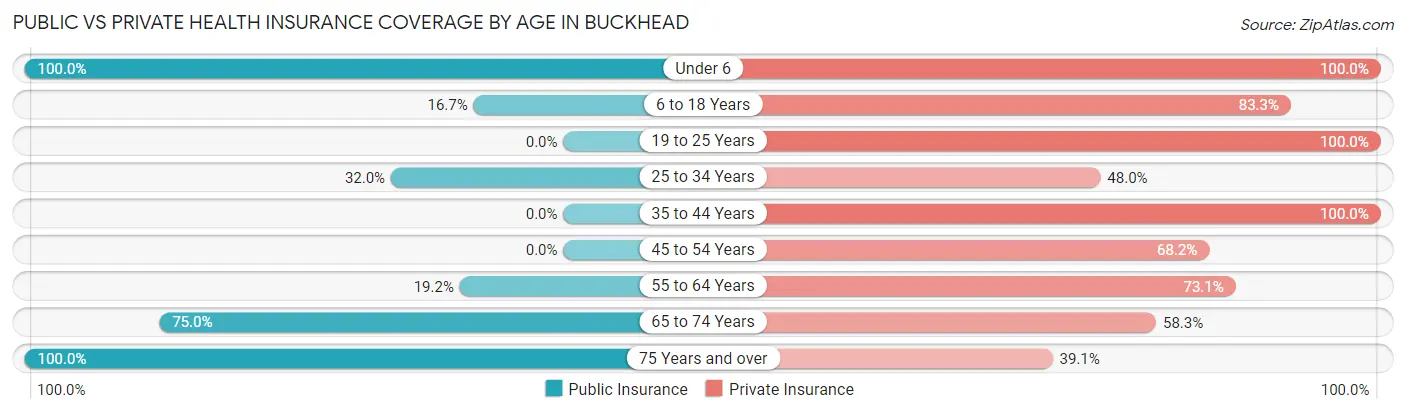
| Age Bracket | Public Insurance | Private Insurance |
| Under 6 | 1 (100.0%) | 1 (100.0%) |
| 6 to 18 Years | 4 (16.7%) | 20 (83.3%) |
| 19 to 25 Years | 0 (0.0%) | 4 (100.0%) |
| 25 to 34 Years | 8 (32.0%) | 12 (48.0%) |
| 35 to 44 Years | 0 (0.0%) | 46 (100.0%) |
| 45 to 54 Years | 0 (0.0%) | 15 (68.2%) |
| 55 to 64 Years | 5 (19.2%) | 19 (73.1%) |
| 65 to 74 Years | 9 (75.0%) | 7 (58.3%) |
| 75 Years and over | 23 (100.0%) | 9 (39.1%) |
| Total | 50 (27.3%) | 133 (72.7%) |
Disability Status by Sex by Age in Buckhead
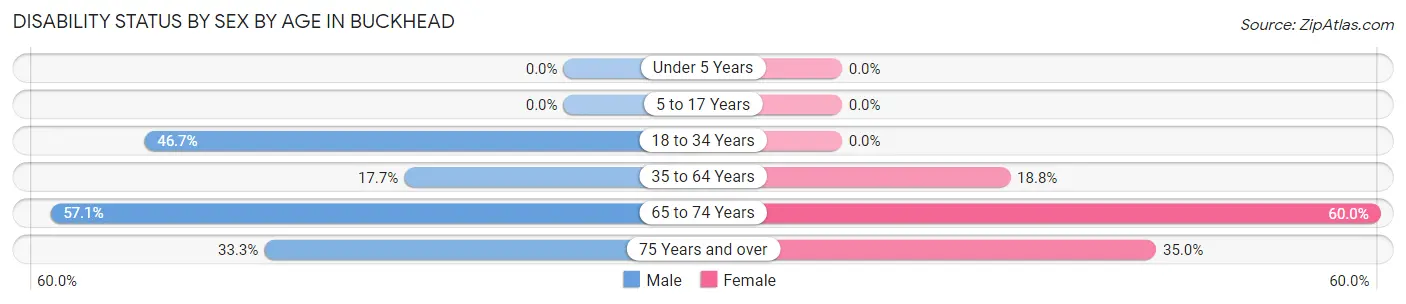
| Age Bracket | Male | Female |
| Under 5 Years | 0 (0.0%) | 0 (0.0%) |
| 5 to 17 Years | 0 (0.0%) | 0 (0.0%) |
| 18 to 34 Years | 7 (46.7%) | 0 (0.0%) |
| 35 to 64 Years | 11 (17.7%) | 6 (18.8%) |
| 65 to 74 Years | 4 (57.1%) | 3 (60.0%) |
| 75 Years and over | 1 (33.3%) | 7 (35.0%) |
Disability Class by Sex by Age in Buckhead
Disability Class: Hearing Difficulty
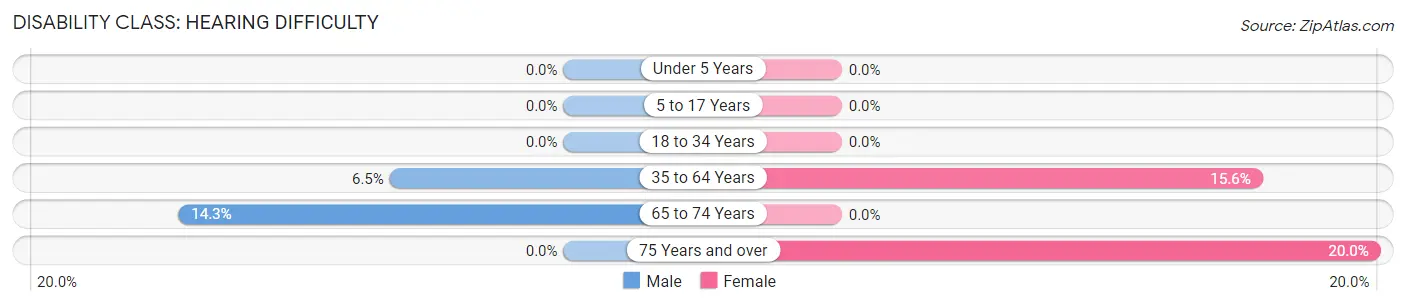
| Age Bracket | Male | Female |
| Under 5 Years | 0 (0.0%) | 0 (0.0%) |
| 5 to 17 Years | 0 (0.0%) | 0 (0.0%) |
| 18 to 34 Years | 0 (0.0%) | 0 (0.0%) |
| 35 to 64 Years | 4 (6.5%) | 5 (15.6%) |
| 65 to 74 Years | 1 (14.3%) | 0 (0.0%) |
| 75 Years and over | 0 (0.0%) | 4 (20.0%) |
Disability Class: Vision Difficulty
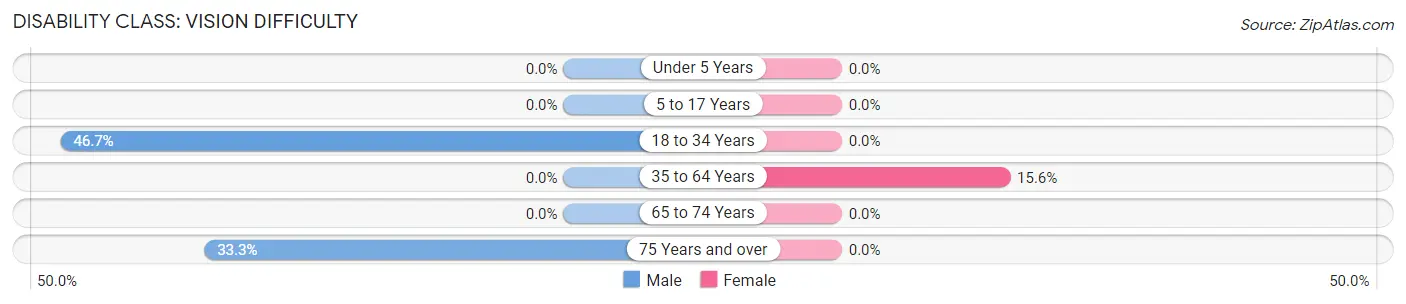
| Age Bracket | Male | Female |
| Under 5 Years | 0 (0.0%) | 0 (0.0%) |
| 5 to 17 Years | 0 (0.0%) | 0 (0.0%) |
| 18 to 34 Years | 7 (46.7%) | 0 (0.0%) |
| 35 to 64 Years | 0 (0.0%) | 5 (15.6%) |
| 65 to 74 Years | 0 (0.0%) | 0 (0.0%) |
| 75 Years and over | 1 (33.3%) | 0 (0.0%) |
Disability Class: Cognitive Difficulty
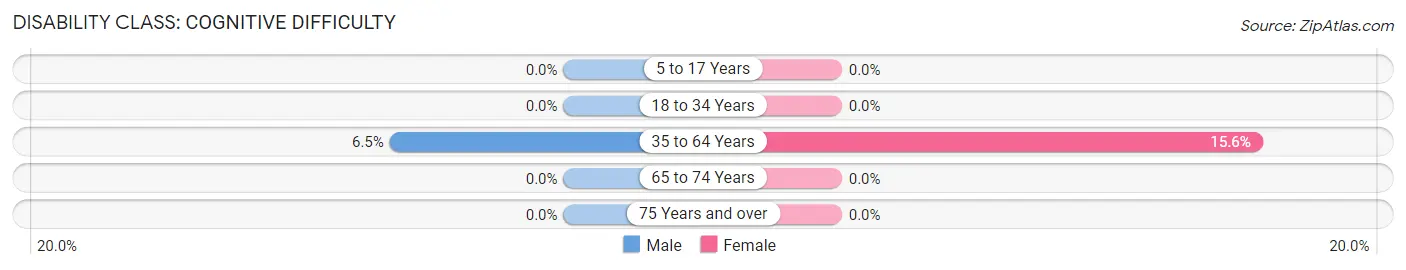
| Age Bracket | Male | Female |
| 5 to 17 Years | 0 (0.0%) | 0 (0.0%) |
| 18 to 34 Years | 0 (0.0%) | 0 (0.0%) |
| 35 to 64 Years | 4 (6.5%) | 5 (15.6%) |
| 65 to 74 Years | 0 (0.0%) | 0 (0.0%) |
| 75 Years and over | 0 (0.0%) | 0 (0.0%) |
Disability Class: Ambulatory Difficulty
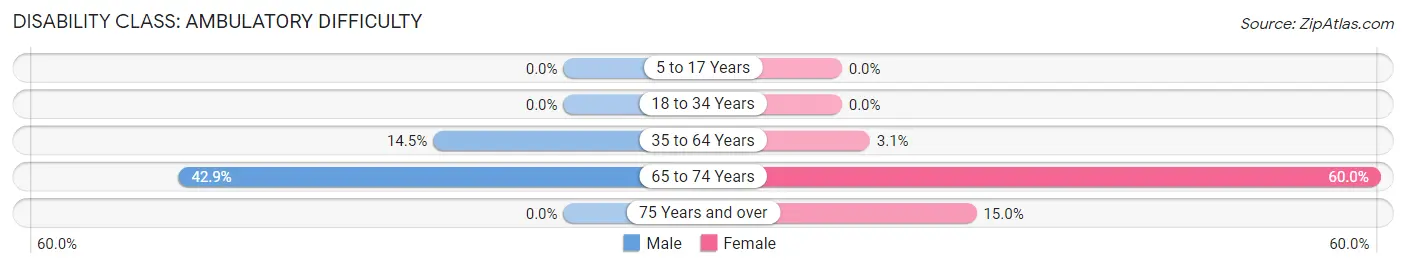
| Age Bracket | Male | Female |
| 5 to 17 Years | 0 (0.0%) | 0 (0.0%) |
| 18 to 34 Years | 0 (0.0%) | 0 (0.0%) |
| 35 to 64 Years | 9 (14.5%) | 1 (3.1%) |
| 65 to 74 Years | 3 (42.9%) | 3 (60.0%) |
| 75 Years and over | 0 (0.0%) | 3 (15.0%) |
Disability Class: Self-Care Difficulty
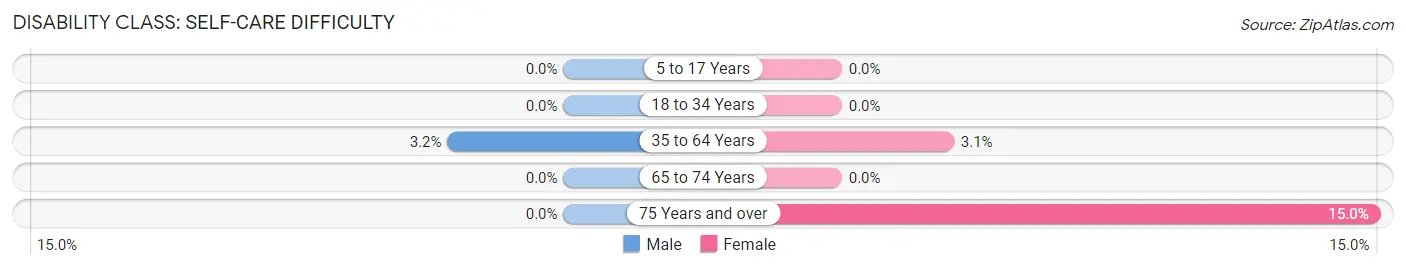
| Age Bracket | Male | Female |
| 5 to 17 Years | 0 (0.0%) | 0 (0.0%) |
| 18 to 34 Years | 0 (0.0%) | 0 (0.0%) |
| 35 to 64 Years | 2 (3.2%) | 1 (3.1%) |
| 65 to 74 Years | 0 (0.0%) | 0 (0.0%) |
| 75 Years and over | 0 (0.0%) | 3 (15.0%) |
Technology Access in Buckhead
Computing Device Access in Buckhead
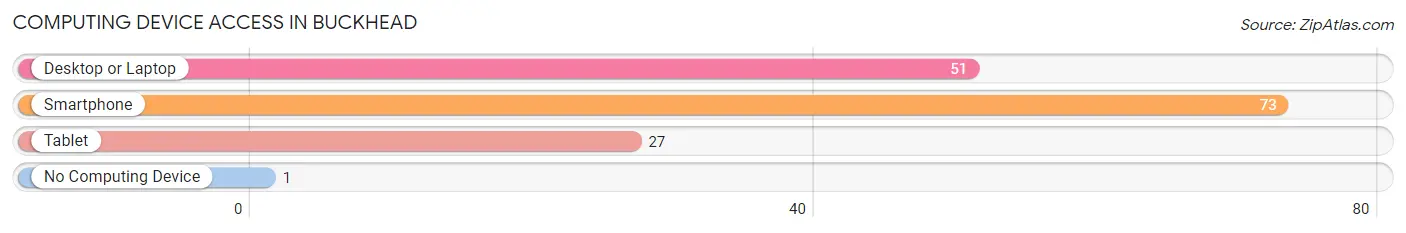
| Device Type | # Households | % Households |
| Desktop or Laptop | 51 | 61.5% |
| Smartphone | 73 | 87.9% |
| Tablet | 27 | 32.5% |
| No Computing Device | 1 | 1.2% |
| Total | 83 | 100.0% |
Internet Access in Buckhead
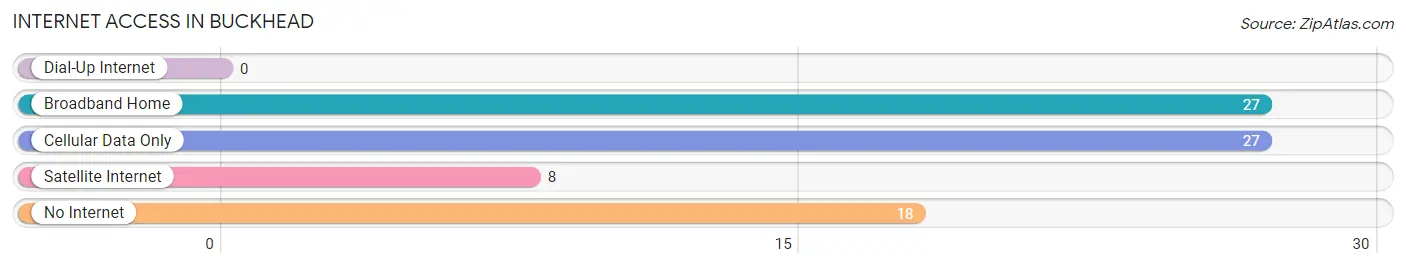
| Internet Type | # Households | % Households |
| Dial-Up Internet | 0 | 0.0% |
| Broadband Home | 27 | 32.5% |
| Cellular Data Only | 27 | 32.5% |
| Satellite Internet | 8 | 9.6% |
| No Internet | 18 | 21.7% |
| Total | 83 | 100.0% |
Buckhead Summary
Buckhead is an affluent area of Atlanta, Georgia, located in Fulton County. It is a major commercial and financial center of the Southeast, and is home to some of the most expensive real estate in the United States. Buckhead is known for its upscale shopping, dining, and nightlife, and is home to many of Atlanta's most affluent neighborhoods.
History
Buckhead was originally inhabited by the Creek Indians, who called the area “Standing Pitch Tree” due to the abundance of tall pine trees in the area. The area was first settled by European settlers in the early 1800s, and the name “Buckhead” was derived from a local tavern that served deer heads. The area was annexed by the city of Atlanta in 1952, and has since become one of the most affluent areas in the city.
Geography
Buckhead is located in the northern part of Atlanta, and is bordered by the Chattahoochee River to the north, Peachtree Creek to the east, and the city of Sandy Springs to the west. The area is characterized by rolling hills and lush forests, and is home to many parks and green spaces.
Economy
Buckhead is home to many of Atlanta's most prominent businesses and corporations, including Coca-Cola, Delta Air Lines, and Home Depot. The area is also home to many upscale shopping centers, restaurants, and nightlife venues. Buckhead is also home to many of Atlanta's wealthiest residents, and is one of the most affluent areas in the city.
Demographics
As of the 2010 census, Buckhead had a population of 37,912. The racial makeup of the area was 73.3% White, 15.2% African American, 0.3% Native American, 5.3% Asian, and 5.9% from other races. The median household income in Buckhead was $90,917, and the median age was 37.7 years.
Buckhead is a vibrant and diverse area of Atlanta, and is home to many of the city's most affluent residents. The area is known for its upscale shopping, dining, and nightlife, and is a major commercial and financial center of the Southeast. Buckhead is also home to many parks and green spaces, making it a desirable place to live and work.
Common Questions
What is Per Capita Income in Buckhead?
Per Capita income in Buckhead is $28,911.
What is the Median Family Income in Buckhead?
Median Family Income in Buckhead is $71,875.
What is the Median Household income in Buckhead?
Median Household Income in Buckhead is $68,854.
What is Income or Wage Gap in Buckhead?
Income or Wage Gap in Buckhead is 30.2%.
Women in Buckhead earn 69.8 cents for every dollar earned by a man.
What is Inequality or Gini Index in Buckhead?
Inequality or Gini Index in Buckhead is 0.36.
What is the Total Population of Buckhead?
Total Population of Buckhead is 183.
What is the Total Male Population of Buckhead?
Total Male Population of Buckhead is 104.
What is the Total Female Population of Buckhead?
Total Female Population of Buckhead is 79.
What is the Ratio of Males per 100 Females in Buckhead?
There are 131.65 Males per 100 Females in Buckhead.
What is the Ratio of Females per 100 Males in Buckhead?
There are 75.96 Females per 100 Males in Buckhead.
What is the Median Population Age in Buckhead?
Median Population Age in Buckhead is 42.1 Years.
What is the Average Family Size in Buckhead
Average Family Size in Buckhead is 2.6 People.
What is the Average Household Size in Buckhead
Average Household Size in Buckhead is 2.2 People.
How Large is the Labor Force in Buckhead?
There are 98 People in the Labor Forcein in Buckhead.
What is the Percentage of People in the Labor Force in Buckhead?
62.0% of People are in the Labor Force in Buckhead.
What is the Unemployment Rate in Buckhead?
Unemployment Rate in Buckhead is 7.1%.