Bowman, GA Map & Demographics
Bowman Map
Bowman Overview
$24,010
PER CAPITA INCOME
$47,500
AVG FAMILY INCOME
$29,464
AVG HOUSEHOLD INCOME
52.0%
WAGE / INCOME GAP [ % ]
48.0¢/ $1
WAGE / INCOME GAP [ $ ]
0.58
INEQUALITY / GINI INDEX
889
TOTAL POPULATION
373
MALE POPULATION
516
FEMALE POPULATION
72.29
MALES / 100 FEMALES
138.34
FEMALES / 100 MALES
39.3
MEDIAN AGE
3.2
AVG FAMILY SIZE
2.4
AVG HOUSEHOLD SIZE
354
LABOR FORCE [ PEOPLE ]
50.9%
PERCENT IN LABOR FORCE
10.5%
UNEMPLOYMENT RATE
Bowman Zip Codes
Bowman Area Codes
Income in Bowman
Income Overview in Bowman
Per Capita Income in Bowman is $24,010, while median incomes of families and households are $47,500 and $29,464 respectively.
| Characteristic | Number | Measure |
| Per Capita Income | 889 | $24,010 |
| Median Family Income | 216 | $47,500 |
| Mean Family Income | 216 | $72,618 |
| Median Household Income | 379 | $29,464 |
| Mean Household Income | 379 | $53,239 |
| Income Deficit | 216 | $0 |
| Wage / Income Gap (%) | 889 | 51.98% |
| Wage / Income Gap ($) | 889 | 48.02¢ per $1 |
| Gini / Inequality Index | 889 | 0.58 |
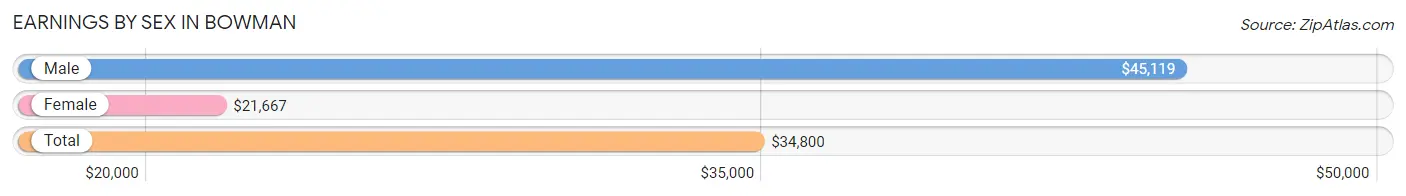
Earnings by Sex in Bowman
Average Earnings in Bowman are $34,800, $45,119 for men and $21,667 for women, a difference of 52.0%.
| Sex | Number | Average Earnings |
| Male | 144 (41.1%) | $45,119 |
| Female | 206 (58.9%) | $21,667 |
| Total | 350 (100.0%) | $34,800 |
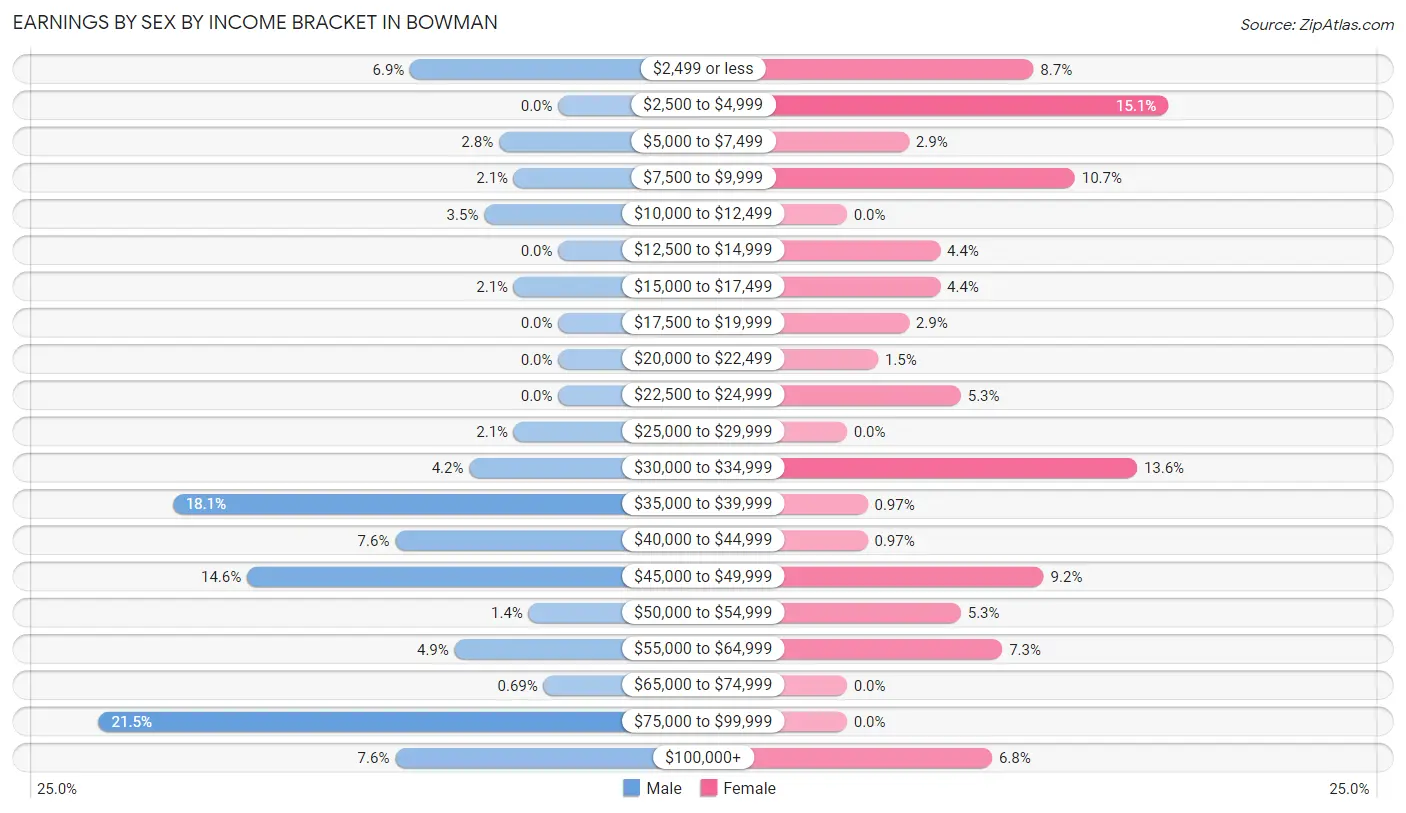
Earnings by Sex by Income Bracket in Bowman
The most common earnings brackets in Bowman are $75,000 to $99,999 for men (31 | 21.5%) and $2,500 to $4,999 for women (31 | 15.0%).
| Income | Male | Female |
| $2,499 or less | 10 (6.9%) | 18 (8.7%) |
| $2,500 to $4,999 | 0 (0.0%) | 31 (15.0%) |
| $5,000 to $7,499 | 4 (2.8%) | 6 (2.9%) |
| $7,500 to $9,999 | 3 (2.1%) | 22 (10.7%) |
| $10,000 to $12,499 | 5 (3.5%) | 0 (0.0%) |
| $12,500 to $14,999 | 0 (0.0%) | 9 (4.4%) |
| $15,000 to $17,499 | 3 (2.1%) | 9 (4.4%) |
| $17,500 to $19,999 | 0 (0.0%) | 6 (2.9%) |
| $20,000 to $22,499 | 0 (0.0%) | 3 (1.5%) |
| $22,500 to $24,999 | 0 (0.0%) | 11 (5.3%) |
| $25,000 to $29,999 | 3 (2.1%) | 0 (0.0%) |
| $30,000 to $34,999 | 6 (4.2%) | 28 (13.6%) |
| $35,000 to $39,999 | 26 (18.1%) | 2 (1.0%) |
| $40,000 to $44,999 | 11 (7.6%) | 2 (1.0%) |
| $45,000 to $49,999 | 21 (14.6%) | 19 (9.2%) |
| $50,000 to $54,999 | 2 (1.4%) | 11 (5.3%) |
| $55,000 to $64,999 | 7 (4.9%) | 15 (7.3%) |
| $65,000 to $74,999 | 1 (0.7%) | 0 (0.0%) |
| $75,000 to $99,999 | 31 (21.5%) | 0 (0.0%) |
| $100,000+ | 11 (7.6%) | 14 (6.8%) |
| Total | 144 (100.0%) | 206 (100.0%) |
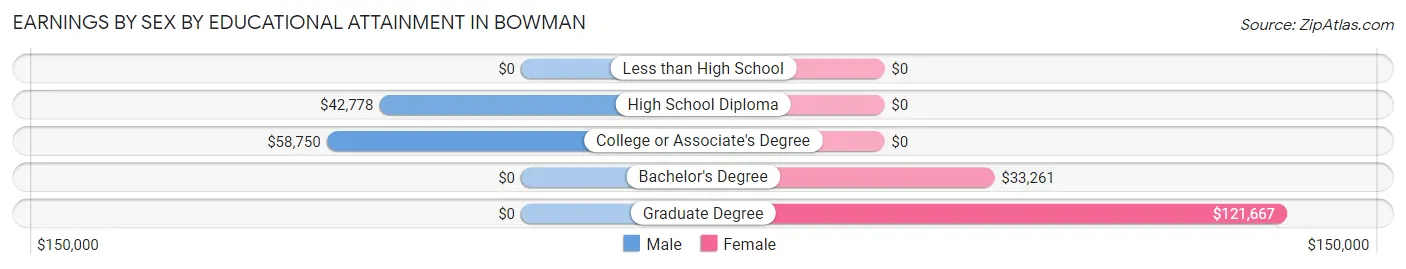
Earnings by Sex by Educational Attainment in Bowman
Average earnings in Bowman are $46,250 for men and $27,500 for women, a difference of 40.5%. Men with an educational attainment of college or associate's degree enjoy the highest average annual earnings of $58,750, while those with high school diploma education earn the least with $42,778. Women with an educational attainment of graduate degree earn the most with the average annual earnings of $121,667, while those with bachelor's degree education have the smallest earnings of $33,261.
| Educational Attainment | Male Income | Female Income |
| Less than High School | - | - |
| High School Diploma | $42,778 | $0 |
| College or Associate's Degree | $58,750 | $0 |
| Bachelor's Degree | - | - |
| Graduate Degree | - | - |
| Total | $46,250 | $27,500 |
Family Income in Bowman
Family Income Brackets in Bowman
According to the Bowman family income data, there are 48 families falling into the $35,000 to $49,999 income range, which is the most common income bracket and makes up 22.2% of all families. Conversely, the $10,000 to $14,999 income bracket is the least frequent group with only 9 families (4.2%) belonging to this category.
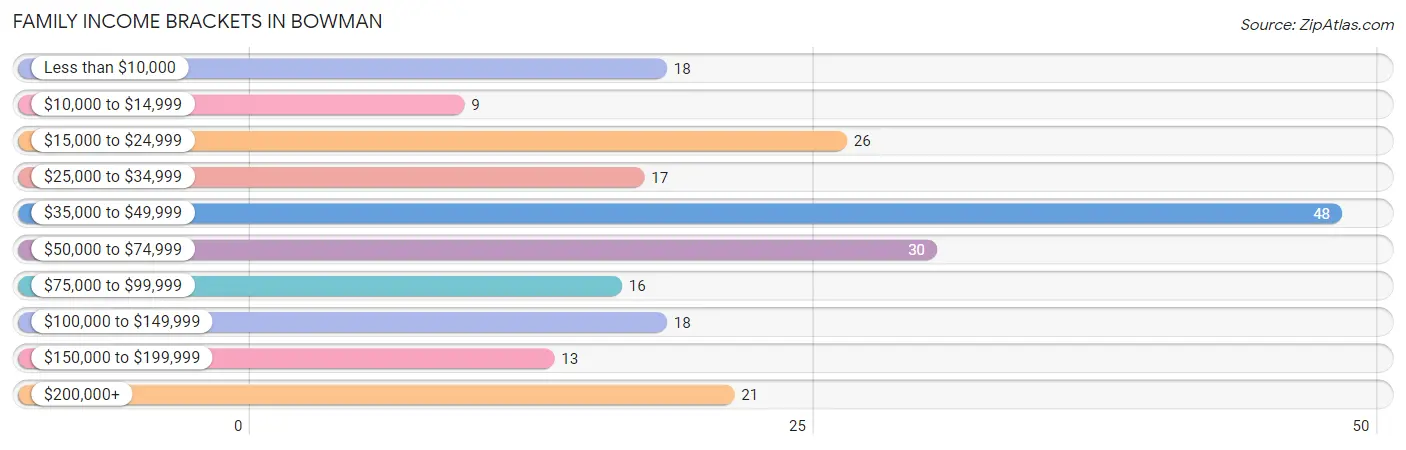
| Income Bracket | # Families | % Families |
| Less than $10,000 | 18 | 8.3% |
| $10,000 to $14,999 | 9 | 4.2% |
| $15,000 to $24,999 | 26 | 12.0% |
| $25,000 to $34,999 | 17 | 7.9% |
| $35,000 to $49,999 | 48 | 22.2% |
| $50,000 to $74,999 | 30 | 13.9% |
| $75,000 to $99,999 | 16 | 7.4% |
| $100,000 to $149,999 | 18 | 8.3% |
| $150,000 to $199,999 | 13 | 6.0% |
| $200,000+ | 21 | 9.7% |
Family Income by Famaliy Size in Bowman
3-person families (83 | 38.4%) account for the highest median family income in Bowman with $45,511 per family, while 2-person families (72 | 33.3%) have the highest median income of $21,875 per family member.
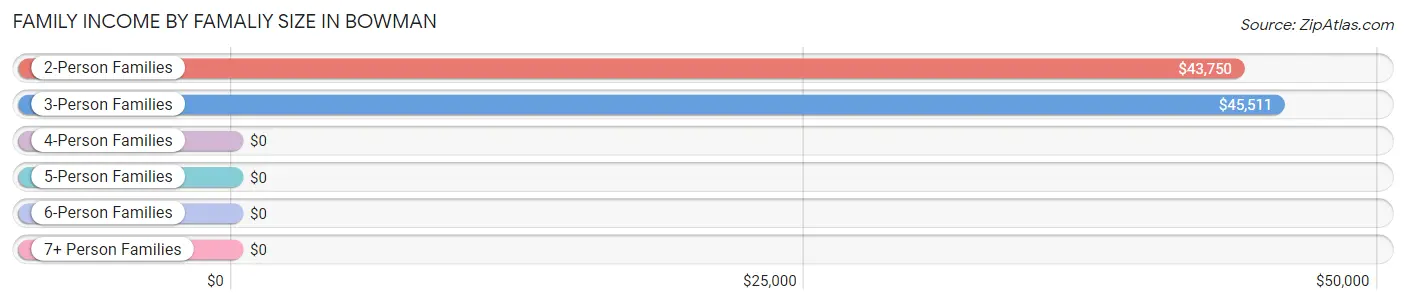
| Income Bracket | # Families | Median Income |
| 2-Person Families | 72 (33.3%) | $43,750 |
| 3-Person Families | 83 (38.4%) | $45,511 |
| 4-Person Families | 43 (19.9%) | $0 |
| 5-Person Families | 12 (5.6%) | $0 |
| 6-Person Families | 6 (2.8%) | $0 |
| 7+ Person Families | 0 (0.0%) | $0 |
| Total | 216 (100.0%) | $47,500 |
Family Income by Number of Earners in Bowman
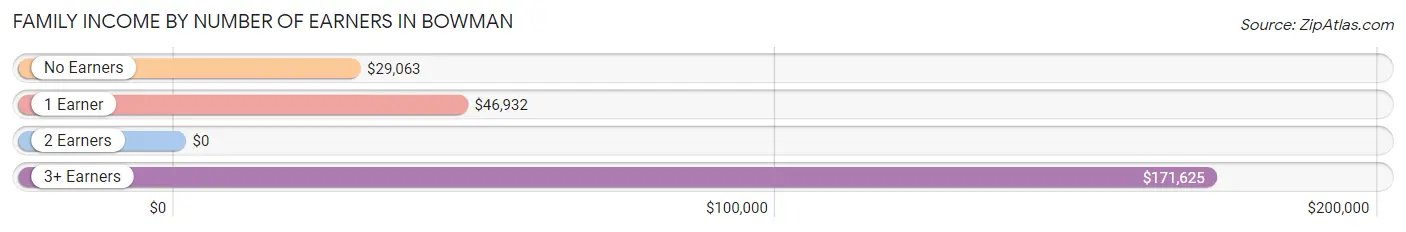
| Number of Earners | # Families | Median Income |
| No Earners | 59 (27.3%) | $29,063 |
| 1 Earner | 74 (34.3%) | $46,932 |
| 2 Earners | 62 (28.7%) | $0 |
| 3+ Earners | 21 (9.7%) | $171,625 |
| Total | 216 (100.0%) | $47,500 |
Household Income in Bowman
Household Income Brackets in Bowman
With 77 households falling in the category, the $10,000 to $14,999 income range is the most frequent in Bowman, accounting for 20.3% of all households. In contrast, only 13 households (3.4%) fall into the $150,000 to $199,999 income bracket, making it the least populous group.
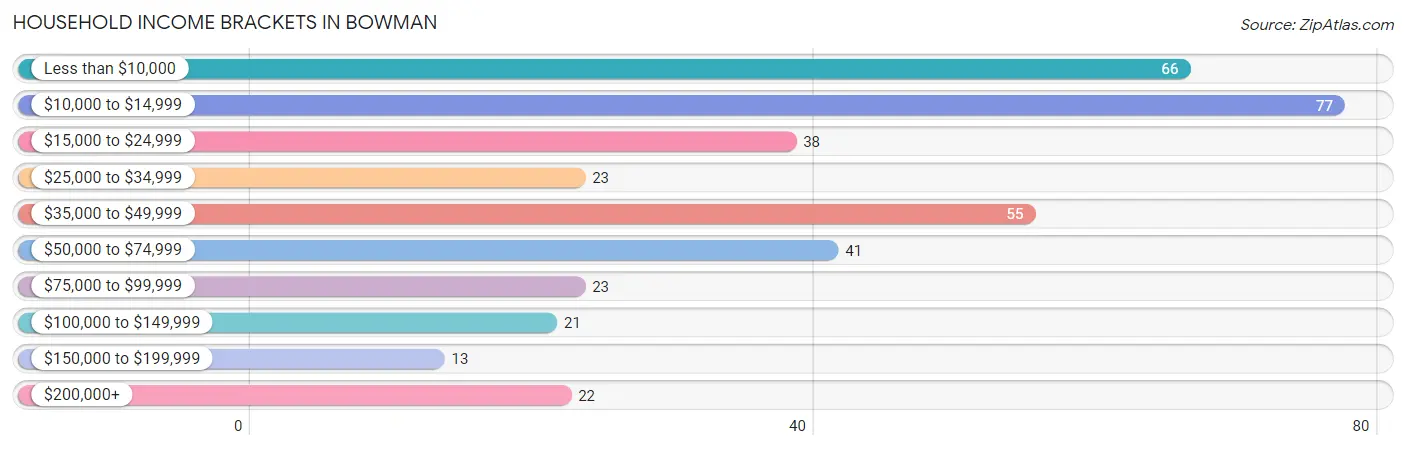
| Income Bracket | # Households | % Households |
| Less than $10,000 | 66 | 17.4% |
| $10,000 to $14,999 | 77 | 20.3% |
| $15,000 to $24,999 | 38 | 10.0% |
| $25,000 to $34,999 | 23 | 6.1% |
| $35,000 to $49,999 | 55 | 14.5% |
| $50,000 to $74,999 | 41 | 10.8% |
| $75,000 to $99,999 | 23 | 6.1% |
| $100,000 to $149,999 | 21 | 5.5% |
| $150,000 to $199,999 | 13 | 3.4% |
| $200,000+ | 22 | 5.8% |
Household Income by Householder Age in Bowman
The median household income in Bowman is $29,464, with the highest median household income of $30,909 found in the 65+ years age bracket for the primary householder. A total of 130 households (34.3%) fall into this category. Meanwhile, the 15 to 24 years age bracket for the primary householder has the lowest median household income of $0, with 15 households (4.0%) in this group.
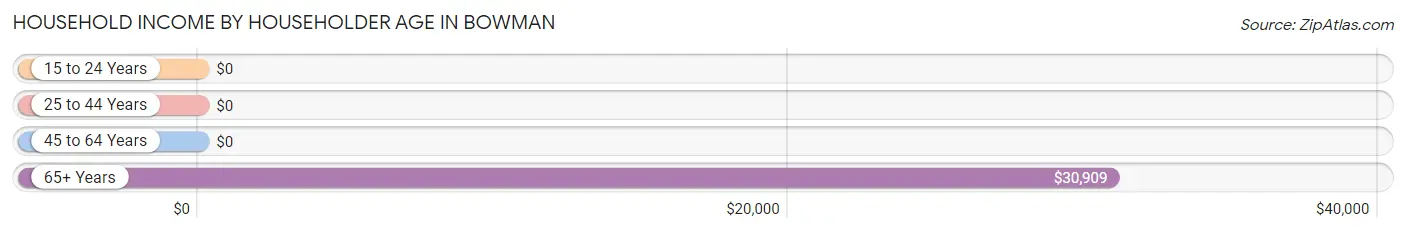
| Income Bracket | # Households | Median Income |
| 15 to 24 Years | 15 (4.0%) | $0 |
| 25 to 44 Years | 86 (22.7%) | $0 |
| 45 to 64 Years | 148 (39.1%) | $0 |
| 65+ Years | 130 (34.3%) | $30,909 |
| Total | 379 (100.0%) | $29,464 |
Poverty in Bowman
Income Below Poverty by Sex and Age in Bowman
With 22.3% poverty level for males and 41.1% for females among the residents of Bowman, 16 and 17 year old males and under 5 year old females are the most vulnerable to poverty, with 3 males (100.0%) and 24 females (70.6%) in their respective age groups living below the poverty level.
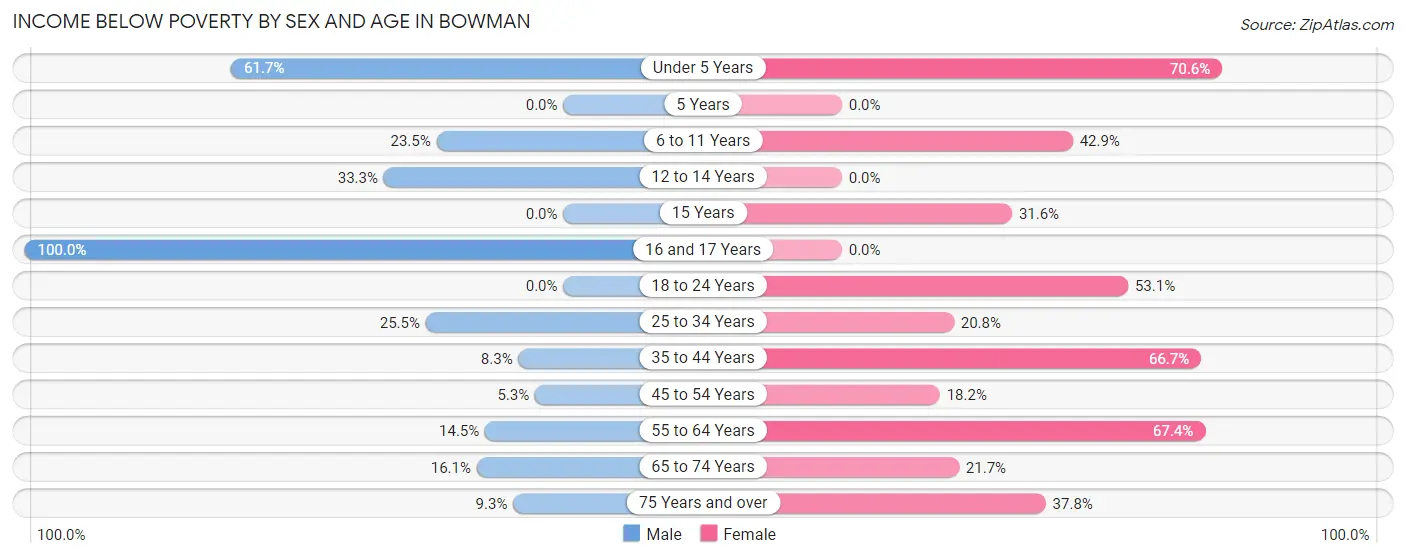
| Age Bracket | Male | Female |
| Under 5 Years | 37 (61.7%) | 24 (70.6%) |
| 5 Years | 0 (0.0%) | 0 (0.0%) |
| 6 to 11 Years | 4 (23.5%) | 15 (42.9%) |
| 12 to 14 Years | 2 (33.3%) | 0 (0.0%) |
| 15 Years | 0 (0.0%) | 6 (31.6%) |
| 16 and 17 Years | 3 (100.0%) | 0 (0.0%) |
| 18 to 24 Years | 0 (0.0%) | 17 (53.1%) |
| 25 to 34 Years | 12 (25.5%) | 21 (20.8%) |
| 35 to 44 Years | 2 (8.3%) | 32 (66.7%) |
| 45 to 54 Years | 1 (5.3%) | 12 (18.2%) |
| 55 to 64 Years | 9 (14.5%) | 58 (67.4%) |
| 65 to 74 Years | 9 (16.1%) | 10 (21.7%) |
| 75 Years and over | 4 (9.3%) | 14 (37.8%) |
| Total | 83 (22.3%) | 209 (41.1%) |
Income Above Poverty by Sex and Age in Bowman
According to the poverty statistics in Bowman, males aged 5 years and females aged 12 to 14 years are the age groups that are most secure financially, with 100.0% of males and 100.0% of females in these age groups living above the poverty line.
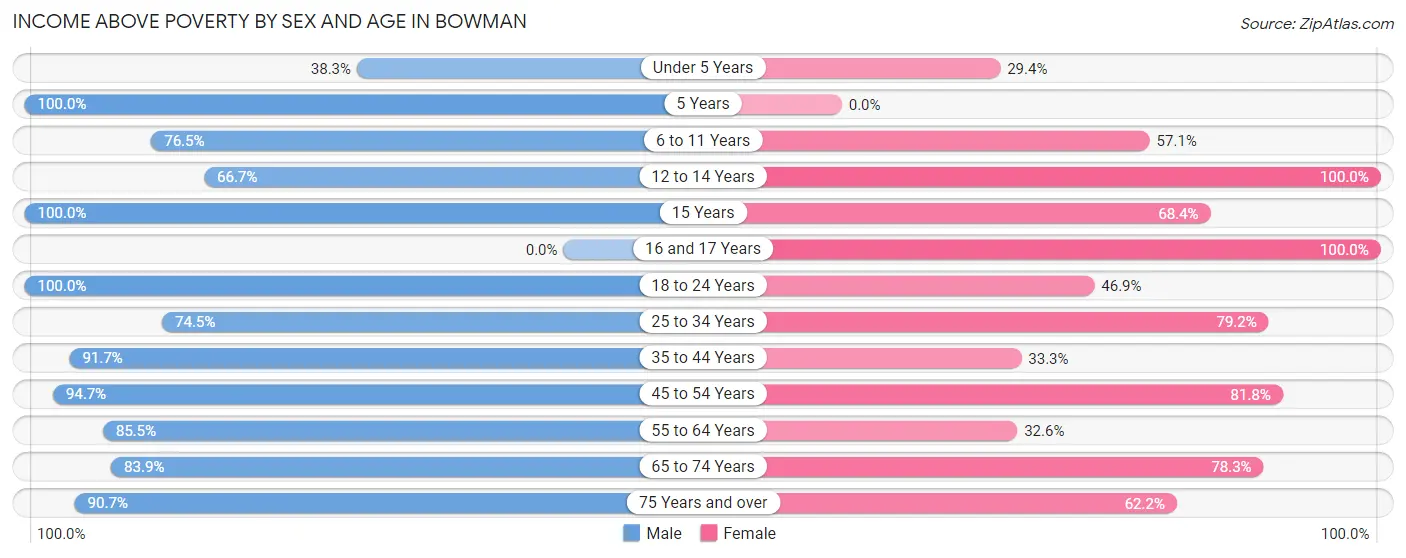
| Age Bracket | Male | Female |
| Under 5 Years | 23 (38.3%) | 10 (29.4%) |
| 5 Years | 3 (100.0%) | 0 (0.0%) |
| 6 to 11 Years | 13 (76.5%) | 20 (57.1%) |
| 12 to 14 Years | 4 (66.7%) | 3 (100.0%) |
| 15 Years | 8 (100.0%) | 13 (68.4%) |
| 16 and 17 Years | 0 (0.0%) | 1 (100.0%) |
| 18 to 24 Years | 25 (100.0%) | 15 (46.9%) |
| 25 to 34 Years | 35 (74.5%) | 80 (79.2%) |
| 35 to 44 Years | 22 (91.7%) | 16 (33.3%) |
| 45 to 54 Years | 18 (94.7%) | 54 (81.8%) |
| 55 to 64 Years | 53 (85.5%) | 28 (32.6%) |
| 65 to 74 Years | 47 (83.9%) | 36 (78.3%) |
| 75 Years and over | 39 (90.7%) | 23 (62.2%) |
| Total | 290 (77.7%) | 299 (58.9%) |
Income Below Poverty Among Married-Couple Families in Bowman
The poverty statistics for married-couple families in Bowman show that 14.7% or 22 of the total 150 families live below the poverty line. Families with 3 or 4 children have the highest poverty rate of 28.6%, comprising of 2 families. On the other hand, families with no children have the lowest poverty rate of 6.7%, which includes 6 families.
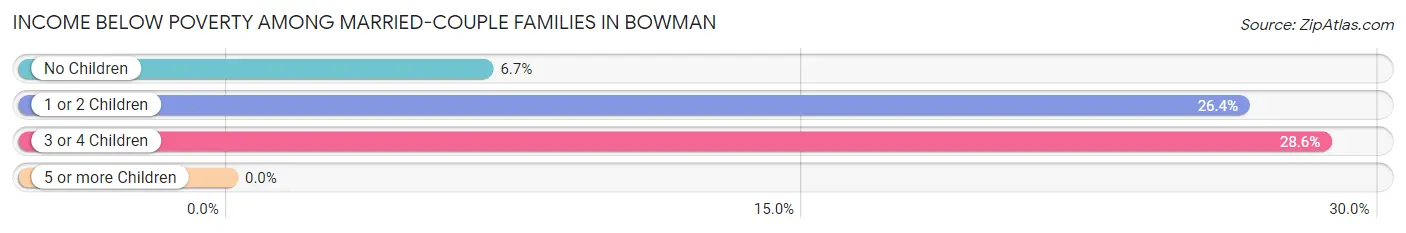
| Children | Above Poverty | Below Poverty |
| No Children | 84 (93.3%) | 6 (6.7%) |
| 1 or 2 Children | 39 (73.6%) | 14 (26.4%) |
| 3 or 4 Children | 5 (71.4%) | 2 (28.6%) |
| 5 or more Children | 0 (0.0%) | 0 (0.0%) |
| Total | 128 (85.3%) | 22 (14.7%) |
Income Below Poverty Among Single-Parent Households in Bowman
According to the poverty data in Bowman, 20.0% or 2 single-father households and 46.4% or 26 single-mother households are living below the poverty line. Among single-father households, those with no children have the highest poverty rate, with 2 households (33.3%) experiencing poverty. Likewise, among single-mother households, those with 3 or 4 children have the highest poverty rate, with 5 households (100.0%) falling below the poverty line.
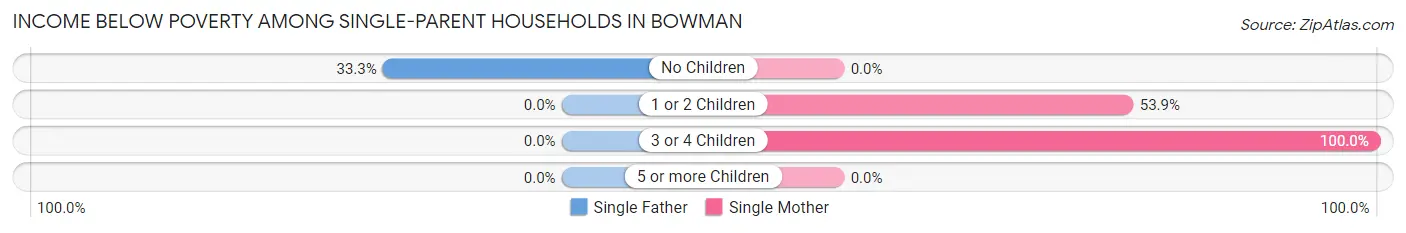
| Children | Single Father | Single Mother |
| No Children | 2 (33.3%) | 0 (0.0%) |
| 1 or 2 Children | 0 (0.0%) | 21 (53.8%) |
| 3 or 4 Children | 0 (0.0%) | 5 (100.0%) |
| 5 or more Children | 0 (0.0%) | 0 (0.0%) |
| Total | 2 (20.0%) | 26 (46.4%) |
Income Below Poverty Among Married-Couple vs Single-Parent Households in Bowman
The poverty data for Bowman shows that 22 of the married-couple family households (14.7%) and 28 of the single-parent households (42.4%) are living below the poverty level. Within the married-couple family households, those with 3 or 4 children have the highest poverty rate, with 2 households (28.6%) falling below the poverty line. Among the single-parent households, those with 3 or 4 children have the highest poverty rate, with 5 household (100.0%) living below poverty.
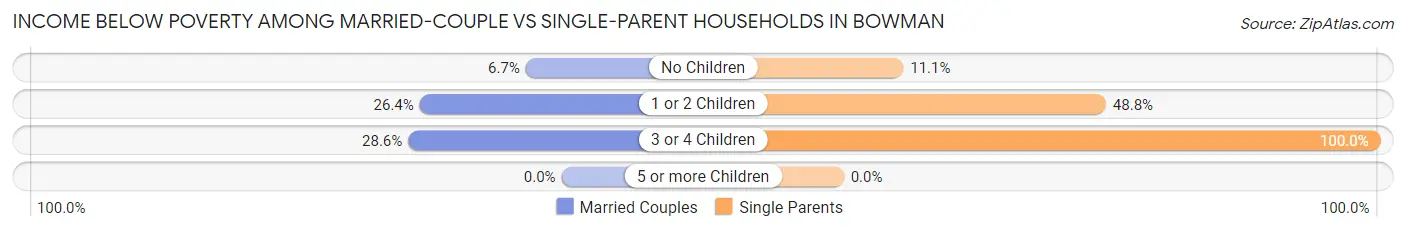
| Children | Married-Couple Families | Single-Parent Households |
| No Children | 6 (6.7%) | 2 (11.1%) |
| 1 or 2 Children | 14 (26.4%) | 21 (48.8%) |
| 3 or 4 Children | 2 (28.6%) | 5 (100.0%) |
| 5 or more Children | 0 (0.0%) | 0 (0.0%) |
| Total | 22 (14.7%) | 28 (42.4%) |
Race in Bowman
The most populous races in Bowman are White / Caucasian (694 | 78.1%), Black / African American (173 | 19.5%), and Two or more Races (22 | 2.5%).
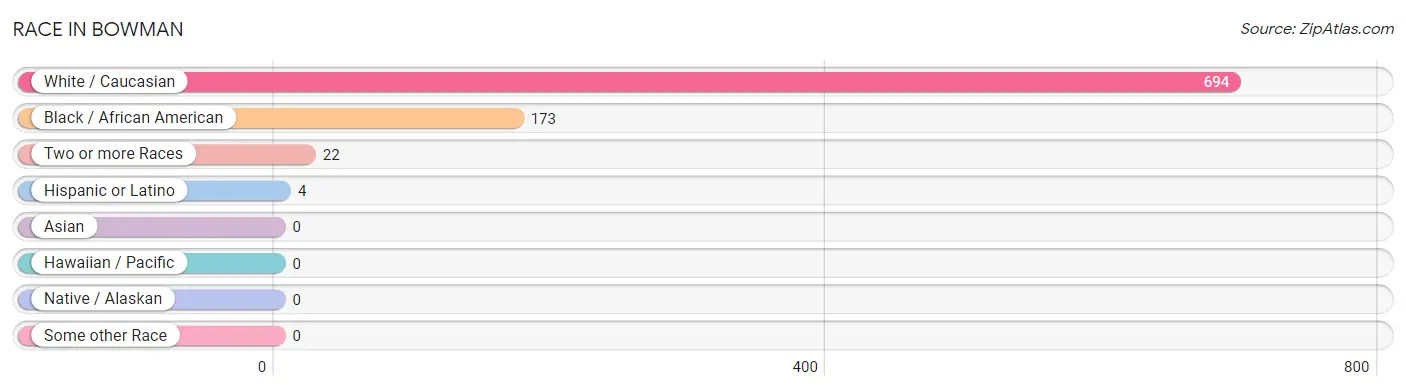
| Race | # Population | % Population |
| Asian | 0 | 0.0% |
| Black / African American | 173 | 19.5% |
| Hawaiian / Pacific | 0 | 0.0% |
| Hispanic or Latino | 4 | 0.4% |
| Native / Alaskan | 0 | 0.0% |
| White / Caucasian | 694 | 78.1% |
| Two or more Races | 22 | 2.5% |
| Some other Race | 0 | 0.0% |
| Total | 889 | 100.0% |
Ancestry in Bowman
The most populous ancestries reported in Bowman are English (145 | 16.3%), American (106 | 11.9%), Eastern European (33 | 3.7%), Irish (28 | 3.2%), and French (18 | 2.0%), together accounting for 37.1% of all Bowman residents.
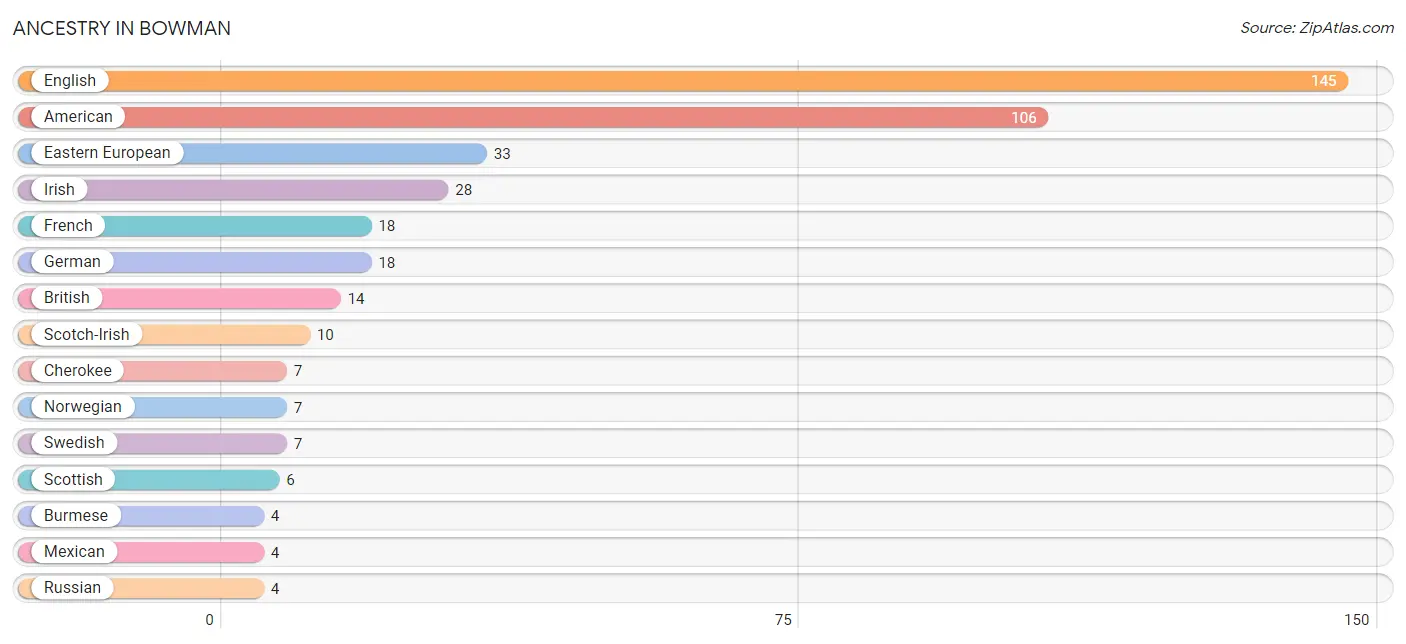
| Ancestry | # Population | % Population |
| American | 106 | 11.9% |
| British | 14 | 1.6% |
| Burmese | 4 | 0.4% |
| Canadian | 3 | 0.3% |
| Cherokee | 7 | 0.8% |
| Dutch | 2 | 0.2% |
| Eastern European | 33 | 3.7% |
| English | 145 | 16.3% |
| French | 18 | 2.0% |
| German | 18 | 2.0% |
| Irish | 28 | 3.2% |
| Mexican | 4 | 0.4% |
| Norwegian | 7 | 0.8% |
| Polish | 1 | 0.1% |
| Russian | 4 | 0.4% |
| Scotch-Irish | 10 | 1.1% |
| Scottish | 6 | 0.7% |
| Swedish | 7 | 0.8% | View All 18 Rows |
Immigrants in Bowman

| Immigration Origin | # Population | % Population | View All 0 Rows |
Sex and Age in Bowman
Sex and Age in Bowman
The most populous age groups in Bowman are Under 5 Years (60 | 16.1%) for men and 55 to 59 Years (63 | 12.2%) for women.
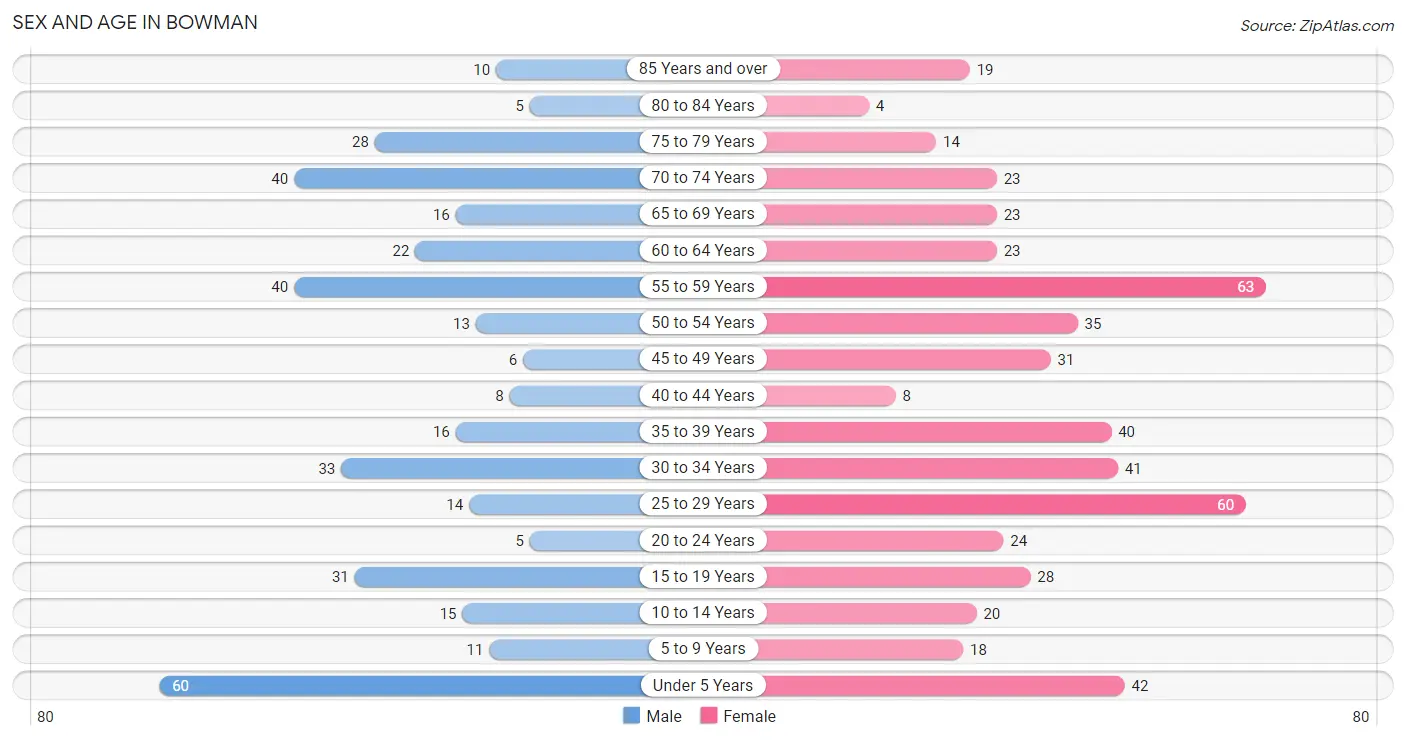
| Age Bracket | Male | Female |
| Under 5 Years | 60 (16.1%) | 42 (8.1%) |
| 5 to 9 Years | 11 (2.9%) | 18 (3.5%) |
| 10 to 14 Years | 15 (4.0%) | 20 (3.9%) |
| 15 to 19 Years | 31 (8.3%) | 28 (5.4%) |
| 20 to 24 Years | 5 (1.3%) | 24 (4.6%) |
| 25 to 29 Years | 14 (3.7%) | 60 (11.6%) |
| 30 to 34 Years | 33 (8.8%) | 41 (8.0%) |
| 35 to 39 Years | 16 (4.3%) | 40 (7.7%) |
| 40 to 44 Years | 8 (2.1%) | 8 (1.5%) |
| 45 to 49 Years | 6 (1.6%) | 31 (6.0%) |
| 50 to 54 Years | 13 (3.5%) | 35 (6.8%) |
| 55 to 59 Years | 40 (10.7%) | 63 (12.2%) |
| 60 to 64 Years | 22 (5.9%) | 23 (4.5%) |
| 65 to 69 Years | 16 (4.3%) | 23 (4.5%) |
| 70 to 74 Years | 40 (10.7%) | 23 (4.5%) |
| 75 to 79 Years | 28 (7.5%) | 14 (2.7%) |
| 80 to 84 Years | 5 (1.3%) | 4 (0.8%) |
| 85 Years and over | 10 (2.7%) | 19 (3.7%) |
| Total | 373 (100.0%) | 516 (100.0%) |
Families and Households in Bowman
Median Family Size in Bowman
The median family size in Bowman is 3.23 persons per family, with single male/father families (10 | 4.6%) accounting for the largest median family size of 4.2 persons per family. On the other hand, married-couple families (150 | 69.4%) represent the smallest median family size with 2.98 persons per family.
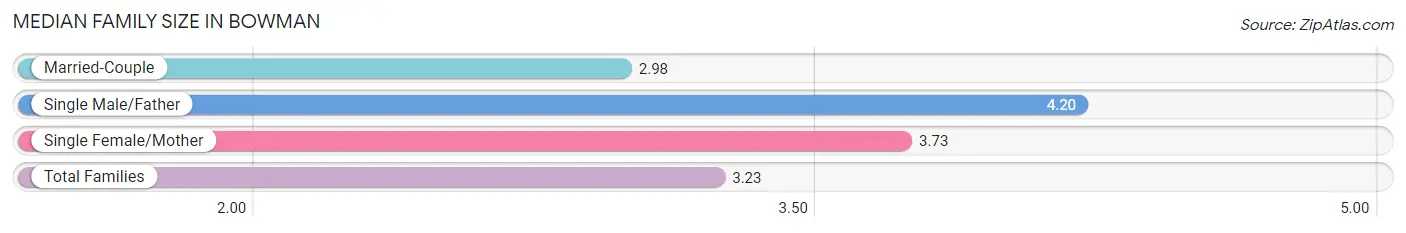
| Family Type | # Families | Family Size |
| Married-Couple | 150 (69.4%) | 2.98 |
| Single Male/Father | 10 (4.6%) | 4.20 |
| Single Female/Mother | 56 (25.9%) | 3.73 |
| Total Families | 216 (100.0%) | 3.23 |
Median Household Size in Bowman
The median household size in Bowman is 2.35 persons per household, with single male/father households (10 | 2.6%) accounting for the largest median household size of 4.4 persons per household. non-family households (163 | 43.0%) represent the smallest median household size with 1.05 persons per household.
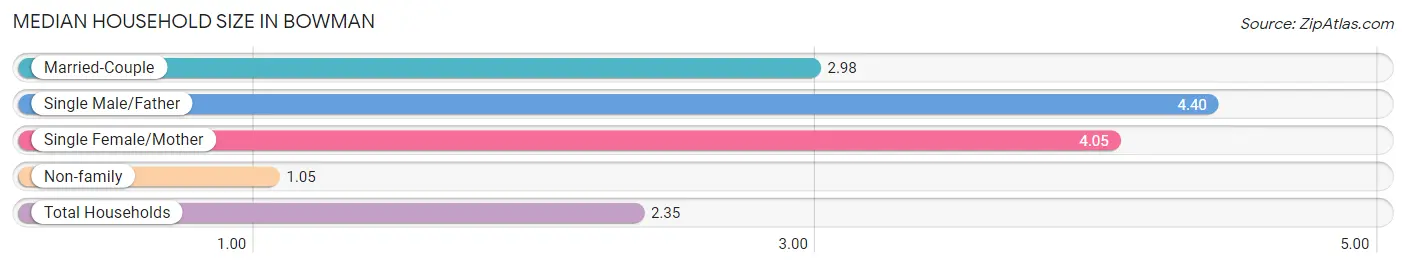
| Household Type | # Households | Household Size |
| Married-Couple | 150 (39.6%) | 2.98 |
| Single Male/Father | 10 (2.6%) | 4.40 |
| Single Female/Mother | 56 (14.8%) | 4.05 |
| Non-family | 163 (43.0%) | 1.05 |
| Total Households | 379 (100.0%) | 2.35 |
Household Size by Marriage Status in Bowman
Out of a total of 379 households in Bowman, 216 (57.0%) are family households, while 163 (43.0%) are nonfamily households. The most numerous type of family households are 3-person households, comprising 74, and the most common type of nonfamily households are 1-person households, comprising 158.
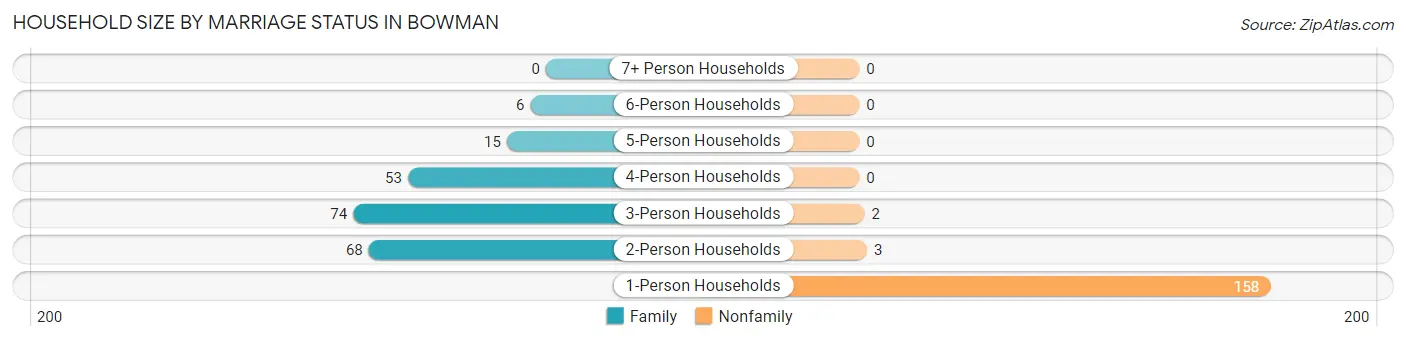
| Household Size | Family Households | Nonfamily Households |
| 1-Person Households | - | 158 (41.7%) |
| 2-Person Households | 68 (17.9%) | 3 (0.8%) |
| 3-Person Households | 74 (19.5%) | 2 (0.5%) |
| 4-Person Households | 53 (14.0%) | 0 (0.0%) |
| 5-Person Households | 15 (4.0%) | 0 (0.0%) |
| 6-Person Households | 6 (1.6%) | 0 (0.0%) |
| 7+ Person Households | 0 (0.0%) | 0 (0.0%) |
| Total | 216 (57.0%) | 163 (43.0%) |
Female Fertility in Bowman
Fertility by Age in Bowman
Average fertility rate in Bowman is 79.0 births per 1,000 women. Women in the age bracket of 20 to 34 years have the highest fertility rate with 136.0 births per 1,000 women. Women in the age bracket of 20 to 34 years acount for 89.5% of all women with births.
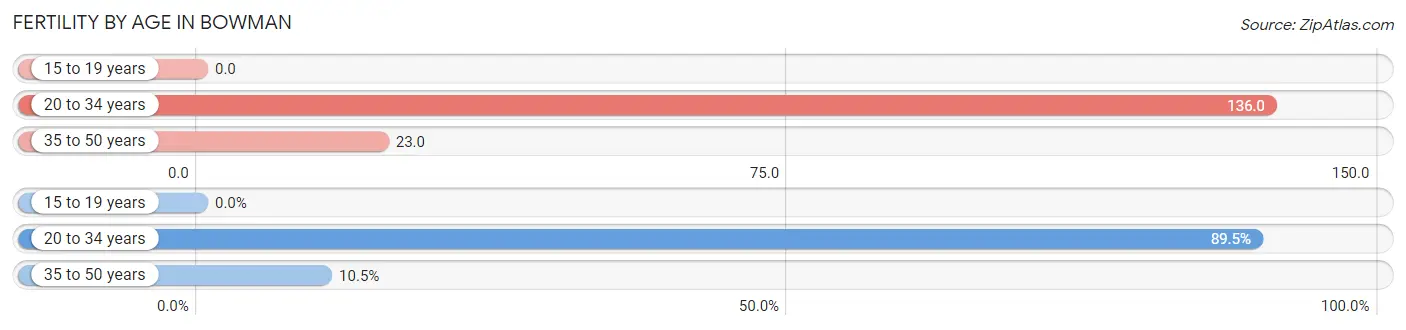
| Age Bracket | Women with Births | Births / 1,000 Women |
| 15 to 19 years | 0 (0.0%) | 0.0 |
| 20 to 34 years | 17 (89.5%) | 136.0 |
| 35 to 50 years | 2 (10.5%) | 23.0 |
| Total | 19 (100.0%) | 79.0 |
Fertility by Age by Marriage Status in Bowman
36.8% of women with births (19) in Bowman are married. The highest percentage of unmarried women with births falls into 20 to 34 years age bracket with 70.6% of them unmarried at the time of birth, while the lowest percentage of unmarried women with births belong to 35 to 50 years age bracket with 0.0% of them unmarried.
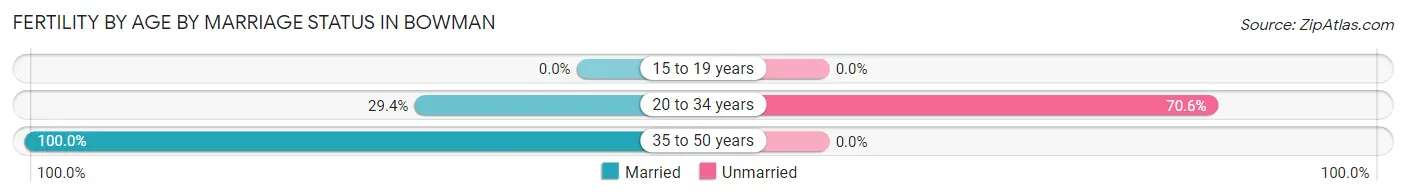
| Age Bracket | Married | Unmarried |
| 15 to 19 years | 0 (0.0%) | 0 (0.0%) |
| 20 to 34 years | 5 (29.4%) | 12 (70.6%) |
| 35 to 50 years | 2 (100.0%) | 0 (0.0%) |
| Total | 7 (36.8%) | 12 (63.2%) |
Fertility by Education in Bowman
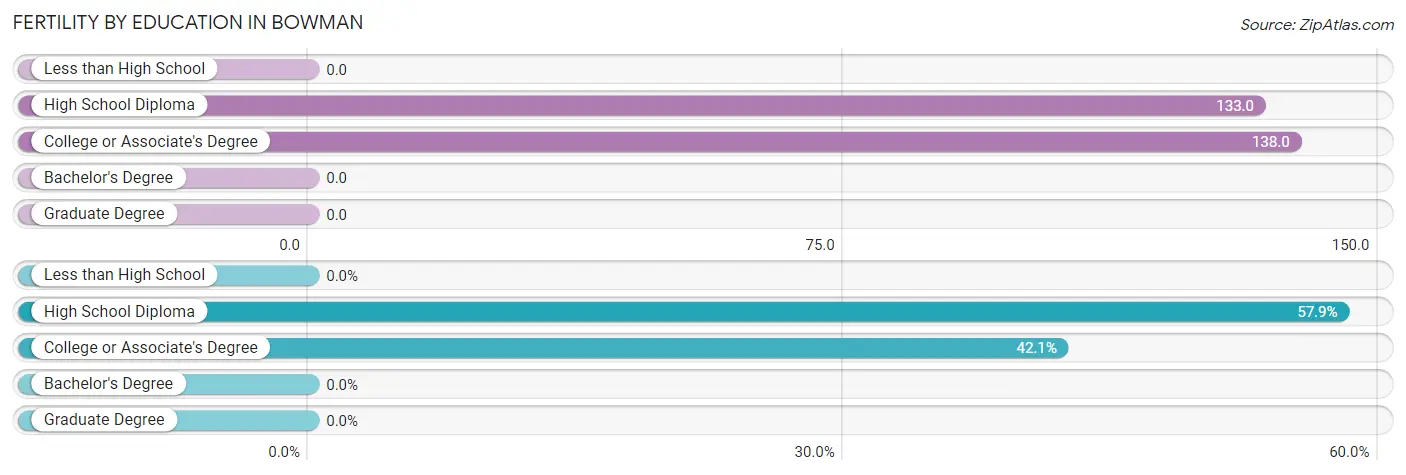
| Educational Attainment | Women with Births | Births / 1,000 Women |
| Less than High School | 0 (0.0%) | 0.0 |
| High School Diploma | 11 (57.9%) | 133.0 |
| College or Associate's Degree | 8 (42.1%) | 138.0 |
| Bachelor's Degree | 0 (0.0%) | 0.0 |
| Graduate Degree | 0 (0.0%) | 0.0 |
| Total | 19 (100.0%) | 79.0 |
Fertility by Education by Marriage Status in Bowman
63.2% of women with births in Bowman are unmarried. Women with the educational attainment of college or associate's degree are most likely to be married with 62.5% of them married at childbirth, while women with the educational attainment of high school diploma are least likely to be married with 81.8% of them unmarried at childbirth.
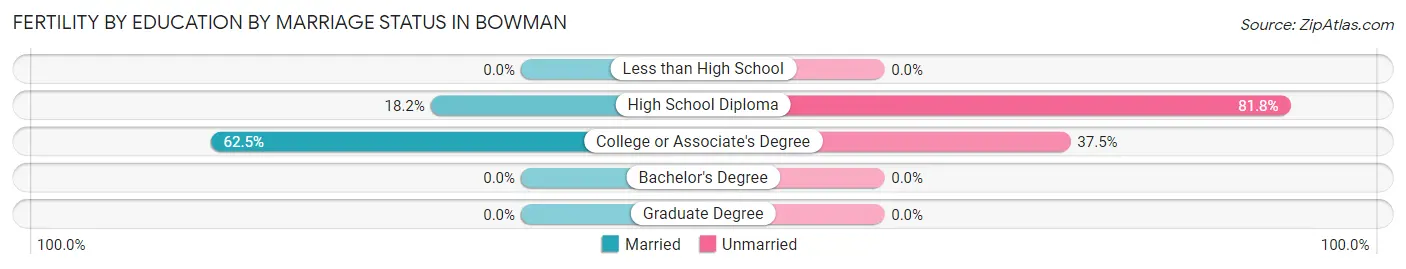
| Educational Attainment | Married | Unmarried |
| Less than High School | 0 (0.0%) | 0 (0.0%) |
| High School Diploma | 2 (18.2%) | 9 (81.8%) |
| College or Associate's Degree | 5 (62.5%) | 3 (37.5%) |
| Bachelor's Degree | 0 (0.0%) | 0 (0.0%) |
| Graduate Degree | 0 (0.0%) | 0 (0.0%) |
| Total | 7 (36.8%) | 12 (63.2%) |
Employment Characteristics in Bowman
Employment by Class of Employer in Bowman
Among the 314 employed individuals in Bowman, private company employees (219 | 69.8%), local government employees (35 | 11.2%), and self-employed (not incorporated) (23 | 7.3%) make up the most common classes of employment.
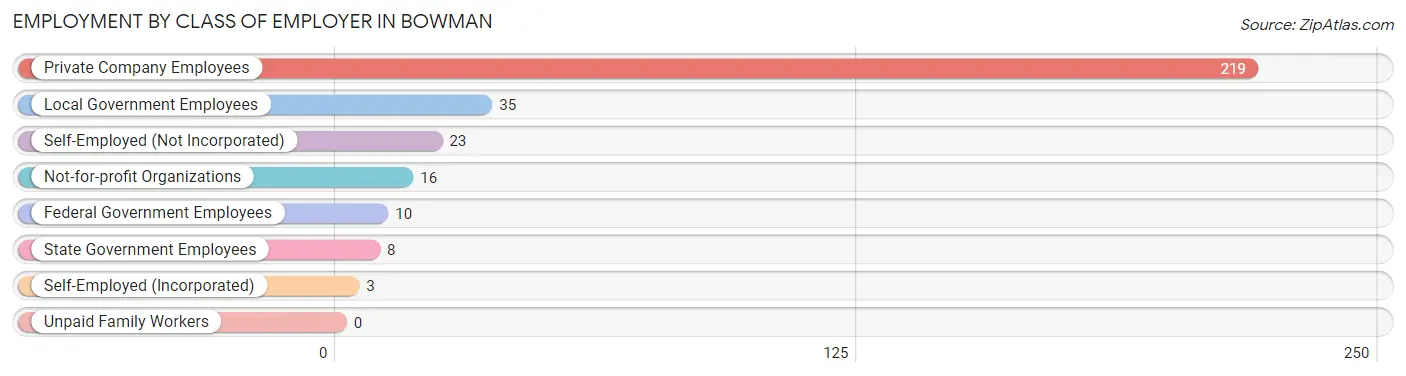
| Employer Class | # Employees | % Employees |
| Private Company Employees | 219 | 69.8% |
| Self-Employed (Incorporated) | 3 | 1.0% |
| Self-Employed (Not Incorporated) | 23 | 7.3% |
| Not-for-profit Organizations | 16 | 5.1% |
| Local Government Employees | 35 | 11.2% |
| State Government Employees | 8 | 2.5% |
| Federal Government Employees | 10 | 3.2% |
| Unpaid Family Workers | 0 | 0.0% |
| Total | 314 | 100.0% |
Employment Status by Age in Bowman
According to the labor force statistics for Bowman, out of the total population over 16 years of age (696), 50.9% or 354 individuals are in the labor force, with 10.5% or 37 of them unemployed. The age group with the highest labor force participation rate is 25 to 29 years, with 95.9% or 71 individuals in the labor force. Within the labor force, the 16 to 19 years age range has the highest percentage of unemployed individuals, with 100.0% or 20 of them being unemployed.
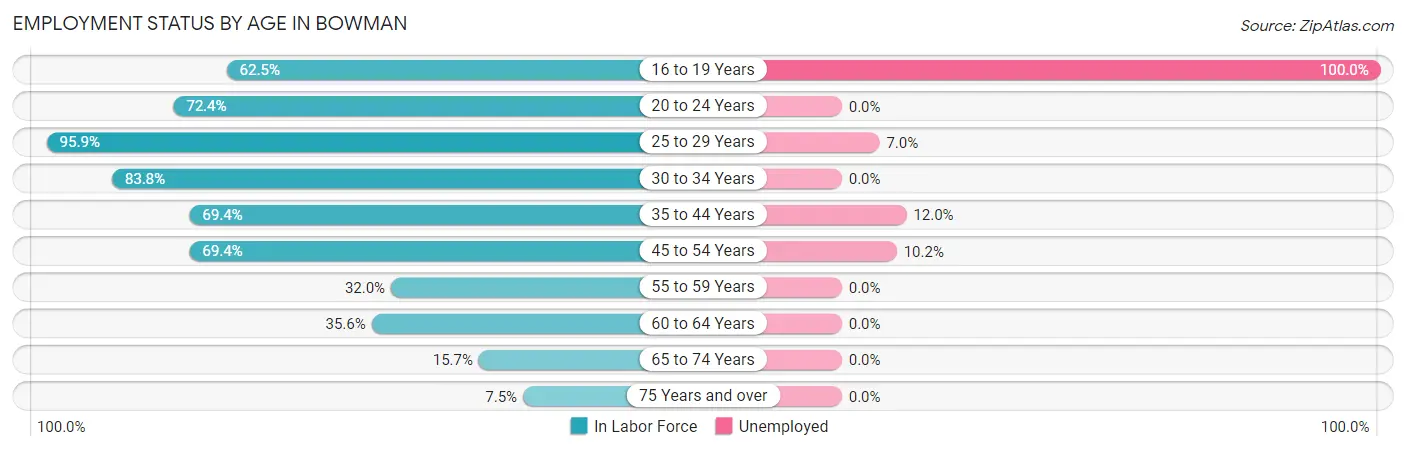
| Age Bracket | In Labor Force | Unemployed |
| 16 to 19 Years | 20 (62.5%) | 20 (100.0%) |
| 20 to 24 Years | 21 (72.4%) | 0 (0.0%) |
| 25 to 29 Years | 71 (95.9%) | 5 (7.0%) |
| 30 to 34 Years | 62 (83.8%) | 0 (0.0%) |
| 35 to 44 Years | 50 (69.4%) | 6 (12.0%) |
| 45 to 54 Years | 59 (69.4%) | 6 (10.2%) |
| 55 to 59 Years | 33 (32.0%) | 0 (0.0%) |
| 60 to 64 Years | 16 (35.6%) | 0 (0.0%) |
| 65 to 74 Years | 16 (15.7%) | 0 (0.0%) |
| 75 Years and over | 6 (7.5%) | 0 (0.0%) |
| Total | 354 (50.9%) | 37 (10.5%) |
Employment Status by Educational Attainment in Bowman
According to labor force statistics for Bowman, 64.2% of individuals (291) out of the total population between 25 and 64 years of age (453) are in the labor force, with 5.8% or 17 of them being unemployed. The group with the highest labor force participation rate are those with the educational attainment of bachelor's degree or higher, with 95.0% or 96 individuals in the labor force. Within the labor force, individuals with less than high school education have the highest percentage of unemployment, with 32.4% or 12 of them being unemployed.
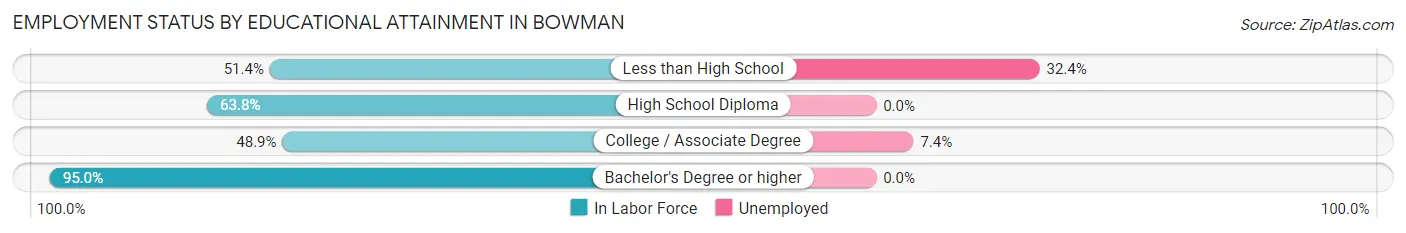
| Educational Attainment | In Labor Force | Unemployed |
| Less than High School | 37 (51.4%) | 23 (32.4%) |
| High School Diploma | 90 (63.8%) | 0 (0.0%) |
| College / Associate Degree | 68 (48.9%) | 10 (7.4%) |
| Bachelor's Degree or higher | 96 (95.0%) | 0 (0.0%) |
| Total | 291 (64.2%) | 26 (5.8%) |
Employment Occupations by Sex in Bowman
Management, Business, Science and Arts Occupations
The most common Management, Business, Science and Arts occupations in Bowman are Health Diagnosing & Treating (39 | 12.3%), Management (33 | 10.4%), Business & Financial (23 | 7.3%), Community & Social Service (15 | 4.7%), and Computers, Engineering & Science (13 | 4.1%).
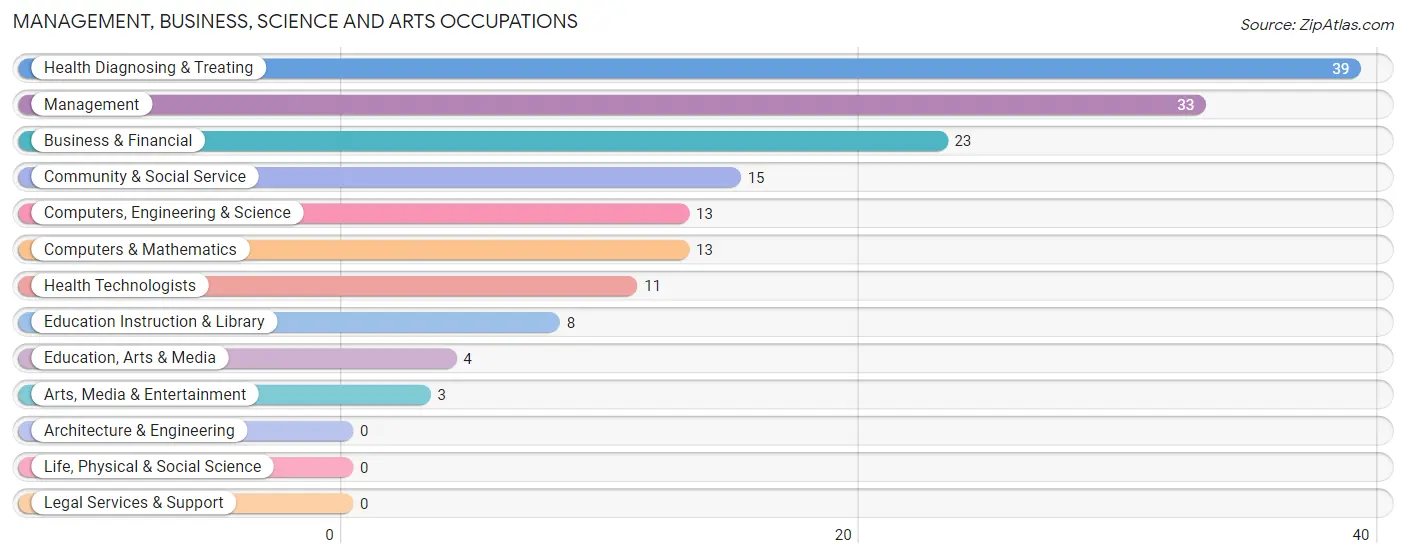
Management, Business, Science and Arts Occupations by Sex
Within the Management, Business, Science and Arts occupations in Bowman, the most male-oriented occupations are Education, Arts & Media (100.0%), Computers, Engineering & Science (76.9%), and Computers & Mathematics (76.9%), while the most female-oriented occupations are Health Diagnosing & Treating (82.1%), Management (78.8%), and Education Instruction & Library (75.0%).
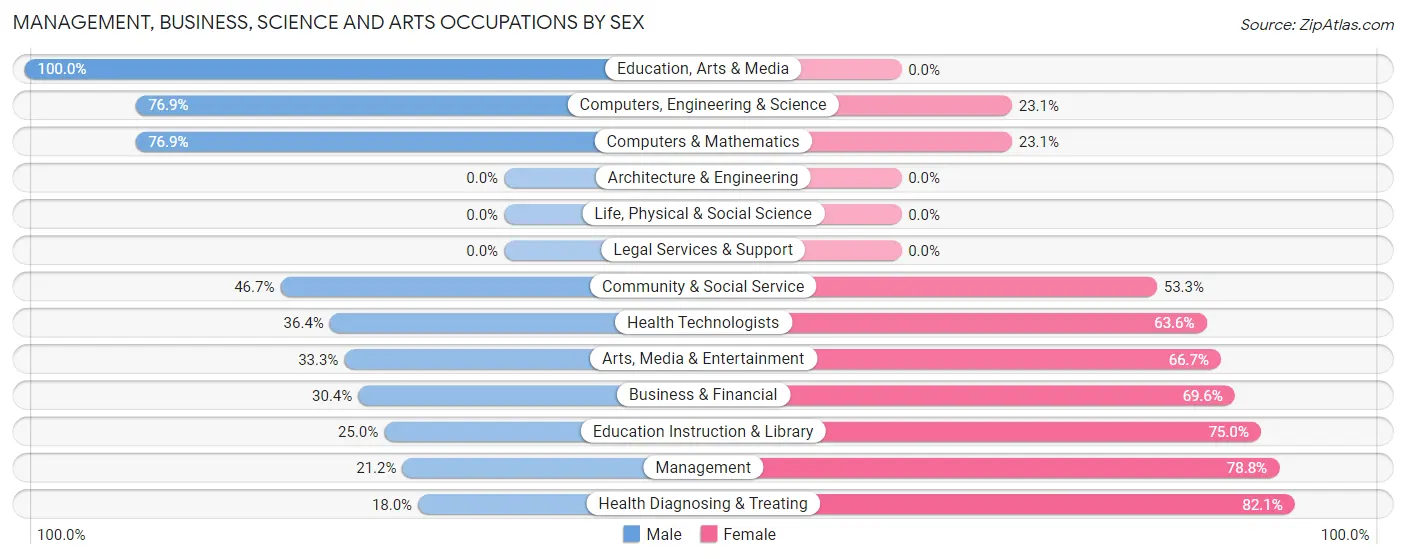
| Occupation | Male | Female |
| Management | 7 (21.2%) | 26 (78.8%) |
| Business & Financial | 7 (30.4%) | 16 (69.6%) |
| Computers, Engineering & Science | 10 (76.9%) | 3 (23.1%) |
| Computers & Mathematics | 10 (76.9%) | 3 (23.1%) |
| Architecture & Engineering | 0 (0.0%) | 0 (0.0%) |
| Life, Physical & Social Science | 0 (0.0%) | 0 (0.0%) |
| Community & Social Service | 7 (46.7%) | 8 (53.3%) |
| Education, Arts & Media | 4 (100.0%) | 0 (0.0%) |
| Legal Services & Support | 0 (0.0%) | 0 (0.0%) |
| Education Instruction & Library | 2 (25.0%) | 6 (75.0%) |
| Arts, Media & Entertainment | 1 (33.3%) | 2 (66.7%) |
| Health Diagnosing & Treating | 7 (17.9%) | 32 (82.1%) |
| Health Technologists | 4 (36.4%) | 7 (63.6%) |
| Total (Category) | 38 (30.9%) | 85 (69.1%) |
| Total (Overall) | 119 (37.5%) | 198 (62.5%) |
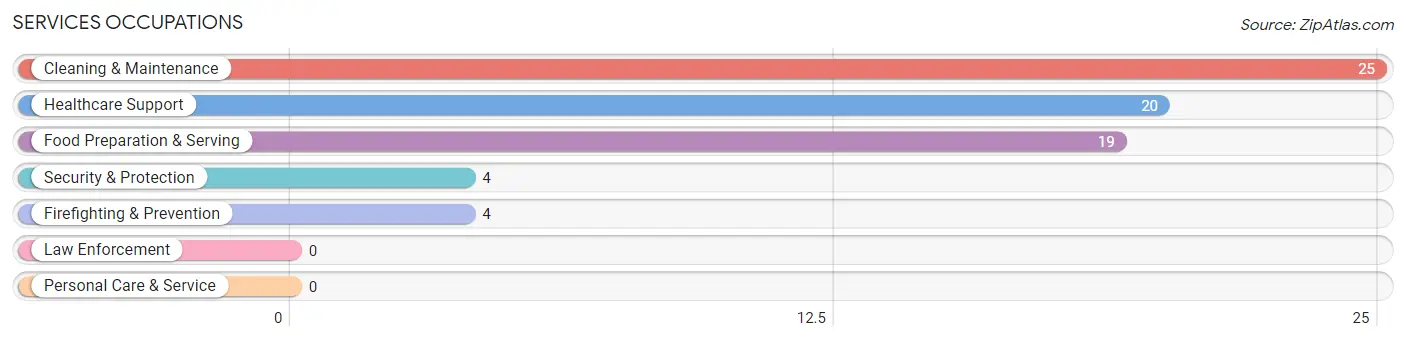
Services Occupations
The most common Services occupations in Bowman are Cleaning & Maintenance (25 | 7.9%), Healthcare Support (20 | 6.3%), Food Preparation & Serving (19 | 6.0%), Security & Protection (4 | 1.3%), and Firefighting & Prevention (4 | 1.3%).
Services Occupations by Sex
Within the Services occupations in Bowman, the most male-oriented occupations are Security & Protection (100.0%), Firefighting & Prevention (100.0%), and Healthcare Support (15.0%), while the most female-oriented occupations are Food Preparation & Serving (100.0%), Cleaning & Maintenance (100.0%), and Healthcare Support (85.0%).
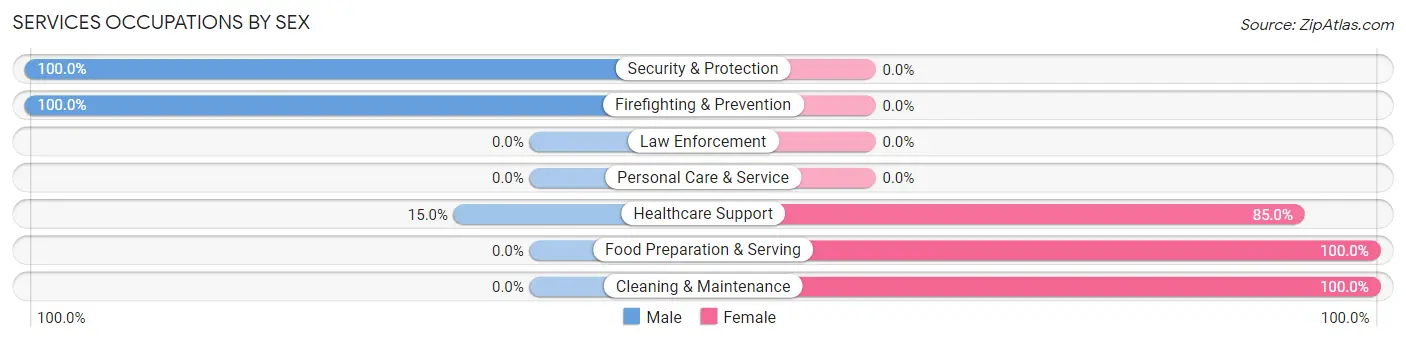
| Occupation | Male | Female |
| Healthcare Support | 3 (15.0%) | 17 (85.0%) |
| Security & Protection | 4 (100.0%) | 0 (0.0%) |
| Firefighting & Prevention | 4 (100.0%) | 0 (0.0%) |
| Law Enforcement | 0 (0.0%) | 0 (0.0%) |
| Food Preparation & Serving | 0 (0.0%) | 19 (100.0%) |
| Cleaning & Maintenance | 0 (0.0%) | 25 (100.0%) |
| Personal Care & Service | 0 (0.0%) | 0 (0.0%) |
| Total (Category) | 7 (10.3%) | 61 (89.7%) |
| Total (Overall) | 119 (37.5%) | 198 (62.5%) |
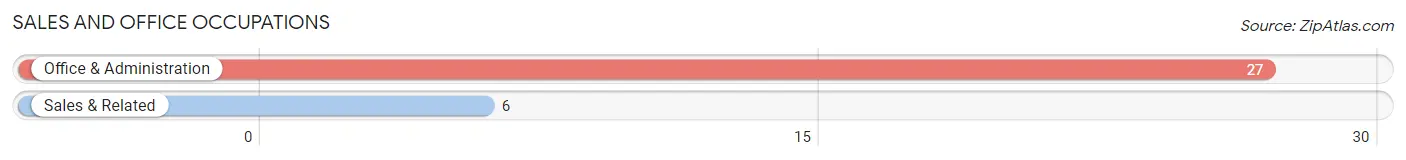
Sales and Office Occupations
The most common Sales and Office occupations in Bowman are Office & Administration (27 | 8.5%), and Sales & Related (6 | 1.9%).
Sales and Office Occupations by Sex
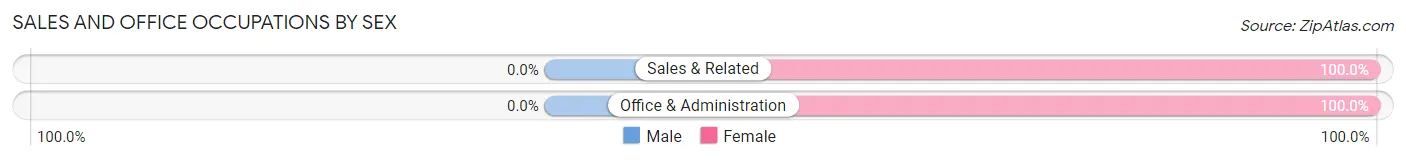
| Occupation | Male | Female |
| Sales & Related | 0 (0.0%) | 6 (100.0%) |
| Office & Administration | 0 (0.0%) | 27 (100.0%) |
| Total (Category) | 0 (0.0%) | 33 (100.0%) |
| Total (Overall) | 119 (37.5%) | 198 (62.5%) |
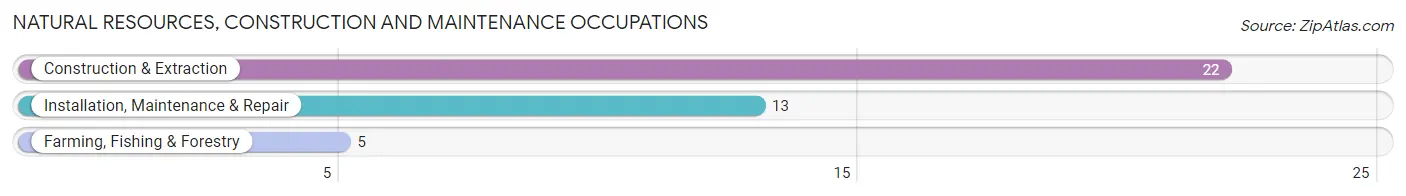
Natural Resources, Construction and Maintenance Occupations
The most common Natural Resources, Construction and Maintenance occupations in Bowman are Construction & Extraction (22 | 6.9%), Installation, Maintenance & Repair (13 | 4.1%), and Farming, Fishing & Forestry (5 | 1.6%).
Natural Resources, Construction and Maintenance Occupations by Sex
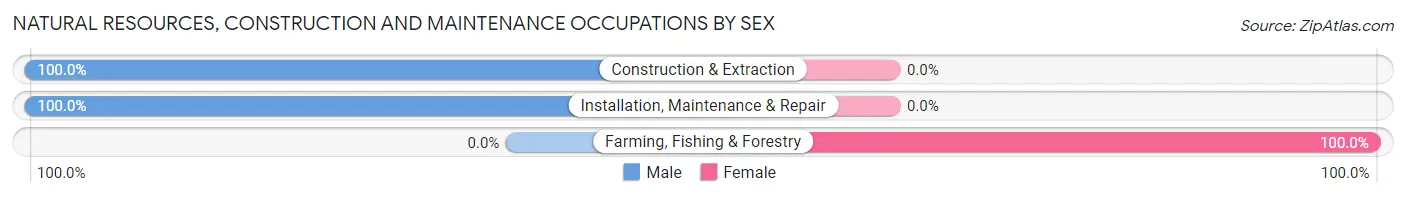
| Occupation | Male | Female |
| Farming, Fishing & Forestry | 0 (0.0%) | 5 (100.0%) |
| Construction & Extraction | 22 (100.0%) | 0 (0.0%) |
| Installation, Maintenance & Repair | 13 (100.0%) | 0 (0.0%) |
| Total (Category) | 35 (87.5%) | 5 (12.5%) |
| Total (Overall) | 119 (37.5%) | 198 (62.5%) |
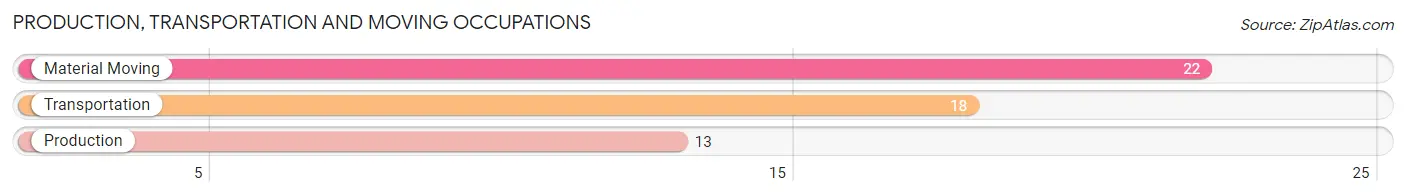
Production, Transportation and Moving Occupations
The most common Production, Transportation and Moving occupations in Bowman are Material Moving (22 | 6.9%), Transportation (18 | 5.7%), and Production (13 | 4.1%).
Production, Transportation and Moving Occupations by Sex
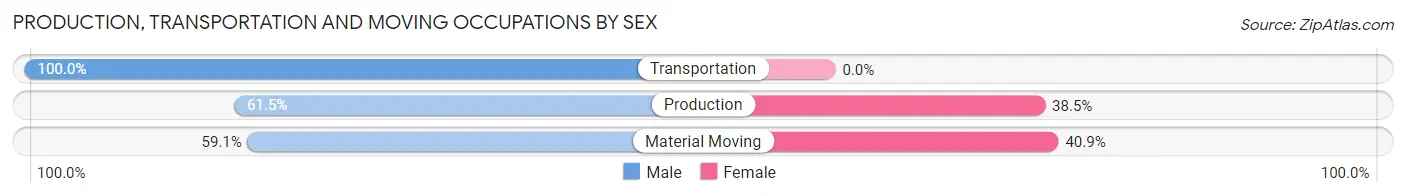
| Occupation | Male | Female |
| Production | 8 (61.5%) | 5 (38.5%) |
| Transportation | 18 (100.0%) | 0 (0.0%) |
| Material Moving | 13 (59.1%) | 9 (40.9%) |
| Total (Category) | 39 (73.6%) | 14 (26.4%) |
| Total (Overall) | 119 (37.5%) | 198 (62.5%) |
Employment Industries by Sex in Bowman
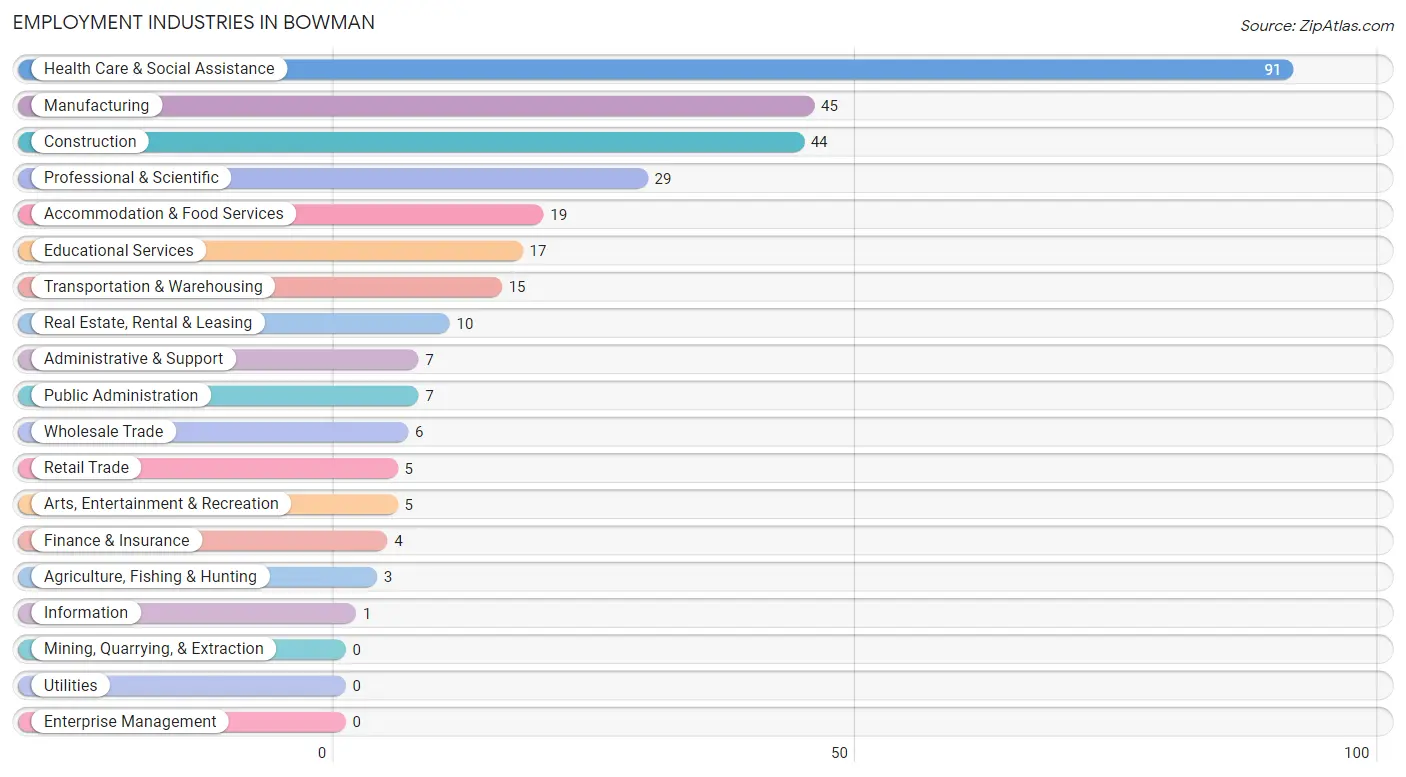
Employment Industries in Bowman
The major employment industries in Bowman include Health Care & Social Assistance (91 | 28.7%), Manufacturing (45 | 14.2%), Construction (44 | 13.9%), Professional & Scientific (29 | 9.1%), and Accommodation & Food Services (19 | 6.0%).
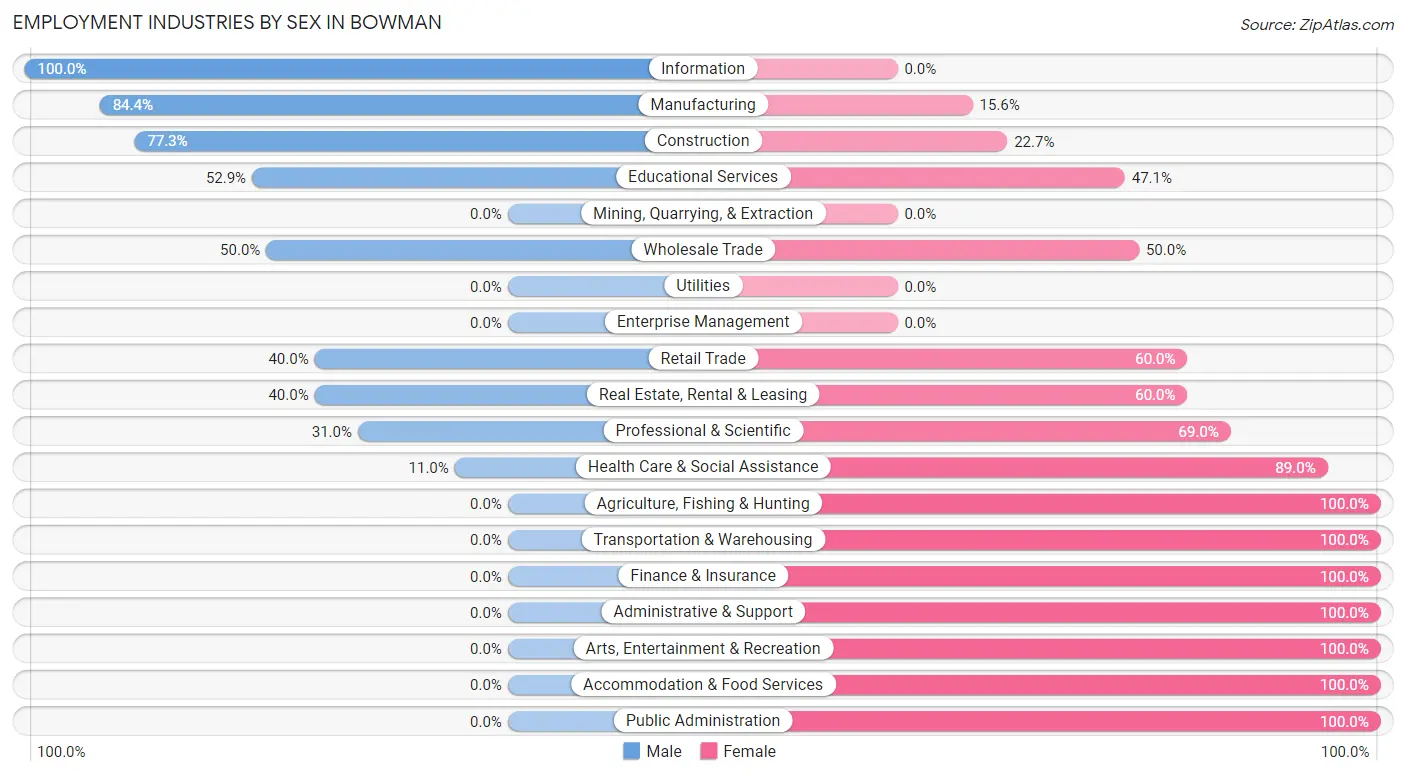
Employment Industries by Sex in Bowman
The Bowman industries that see more men than women are Information (100.0%), Manufacturing (84.4%), and Construction (77.3%), whereas the industries that tend to have a higher number of women are Agriculture, Fishing & Hunting (100.0%), Transportation & Warehousing (100.0%), and Finance & Insurance (100.0%).
| Industry | Male | Female |
| Agriculture, Fishing & Hunting | 0 (0.0%) | 3 (100.0%) |
| Mining, Quarrying, & Extraction | 0 (0.0%) | 0 (0.0%) |
| Construction | 34 (77.3%) | 10 (22.7%) |
| Manufacturing | 38 (84.4%) | 7 (15.6%) |
| Wholesale Trade | 3 (50.0%) | 3 (50.0%) |
| Retail Trade | 2 (40.0%) | 3 (60.0%) |
| Transportation & Warehousing | 0 (0.0%) | 15 (100.0%) |
| Utilities | 0 (0.0%) | 0 (0.0%) |
| Information | 1 (100.0%) | 0 (0.0%) |
| Finance & Insurance | 0 (0.0%) | 4 (100.0%) |
| Real Estate, Rental & Leasing | 4 (40.0%) | 6 (60.0%) |
| Professional & Scientific | 9 (31.0%) | 20 (69.0%) |
| Enterprise Management | 0 (0.0%) | 0 (0.0%) |
| Administrative & Support | 0 (0.0%) | 7 (100.0%) |
| Educational Services | 9 (52.9%) | 8 (47.1%) |
| Health Care & Social Assistance | 10 (11.0%) | 81 (89.0%) |
| Arts, Entertainment & Recreation | 0 (0.0%) | 5 (100.0%) |
| Accommodation & Food Services | 0 (0.0%) | 19 (100.0%) |
| Public Administration | 0 (0.0%) | 7 (100.0%) |
| Total | 119 (37.5%) | 198 (62.5%) |
Education in Bowman
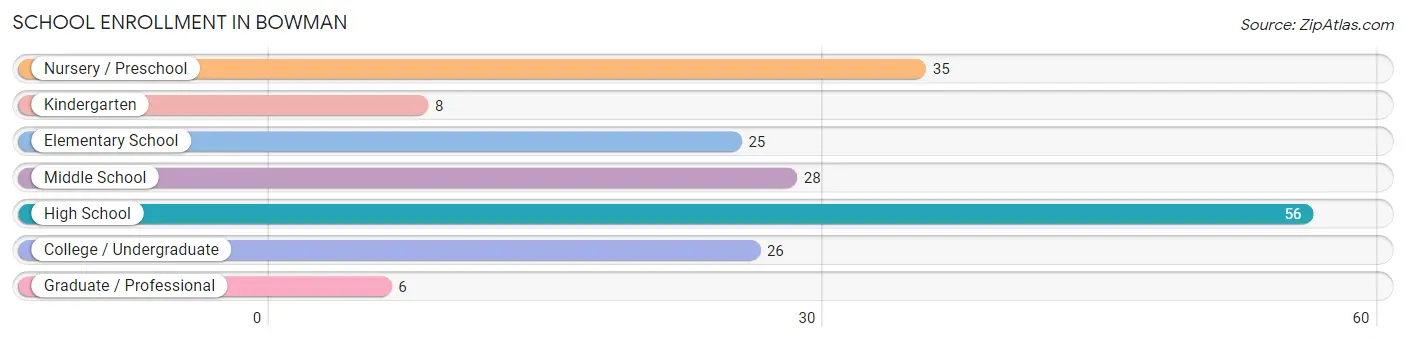
School Enrollment in Bowman
The most common levels of schooling among the 184 students in Bowman are high school (56 | 30.4%), nursery / preschool (35 | 19.0%), and middle school (28 | 15.2%).
| School Level | # Students | % Students |
| Nursery / Preschool | 35 | 19.0% |
| Kindergarten | 8 | 4.3% |
| Elementary School | 25 | 13.6% |
| Middle School | 28 | 15.2% |
| High School | 56 | 30.4% |
| College / Undergraduate | 26 | 14.1% |
| Graduate / Professional | 6 | 3.3% |
| Total | 184 | 100.0% |
School Enrollment by Age by Funding Source in Bowman
Out of a total of 184 students who are enrolled in schools in Bowman, 25 (13.6%) attend a private institution, while the remaining 159 (86.4%) are enrolled in public schools. The age group of 20 to 24 year olds has the highest likelihood of being enrolled in private schools, with 3 (100.0% in the age bracket) enrolled. Conversely, the age group of 5 to 9 year old has the lowest likelihood of being enrolled in a private school, with 29 (100.0% in the age bracket) attending a public institution.
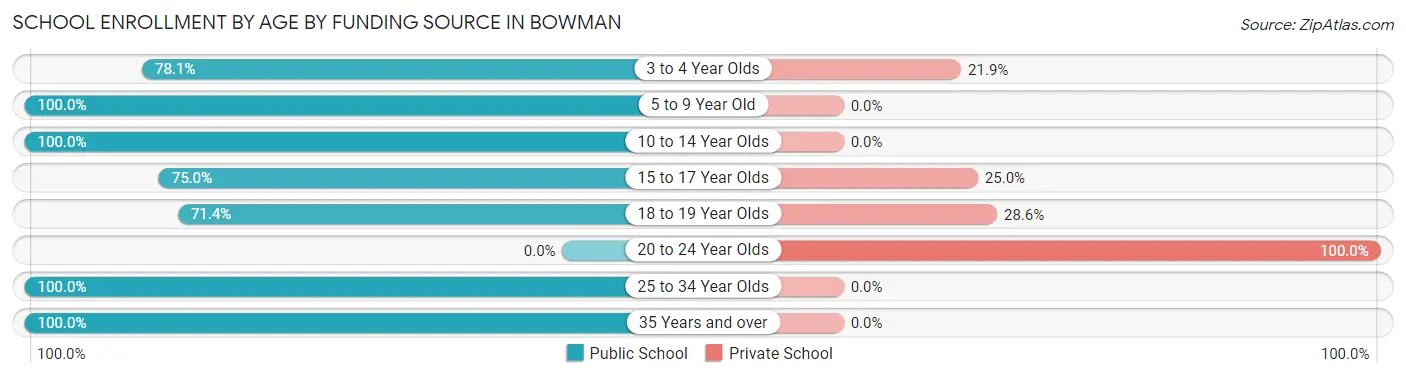
| Age Bracket | Public School | Private School |
| 3 to 4 Year Olds | 25 (78.1%) | 7 (21.9%) |
| 5 to 9 Year Old | 29 (100.0%) | 0 (0.0%) |
| 10 to 14 Year Olds | 35 (100.0%) | 0 (0.0%) |
| 15 to 17 Year Olds | 21 (75.0%) | 7 (25.0%) |
| 18 to 19 Year Olds | 20 (71.4%) | 8 (28.6%) |
| 20 to 24 Year Olds | 0 (0.0%) | 3 (100.0%) |
| 25 to 34 Year Olds | 23 (100.0%) | 0 (0.0%) |
| 35 Years and over | 6 (100.0%) | 0 (0.0%) |
| Total | 159 (86.4%) | 25 (13.6%) |
Educational Attainment by Field of Study in Bowman
Science & technology (36 | 29.5%), psychology (16 | 13.1%), arts & humanities (16 | 13.1%), business (14 | 11.5%), and communications (12 | 9.8%) are the most common fields of study among 122 individuals in Bowman who have obtained a bachelor's degree or higher.
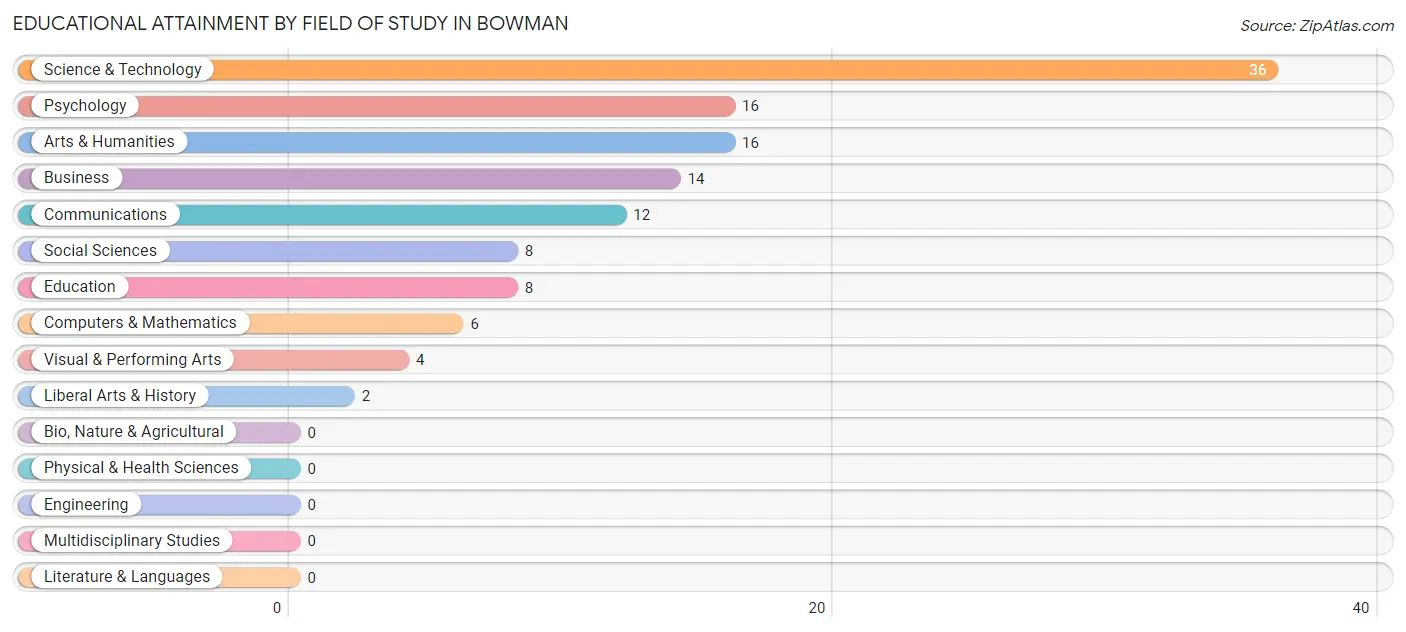
| Field of Study | # Graduates | % Graduates |
| Computers & Mathematics | 6 | 4.9% |
| Bio, Nature & Agricultural | 0 | 0.0% |
| Physical & Health Sciences | 0 | 0.0% |
| Psychology | 16 | 13.1% |
| Social Sciences | 8 | 6.6% |
| Engineering | 0 | 0.0% |
| Multidisciplinary Studies | 0 | 0.0% |
| Science & Technology | 36 | 29.5% |
| Business | 14 | 11.5% |
| Education | 8 | 6.6% |
| Literature & Languages | 0 | 0.0% |
| Liberal Arts & History | 2 | 1.6% |
| Visual & Performing Arts | 4 | 3.3% |
| Communications | 12 | 9.8% |
| Arts & Humanities | 16 | 13.1% |
| Total | 122 | 100.0% |
Transportation & Commute in Bowman
Vehicle Availability by Sex in Bowman
The most prevalent vehicle ownership categories in Bowman are males with 2 vehicles (43, accounting for 37.1%) and females with 2 vehicles (58, making up 21.7%).
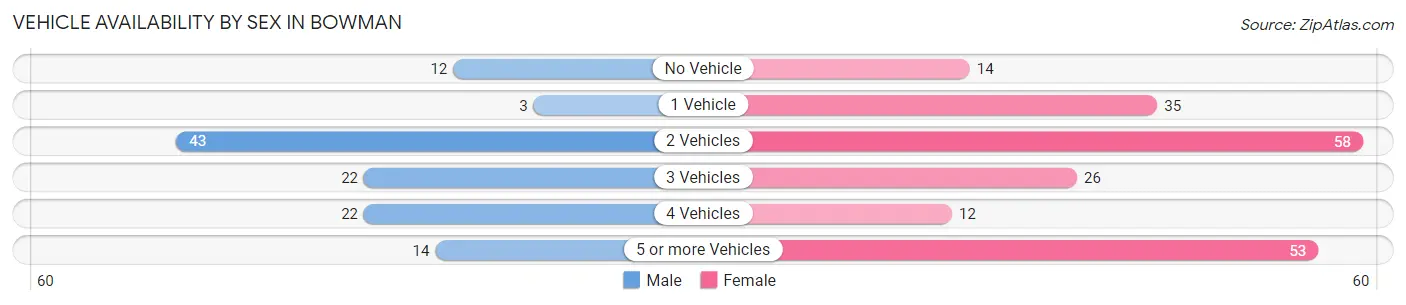
| Vehicles Available | Male | Female |
| No Vehicle | 12 (10.3%) | 14 (7.1%) |
| 1 Vehicle | 3 (2.6%) | 35 (17.7%) |
| 2 Vehicles | 43 (37.1%) | 58 (29.3%) |
| 3 Vehicles | 22 (19.0%) | 26 (13.1%) |
| 4 Vehicles | 22 (19.0%) | 12 (6.1%) |
| 5 or more Vehicles | 14 (12.1%) | 53 (26.8%) |
| Total | 116 (100.0%) | 198 (100.0%) |
Commute Time in Bowman
The most frequently occuring commute durations in Bowman are 45 to 59 minutes (61 commuters, 20.1%), 5 to 9 minutes (36 commuters, 11.8%), and 15 to 19 minutes (34 commuters, 11.2%).
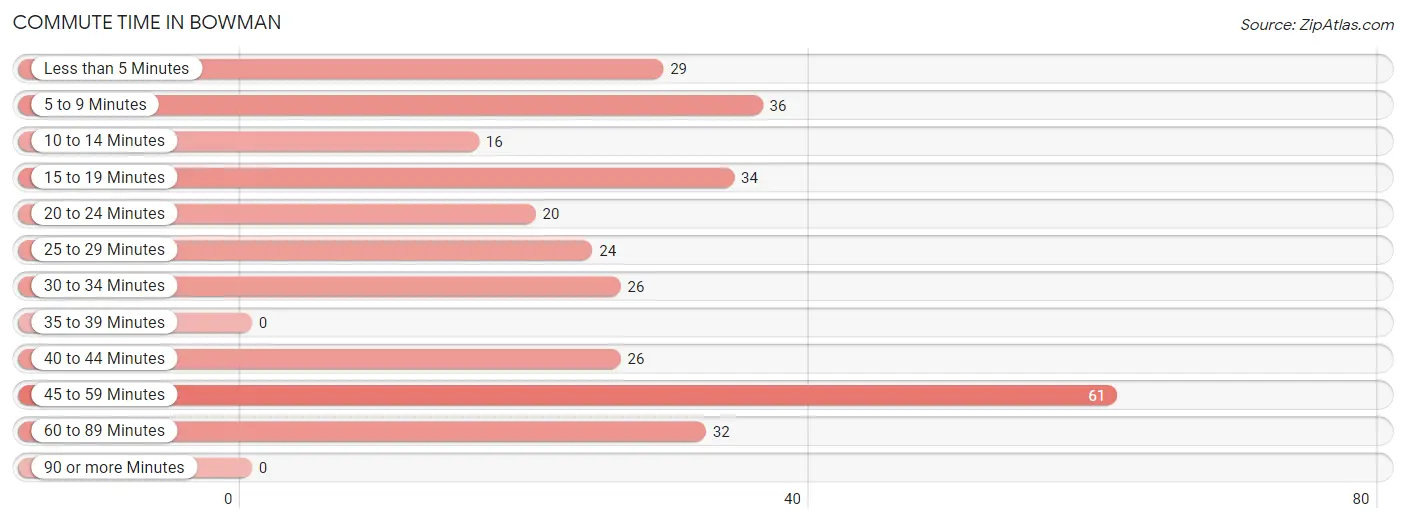
| Commute Time | # Commuters | % Commuters |
| Less than 5 Minutes | 29 | 9.5% |
| 5 to 9 Minutes | 36 | 11.8% |
| 10 to 14 Minutes | 16 | 5.3% |
| 15 to 19 Minutes | 34 | 11.2% |
| 20 to 24 Minutes | 20 | 6.6% |
| 25 to 29 Minutes | 24 | 7.9% |
| 30 to 34 Minutes | 26 | 8.6% |
| 35 to 39 Minutes | 0 | 0.0% |
| 40 to 44 Minutes | 26 | 8.6% |
| 45 to 59 Minutes | 61 | 20.1% |
| 60 to 89 Minutes | 32 | 10.5% |
| 90 or more Minutes | 0 | 0.0% |
Commute Time by Sex in Bowman
The most common commute times in Bowman are 45 to 59 minutes (32 commuters, 30.2%) for males and 15 to 19 minutes (34 commuters, 17.2%) for females.
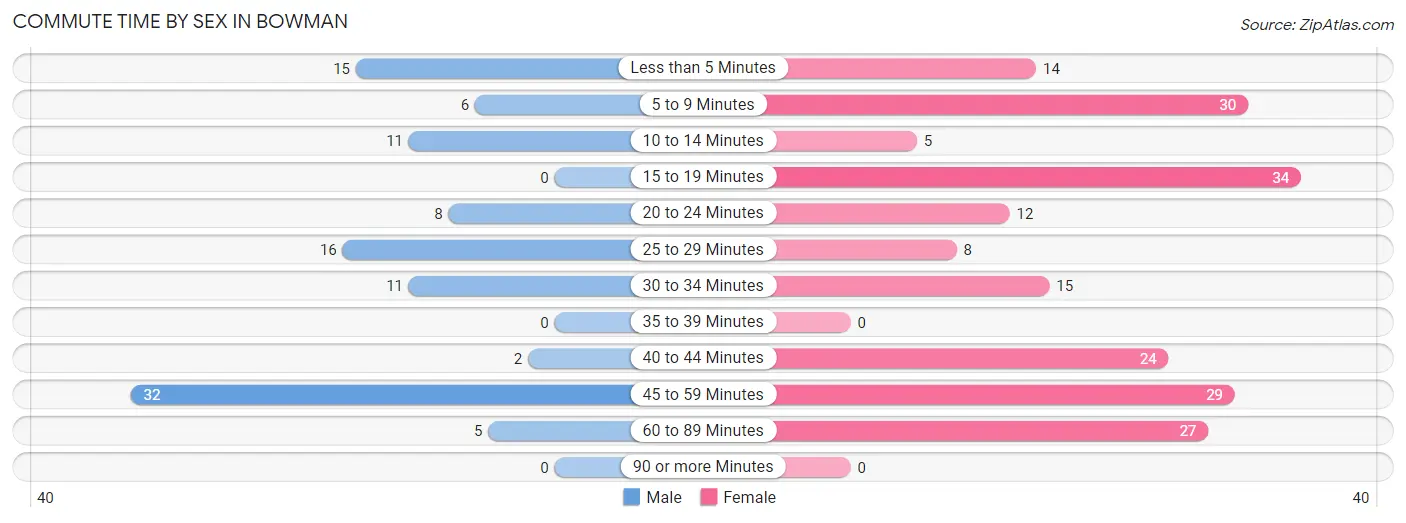
| Commute Time | Male | Female |
| Less than 5 Minutes | 15 (14.1%) | 14 (7.1%) |
| 5 to 9 Minutes | 6 (5.7%) | 30 (15.1%) |
| 10 to 14 Minutes | 11 (10.4%) | 5 (2.5%) |
| 15 to 19 Minutes | 0 (0.0%) | 34 (17.2%) |
| 20 to 24 Minutes | 8 (7.5%) | 12 (6.1%) |
| 25 to 29 Minutes | 16 (15.1%) | 8 (4.0%) |
| 30 to 34 Minutes | 11 (10.4%) | 15 (7.6%) |
| 35 to 39 Minutes | 0 (0.0%) | 0 (0.0%) |
| 40 to 44 Minutes | 2 (1.9%) | 24 (12.1%) |
| 45 to 59 Minutes | 32 (30.2%) | 29 (14.6%) |
| 60 to 89 Minutes | 5 (4.7%) | 27 (13.6%) |
| 90 or more Minutes | 0 (0.0%) | 0 (0.0%) |
Time of Departure to Work by Sex in Bowman
The most frequent times of departure to work in Bowman are 7:30 AM to 7:59 AM (26, 24.5%) for males and 7:00 AM to 7:29 AM (43, 21.7%) for females.
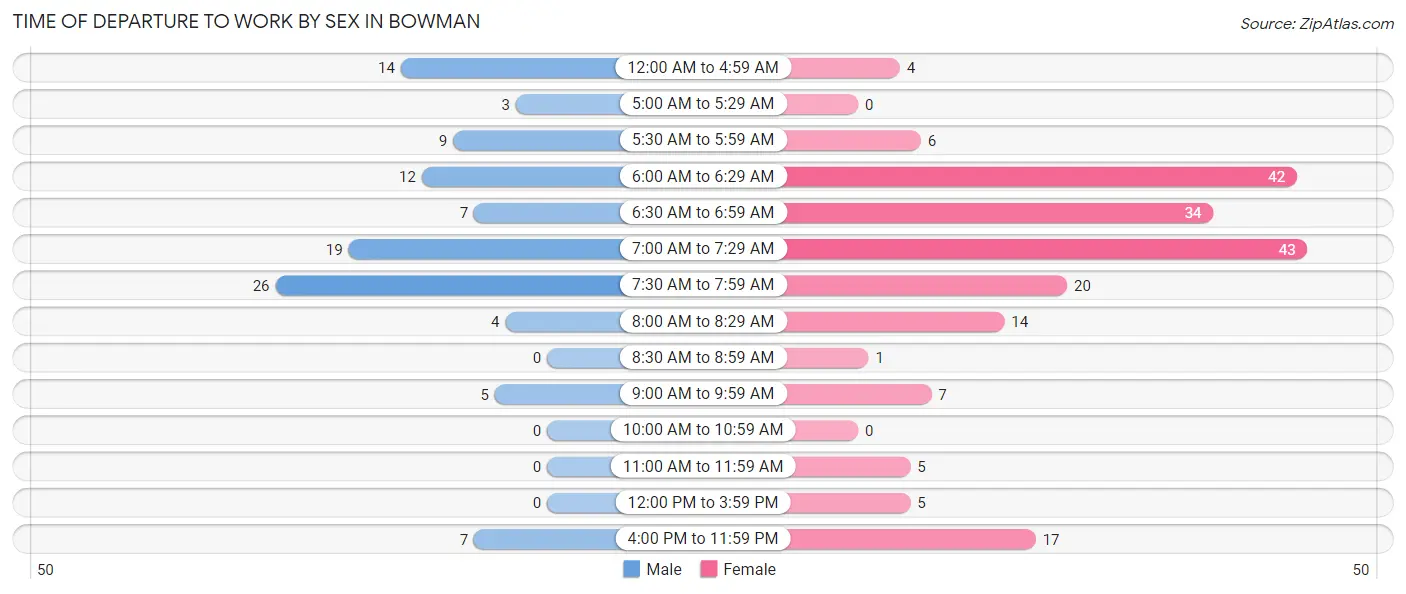
| Time of Departure | Male | Female |
| 12:00 AM to 4:59 AM | 14 (13.2%) | 4 (2.0%) |
| 5:00 AM to 5:29 AM | 3 (2.8%) | 0 (0.0%) |
| 5:30 AM to 5:59 AM | 9 (8.5%) | 6 (3.0%) |
| 6:00 AM to 6:29 AM | 12 (11.3%) | 42 (21.2%) |
| 6:30 AM to 6:59 AM | 7 (6.6%) | 34 (17.2%) |
| 7:00 AM to 7:29 AM | 19 (17.9%) | 43 (21.7%) |
| 7:30 AM to 7:59 AM | 26 (24.5%) | 20 (10.1%) |
| 8:00 AM to 8:29 AM | 4 (3.8%) | 14 (7.1%) |
| 8:30 AM to 8:59 AM | 0 (0.0%) | 1 (0.5%) |
| 9:00 AM to 9:59 AM | 5 (4.7%) | 7 (3.5%) |
| 10:00 AM to 10:59 AM | 0 (0.0%) | 0 (0.0%) |
| 11:00 AM to 11:59 AM | 0 (0.0%) | 5 (2.5%) |
| 12:00 PM to 3:59 PM | 0 (0.0%) | 5 (2.5%) |
| 4:00 PM to 11:59 PM | 7 (6.6%) | 17 (8.6%) |
| Total | 106 (100.0%) | 198 (100.0%) |
Housing Occupancy in Bowman
Occupancy by Ownership in Bowman
Of the total 379 dwellings in Bowman, owner-occupied units account for 262 (69.1%), while renter-occupied units make up 117 (30.9%).
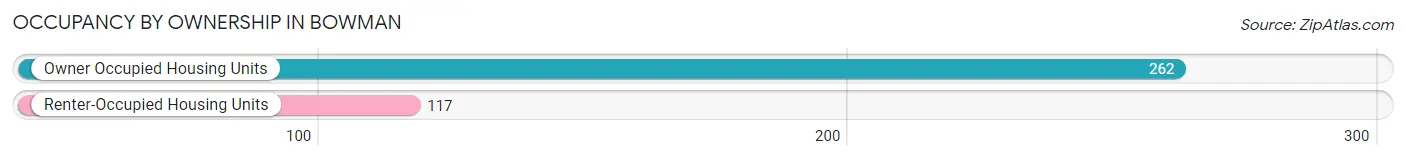
| Occupancy | # Housing Units | % Housing Units |
| Owner Occupied Housing Units | 262 | 69.1% |
| Renter-Occupied Housing Units | 117 | 30.9% |
| Total Occupied Housing Units | 379 | 100.0% |
Occupancy by Household Size in Bowman
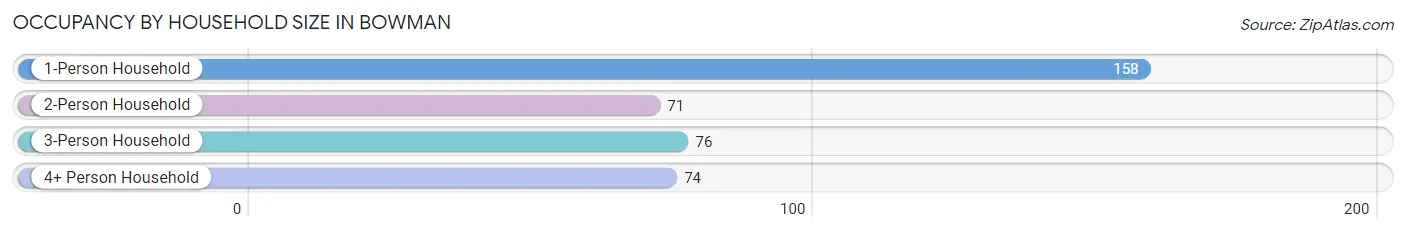
| Household Size | # Housing Units | % Housing Units |
| 1-Person Household | 158 | 41.7% |
| 2-Person Household | 71 | 18.7% |
| 3-Person Household | 76 | 20.1% |
| 4+ Person Household | 74 | 19.5% |
| Total Housing Units | 379 | 100.0% |
Occupancy by Ownership by Household Size in Bowman
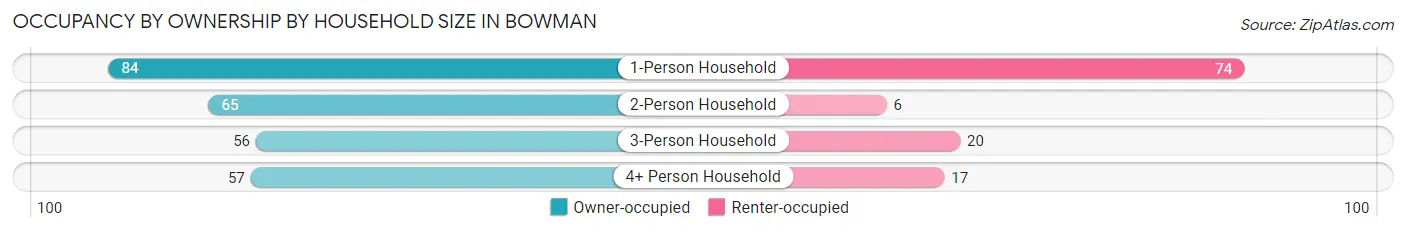
| Household Size | Owner-occupied | Renter-occupied |
| 1-Person Household | 84 (53.2%) | 74 (46.8%) |
| 2-Person Household | 65 (91.5%) | 6 (8.5%) |
| 3-Person Household | 56 (73.7%) | 20 (26.3%) |
| 4+ Person Household | 57 (77.0%) | 17 (23.0%) |
| Total Housing Units | 262 (69.1%) | 117 (30.9%) |
Occupancy by Educational Attainment in Bowman
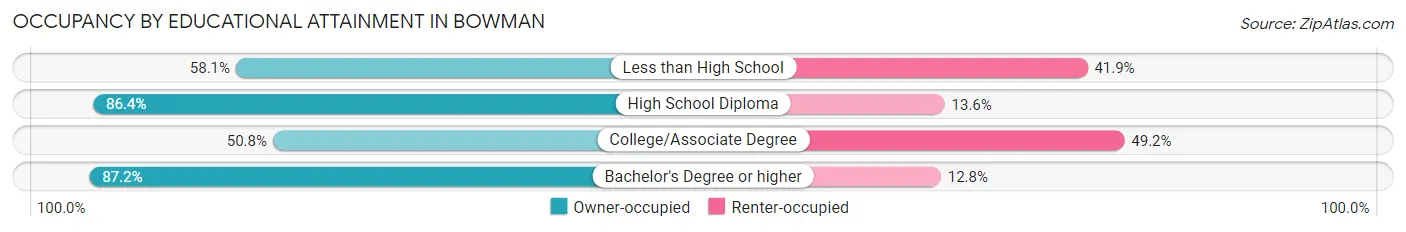
| Household Size | Owner-occupied | Renter-occupied |
| Less than High School | 43 (58.1%) | 31 (41.9%) |
| High School Diploma | 121 (86.4%) | 19 (13.6%) |
| College/Associate Degree | 64 (50.8%) | 62 (49.2%) |
| Bachelor's Degree or higher | 34 (87.2%) | 5 (12.8%) |
Occupancy by Age of Householder in Bowman
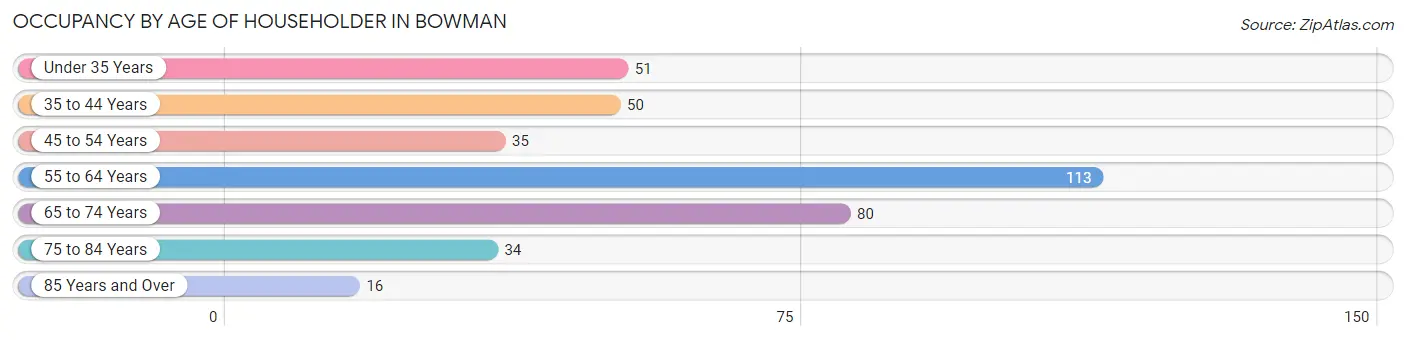
| Age Bracket | # Households | % Households |
| Under 35 Years | 51 | 13.5% |
| 35 to 44 Years | 50 | 13.2% |
| 45 to 54 Years | 35 | 9.2% |
| 55 to 64 Years | 113 | 29.8% |
| 65 to 74 Years | 80 | 21.1% |
| 75 to 84 Years | 34 | 9.0% |
| 85 Years and Over | 16 | 4.2% |
| Total | 379 | 100.0% |
Housing Finances in Bowman
Median Income by Occupancy in Bowman
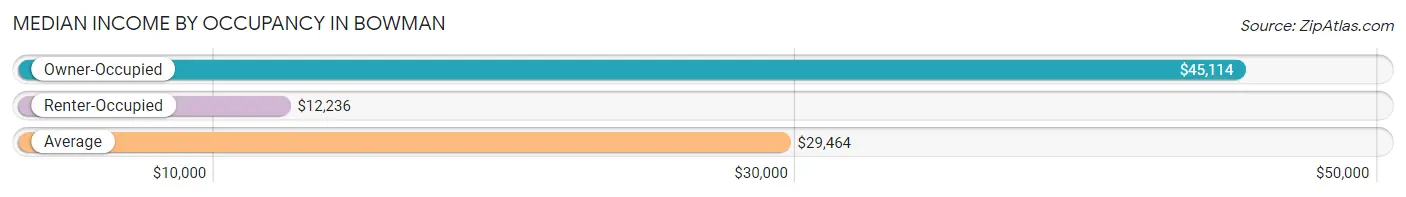
| Occupancy Type | # Households | Median Income |
| Owner-Occupied | 262 (69.1%) | $45,114 |
| Renter-Occupied | 117 (30.9%) | $12,236 |
| Average | 379 (100.0%) | $29,464 |
Occupancy by Householder Income Bracket in Bowman
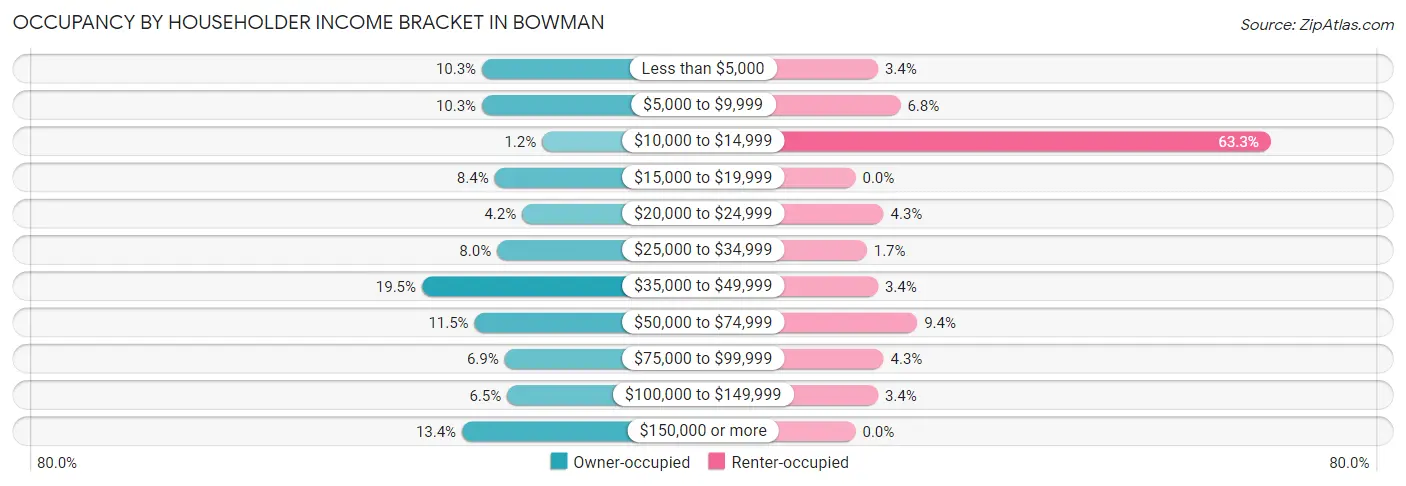
| Income Bracket | Owner-occupied | Renter-occupied |
| Less than $5,000 | 27 (10.3%) | 4 (3.4%) |
| $5,000 to $9,999 | 27 (10.3%) | 8 (6.8%) |
| $10,000 to $14,999 | 3 (1.1%) | 74 (63.2%) |
| $15,000 to $19,999 | 22 (8.4%) | 0 (0.0%) |
| $20,000 to $24,999 | 11 (4.2%) | 5 (4.3%) |
| $25,000 to $34,999 | 21 (8.0%) | 2 (1.7%) |
| $35,000 to $49,999 | 51 (19.5%) | 4 (3.4%) |
| $50,000 to $74,999 | 30 (11.5%) | 11 (9.4%) |
| $75,000 to $99,999 | 18 (6.9%) | 5 (4.3%) |
| $100,000 to $149,999 | 17 (6.5%) | 4 (3.4%) |
| $150,000 or more | 35 (13.4%) | 0 (0.0%) |
| Total | 262 (100.0%) | 117 (100.0%) |
Monthly Housing Cost Tiers in Bowman
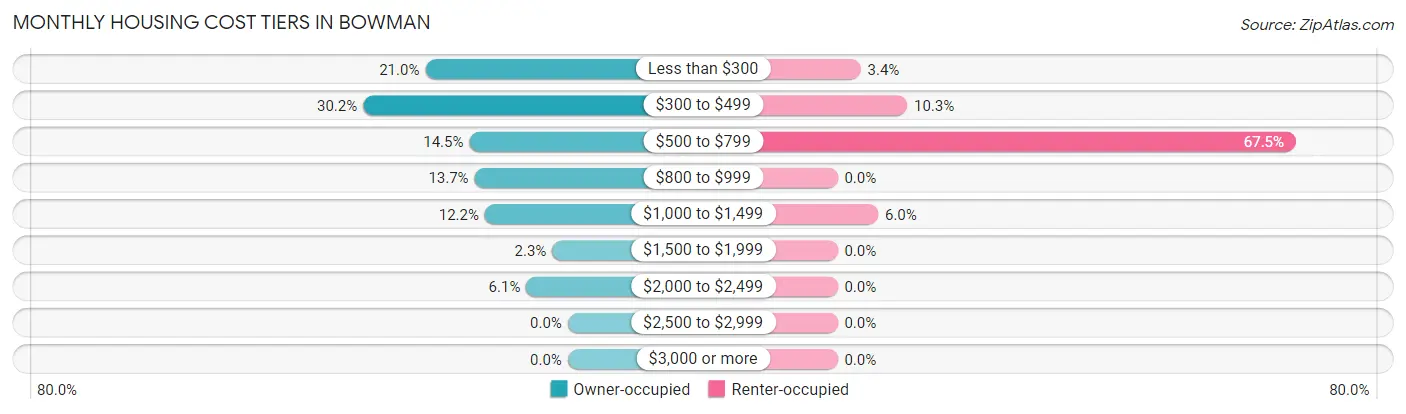
| Monthly Cost | Owner-occupied | Renter-occupied |
| Less than $300 | 55 (21.0%) | 4 (3.4%) |
| $300 to $499 | 79 (30.1%) | 12 (10.3%) |
| $500 to $799 | 38 (14.5%) | 79 (67.5%) |
| $800 to $999 | 36 (13.7%) | 0 (0.0%) |
| $1,000 to $1,499 | 32 (12.2%) | 7 (6.0%) |
| $1,500 to $1,999 | 6 (2.3%) | 0 (0.0%) |
| $2,000 to $2,499 | 16 (6.1%) | 0 (0.0%) |
| $2,500 to $2,999 | 0 (0.0%) | 0 (0.0%) |
| $3,000 or more | 0 (0.0%) | 0 (0.0%) |
| Total | 262 (100.0%) | 117 (100.0%) |
Physical Housing Characteristics in Bowman
Housing Structures in Bowman
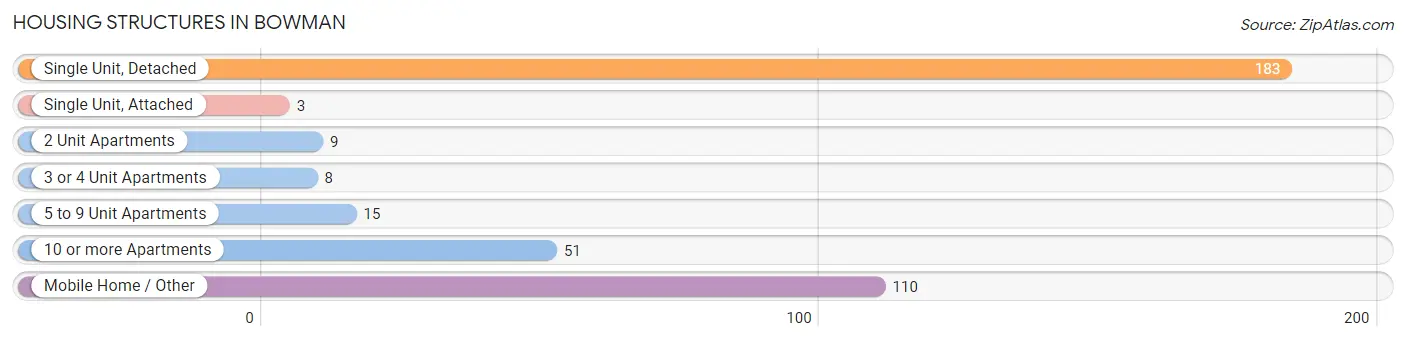
| Structure Type | # Housing Units | % Housing Units |
| Single Unit, Detached | 183 | 48.3% |
| Single Unit, Attached | 3 | 0.8% |
| 2 Unit Apartments | 9 | 2.4% |
| 3 or 4 Unit Apartments | 8 | 2.1% |
| 5 to 9 Unit Apartments | 15 | 4.0% |
| 10 or more Apartments | 51 | 13.5% |
| Mobile Home / Other | 110 | 29.0% |
| Total | 379 | 100.0% |
Housing Structures by Occupancy in Bowman
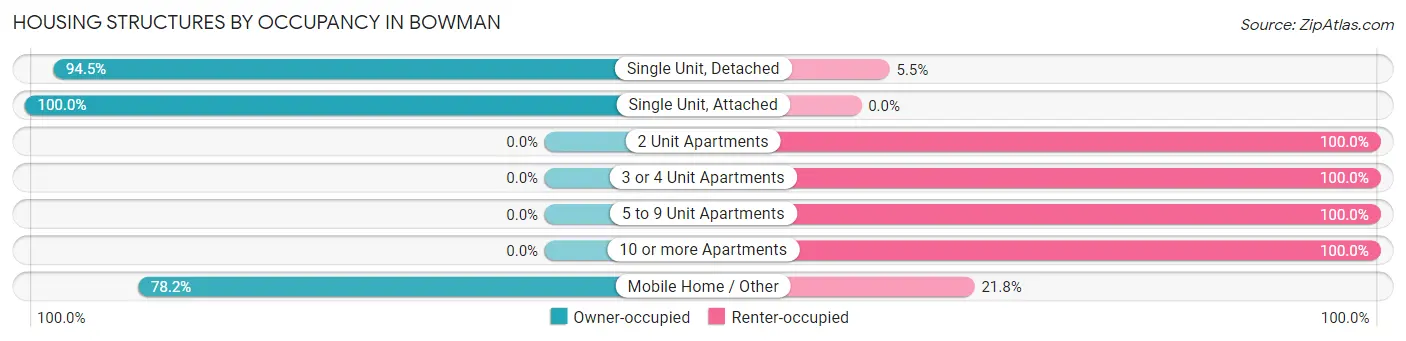
| Structure Type | Owner-occupied | Renter-occupied |
| Single Unit, Detached | 173 (94.5%) | 10 (5.5%) |
| Single Unit, Attached | 3 (100.0%) | 0 (0.0%) |
| 2 Unit Apartments | 0 (0.0%) | 9 (100.0%) |
| 3 or 4 Unit Apartments | 0 (0.0%) | 8 (100.0%) |
| 5 to 9 Unit Apartments | 0 (0.0%) | 15 (100.0%) |
| 10 or more Apartments | 0 (0.0%) | 51 (100.0%) |
| Mobile Home / Other | 86 (78.2%) | 24 (21.8%) |
| Total | 262 (69.1%) | 117 (30.9%) |
Housing Structures by Number of Rooms in Bowman
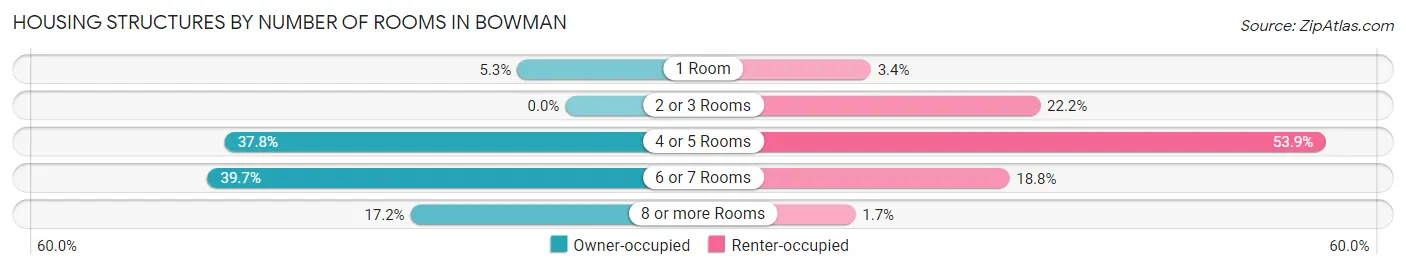
| Number of Rooms | Owner-occupied | Renter-occupied |
| 1 Room | 14 (5.3%) | 4 (3.4%) |
| 2 or 3 Rooms | 0 (0.0%) | 26 (22.2%) |
| 4 or 5 Rooms | 99 (37.8%) | 63 (53.8%) |
| 6 or 7 Rooms | 104 (39.7%) | 22 (18.8%) |
| 8 or more Rooms | 45 (17.2%) | 2 (1.7%) |
| Total | 262 (100.0%) | 117 (100.0%) |
Housing Structure by Heating Type in Bowman
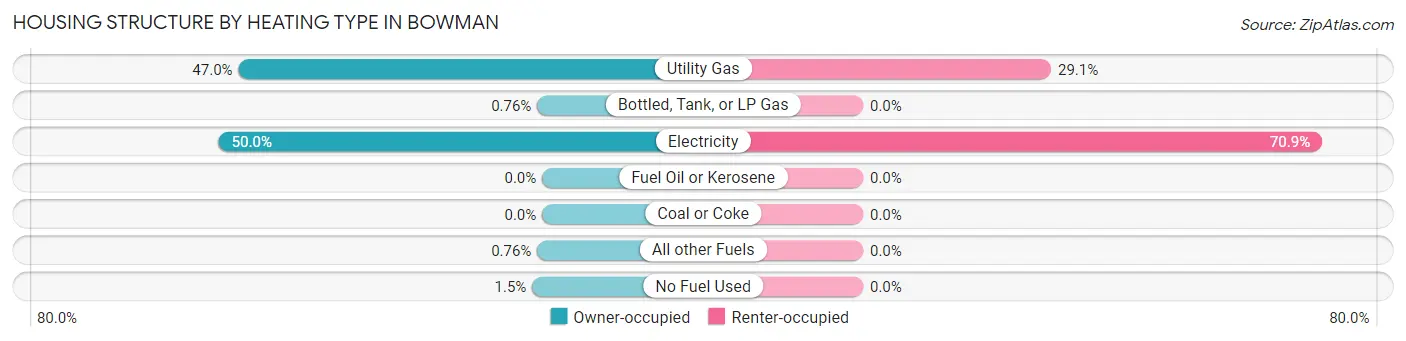
| Heating Type | Owner-occupied | Renter-occupied |
| Utility Gas | 123 (46.9%) | 34 (29.1%) |
| Bottled, Tank, or LP Gas | 2 (0.8%) | 0 (0.0%) |
| Electricity | 131 (50.0%) | 83 (70.9%) |
| Fuel Oil or Kerosene | 0 (0.0%) | 0 (0.0%) |
| Coal or Coke | 0 (0.0%) | 0 (0.0%) |
| All other Fuels | 2 (0.8%) | 0 (0.0%) |
| No Fuel Used | 4 (1.5%) | 0 (0.0%) |
| Total | 262 (100.0%) | 117 (100.0%) |
Household Vehicle Usage in Bowman
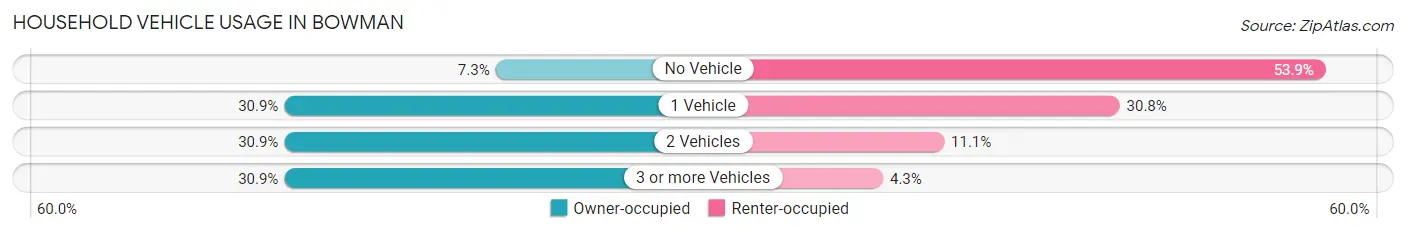
| Vehicles per Household | Owner-occupied | Renter-occupied |
| No Vehicle | 19 (7.2%) | 63 (53.8%) |
| 1 Vehicle | 81 (30.9%) | 36 (30.8%) |
| 2 Vehicles | 81 (30.9%) | 13 (11.1%) |
| 3 or more Vehicles | 81 (30.9%) | 5 (4.3%) |
| Total | 262 (100.0%) | 117 (100.0%) |
Real Estate & Mortgages in Bowman
Real Estate and Mortgage Overview in Bowman
| Characteristic | Without Mortgage | With Mortgage |
| Housing Units | 159 | 103 |
| Median Property Value | $84,100 | $117,500 |
| Median Household Income | $21,563 | $27 |
| Monthly Housing Costs | $423 | $0 |
| Real Estate Taxes | $607 | $5 |
Property Value by Mortgage Status in Bowman
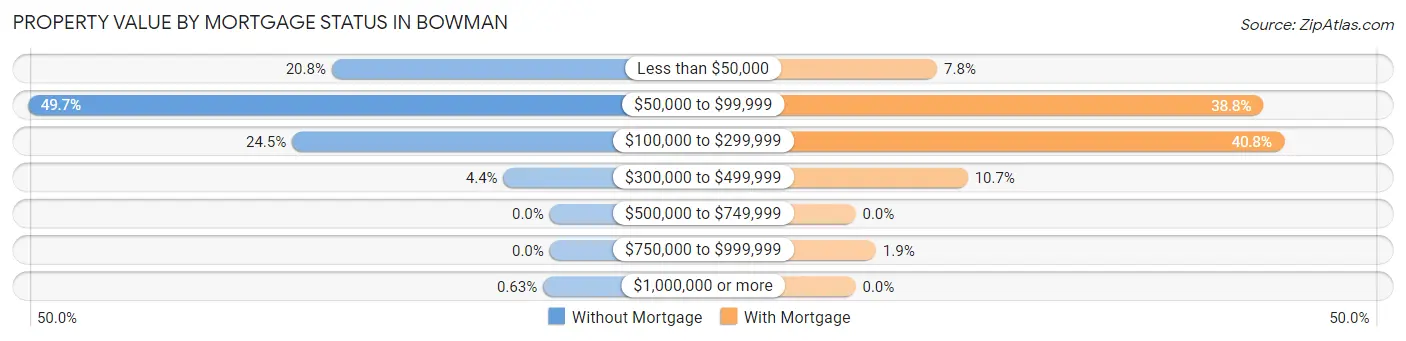
| Property Value | Without Mortgage | With Mortgage |
| Less than $50,000 | 33 (20.7%) | 8 (7.8%) |
| $50,000 to $99,999 | 79 (49.7%) | 40 (38.8%) |
| $100,000 to $299,999 | 39 (24.5%) | 42 (40.8%) |
| $300,000 to $499,999 | 7 (4.4%) | 11 (10.7%) |
| $500,000 to $749,999 | 0 (0.0%) | 0 (0.0%) |
| $750,000 to $999,999 | 0 (0.0%) | 2 (1.9%) |
| $1,000,000 or more | 1 (0.6%) | 0 (0.0%) |
| Total | 159 (100.0%) | 103 (100.0%) |
Household Income by Mortgage Status in Bowman
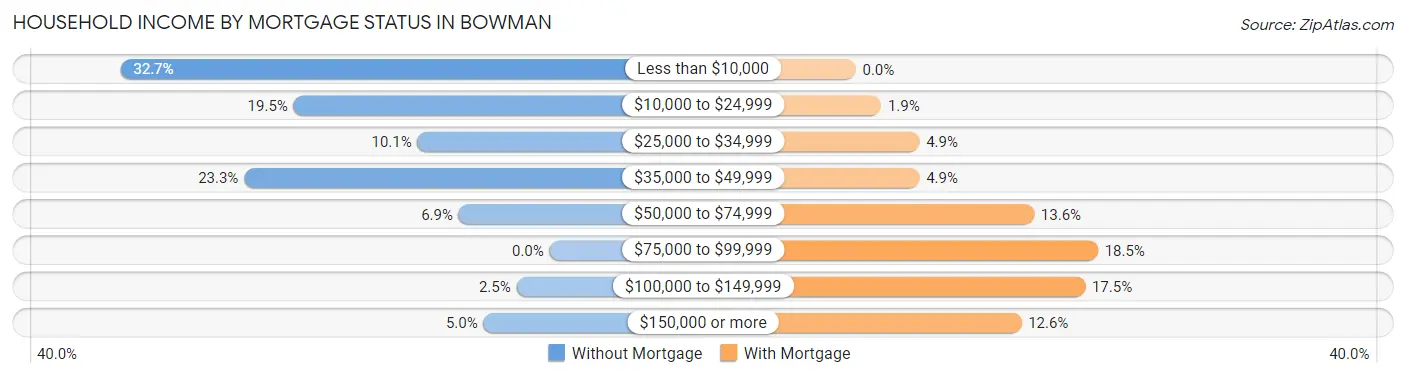
| Household Income | Without Mortgage | With Mortgage |
| Less than $10,000 | 52 (32.7%) | 0 (0.0%) |
| $10,000 to $24,999 | 31 (19.5%) | 2 (1.9%) |
| $25,000 to $34,999 | 16 (10.1%) | 5 (4.9%) |
| $35,000 to $49,999 | 37 (23.3%) | 5 (4.9%) |
| $50,000 to $74,999 | 11 (6.9%) | 14 (13.6%) |
| $75,000 to $99,999 | 0 (0.0%) | 19 (18.4%) |
| $100,000 to $149,999 | 4 (2.5%) | 18 (17.5%) |
| $150,000 or more | 8 (5.0%) | 13 (12.6%) |
| Total | 159 (100.0%) | 103 (100.0%) |
Property Value to Household Income Ratio in Bowman
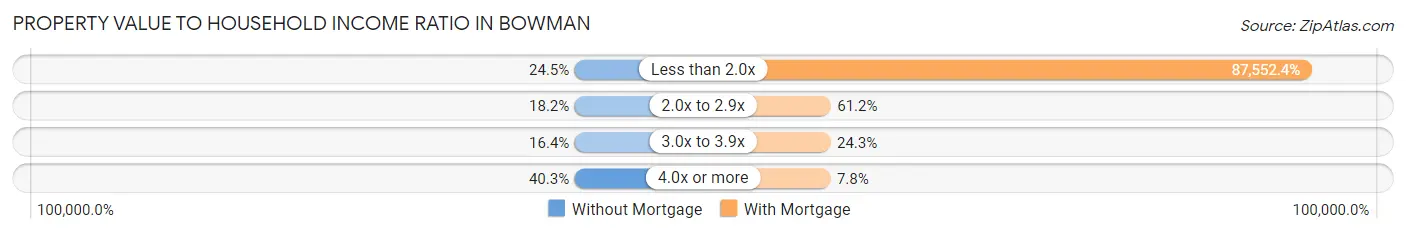
| Value-to-Income Ratio | Without Mortgage | With Mortgage |
| Less than 2.0x | 39 (24.5%) | 90,179 (87,552.4%) |
| 2.0x to 2.9x | 29 (18.2%) | 63 (61.2%) |
| 3.0x to 3.9x | 26 (16.4%) | 25 (24.3%) |
| 4.0x or more | 64 (40.3%) | 8 (7.8%) |
| Total | 159 (100.0%) | 103 (100.0%) |
Real Estate Taxes by Mortgage Status in Bowman
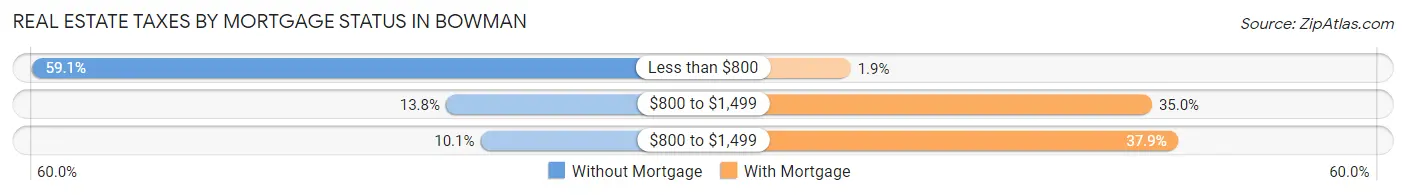
| Property Taxes | Without Mortgage | With Mortgage |
| Less than $800 | 94 (59.1%) | 2 (1.9%) |
| $800 to $1,499 | 22 (13.8%) | 36 (34.9%) |
| $800 to $1,499 | 16 (10.1%) | 39 (37.9%) |
| Total | 159 (100.0%) | 103 (100.0%) |
Health & Disability in Bowman
Health Insurance Coverage by Age in Bowman
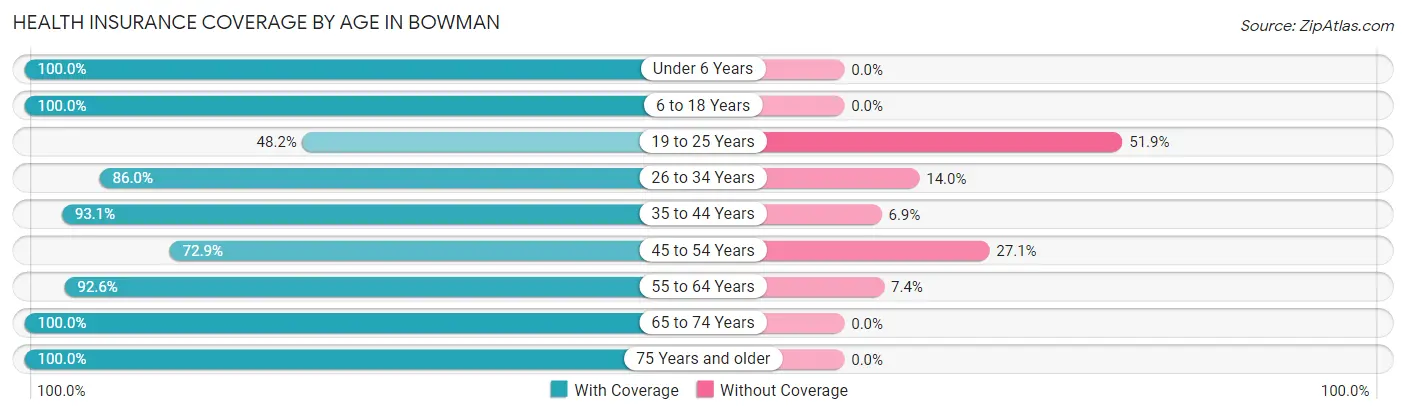
| Age Bracket | With Coverage | Without Coverage |
| Under 6 Years | 105 (100.0%) | 0 (0.0%) |
| 6 to 18 Years | 100 (100.0%) | 0 (0.0%) |
| 19 to 25 Years | 26 (48.1%) | 28 (51.8%) |
| 26 to 34 Years | 123 (86.0%) | 20 (14.0%) |
| 35 to 44 Years | 67 (93.1%) | 5 (6.9%) |
| 45 to 54 Years | 62 (72.9%) | 23 (27.1%) |
| 55 to 64 Years | 137 (92.6%) | 11 (7.4%) |
| 65 to 74 Years | 102 (100.0%) | 0 (0.0%) |
| 75 Years and older | 80 (100.0%) | 0 (0.0%) |
| Total | 802 (90.2%) | 87 (9.8%) |
Health Insurance Coverage by Citizenship Status in Bowman
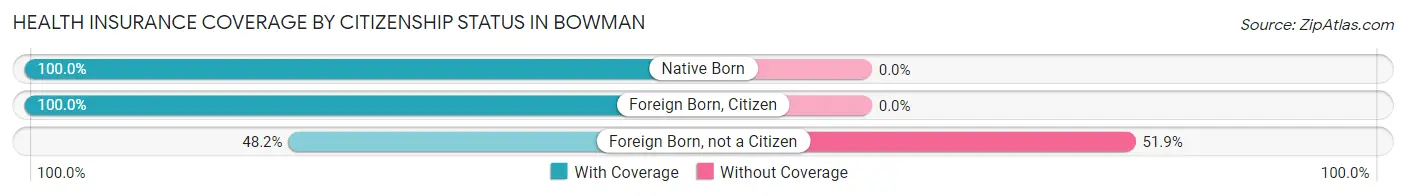
| Citizenship Status | With Coverage | Without Coverage |
| Native Born | 105 (100.0%) | 0 (0.0%) |
| Foreign Born, Citizen | 100 (100.0%) | 0 (0.0%) |
| Foreign Born, not a Citizen | 26 (48.1%) | 28 (51.8%) |
Health Insurance Coverage by Household Income in Bowman
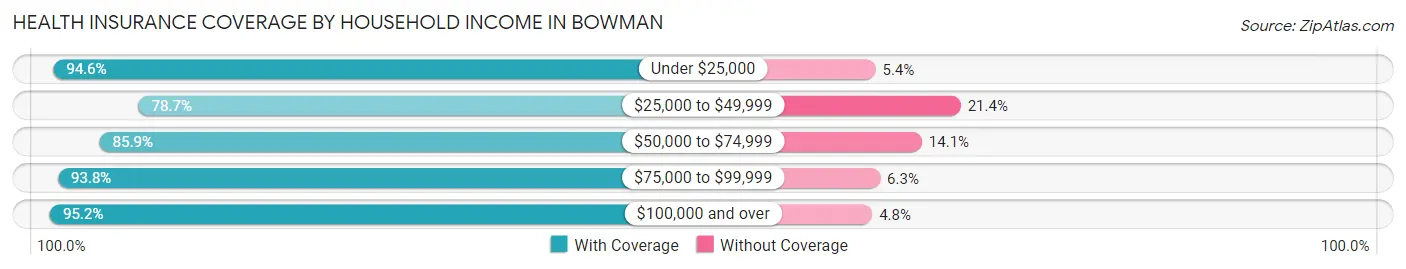
| Household Income | With Coverage | Without Coverage |
| Under $25,000 | 281 (94.6%) | 16 (5.4%) |
| $25,000 to $49,999 | 140 (78.6%) | 38 (21.3%) |
| $50,000 to $74,999 | 116 (85.9%) | 19 (14.1%) |
| $75,000 to $99,999 | 45 (93.8%) | 3 (6.2%) |
| $100,000 and over | 220 (95.2%) | 11 (4.8%) |
Public vs Private Health Insurance Coverage by Age in Bowman
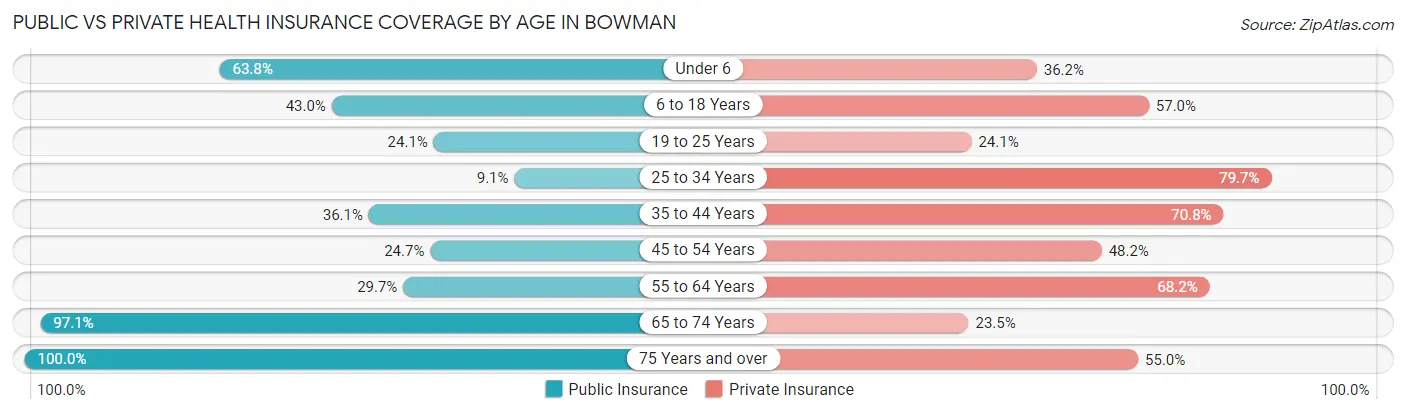
| Age Bracket | Public Insurance | Private Insurance |
| Under 6 | 67 (63.8%) | 38 (36.2%) |
| 6 to 18 Years | 43 (43.0%) | 57 (57.0%) |
| 19 to 25 Years | 13 (24.1%) | 13 (24.1%) |
| 25 to 34 Years | 13 (9.1%) | 114 (79.7%) |
| 35 to 44 Years | 26 (36.1%) | 51 (70.8%) |
| 45 to 54 Years | 21 (24.7%) | 41 (48.2%) |
| 55 to 64 Years | 44 (29.7%) | 101 (68.2%) |
| 65 to 74 Years | 99 (97.1%) | 24 (23.5%) |
| 75 Years and over | 80 (100.0%) | 44 (55.0%) |
| Total | 406 (45.7%) | 483 (54.3%) |
Disability Status by Sex by Age in Bowman
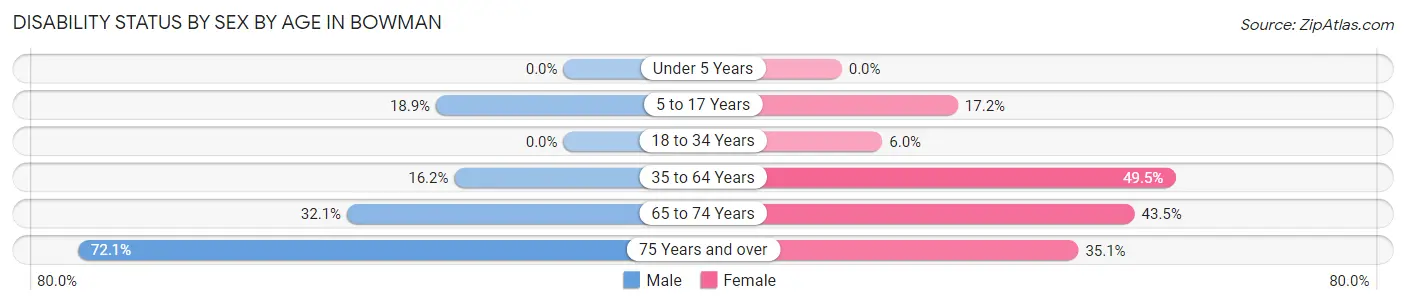
| Age Bracket | Male | Female |
| Under 5 Years | 0 (0.0%) | 0 (0.0%) |
| 5 to 17 Years | 7 (18.9%) | 10 (17.2%) |
| 18 to 34 Years | 0 (0.0%) | 8 (6.0%) |
| 35 to 64 Years | 17 (16.2%) | 99 (49.5%) |
| 65 to 74 Years | 18 (32.1%) | 20 (43.5%) |
| 75 Years and over | 31 (72.1%) | 13 (35.1%) |
Disability Class by Sex by Age in Bowman
Disability Class: Hearing Difficulty
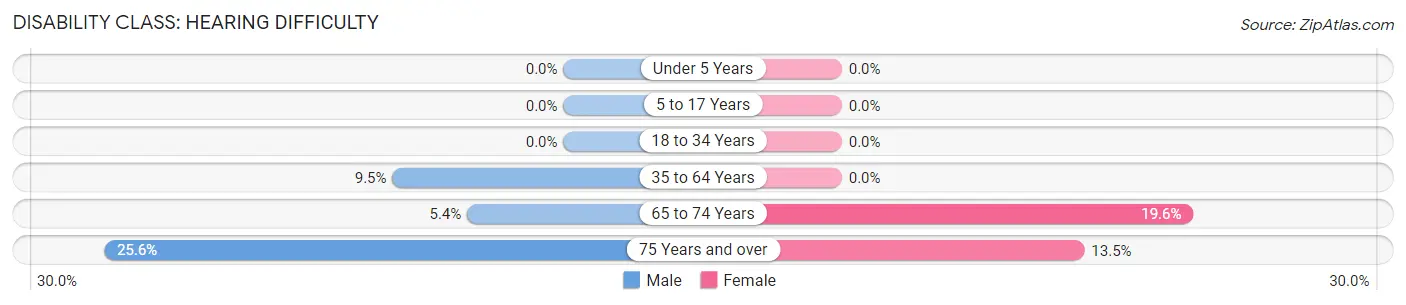
| Age Bracket | Male | Female |
| Under 5 Years | 0 (0.0%) | 0 (0.0%) |
| 5 to 17 Years | 0 (0.0%) | 0 (0.0%) |
| 18 to 34 Years | 0 (0.0%) | 0 (0.0%) |
| 35 to 64 Years | 10 (9.5%) | 0 (0.0%) |
| 65 to 74 Years | 3 (5.4%) | 9 (19.6%) |
| 75 Years and over | 11 (25.6%) | 5 (13.5%) |
Disability Class: Vision Difficulty
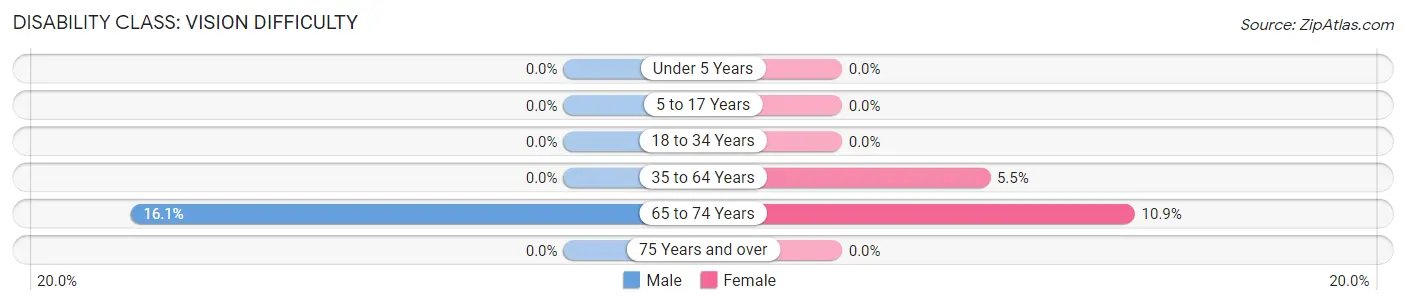
| Age Bracket | Male | Female |
| Under 5 Years | 0 (0.0%) | 0 (0.0%) |
| 5 to 17 Years | 0 (0.0%) | 0 (0.0%) |
| 18 to 34 Years | 0 (0.0%) | 0 (0.0%) |
| 35 to 64 Years | 0 (0.0%) | 11 (5.5%) |
| 65 to 74 Years | 9 (16.1%) | 5 (10.9%) |
| 75 Years and over | 0 (0.0%) | 0 (0.0%) |
Disability Class: Cognitive Difficulty
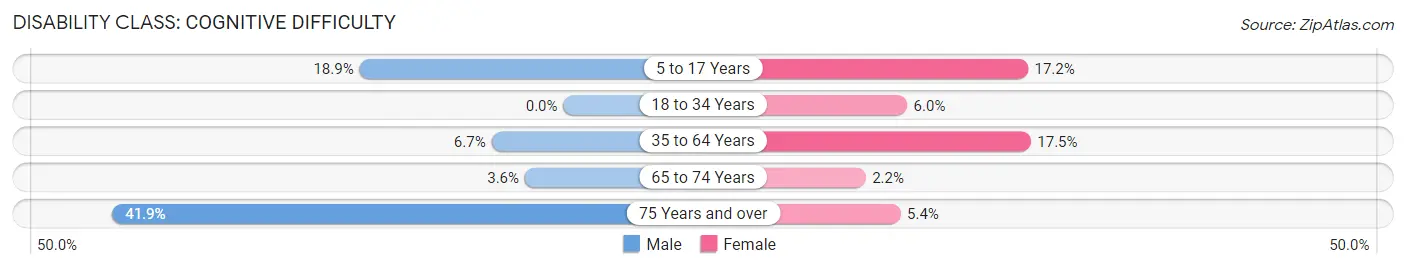
| Age Bracket | Male | Female |
| 5 to 17 Years | 7 (18.9%) | 10 (17.2%) |
| 18 to 34 Years | 0 (0.0%) | 8 (6.0%) |
| 35 to 64 Years | 7 (6.7%) | 35 (17.5%) |
| 65 to 74 Years | 2 (3.6%) | 1 (2.2%) |
| 75 Years and over | 18 (41.9%) | 2 (5.4%) |
Disability Class: Ambulatory Difficulty
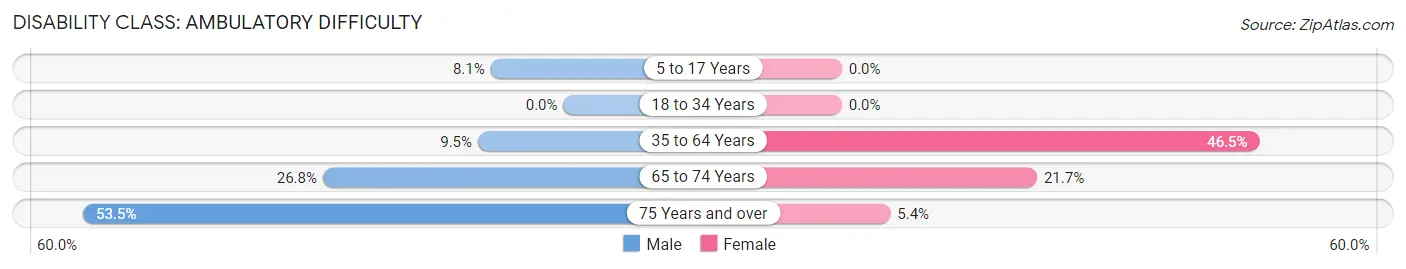
| Age Bracket | Male | Female |
| 5 to 17 Years | 3 (8.1%) | 0 (0.0%) |
| 18 to 34 Years | 0 (0.0%) | 0 (0.0%) |
| 35 to 64 Years | 10 (9.5%) | 93 (46.5%) |
| 65 to 74 Years | 15 (26.8%) | 10 (21.7%) |
| 75 Years and over | 23 (53.5%) | 2 (5.4%) |
Disability Class: Self-Care Difficulty
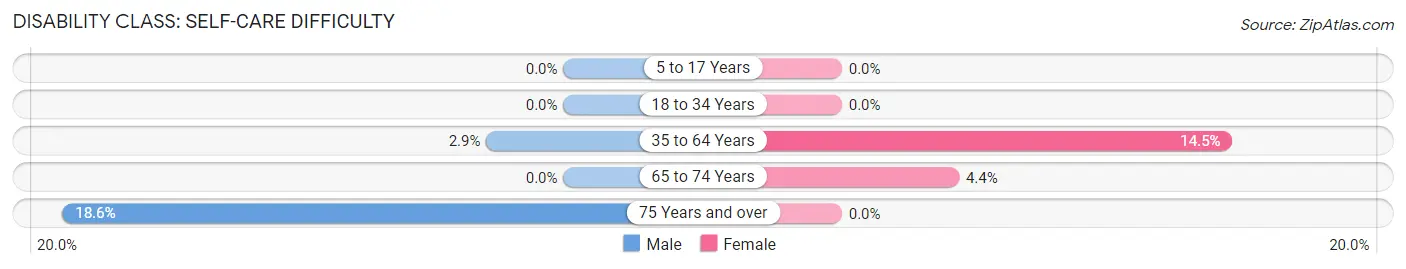
| Age Bracket | Male | Female |
| 5 to 17 Years | 0 (0.0%) | 0 (0.0%) |
| 18 to 34 Years | 0 (0.0%) | 0 (0.0%) |
| 35 to 64 Years | 3 (2.9%) | 29 (14.5%) |
| 65 to 74 Years | 0 (0.0%) | 2 (4.3%) |
| 75 Years and over | 8 (18.6%) | 0 (0.0%) |
Technology Access in Bowman
Computing Device Access in Bowman
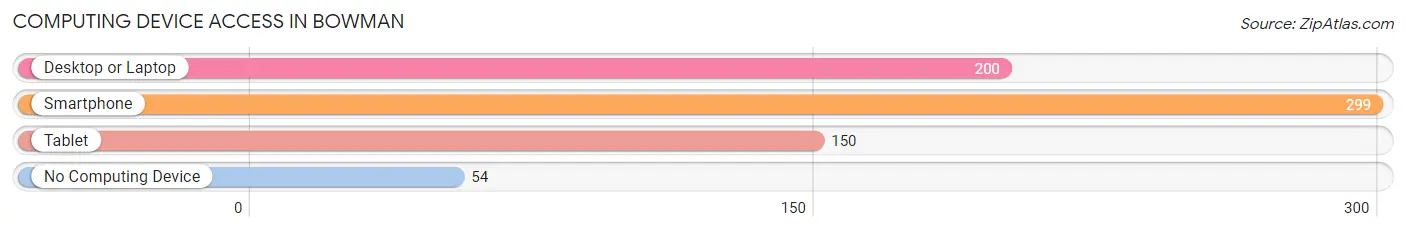
| Device Type | # Households | % Households |
| Desktop or Laptop | 200 | 52.8% |
| Smartphone | 299 | 78.9% |
| Tablet | 150 | 39.6% |
| No Computing Device | 54 | 14.2% |
| Total | 379 | 100.0% |
Internet Access in Bowman
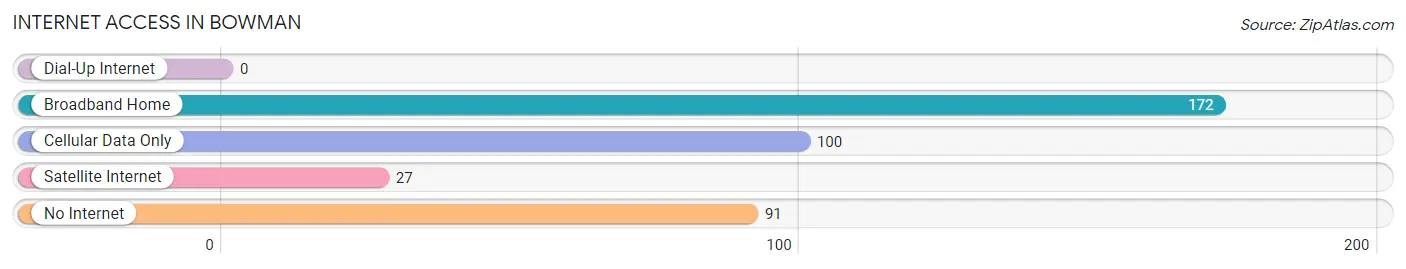
| Internet Type | # Households | % Households |
| Dial-Up Internet | 0 | 0.0% |
| Broadband Home | 172 | 45.4% |
| Cellular Data Only | 100 | 26.4% |
| Satellite Internet | 27 | 7.1% |
| No Internet | 91 | 24.0% |
| Total | 379 | 100.0% |
Bowman Summary
Bowman, Georgia is a small town located in Elbert County, Georgia. It is situated in the foothills of the Blue Ridge Mountains, approximately 50 miles northeast of Atlanta. The town was founded in 1820 and named after the first settler, John Bowman. The population of Bowman was estimated to be 1,072 in 2019.
Geography
Bowman is located in the foothills of the Blue Ridge Mountains, approximately 50 miles northeast of Atlanta. The town is situated in the Piedmont region of Georgia, which is characterized by rolling hills and valleys. The town is located on the banks of the Broad River, which flows through the town and provides a source of recreation for the residents. The town is also located near the Chattahoochee National Forest, which provides a variety of outdoor activities for residents and visitors.
Economy
The economy of Bowman is largely based on agriculture and forestry. The town is home to several farms, which produce a variety of crops, including corn, soybeans, and cotton. The town is also home to several timber companies, which harvest timber from the surrounding forests. In addition, the town is home to several small businesses, including restaurants, retail stores, and service providers.
Demographics
The population of Bowman was estimated to be 1,072 in 2019. The town is predominantly white, with a population that is approximately 95% white. The remaining 5% of the population is composed of African Americans, Hispanics, and other ethnicities. The median household income in Bowman is $41,944, which is slightly lower than the median household income for the state of Georgia.
The town is served by the Elbert County School District, which consists of two elementary schools, one middle school, and one high school. The town is also home to several churches, including the Bowman Baptist Church, the Bowman Methodist Church, and the Bowman Presbyterian Church.
Bowman is a small town with a rich history and a vibrant economy. The town is home to a diverse population and offers a variety of recreational activities for residents and visitors. The town is a great place to live, work, and raise a family.
Common Questions
What is Per Capita Income in Bowman?
Per Capita income in Bowman is $24,010.
What is the Median Family Income in Bowman?
Median Family Income in Bowman is $47,500.
What is the Median Household income in Bowman?
Median Household Income in Bowman is $29,464.
What is Income or Wage Gap in Bowman?
Income or Wage Gap in Bowman is 52.0%.
Women in Bowman earn 48.0 cents for every dollar earned by a man.
What is Inequality or Gini Index in Bowman?
Inequality or Gini Index in Bowman is 0.58.
What is the Total Population of Bowman?
Total Population of Bowman is 889.
What is the Total Male Population of Bowman?
Total Male Population of Bowman is 373.
What is the Total Female Population of Bowman?
Total Female Population of Bowman is 516.
What is the Ratio of Males per 100 Females in Bowman?
There are 72.29 Males per 100 Females in Bowman.
What is the Ratio of Females per 100 Males in Bowman?
There are 138.34 Females per 100 Males in Bowman.
What is the Median Population Age in Bowman?
Median Population Age in Bowman is 39.3 Years.
What is the Average Family Size in Bowman
Average Family Size in Bowman is 3.2 People.
What is the Average Household Size in Bowman
Average Household Size in Bowman is 2.4 People.
How Large is the Labor Force in Bowman?
There are 354 People in the Labor Forcein in Bowman.
What is the Percentage of People in the Labor Force in Bowman?
50.9% of People are in the Labor Force in Bowman.
What is the Unemployment Rate in Bowman?
Unemployment Rate in Bowman is 10.5%.