Bellville, GA Map & Demographics
Bellville Map
Bellville Overview
$73,364
PER CAPITA INCOME
$198,512
AVG FAMILY INCOME
$94,350
AVG HOUSEHOLD INCOME
49.0%
WAGE / INCOME GAP [ % ]
51.0¢/ $1
WAGE / INCOME GAP [ $ ]
0.40
INEQUALITY / GINI INDEX
196
TOTAL POPULATION
78
MALE POPULATION
118
FEMALE POPULATION
66.10
MALES / 100 FEMALES
151.28
FEMALES / 100 MALES
55.8
MEDIAN AGE
2.6
AVG FAMILY SIZE
2.0
AVG HOUSEHOLD SIZE
102
LABOR FORCE [ PEOPLE ]
52.3%
PERCENT IN LABOR FORCE
Bellville Zip Codes
Bellville Area Codes
Income in Bellville
Income Overview in Bellville
Per Capita Income in Bellville is $73,364, while median incomes of families and households are $198,512 and $94,350 respectively.
| Characteristic | Number | Measure |
| Per Capita Income | 196 | $73,364 |
| Median Family Income | 59 | $198,512 |
| Mean Family Income | 59 | $202,073 |
| Median Household Income | 99 | $94,350 |
| Mean Household Income | 99 | $148,557 |
| Income Deficit | 59 | $0 |
| Wage / Income Gap (%) | 196 | 49.04% |
| Wage / Income Gap ($) | 196 | 50.96¢ per $1 |
| Gini / Inequality Index | 196 | 0.40 |
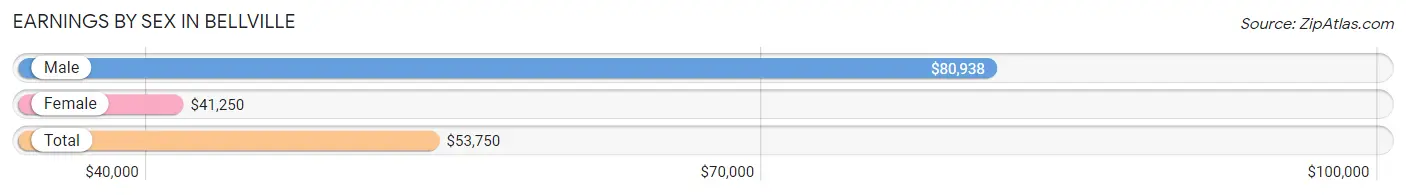
Earnings by Sex in Bellville
Average Earnings in Bellville are $53,750, $80,938 for men and $41,250 for women, a difference of 49.0%.
| Sex | Number | Average Earnings |
| Male | 26 (22.4%) | $80,938 |
| Female | 90 (77.6%) | $41,250 |
| Total | 116 (100.0%) | $53,750 |
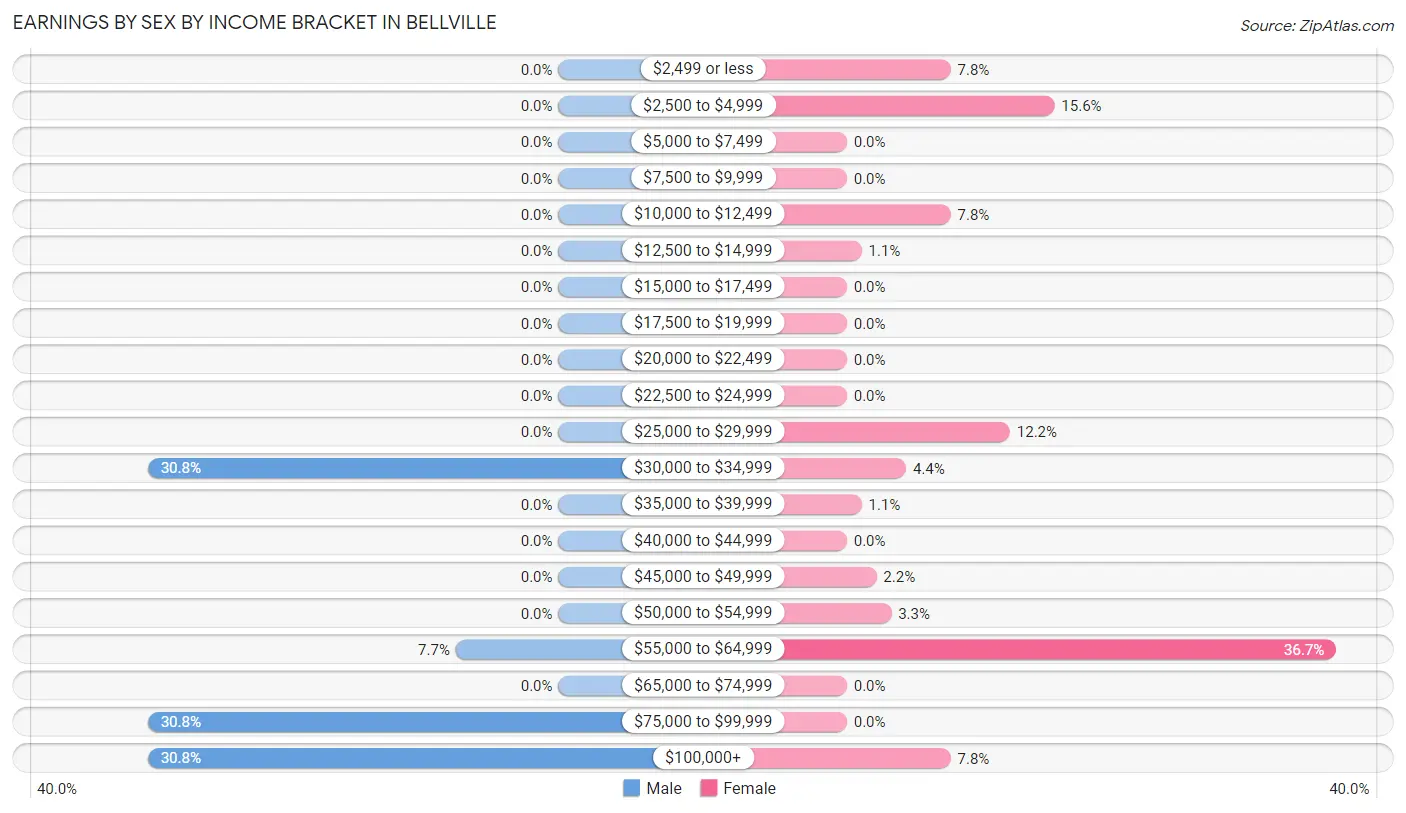
Earnings by Sex by Income Bracket in Bellville
The most common earnings brackets in Bellville are $30,000 to $34,999 for men (8 | 30.8%) and $55,000 to $64,999 for women (33 | 36.7%).
| Income | Male | Female |
| $2,499 or less | 0 (0.0%) | 7 (7.8%) |
| $2,500 to $4,999 | 0 (0.0%) | 14 (15.6%) |
| $5,000 to $7,499 | 0 (0.0%) | 0 (0.0%) |
| $7,500 to $9,999 | 0 (0.0%) | 0 (0.0%) |
| $10,000 to $12,499 | 0 (0.0%) | 7 (7.8%) |
| $12,500 to $14,999 | 0 (0.0%) | 1 (1.1%) |
| $15,000 to $17,499 | 0 (0.0%) | 0 (0.0%) |
| $17,500 to $19,999 | 0 (0.0%) | 0 (0.0%) |
| $20,000 to $22,499 | 0 (0.0%) | 0 (0.0%) |
| $22,500 to $24,999 | 0 (0.0%) | 0 (0.0%) |
| $25,000 to $29,999 | 0 (0.0%) | 11 (12.2%) |
| $30,000 to $34,999 | 8 (30.8%) | 4 (4.4%) |
| $35,000 to $39,999 | 0 (0.0%) | 1 (1.1%) |
| $40,000 to $44,999 | 0 (0.0%) | 0 (0.0%) |
| $45,000 to $49,999 | 0 (0.0%) | 2 (2.2%) |
| $50,000 to $54,999 | 0 (0.0%) | 3 (3.3%) |
| $55,000 to $64,999 | 2 (7.7%) | 33 (36.7%) |
| $65,000 to $74,999 | 0 (0.0%) | 0 (0.0%) |
| $75,000 to $99,999 | 8 (30.8%) | 0 (0.0%) |
| $100,000+ | 8 (30.8%) | 7 (7.8%) |
| Total | 26 (100.0%) | 90 (100.0%) |
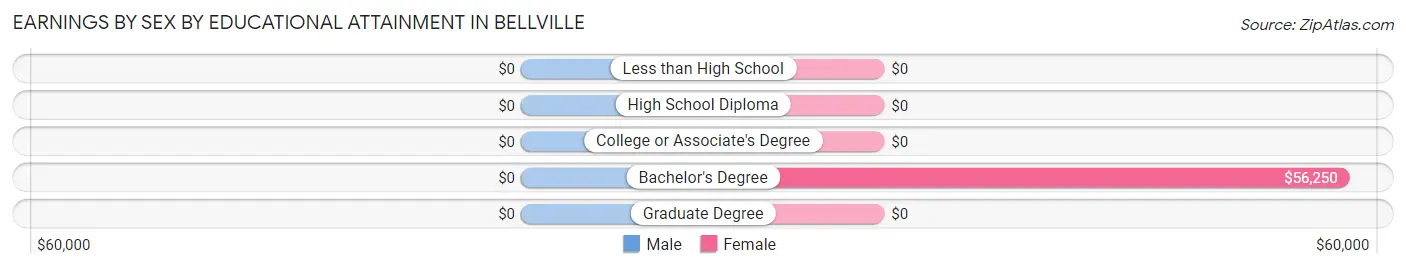
Earnings by Sex by Educational Attainment in Bellville
| Educational Attainment | Male Income | Female Income |
| Less than High School | - | - |
| High School Diploma | - | - |
| College or Associate's Degree | - | - |
| Bachelor's Degree | - | - |
| Graduate Degree | - | - |
| Total | - | - |
Family Income in Bellville
Family Income Brackets in Bellville
According to the Bellville family income data, there are 21 families falling into the $150,000 to $199,999 income range, which is the most common income bracket and makes up 35.6% of all families.
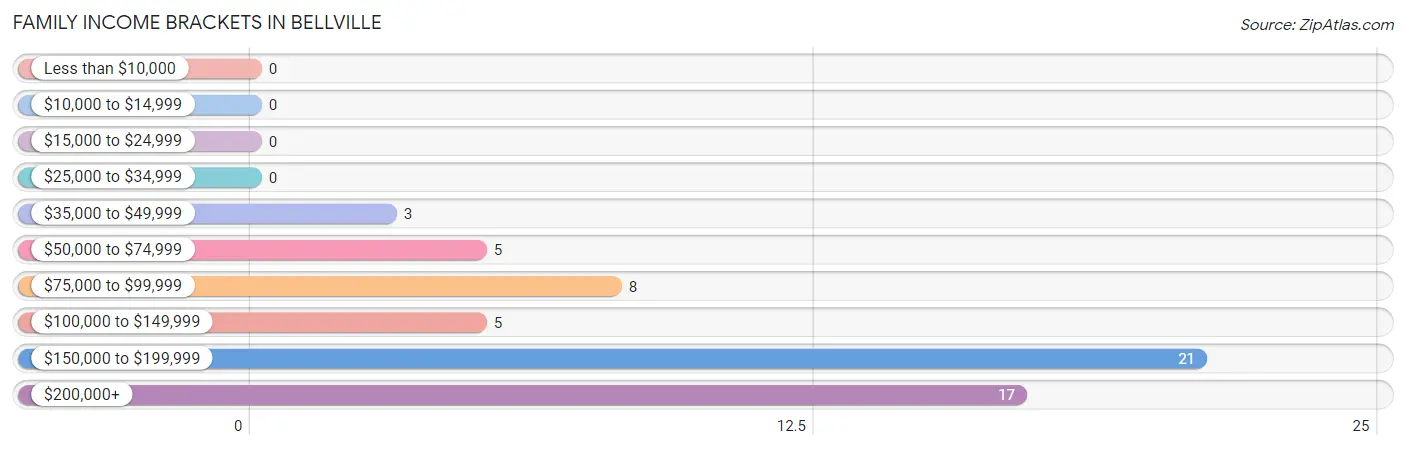
| Income Bracket | # Families | % Families |
| Less than $10,000 | 0 | 0.0% |
| $10,000 to $14,999 | 0 | 0.0% |
| $15,000 to $24,999 | 0 | 0.0% |
| $25,000 to $34,999 | 0 | 0.0% |
| $35,000 to $49,999 | 3 | 5.1% |
| $50,000 to $74,999 | 5 | 8.5% |
| $75,000 to $99,999 | 8 | 13.6% |
| $100,000 to $149,999 | 5 | 8.5% |
| $150,000 to $199,999 | 21 | 35.6% |
| $200,000+ | 17 | 28.8% |
Family Income by Famaliy Size in Bellville
2-person families (33 | 55.9%) account for the highest median family income in Bellville with $198,750 per family, while 2-person families (33 | 55.9%) have the highest median income of $99,375 per family member.
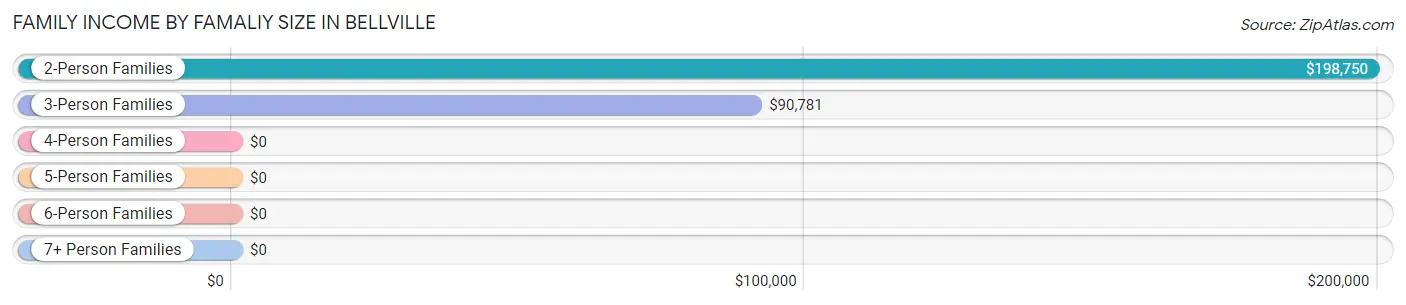
| Income Bracket | # Families | Median Income |
| 2-Person Families | 33 (55.9%) | $198,750 |
| 3-Person Families | 15 (25.4%) | $90,781 |
| 4-Person Families | 7 (11.9%) | $0 |
| 5-Person Families | 4 (6.8%) | $0 |
| 6-Person Families | 0 (0.0%) | $0 |
| 7+ Person Families | 0 (0.0%) | $0 |
| Total | 59 (100.0%) | $198,512 |
Family Income by Number of Earners in Bellville
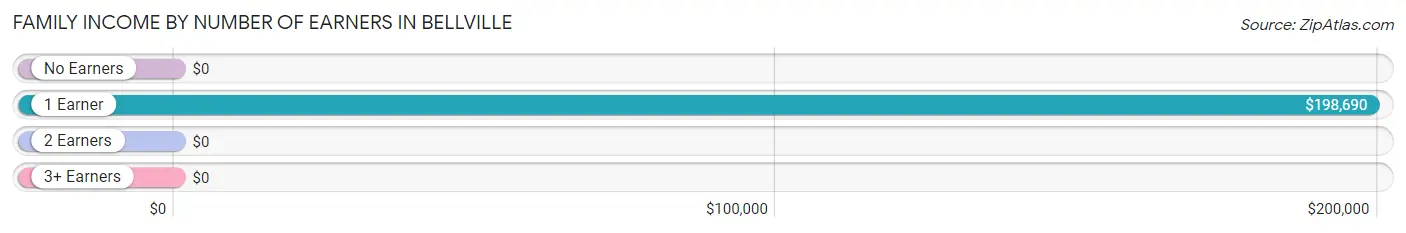
| Number of Earners | # Families | Median Income |
| No Earners | 5 (8.5%) | $0 |
| 1 Earner | 30 (50.8%) | $198,690 |
| 2 Earners | 9 (15.2%) | $0 |
| 3+ Earners | 15 (25.4%) | $0 |
| Total | 59 (100.0%) | $198,512 |
Household Income in Bellville
Household Income Brackets in Bellville
With 33 households falling in the category, the $75,000 to $99,999 income range is the most frequent in Bellville, accounting for 33.3% of all households.
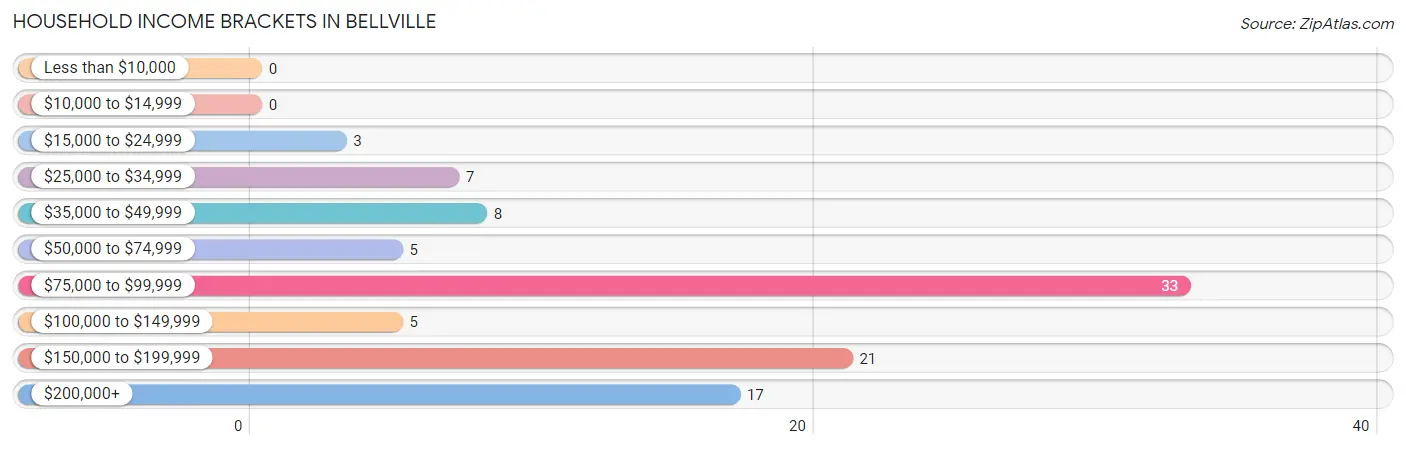
| Income Bracket | # Households | % Households |
| Less than $10,000 | 0 | 0.0% |
| $10,000 to $14,999 | 0 | 0.0% |
| $15,000 to $24,999 | 3 | 3.0% |
| $25,000 to $34,999 | 7 | 7.1% |
| $35,000 to $49,999 | 8 | 8.1% |
| $50,000 to $74,999 | 5 | 5.1% |
| $75,000 to $99,999 | 33 | 33.3% |
| $100,000 to $149,999 | 5 | 5.1% |
| $150,000 to $199,999 | 21 | 21.2% |
| $200,000+ | 17 | 17.2% |
Household Income by Householder Age in Bellville
The median household income in Bellville is $94,350, with the highest median household income of $94,100 found in the 45 to 64 years age bracket for the primary householder. A total of 58 households (58.6%) fall into this category.
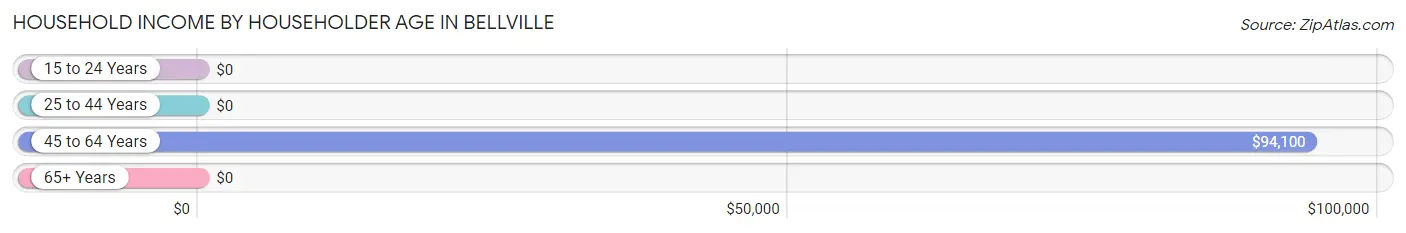
| Income Bracket | # Households | Median Income |
| 15 to 24 Years | 0 (0.0%) | $0 |
| 25 to 44 Years | 1 (1.0%) | $0 |
| 45 to 64 Years | 58 (58.6%) | $94,100 |
| 65+ Years | 40 (40.4%) | $0 |
| Total | 99 (100.0%) | $94,350 |
Poverty in Bellville
Income Below Poverty by Sex and Age in Bellville
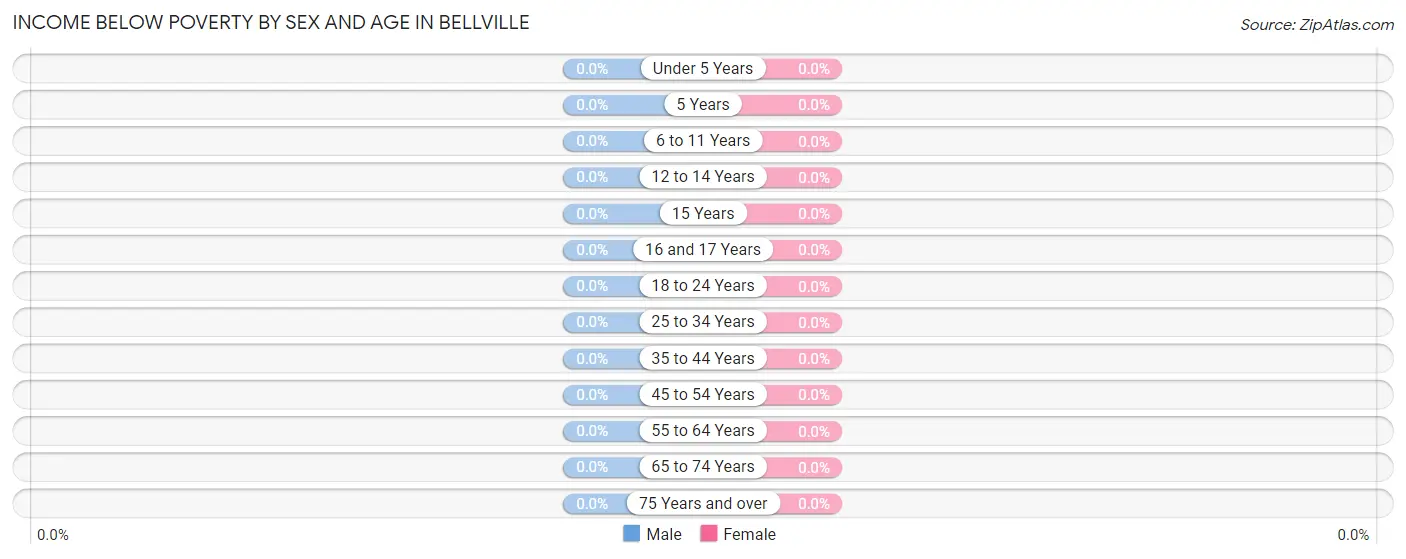
| Age Bracket | Male | Female |
| Under 5 Years | 0 (0.0%) | 0 (0.0%) |
| 5 Years | 0 (0.0%) | 0 (0.0%) |
| 6 to 11 Years | 0 (0.0%) | 0 (0.0%) |
| 12 to 14 Years | 0 (0.0%) | 0 (0.0%) |
| 15 Years | 0 (0.0%) | 0 (0.0%) |
| 16 and 17 Years | 0 (0.0%) | 0 (0.0%) |
| 18 to 24 Years | 0 (0.0%) | 0 (0.0%) |
| 25 to 34 Years | 0 (0.0%) | 0 (0.0%) |
| 35 to 44 Years | 0 (0.0%) | 0 (0.0%) |
| 45 to 54 Years | 0 (0.0%) | 0 (0.0%) |
| 55 to 64 Years | 0 (0.0%) | 0 (0.0%) |
| 65 to 74 Years | 0 (0.0%) | 0 (0.0%) |
| 75 Years and over | 0 (0.0%) | 0 (0.0%) |
| Total | 0 (0.0%) | 0 (0.0%) |
Income Above Poverty by Sex and Age in Bellville
According to the poverty statistics in Bellville, males aged 16 and 17 years and females aged 6 to 11 years are the age groups that are most secure financially, with 100.0% of males and 100.0% of females in these age groups living above the poverty line.
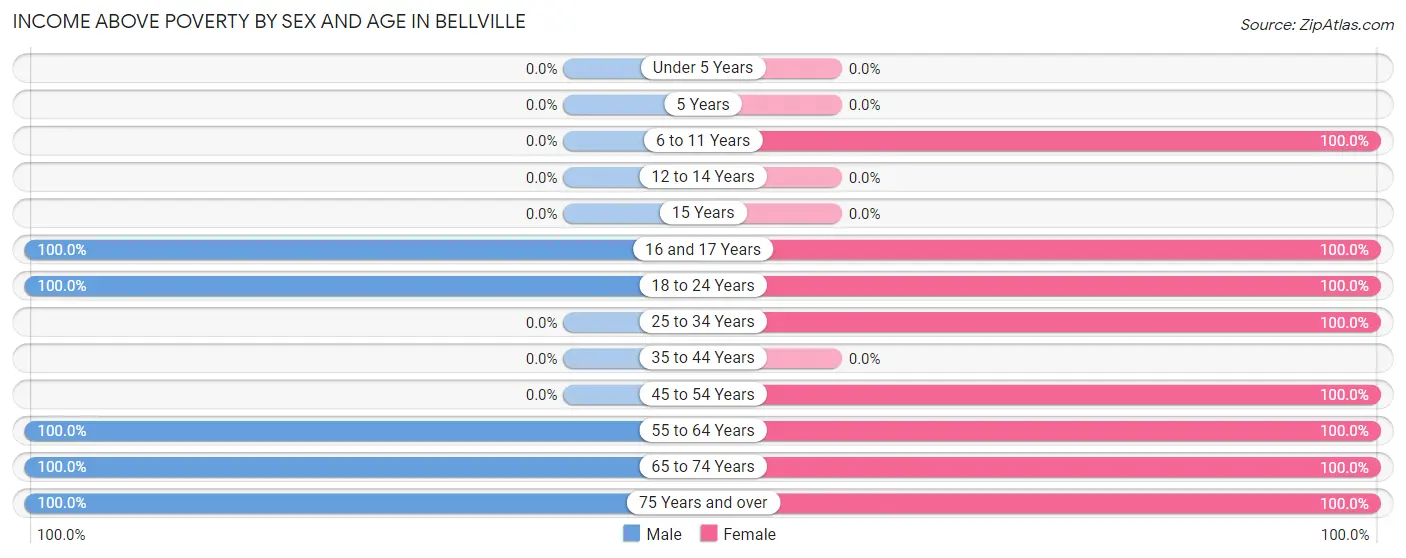
| Age Bracket | Male | Female |
| Under 5 Years | 0 (0.0%) | 0 (0.0%) |
| 5 Years | 0 (0.0%) | 0 (0.0%) |
| 6 to 11 Years | 0 (0.0%) | 1 (100.0%) |
| 12 to 14 Years | 0 (0.0%) | 0 (0.0%) |
| 15 Years | 0 (0.0%) | 0 (0.0%) |
| 16 and 17 Years | 7 (100.0%) | 3 (100.0%) |
| 18 to 24 Years | 20 (100.0%) | 21 (100.0%) |
| 25 to 34 Years | 0 (0.0%) | 1 (100.0%) |
| 35 to 44 Years | 0 (0.0%) | 0 (0.0%) |
| 45 to 54 Years | 0 (0.0%) | 24 (100.0%) |
| 55 to 64 Years | 18 (100.0%) | 39 (100.0%) |
| 65 to 74 Years | 28 (100.0%) | 14 (100.0%) |
| 75 Years and over | 5 (100.0%) | 15 (100.0%) |
| Total | 78 (100.0%) | 118 (100.0%) |
Income Below Poverty Among Married-Couple Families in Bellville
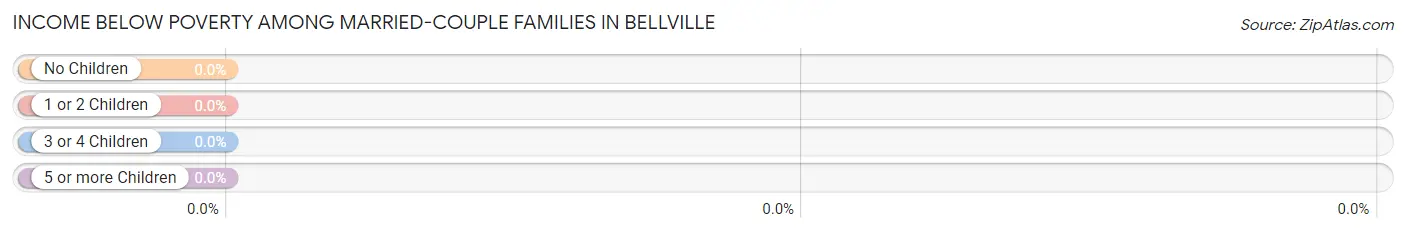
| Children | Above Poverty | Below Poverty |
| No Children | 40 (100.0%) | 0 (0.0%) |
| 1 or 2 Children | 6 (100.0%) | 0 (0.0%) |
| 3 or 4 Children | 0 (0.0%) | 0 (0.0%) |
| 5 or more Children | 0 (0.0%) | 0 (0.0%) |
| Total | 46 (100.0%) | 0 (0.0%) |
Income Below Poverty Among Single-Parent Households in Bellville
| Children | Single Father | Single Mother |
| No Children | 0 (0.0%) | 0 (0.0%) |
| 1 or 2 Children | 0 (0.0%) | 0 (0.0%) |
| 3 or 4 Children | 0 (0.0%) | 0 (0.0%) |
| 5 or more Children | 0 (0.0%) | 0 (0.0%) |
| Total | 0 (0.0%) | 0 (0.0%) |
Income Below Poverty Among Married-Couple vs Single-Parent Households in Bellville
| Children | Married-Couple Families | Single-Parent Households |
| No Children | 0 (0.0%) | 0 (0.0%) |
| 1 or 2 Children | 0 (0.0%) | 0 (0.0%) |
| 3 or 4 Children | 0 (0.0%) | 0 (0.0%) |
| 5 or more Children | 0 (0.0%) | 0 (0.0%) |
| Total | 0 (0.0%) | 0 (0.0%) |
Race in Bellville
The most populous races in Bellville are White / Caucasian (195 | 99.5%), Hispanic or Latino (9 | 4.6%), and Two or more Races (1 | 0.5%).
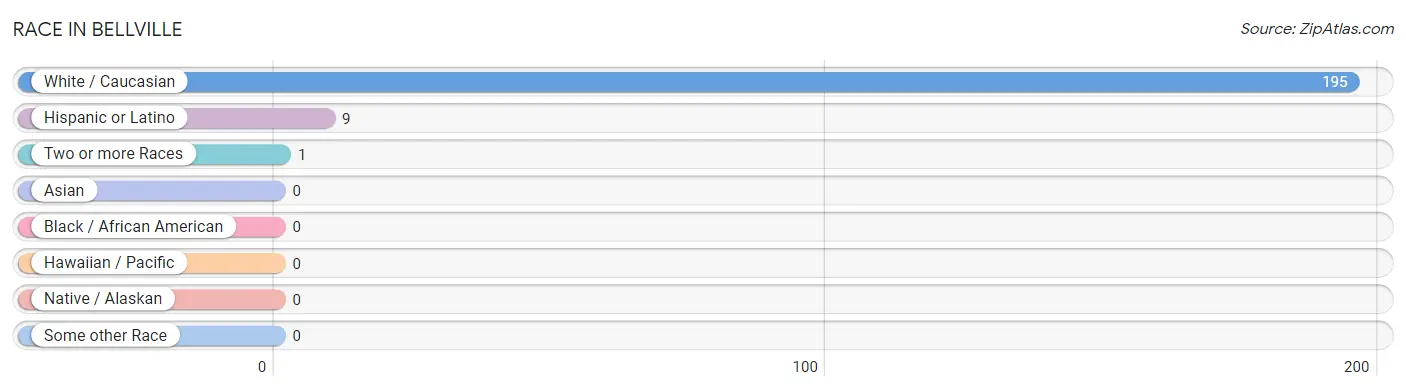
| Race | # Population | % Population |
| Asian | 0 | 0.0% |
| Black / African American | 0 | 0.0% |
| Hawaiian / Pacific | 0 | 0.0% |
| Hispanic or Latino | 9 | 4.6% |
| Native / Alaskan | 0 | 0.0% |
| White / Caucasian | 195 | 99.5% |
| Two or more Races | 1 | 0.5% |
| Some other Race | 0 | 0.0% |
| Total | 196 | 100.0% |
Ancestry in Bellville
The most populous ancestries reported in Bellville are English (31 | 15.8%), Puerto Rican (9 | 4.6%), American (5 | 2.5%), European (4 | 2.0%), and German (4 | 2.0%), together accounting for 27.0% of all Bellville residents.
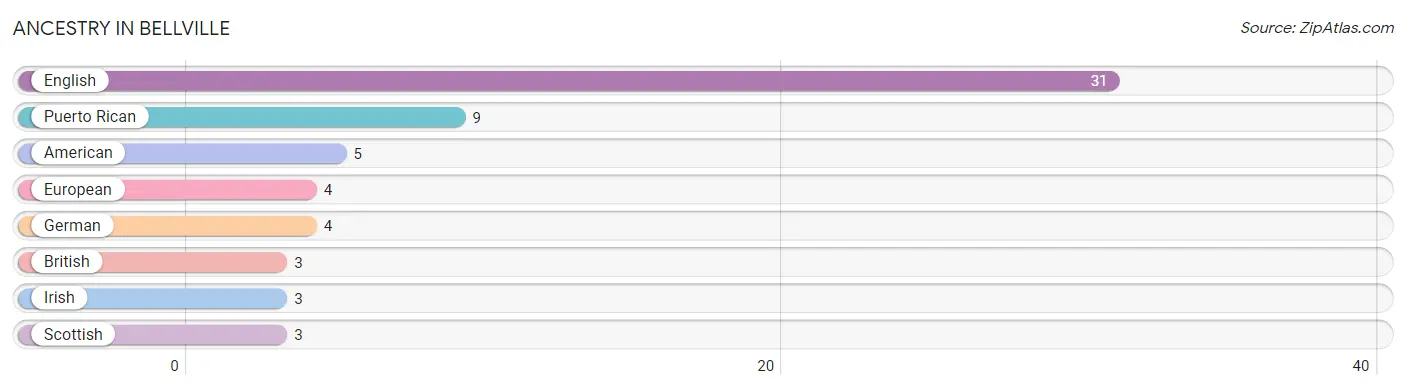
| Ancestry | # Population | % Population |
| American | 5 | 2.5% |
| British | 3 | 1.5% |
| English | 31 | 15.8% |
| European | 4 | 2.0% |
| German | 4 | 2.0% |
| Irish | 3 | 1.5% |
| Puerto Rican | 9 | 4.6% |
| Scottish | 3 | 1.5% | View All 8 Rows |
Immigrants in Bellville

| Immigration Origin | # Population | % Population | View All 0 Rows |
Sex and Age in Bellville
Sex and Age in Bellville
The most populous age groups in Bellville are 65 to 69 Years (26 | 33.3%) for men and 55 to 59 Years (33 | 28.0%) for women.
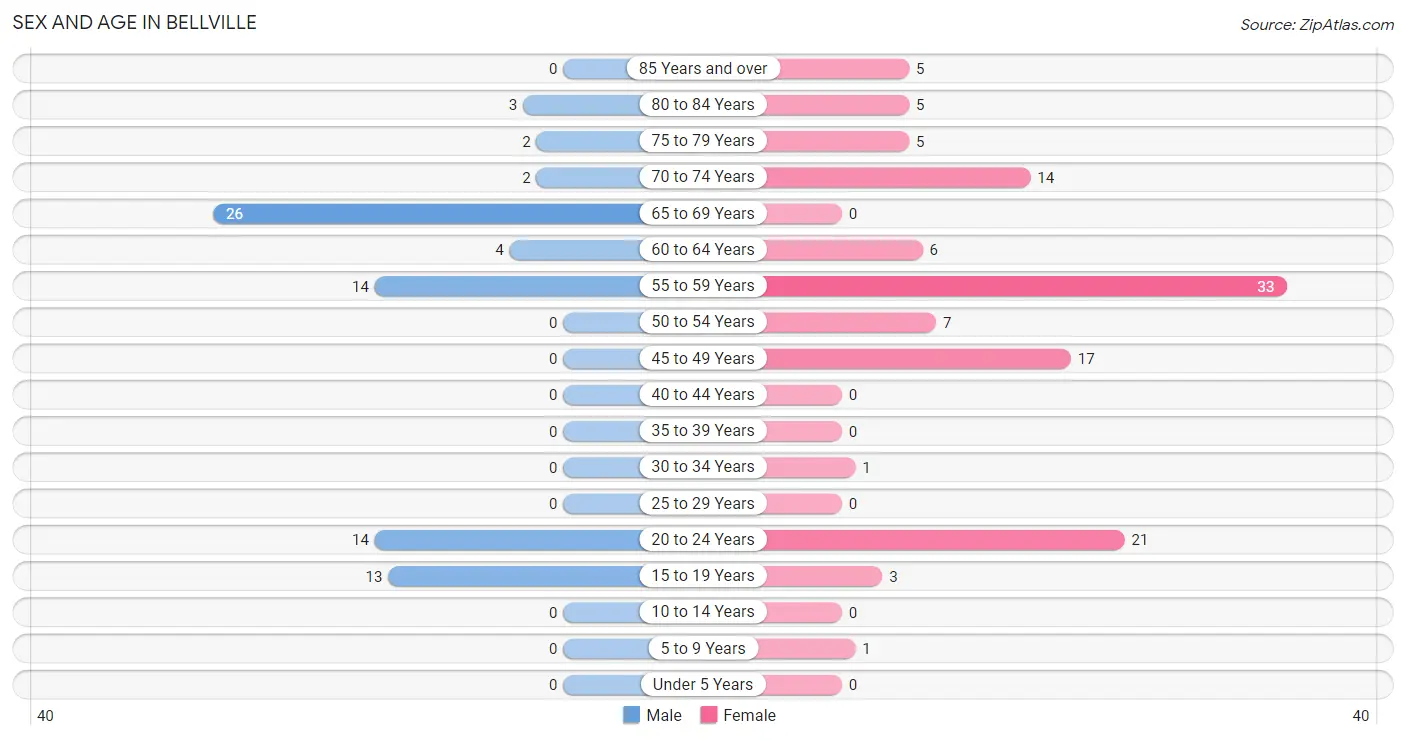
| Age Bracket | Male | Female |
| Under 5 Years | 0 (0.0%) | 0 (0.0%) |
| 5 to 9 Years | 0 (0.0%) | 1 (0.9%) |
| 10 to 14 Years | 0 (0.0%) | 0 (0.0%) |
| 15 to 19 Years | 13 (16.7%) | 3 (2.5%) |
| 20 to 24 Years | 14 (17.9%) | 21 (17.8%) |
| 25 to 29 Years | 0 (0.0%) | 0 (0.0%) |
| 30 to 34 Years | 0 (0.0%) | 1 (0.9%) |
| 35 to 39 Years | 0 (0.0%) | 0 (0.0%) |
| 40 to 44 Years | 0 (0.0%) | 0 (0.0%) |
| 45 to 49 Years | 0 (0.0%) | 17 (14.4%) |
| 50 to 54 Years | 0 (0.0%) | 7 (5.9%) |
| 55 to 59 Years | 14 (17.9%) | 33 (28.0%) |
| 60 to 64 Years | 4 (5.1%) | 6 (5.1%) |
| 65 to 69 Years | 26 (33.3%) | 0 (0.0%) |
| 70 to 74 Years | 2 (2.6%) | 14 (11.9%) |
| 75 to 79 Years | 2 (2.6%) | 5 (4.2%) |
| 80 to 84 Years | 3 (3.8%) | 5 (4.2%) |
| 85 Years and over | 0 (0.0%) | 5 (4.2%) |
| Total | 78 (100.0%) | 118 (100.0%) |
Families and Households in Bellville
Median Family Size in Bellville
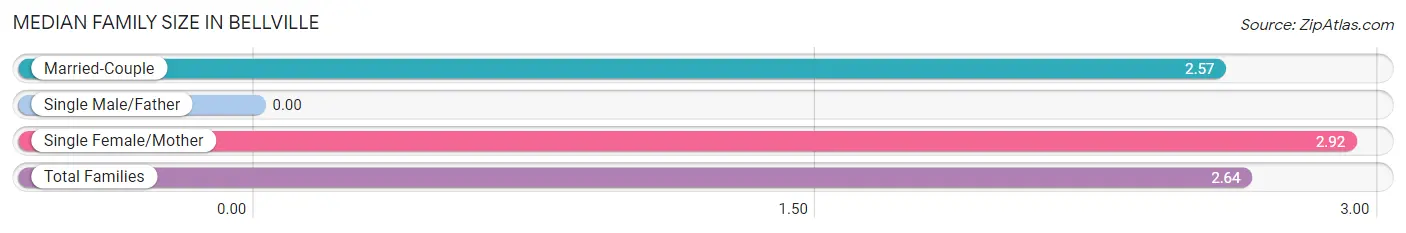
| Family Type | # Families | Family Size |
| Married-Couple | 46 (78.0%) | 2.57 |
| Single Male/Father | 0 (0.0%) | - |
| Single Female/Mother | 13 (22.0%) | 2.92 |
| Total Families | 59 (100.0%) | 2.64 |
Median Household Size in Bellville
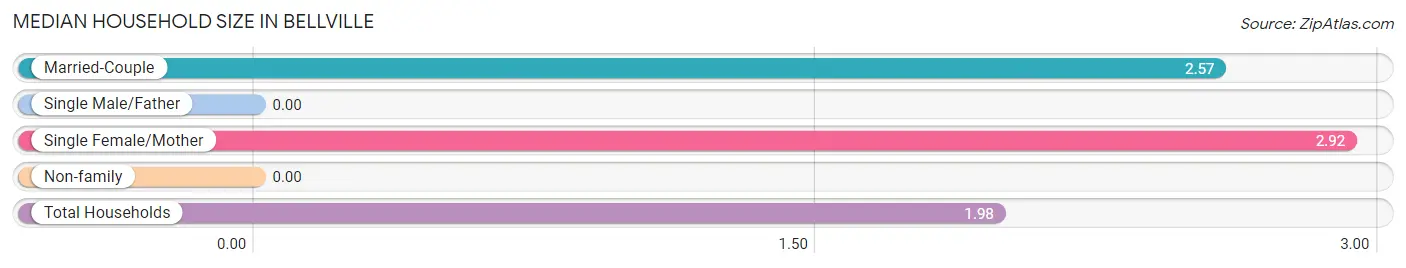
| Household Type | # Households | Household Size |
| Married-Couple | 46 (46.5%) | 2.57 |
| Single Male/Father | 0 (0.0%) | - |
| Single Female/Mother | 13 (13.1%) | 2.92 |
| Non-family | 40 (40.4%) | - |
| Total Households | 99 (100.0%) | 1.98 |
Household Size by Marriage Status in Bellville
Out of a total of 99 households in Bellville, 59 (59.6%) are family households, while 40 (40.4%) are nonfamily households. The most numerous type of family households are 2-person households, comprising 33, and the most common type of nonfamily households are 1-person households, comprising 40.
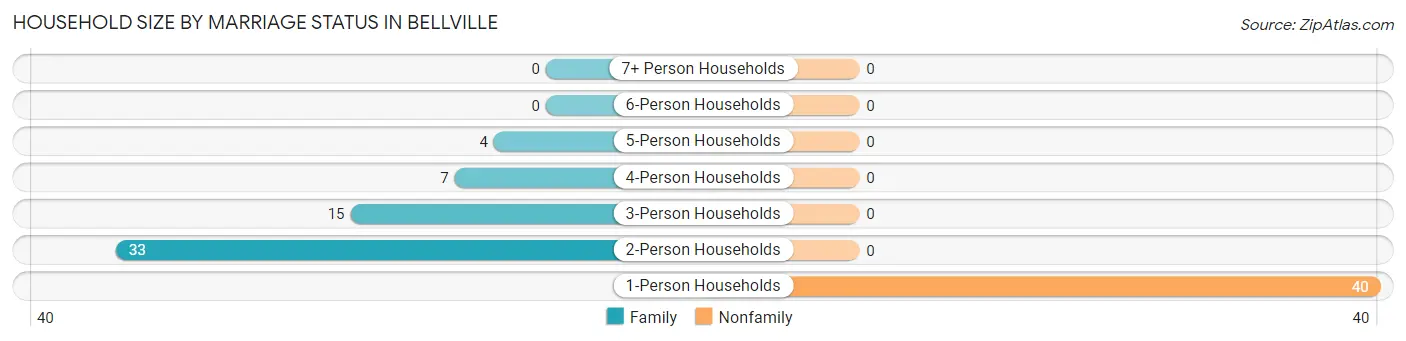
| Household Size | Family Households | Nonfamily Households |
| 1-Person Households | - | 40 (40.4%) |
| 2-Person Households | 33 (33.3%) | 0 (0.0%) |
| 3-Person Households | 15 (15.1%) | 0 (0.0%) |
| 4-Person Households | 7 (7.1%) | 0 (0.0%) |
| 5-Person Households | 4 (4.0%) | 0 (0.0%) |
| 6-Person Households | 0 (0.0%) | 0 (0.0%) |
| 7+ Person Households | 0 (0.0%) | 0 (0.0%) |
| Total | 59 (59.6%) | 40 (40.4%) |
Female Fertility in Bellville
Fertility by Age in Bellville
| Age Bracket | Women with Births | Births / 1,000 Women |
| 15 to 19 years | 0 (0.0%) | 0.0 |
| 20 to 34 years | 0 (0.0%) | 0.0 |
| 35 to 50 years | 0 (0.0%) | 0.0 |
| Total | 0 (0.0%) | 0.0 |
Fertility by Age by Marriage Status in Bellville
| Age Bracket | Married | Unmarried |
| 15 to 19 years | 0 (0.0%) | 0 (0.0%) |
| 20 to 34 years | 0 (0.0%) | 0 (0.0%) |
| 35 to 50 years | 0 (0.0%) | 0 (0.0%) |
| Total | 0 (0.0%) | 0 (0.0%) |
Fertility by Education in Bellville
| Educational Attainment | Women with Births | Births / 1,000 Women |
| Less than High School | 0 (0.0%) | 0.0 |
| High School Diploma | 0 (0.0%) | 0.0 |
| College or Associate's Degree | 0 (0.0%) | 0.0 |
| Bachelor's Degree | 0 (0.0%) | 0.0 |
| Graduate Degree | 0 (0.0%) | 0.0 |
| Total | 0 (0.0%) | 0.0 |
Fertility by Education by Marriage Status in Bellville
| Educational Attainment | Married | Unmarried |
| Less than High School | 0 (0.0%) | 0 (0.0%) |
| High School Diploma | 0 (0.0%) | 0 (0.0%) |
| College or Associate's Degree | 0 (0.0%) | 0 (0.0%) |
| Bachelor's Degree | 0 (0.0%) | 0 (0.0%) |
| Graduate Degree | 0 (0.0%) | 0 (0.0%) |
| Total | 0 (0.0%) | 0 (0.0%) |
Employment Characteristics in Bellville
Employment by Class of Employer in Bellville
Among the 102 employed individuals in Bellville, private company employees (45 | 44.1%), self-employed (incorporated) (37 | 36.3%), and state government employees (8 | 7.8%) make up the most common classes of employment.
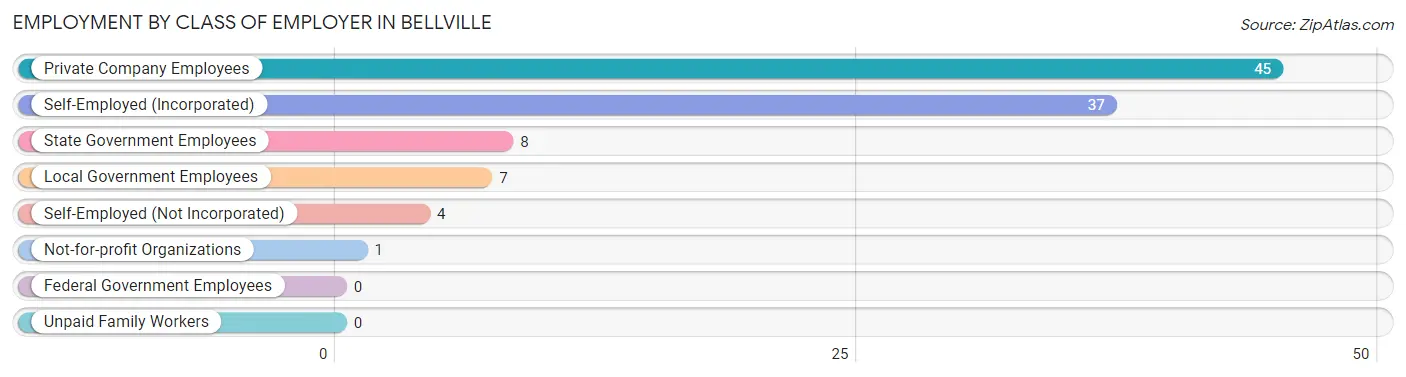
| Employer Class | # Employees | % Employees |
| Private Company Employees | 45 | 44.1% |
| Self-Employed (Incorporated) | 37 | 36.3% |
| Self-Employed (Not Incorporated) | 4 | 3.9% |
| Not-for-profit Organizations | 1 | 1.0% |
| Local Government Employees | 7 | 6.9% |
| State Government Employees | 8 | 7.8% |
| Federal Government Employees | 0 | 0.0% |
| Unpaid Family Workers | 0 | 0.0% |
| Total | 102 | 100.0% |
Employment Status by Age in Bellville
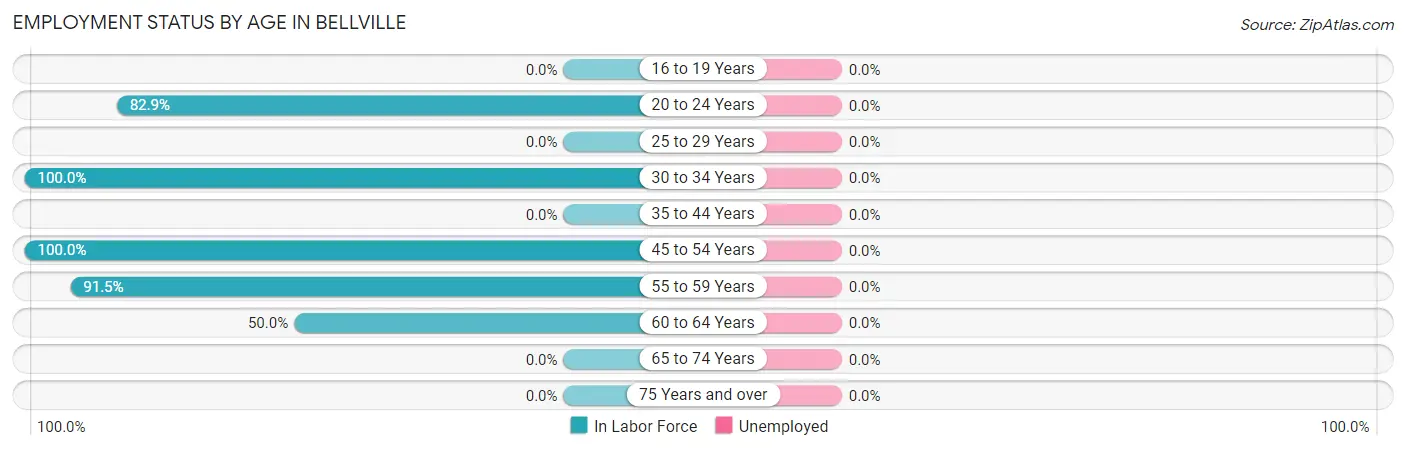
| Age Bracket | In Labor Force | Unemployed |
| 16 to 19 Years | 0 (0.0%) | 0 (0.0%) |
| 20 to 24 Years | 29 (82.9%) | 0 (0.0%) |
| 25 to 29 Years | 0 (0.0%) | 0 (0.0%) |
| 30 to 34 Years | 1 (100.0%) | 0 (0.0%) |
| 35 to 44 Years | 0 (0.0%) | 0 (0.0%) |
| 45 to 54 Years | 24 (100.0%) | 0 (0.0%) |
| 55 to 59 Years | 43 (91.5%) | 0 (0.0%) |
| 60 to 64 Years | 5 (50.0%) | 0 (0.0%) |
| 65 to 74 Years | 0 (0.0%) | 0 (0.0%) |
| 75 Years and over | 0 (0.0%) | 0 (0.0%) |
| Total | 102 (52.3%) | 0 (0.0%) |
Employment Status by Educational Attainment in Bellville
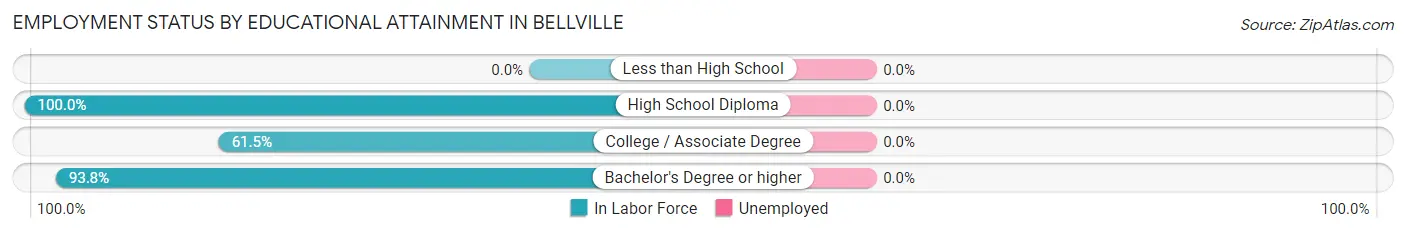
| Educational Attainment | In Labor Force | Unemployed |
| Less than High School | 0 (0.0%) | 0 (0.0%) |
| High School Diploma | 5 (100.0%) | 0 (0.0%) |
| College / Associate Degree | 8 (61.5%) | 0 (0.0%) |
| Bachelor's Degree or higher | 60 (93.8%) | 0 (0.0%) |
| Total | 73 (89.0%) | 0 (0.0%) |
Employment Occupations by Sex in Bellville
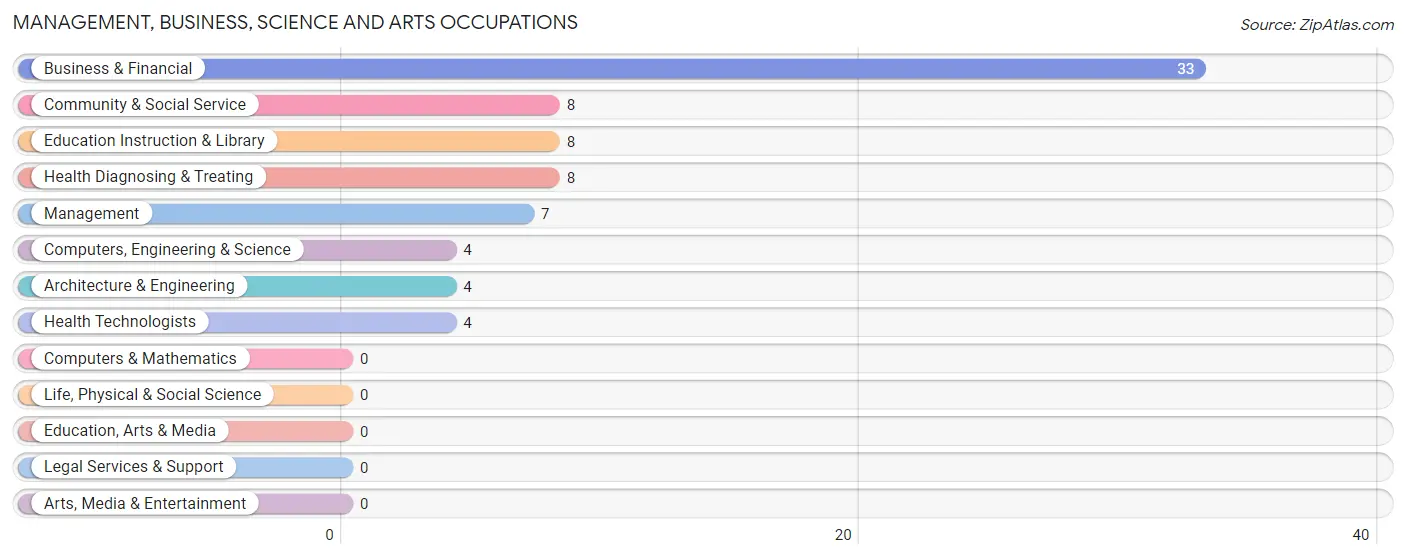
Management, Business, Science and Arts Occupations
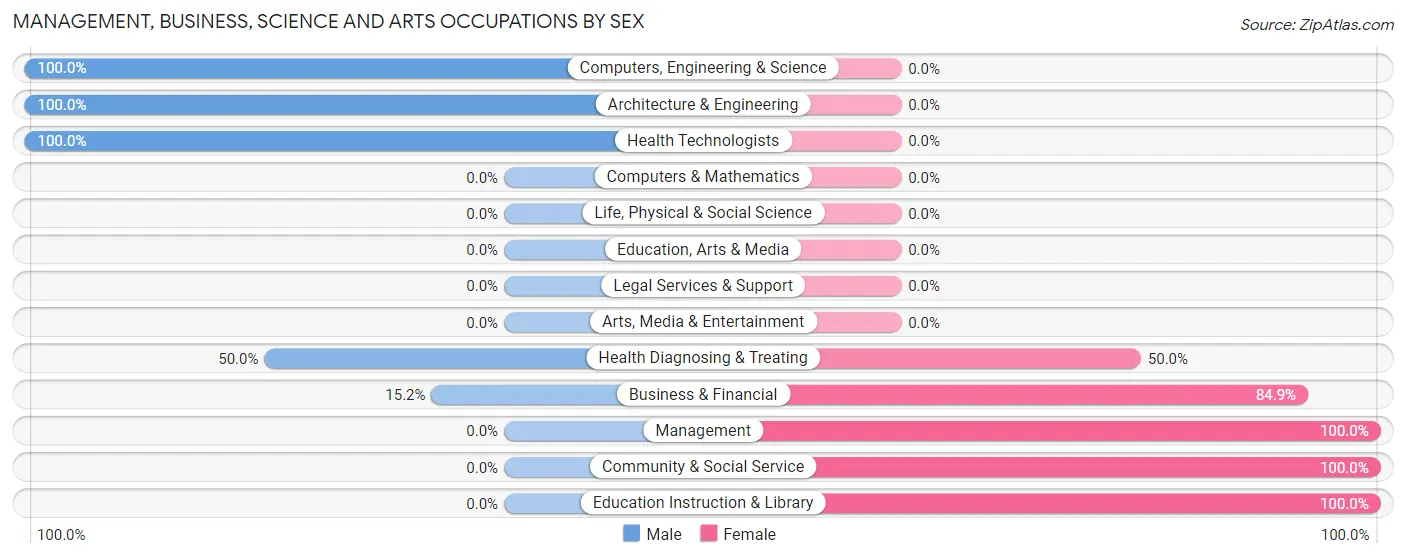
The most common Management, Business, Science and Arts occupations in Bellville are Business & Financial (33 | 32.4%), Community & Social Service (8 | 7.8%), Education Instruction & Library (8 | 7.8%), Health Diagnosing & Treating (8 | 7.8%), and Management (7 | 6.9%).
Management, Business, Science and Arts Occupations by Sex
Within the Management, Business, Science and Arts occupations in Bellville, the most male-oriented occupations are Computers, Engineering & Science (100.0%), Architecture & Engineering (100.0%), and Health Technologists (100.0%), while the most female-oriented occupations are Management (100.0%), Community & Social Service (100.0%), and Education Instruction & Library (100.0%).
| Occupation | Male | Female |
| Management | 0 (0.0%) | 7 (100.0%) |
| Business & Financial | 5 (15.1%) | 28 (84.9%) |
| Computers, Engineering & Science | 4 (100.0%) | 0 (0.0%) |
| Computers & Mathematics | 0 (0.0%) | 0 (0.0%) |
| Architecture & Engineering | 4 (100.0%) | 0 (0.0%) |
| Life, Physical & Social Science | 0 (0.0%) | 0 (0.0%) |
| Community & Social Service | 0 (0.0%) | 8 (100.0%) |
| Education, Arts & Media | 0 (0.0%) | 0 (0.0%) |
| Legal Services & Support | 0 (0.0%) | 0 (0.0%) |
| Education Instruction & Library | 0 (0.0%) | 8 (100.0%) |
| Arts, Media & Entertainment | 0 (0.0%) | 0 (0.0%) |
| Health Diagnosing & Treating | 4 (50.0%) | 4 (50.0%) |
| Health Technologists | 4 (100.0%) | 0 (0.0%) |
| Total (Category) | 13 (21.7%) | 47 (78.3%) |
| Total (Overall) | 26 (25.5%) | 76 (74.5%) |
Services Occupations
Services Occupations by Sex
| Occupation | Male | Female |
| Healthcare Support | 0 (0.0%) | 0 (0.0%) |
| Security & Protection | 0 (0.0%) | 0 (0.0%) |
| Firefighting & Prevention | 0 (0.0%) | 0 (0.0%) |
| Law Enforcement | 0 (0.0%) | 0 (0.0%) |
| Food Preparation & Serving | 0 (0.0%) | 0 (0.0%) |
| Cleaning & Maintenance | 0 (0.0%) | 0 (0.0%) |
| Personal Care & Service | 0 (0.0%) | 0 (0.0%) |
| Total (Category) | 0 (0.0%) | 0 (0.0%) |
| Total (Overall) | 26 (25.5%) | 76 (74.5%) |
Sales and Office Occupations
The most common Sales and Office occupations in Bellville are Office & Administration (23 | 22.6%), and Sales & Related (9 | 8.8%).

Sales and Office Occupations by Sex

| Occupation | Male | Female |
| Sales & Related | 5 (55.6%) | 4 (44.4%) |
| Office & Administration | 0 (0.0%) | 23 (100.0%) |
| Total (Category) | 5 (15.6%) | 27 (84.4%) |
| Total (Overall) | 26 (25.5%) | 76 (74.5%) |
Natural Resources, Construction and Maintenance Occupations

Natural Resources, Construction and Maintenance Occupations by Sex
| Occupation | Male | Female |
| Farming, Fishing & Forestry | 0 (0.0%) | 0 (0.0%) |
| Construction & Extraction | 0 (0.0%) | 0 (0.0%) |
| Installation, Maintenance & Repair | 0 (0.0%) | 0 (0.0%) |
| Total (Category) | 0 (0.0%) | 0 (0.0%) |
| Total (Overall) | 26 (25.5%) | 76 (74.5%) |
Production, Transportation and Moving Occupations
The most common Production, Transportation and Moving occupations in Bellville are , and Material Moving (10 | 9.8%).
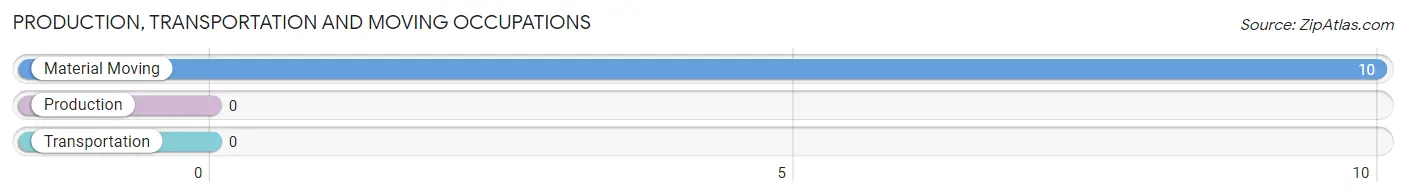
Production, Transportation and Moving Occupations by Sex
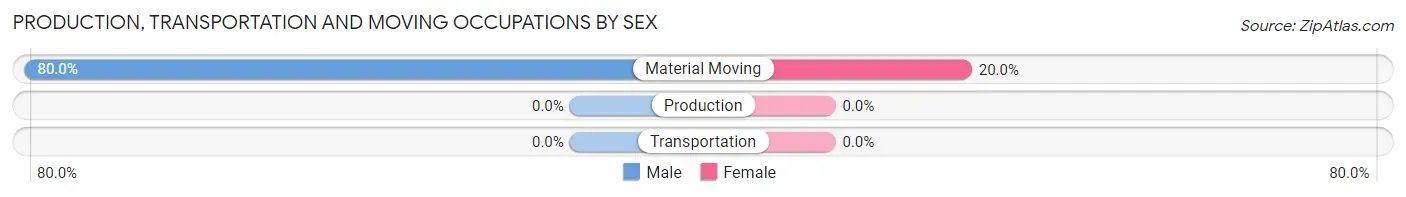
| Occupation | Male | Female |
| Production | 0 (0.0%) | 0 (0.0%) |
| Transportation | 0 (0.0%) | 0 (0.0%) |
| Material Moving | 8 (80.0%) | 2 (20.0%) |
| Total (Category) | 8 (80.0%) | 2 (20.0%) |
| Total (Overall) | 26 (25.5%) | 76 (74.5%) |
Employment Industries by Sex in Bellville
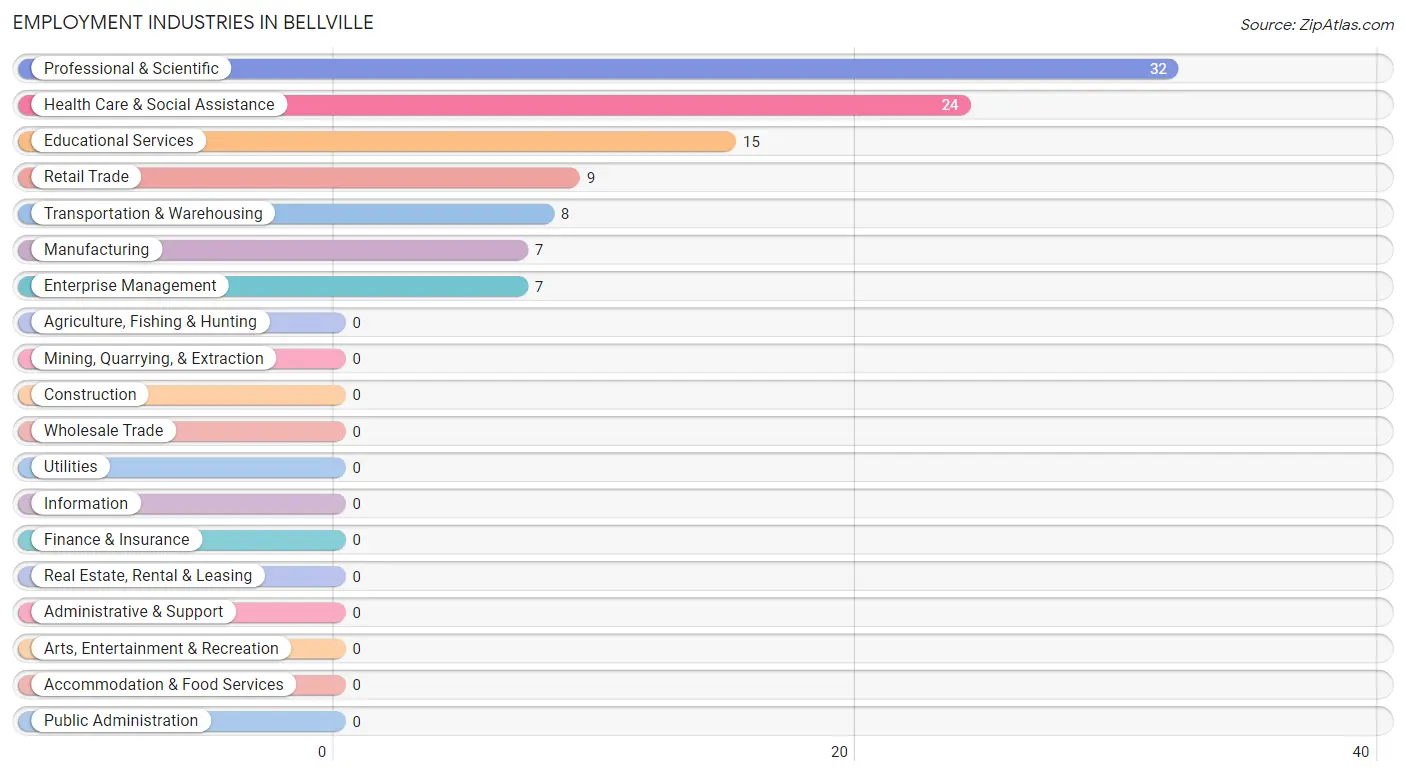
Employment Industries in Bellville
The major employment industries in Bellville include Professional & Scientific (32 | 31.4%), Health Care & Social Assistance (24 | 23.5%), Educational Services (15 | 14.7%), Retail Trade (9 | 8.8%), and Transportation & Warehousing (8 | 7.8%).
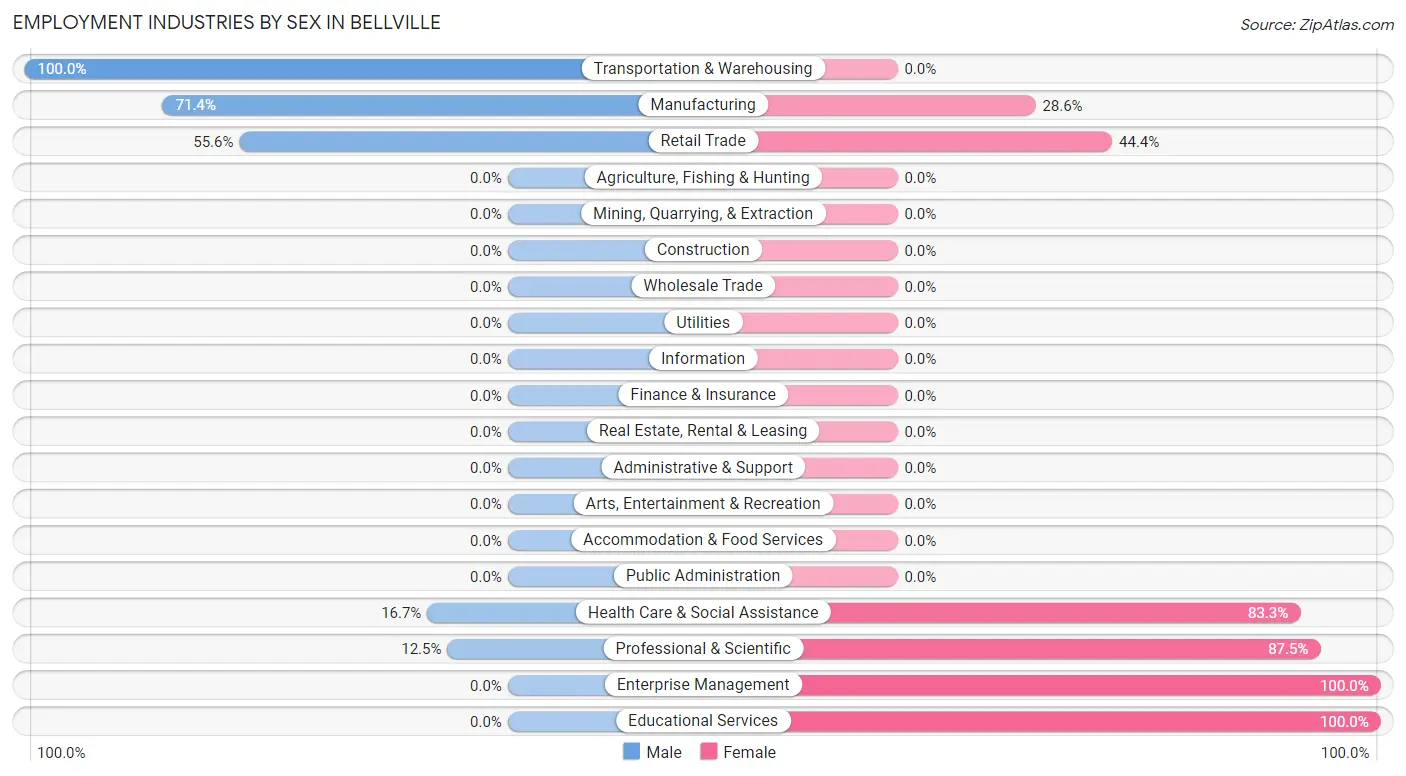
Employment Industries by Sex in Bellville
The Bellville industries that see more men than women are Transportation & Warehousing (100.0%), Manufacturing (71.4%), and Retail Trade (55.6%), whereas the industries that tend to have a higher number of women are Enterprise Management (100.0%), Educational Services (100.0%), and Professional & Scientific (87.5%).
| Industry | Male | Female |
| Agriculture, Fishing & Hunting | 0 (0.0%) | 0 (0.0%) |
| Mining, Quarrying, & Extraction | 0 (0.0%) | 0 (0.0%) |
| Construction | 0 (0.0%) | 0 (0.0%) |
| Manufacturing | 5 (71.4%) | 2 (28.6%) |
| Wholesale Trade | 0 (0.0%) | 0 (0.0%) |
| Retail Trade | 5 (55.6%) | 4 (44.4%) |
| Transportation & Warehousing | 8 (100.0%) | 0 (0.0%) |
| Utilities | 0 (0.0%) | 0 (0.0%) |
| Information | 0 (0.0%) | 0 (0.0%) |
| Finance & Insurance | 0 (0.0%) | 0 (0.0%) |
| Real Estate, Rental & Leasing | 0 (0.0%) | 0 (0.0%) |
| Professional & Scientific | 4 (12.5%) | 28 (87.5%) |
| Enterprise Management | 0 (0.0%) | 7 (100.0%) |
| Administrative & Support | 0 (0.0%) | 0 (0.0%) |
| Educational Services | 0 (0.0%) | 15 (100.0%) |
| Health Care & Social Assistance | 4 (16.7%) | 20 (83.3%) |
| Arts, Entertainment & Recreation | 0 (0.0%) | 0 (0.0%) |
| Accommodation & Food Services | 0 (0.0%) | 0 (0.0%) |
| Public Administration | 0 (0.0%) | 0 (0.0%) |
| Total | 26 (25.5%) | 76 (74.5%) |
Education in Bellville
School Enrollment in Bellville
The most common levels of schooling among the 44 students in Bellville are college / undergraduate (26 | 59.1%), high school (10 | 22.7%), and graduate / professional (7 | 15.9%).
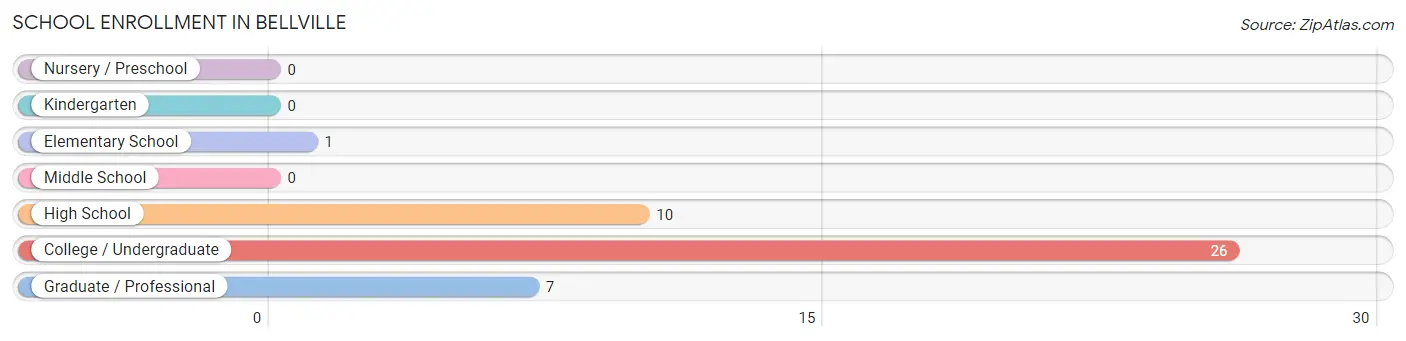
| School Level | # Students | % Students |
| Nursery / Preschool | 0 | 0.0% |
| Kindergarten | 0 | 0.0% |
| Elementary School | 1 | 2.3% |
| Middle School | 0 | 0.0% |
| High School | 10 | 22.7% |
| College / Undergraduate | 26 | 59.1% |
| Graduate / Professional | 7 | 15.9% |
| Total | 44 | 100.0% |
School Enrollment by Age by Funding Source in Bellville
Out of a total of 44 students who are enrolled in schools in Bellville, 7 (15.9%) attend a private institution, while the remaining 37 (84.1%) are enrolled in public schools. The age group of 15 to 17 year olds has the highest likelihood of being enrolled in private schools, with 7 (70.0% in the age bracket) enrolled. Conversely, the age group of 5 to 9 year old has the lowest likelihood of being enrolled in a private school, with 1 (100.0% in the age bracket) attending a public institution.
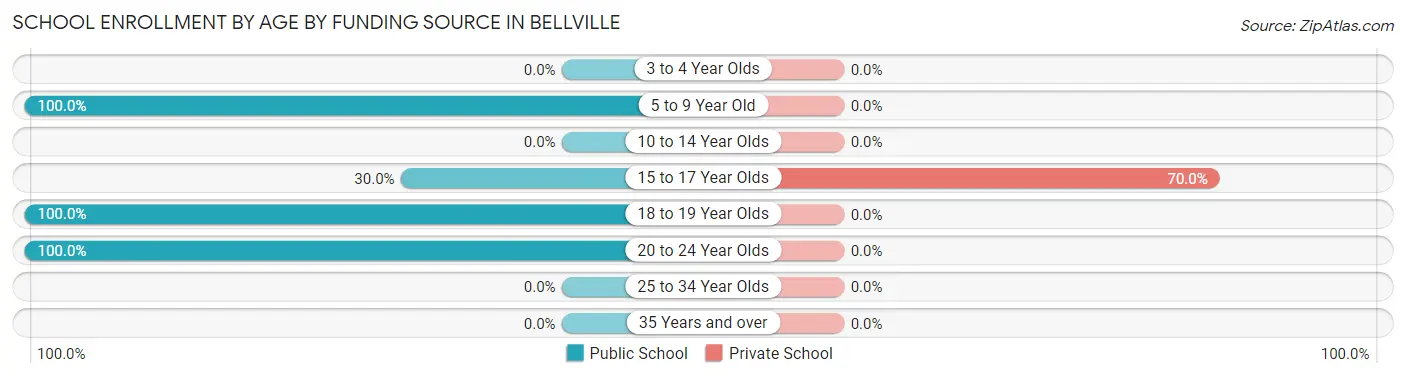
| Age Bracket | Public School | Private School |
| 3 to 4 Year Olds | 0 (0.0%) | 0 (0.0%) |
| 5 to 9 Year Old | 1 (100.0%) | 0 (0.0%) |
| 10 to 14 Year Olds | 0 (0.0%) | 0 (0.0%) |
| 15 to 17 Year Olds | 3 (30.0%) | 7 (70.0%) |
| 18 to 19 Year Olds | 6 (100.0%) | 0 (0.0%) |
| 20 to 24 Year Olds | 27 (100.0%) | 0 (0.0%) |
| 25 to 34 Year Olds | 0 (0.0%) | 0 (0.0%) |
| 35 Years and over | 0 (0.0%) | 0 (0.0%) |
| Total | 37 (84.1%) | 7 (15.9%) |
Educational Attainment by Field of Study in Bellville
Business (68 | 56.7%), multidisciplinary studies (21 | 17.5%), education (12 | 10.0%), science & technology (8 | 6.7%), and computers & mathematics (7 | 5.8%) are the most common fields of study among 120 individuals in Bellville who have obtained a bachelor's degree or higher.
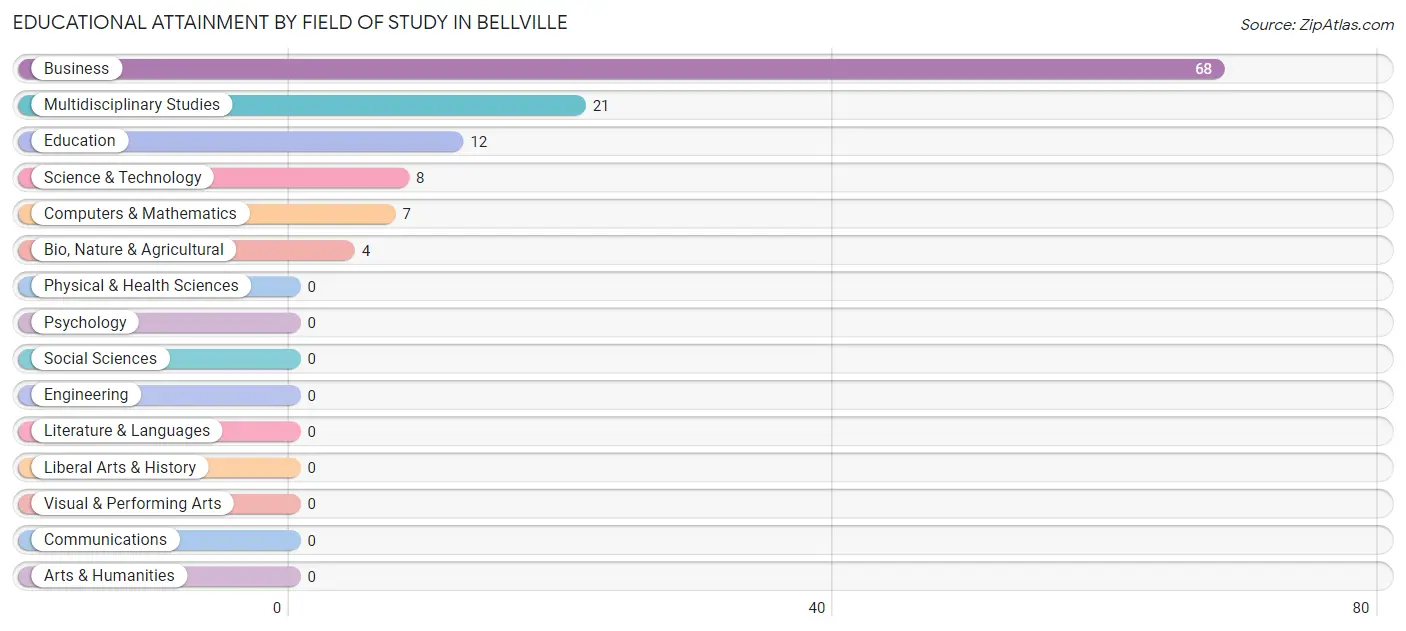
| Field of Study | # Graduates | % Graduates |
| Computers & Mathematics | 7 | 5.8% |
| Bio, Nature & Agricultural | 4 | 3.3% |
| Physical & Health Sciences | 0 | 0.0% |
| Psychology | 0 | 0.0% |
| Social Sciences | 0 | 0.0% |
| Engineering | 0 | 0.0% |
| Multidisciplinary Studies | 21 | 17.5% |
| Science & Technology | 8 | 6.7% |
| Business | 68 | 56.7% |
| Education | 12 | 10.0% |
| Literature & Languages | 0 | 0.0% |
| Liberal Arts & History | 0 | 0.0% |
| Visual & Performing Arts | 0 | 0.0% |
| Communications | 0 | 0.0% |
| Arts & Humanities | 0 | 0.0% |
| Total | 120 | 100.0% |
Transportation & Commute in Bellville
Vehicle Availability by Sex in Bellville
The most prevalent vehicle ownership categories in Bellville are males with 4 vehicles (9, accounting for 34.6%) and females with 4 vehicles (25, making up 11.8%).
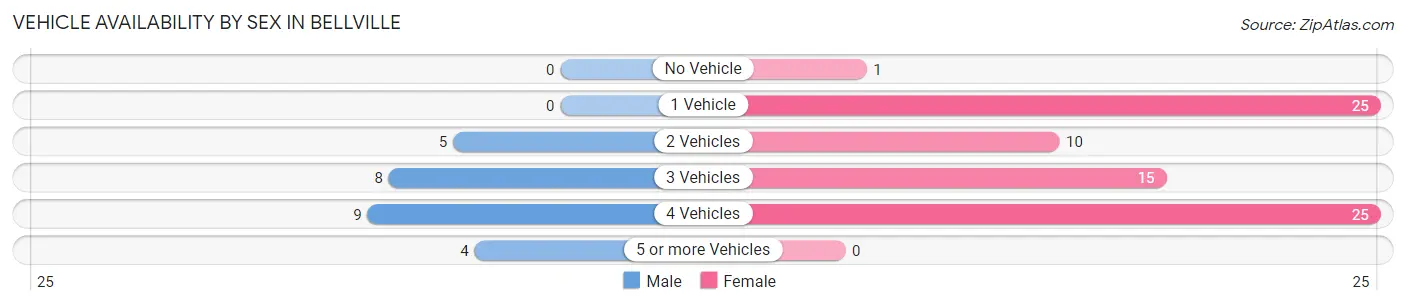
| Vehicles Available | Male | Female |
| No Vehicle | 0 (0.0%) | 1 (1.3%) |
| 1 Vehicle | 0 (0.0%) | 25 (32.9%) |
| 2 Vehicles | 5 (19.2%) | 10 (13.2%) |
| 3 Vehicles | 8 (30.8%) | 15 (19.7%) |
| 4 Vehicles | 9 (34.6%) | 25 (32.9%) |
| 5 or more Vehicles | 4 (15.4%) | 0 (0.0%) |
| Total | 26 (100.0%) | 76 (100.0%) |
Commute Time in Bellville
The most frequently occuring commute durations in Bellville are 5 to 9 minutes (29 commuters, 28.4%), 10 to 14 minutes (15 commuters, 14.7%), and 35 to 39 minutes (14 commuters, 13.7%).
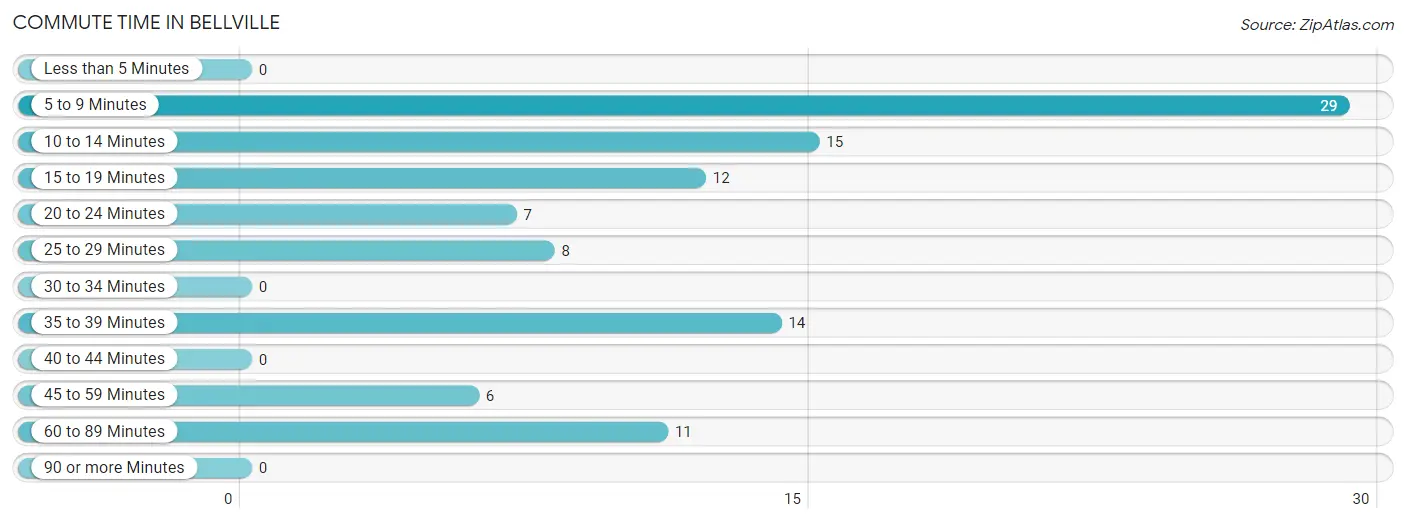
| Commute Time | # Commuters | % Commuters |
| Less than 5 Minutes | 0 | 0.0% |
| 5 to 9 Minutes | 29 | 28.4% |
| 10 to 14 Minutes | 15 | 14.7% |
| 15 to 19 Minutes | 12 | 11.8% |
| 20 to 24 Minutes | 7 | 6.9% |
| 25 to 29 Minutes | 8 | 7.8% |
| 30 to 34 Minutes | 0 | 0.0% |
| 35 to 39 Minutes | 14 | 13.7% |
| 40 to 44 Minutes | 0 | 0.0% |
| 45 to 59 Minutes | 6 | 5.9% |
| 60 to 89 Minutes | 11 | 10.8% |
| 90 or more Minutes | 0 | 0.0% |
Commute Time by Sex in Bellville
The most common commute times in Bellville are 10 to 14 minutes (8 commuters, 30.8%) for males and 5 to 9 minutes (29 commuters, 38.2%) for females.
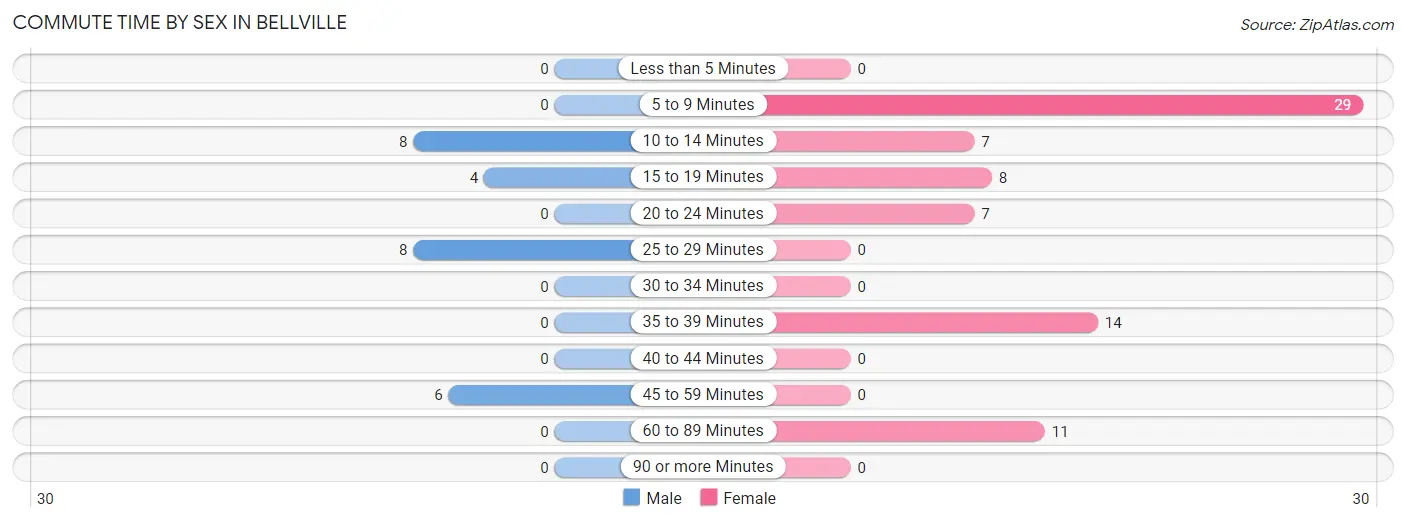
| Commute Time | Male | Female |
| Less than 5 Minutes | 0 (0.0%) | 0 (0.0%) |
| 5 to 9 Minutes | 0 (0.0%) | 29 (38.2%) |
| 10 to 14 Minutes | 8 (30.8%) | 7 (9.2%) |
| 15 to 19 Minutes | 4 (15.4%) | 8 (10.5%) |
| 20 to 24 Minutes | 0 (0.0%) | 7 (9.2%) |
| 25 to 29 Minutes | 8 (30.8%) | 0 (0.0%) |
| 30 to 34 Minutes | 0 (0.0%) | 0 (0.0%) |
| 35 to 39 Minutes | 0 (0.0%) | 14 (18.4%) |
| 40 to 44 Minutes | 0 (0.0%) | 0 (0.0%) |
| 45 to 59 Minutes | 6 (23.1%) | 0 (0.0%) |
| 60 to 89 Minutes | 0 (0.0%) | 11 (14.5%) |
| 90 or more Minutes | 0 (0.0%) | 0 (0.0%) |
Time of Departure to Work by Sex in Bellville
The most frequent times of departure to work in Bellville are 8:00 AM to 8:29 AM (12, 46.2%) for males and 8:00 AM to 8:29 AM (32, 42.1%) for females.
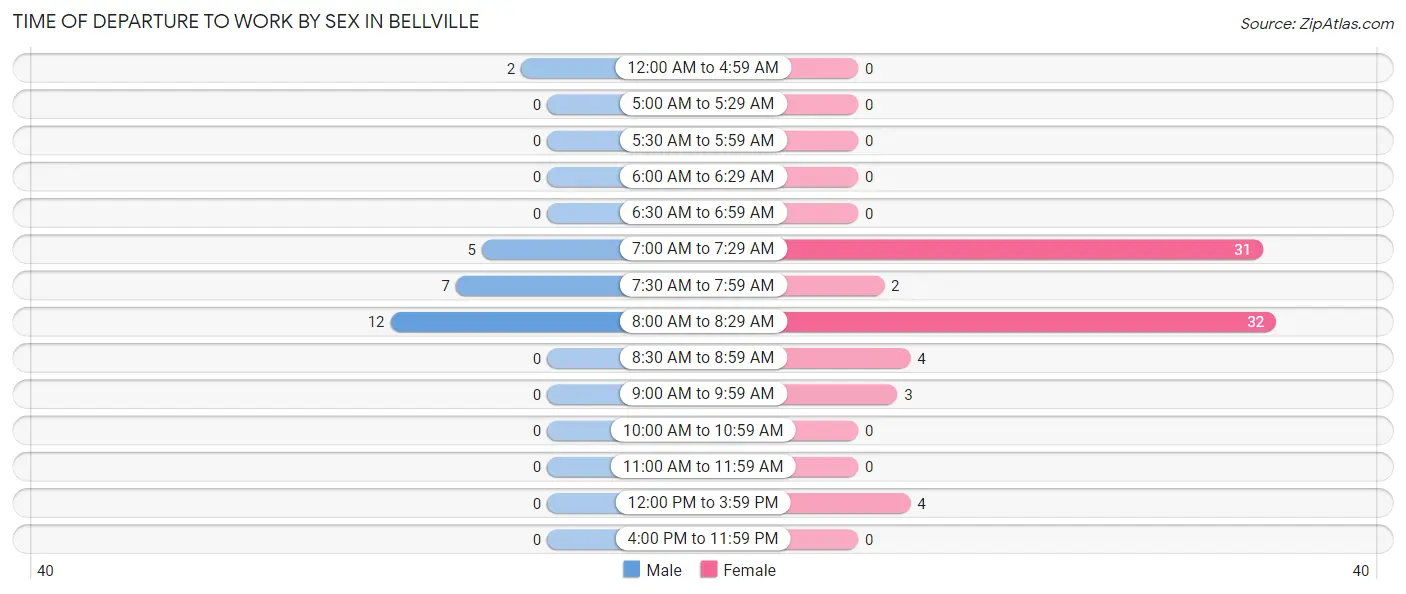
| Time of Departure | Male | Female |
| 12:00 AM to 4:59 AM | 2 (7.7%) | 0 (0.0%) |
| 5:00 AM to 5:29 AM | 0 (0.0%) | 0 (0.0%) |
| 5:30 AM to 5:59 AM | 0 (0.0%) | 0 (0.0%) |
| 6:00 AM to 6:29 AM | 0 (0.0%) | 0 (0.0%) |
| 6:30 AM to 6:59 AM | 0 (0.0%) | 0 (0.0%) |
| 7:00 AM to 7:29 AM | 5 (19.2%) | 31 (40.8%) |
| 7:30 AM to 7:59 AM | 7 (26.9%) | 2 (2.6%) |
| 8:00 AM to 8:29 AM | 12 (46.2%) | 32 (42.1%) |
| 8:30 AM to 8:59 AM | 0 (0.0%) | 4 (5.3%) |
| 9:00 AM to 9:59 AM | 0 (0.0%) | 3 (4.0%) |
| 10:00 AM to 10:59 AM | 0 (0.0%) | 0 (0.0%) |
| 11:00 AM to 11:59 AM | 0 (0.0%) | 0 (0.0%) |
| 12:00 PM to 3:59 PM | 0 (0.0%) | 4 (5.3%) |
| 4:00 PM to 11:59 PM | 0 (0.0%) | 0 (0.0%) |
| Total | 26 (100.0%) | 76 (100.0%) |
Housing Occupancy in Bellville
Occupancy by Ownership in Bellville
Of the total 99 dwellings in Bellville, owner-occupied units account for 82 (82.8%), while renter-occupied units make up 17 (17.2%).
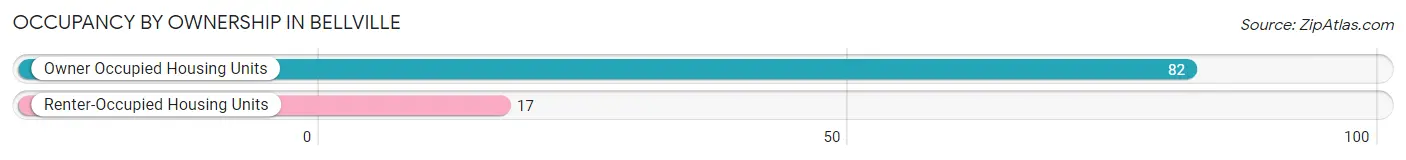
| Occupancy | # Housing Units | % Housing Units |
| Owner Occupied Housing Units | 82 | 82.8% |
| Renter-Occupied Housing Units | 17 | 17.2% |
| Total Occupied Housing Units | 99 | 100.0% |
Occupancy by Household Size in Bellville
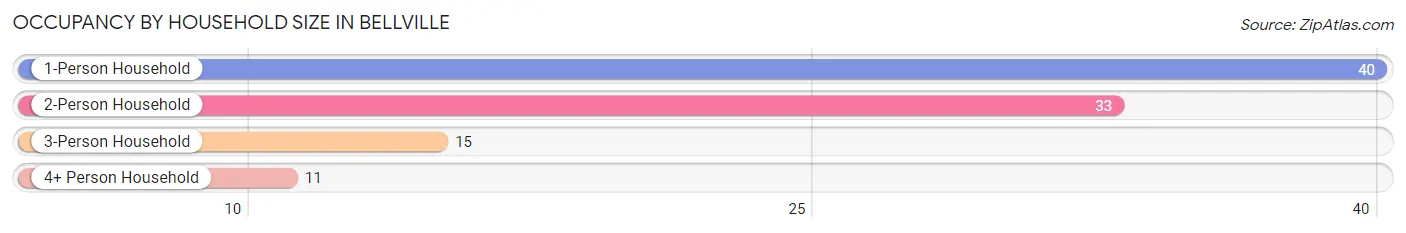
| Household Size | # Housing Units | % Housing Units |
| 1-Person Household | 40 | 40.4% |
| 2-Person Household | 33 | 33.3% |
| 3-Person Household | 15 | 15.1% |
| 4+ Person Household | 11 | 11.1% |
| Total Housing Units | 99 | 100.0% |
Occupancy by Ownership by Household Size in Bellville
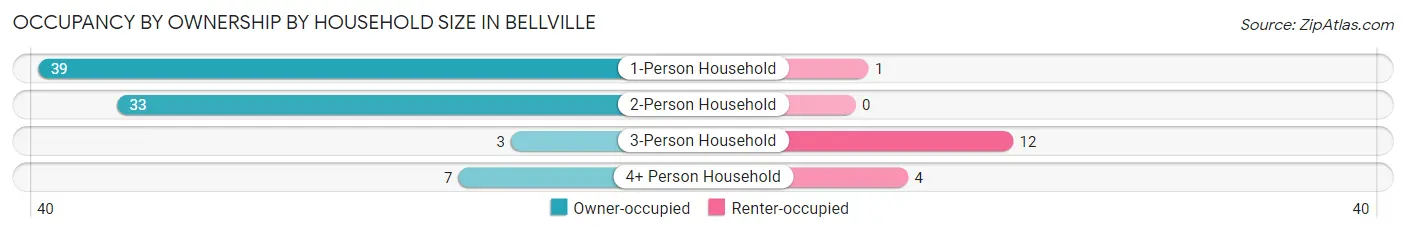
| Household Size | Owner-occupied | Renter-occupied |
| 1-Person Household | 39 (97.5%) | 1 (2.5%) |
| 2-Person Household | 33 (100.0%) | 0 (0.0%) |
| 3-Person Household | 3 (20.0%) | 12 (80.0%) |
| 4+ Person Household | 7 (63.6%) | 4 (36.4%) |
| Total Housing Units | 82 (82.8%) | 17 (17.2%) |
Occupancy by Educational Attainment in Bellville
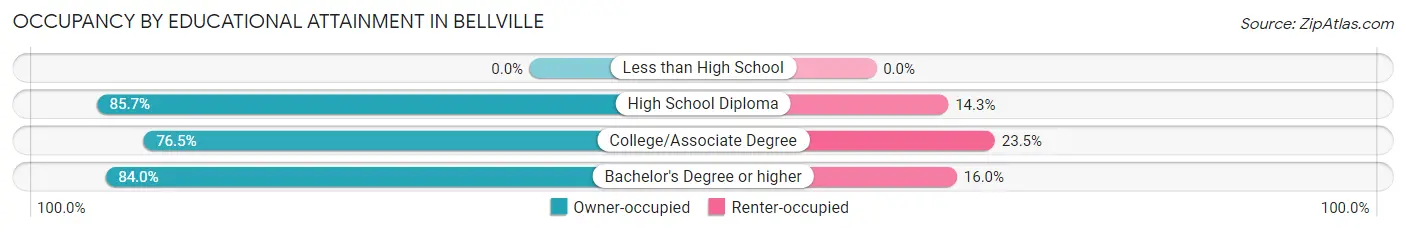
| Household Size | Owner-occupied | Renter-occupied |
| Less than High School | 0 (0.0%) | 0 (0.0%) |
| High School Diploma | 6 (85.7%) | 1 (14.3%) |
| College/Associate Degree | 13 (76.5%) | 4 (23.5%) |
| Bachelor's Degree or higher | 63 (84.0%) | 12 (16.0%) |
Occupancy by Age of Householder in Bellville
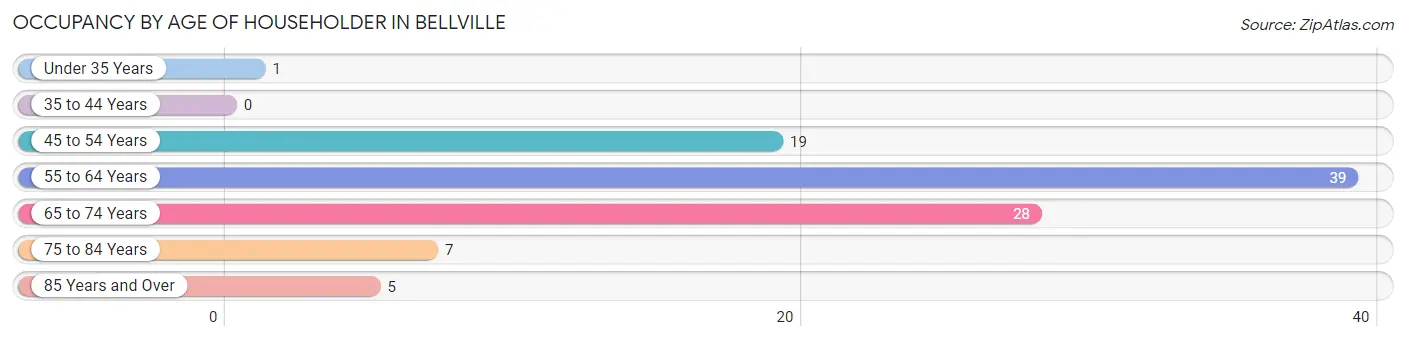
| Age Bracket | # Households | % Households |
| Under 35 Years | 1 | 1.0% |
| 35 to 44 Years | 0 | 0.0% |
| 45 to 54 Years | 19 | 19.2% |
| 55 to 64 Years | 39 | 39.4% |
| 65 to 74 Years | 28 | 28.3% |
| 75 to 84 Years | 7 | 7.1% |
| 85 Years and Over | 5 | 5.1% |
| Total | 99 | 100.0% |
Housing Finances in Bellville
Median Income by Occupancy in Bellville
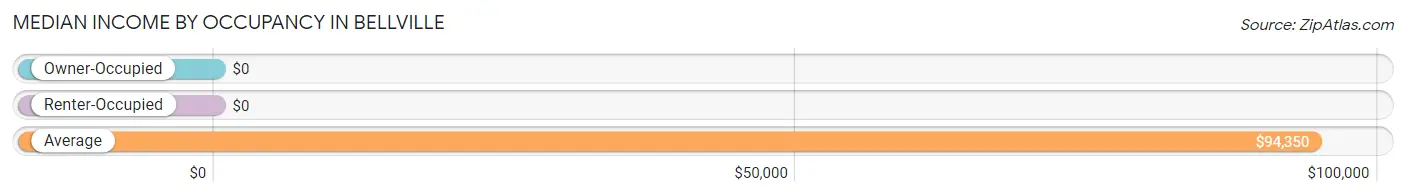
| Occupancy Type | # Households | Median Income |
| Owner-Occupied | 82 (82.8%) | $0 |
| Renter-Occupied | 17 (17.2%) | $0 |
| Average | 99 (100.0%) | $94,350 |
Occupancy by Householder Income Bracket in Bellville
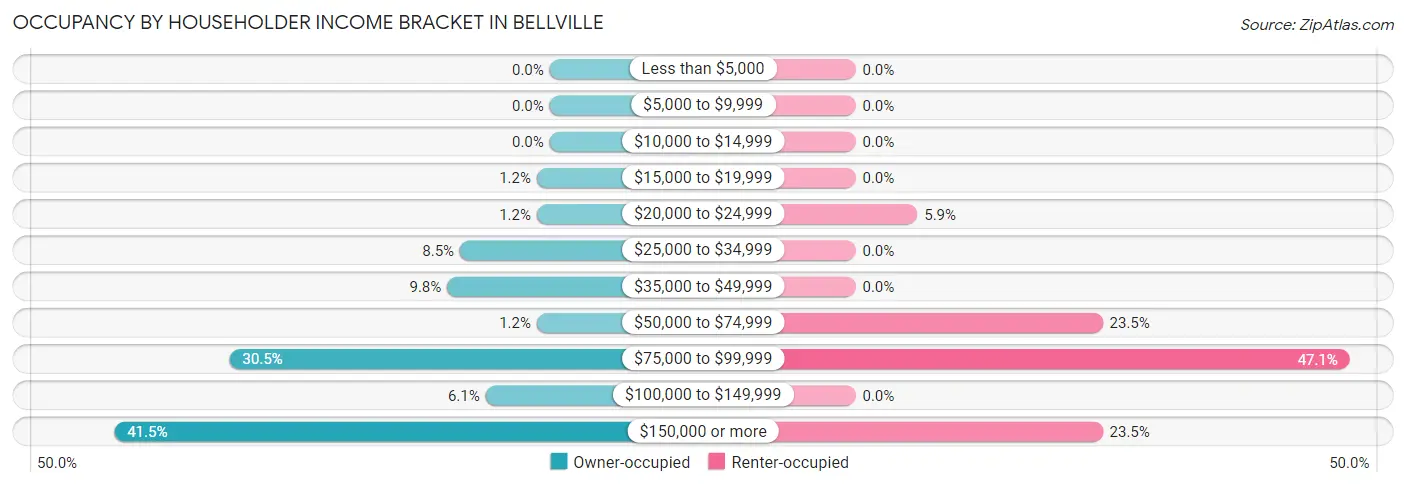
| Income Bracket | Owner-occupied | Renter-occupied |
| Less than $5,000 | 0 (0.0%) | 0 (0.0%) |
| $5,000 to $9,999 | 0 (0.0%) | 0 (0.0%) |
| $10,000 to $14,999 | 0 (0.0%) | 0 (0.0%) |
| $15,000 to $19,999 | 1 (1.2%) | 0 (0.0%) |
| $20,000 to $24,999 | 1 (1.2%) | 1 (5.9%) |
| $25,000 to $34,999 | 7 (8.5%) | 0 (0.0%) |
| $35,000 to $49,999 | 8 (9.8%) | 0 (0.0%) |
| $50,000 to $74,999 | 1 (1.2%) | 4 (23.5%) |
| $75,000 to $99,999 | 25 (30.5%) | 8 (47.1%) |
| $100,000 to $149,999 | 5 (6.1%) | 0 (0.0%) |
| $150,000 or more | 34 (41.5%) | 4 (23.5%) |
| Total | 82 (100.0%) | 17 (100.0%) |
Monthly Housing Cost Tiers in Bellville
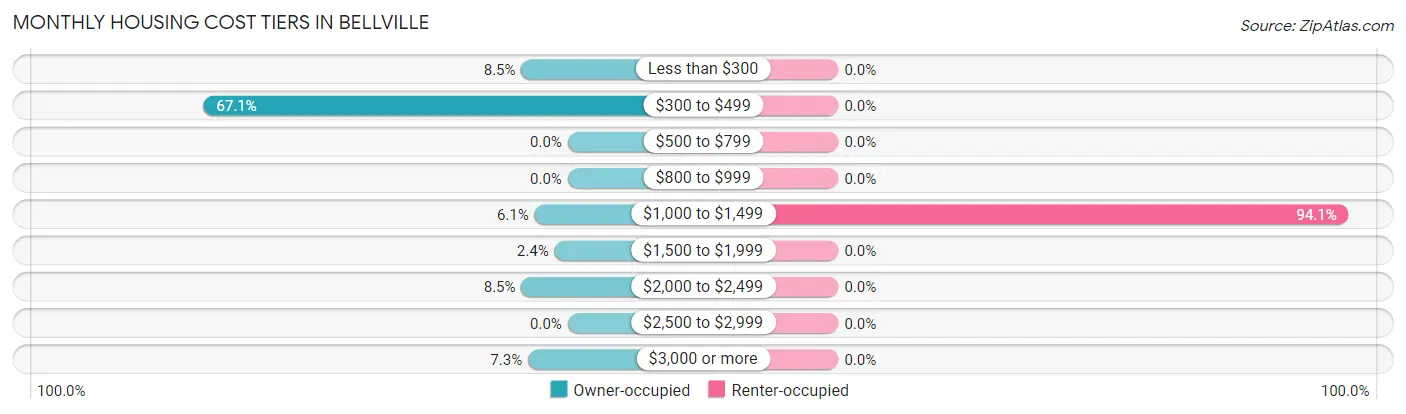
| Monthly Cost | Owner-occupied | Renter-occupied |
| Less than $300 | 7 (8.5%) | 0 (0.0%) |
| $300 to $499 | 55 (67.1%) | 0 (0.0%) |
| $500 to $799 | 0 (0.0%) | 0 (0.0%) |
| $800 to $999 | 0 (0.0%) | 0 (0.0%) |
| $1,000 to $1,499 | 5 (6.1%) | 16 (94.1%) |
| $1,500 to $1,999 | 2 (2.4%) | 0 (0.0%) |
| $2,000 to $2,499 | 7 (8.5%) | 0 (0.0%) |
| $2,500 to $2,999 | 0 (0.0%) | 0 (0.0%) |
| $3,000 or more | 6 (7.3%) | 0 (0.0%) |
| Total | 82 (100.0%) | 17 (100.0%) |
Physical Housing Characteristics in Bellville
Housing Structures in Bellville
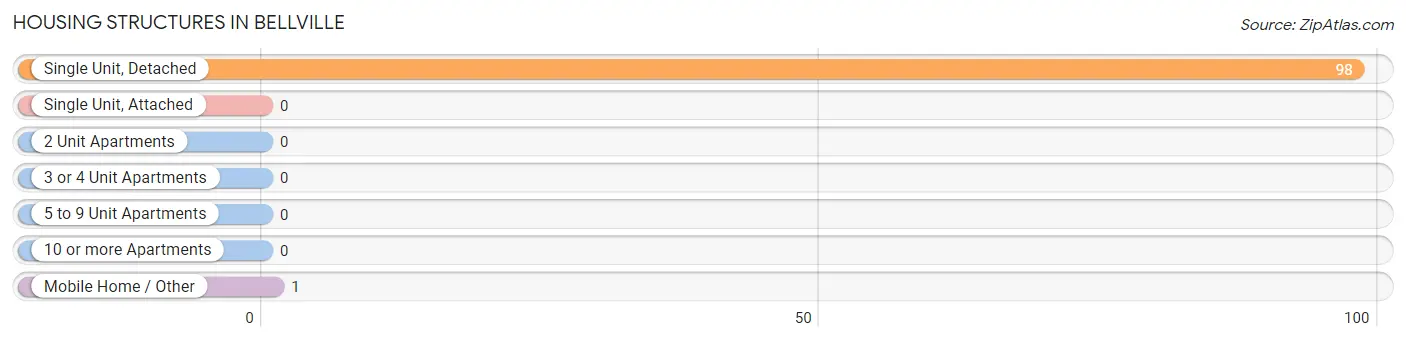
| Structure Type | # Housing Units | % Housing Units |
| Single Unit, Detached | 98 | 99.0% |
| Single Unit, Attached | 0 | 0.0% |
| 2 Unit Apartments | 0 | 0.0% |
| 3 or 4 Unit Apartments | 0 | 0.0% |
| 5 to 9 Unit Apartments | 0 | 0.0% |
| 10 or more Apartments | 0 | 0.0% |
| Mobile Home / Other | 1 | 1.0% |
| Total | 99 | 100.0% |
Housing Structures by Occupancy in Bellville
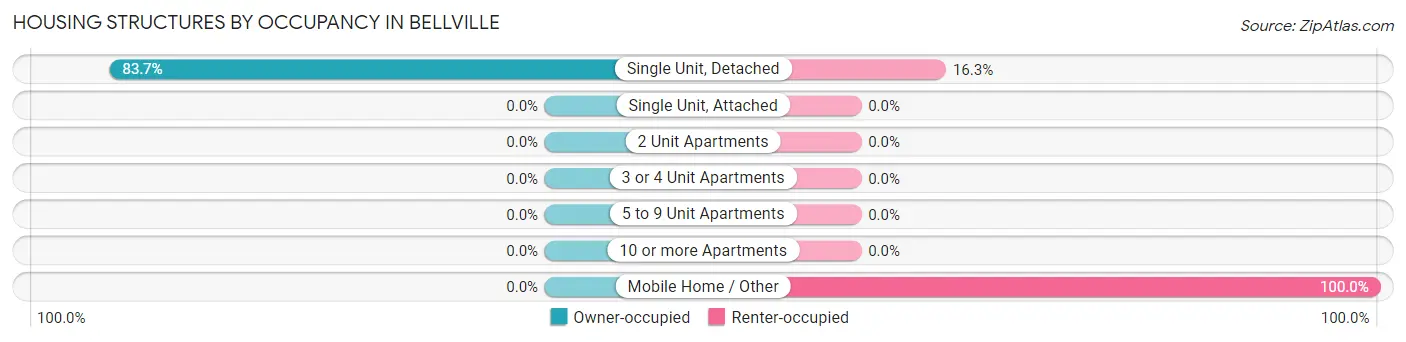
| Structure Type | Owner-occupied | Renter-occupied |
| Single Unit, Detached | 82 (83.7%) | 16 (16.3%) |
| Single Unit, Attached | 0 (0.0%) | 0 (0.0%) |
| 2 Unit Apartments | 0 (0.0%) | 0 (0.0%) |
| 3 or 4 Unit Apartments | 0 (0.0%) | 0 (0.0%) |
| 5 to 9 Unit Apartments | 0 (0.0%) | 0 (0.0%) |
| 10 or more Apartments | 0 (0.0%) | 0 (0.0%) |
| Mobile Home / Other | 0 (0.0%) | 1 (100.0%) |
| Total | 82 (82.8%) | 17 (17.2%) |
Housing Structures by Number of Rooms in Bellville
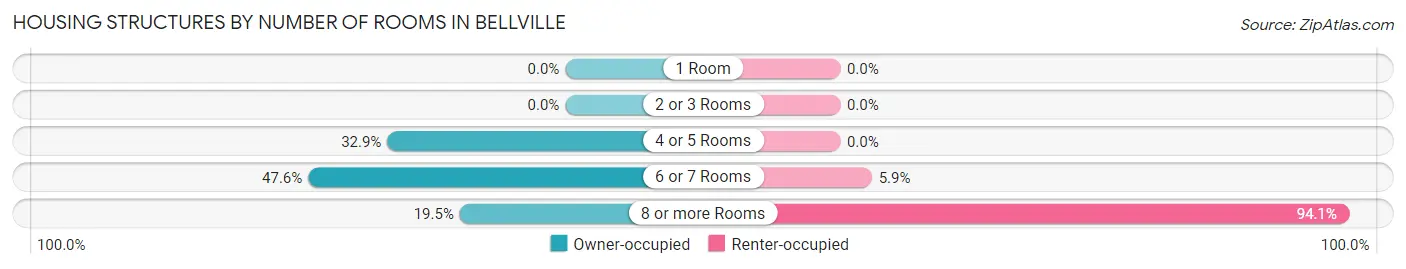
| Number of Rooms | Owner-occupied | Renter-occupied |
| 1 Room | 0 (0.0%) | 0 (0.0%) |
| 2 or 3 Rooms | 0 (0.0%) | 0 (0.0%) |
| 4 or 5 Rooms | 27 (32.9%) | 0 (0.0%) |
| 6 or 7 Rooms | 39 (47.6%) | 1 (5.9%) |
| 8 or more Rooms | 16 (19.5%) | 16 (94.1%) |
| Total | 82 (100.0%) | 17 (100.0%) |
Housing Structure by Heating Type in Bellville
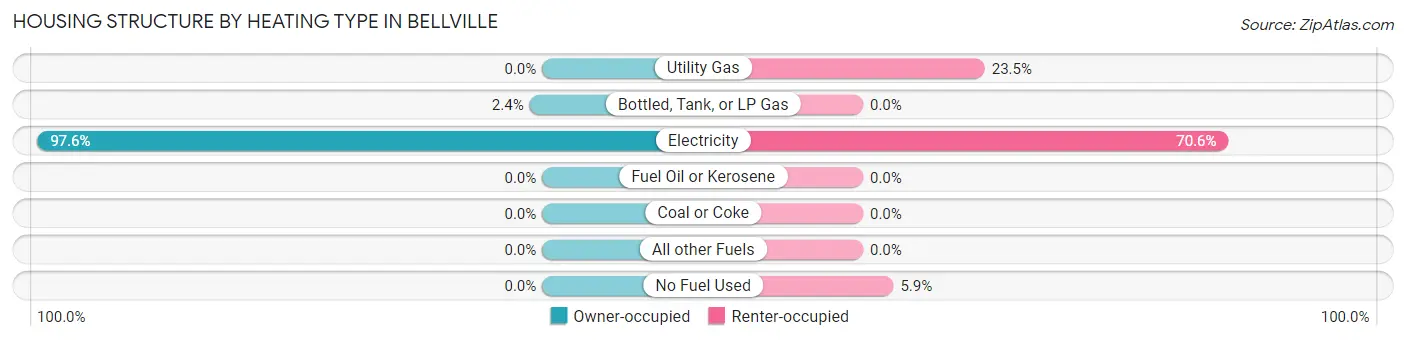
| Heating Type | Owner-occupied | Renter-occupied |
| Utility Gas | 0 (0.0%) | 4 (23.5%) |
| Bottled, Tank, or LP Gas | 2 (2.4%) | 0 (0.0%) |
| Electricity | 80 (97.6%) | 12 (70.6%) |
| Fuel Oil or Kerosene | 0 (0.0%) | 0 (0.0%) |
| Coal or Coke | 0 (0.0%) | 0 (0.0%) |
| All other Fuels | 0 (0.0%) | 0 (0.0%) |
| No Fuel Used | 0 (0.0%) | 1 (5.9%) |
| Total | 82 (100.0%) | 17 (100.0%) |
Household Vehicle Usage in Bellville
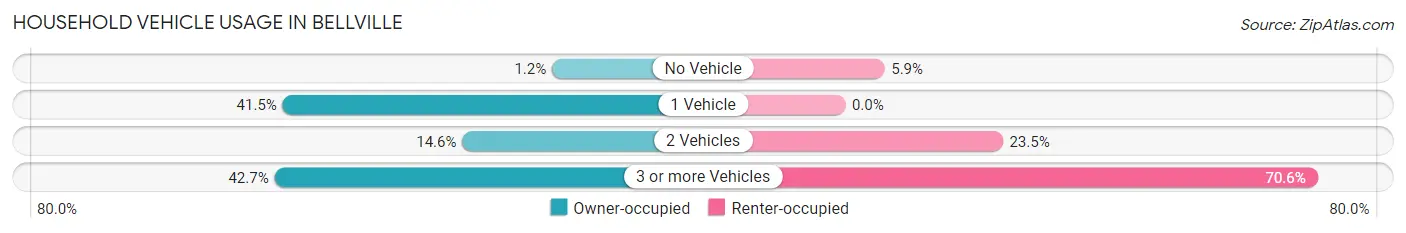
| Vehicles per Household | Owner-occupied | Renter-occupied |
| No Vehicle | 1 (1.2%) | 1 (5.9%) |
| 1 Vehicle | 34 (41.5%) | 0 (0.0%) |
| 2 Vehicles | 12 (14.6%) | 4 (23.5%) |
| 3 or more Vehicles | 35 (42.7%) | 12 (70.6%) |
| Total | 82 (100.0%) | 17 (100.0%) |
Real Estate & Mortgages in Bellville
Real Estate and Mortgage Overview in Bellville
| Characteristic | Without Mortgage | With Mortgage |
| Housing Units | 65 | 17 |
| Median Property Value | $162,500 | $435,700 |
| Median Household Income | $94,050 | $11 |
| Monthly Housing Costs | $391 | $4 |
| Real Estate Taxes | $1,305 | $0 |
Property Value by Mortgage Status in Bellville
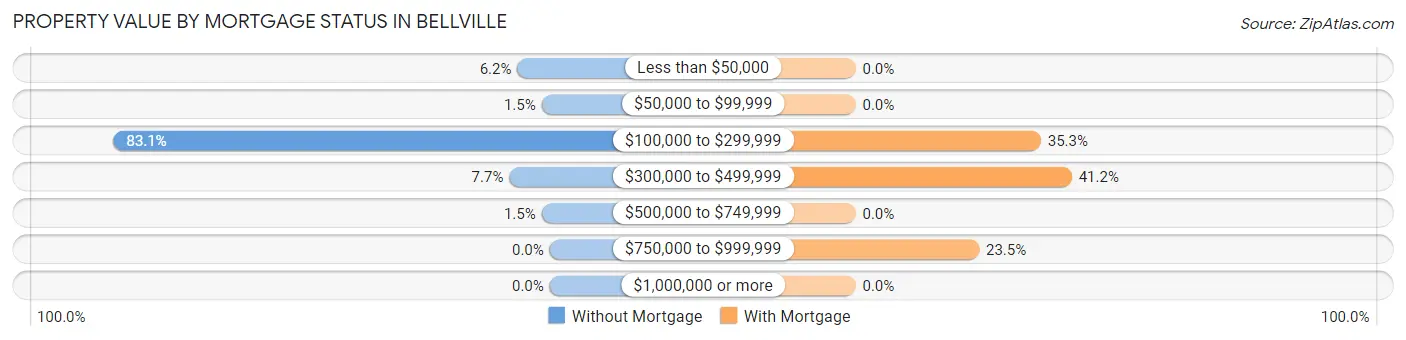
| Property Value | Without Mortgage | With Mortgage |
| Less than $50,000 | 4 (6.1%) | 0 (0.0%) |
| $50,000 to $99,999 | 1 (1.5%) | 0 (0.0%) |
| $100,000 to $299,999 | 54 (83.1%) | 6 (35.3%) |
| $300,000 to $499,999 | 5 (7.7%) | 7 (41.2%) |
| $500,000 to $749,999 | 1 (1.5%) | 0 (0.0%) |
| $750,000 to $999,999 | 0 (0.0%) | 4 (23.5%) |
| $1,000,000 or more | 0 (0.0%) | 0 (0.0%) |
| Total | 65 (100.0%) | 17 (100.0%) |
Household Income by Mortgage Status in Bellville
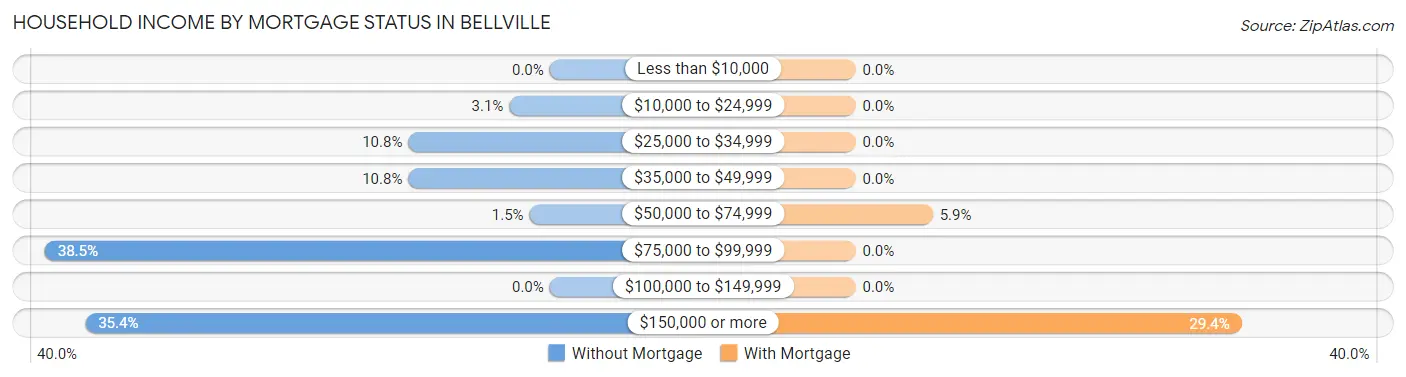
| Household Income | Without Mortgage | With Mortgage |
| Less than $10,000 | 0 (0.0%) | 0 (0.0%) |
| $10,000 to $24,999 | 2 (3.1%) | 0 (0.0%) |
| $25,000 to $34,999 | 7 (10.8%) | 0 (0.0%) |
| $35,000 to $49,999 | 7 (10.8%) | 0 (0.0%) |
| $50,000 to $74,999 | 1 (1.5%) | 1 (5.9%) |
| $75,000 to $99,999 | 25 (38.5%) | 0 (0.0%) |
| $100,000 to $149,999 | 0 (0.0%) | 0 (0.0%) |
| $150,000 or more | 23 (35.4%) | 5 (29.4%) |
| Total | 65 (100.0%) | 17 (100.0%) |
Property Value to Household Income Ratio in Bellville
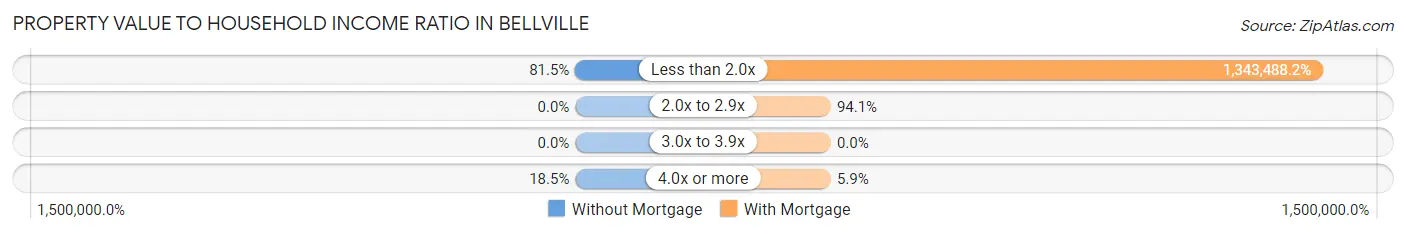
| Value-to-Income Ratio | Without Mortgage | With Mortgage |
| Less than 2.0x | 53 (81.5%) | 228,393 (1,343,488.2%) |
| 2.0x to 2.9x | 0 (0.0%) | 16 (94.1%) |
| 3.0x to 3.9x | 0 (0.0%) | 0 (0.0%) |
| 4.0x or more | 12 (18.5%) | 1 (5.9%) |
| Total | 65 (100.0%) | 17 (100.0%) |
Real Estate Taxes by Mortgage Status in Bellville
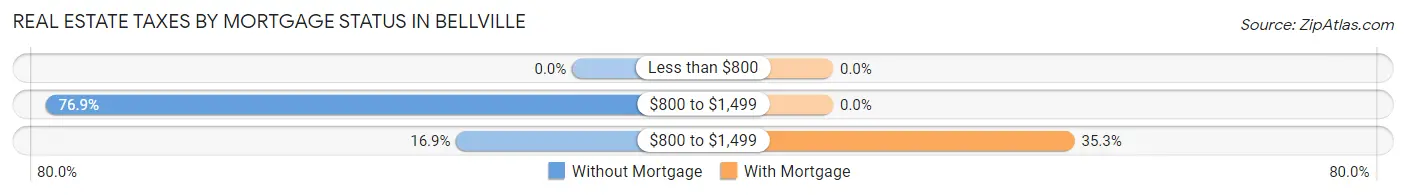
| Property Taxes | Without Mortgage | With Mortgage |
| Less than $800 | 0 (0.0%) | 0 (0.0%) |
| $800 to $1,499 | 50 (76.9%) | 0 (0.0%) |
| $800 to $1,499 | 11 (16.9%) | 6 (35.3%) |
| Total | 65 (100.0%) | 17 (100.0%) |
Health & Disability in Bellville
Health Insurance Coverage by Age in Bellville
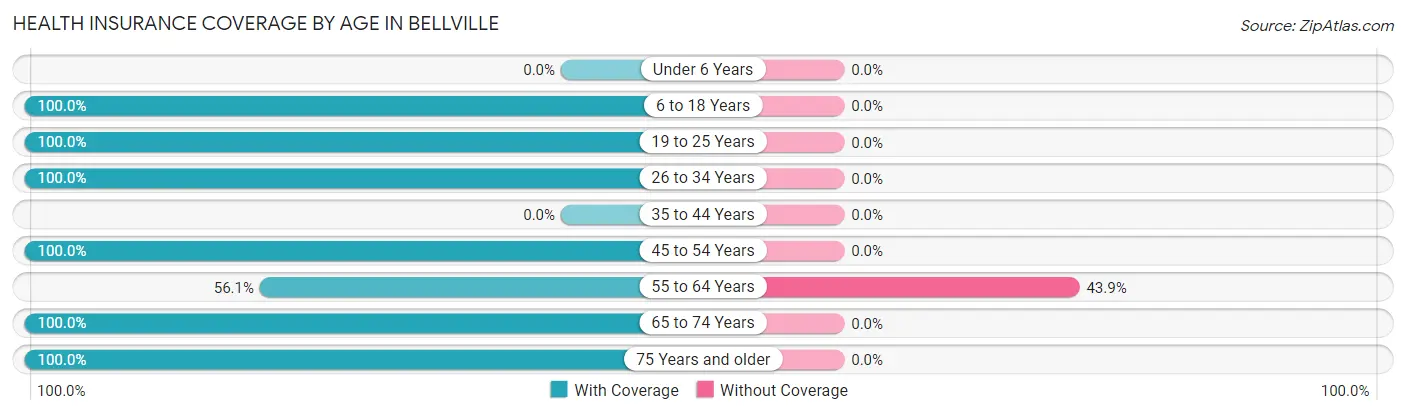
| Age Bracket | With Coverage | Without Coverage |
| Under 6 Years | 0 (0.0%) | 0 (0.0%) |
| 6 to 18 Years | 11 (100.0%) | 0 (0.0%) |
| 19 to 25 Years | 41 (100.0%) | 0 (0.0%) |
| 26 to 34 Years | 1 (100.0%) | 0 (0.0%) |
| 35 to 44 Years | 0 (0.0%) | 0 (0.0%) |
| 45 to 54 Years | 24 (100.0%) | 0 (0.0%) |
| 55 to 64 Years | 32 (56.1%) | 25 (43.9%) |
| 65 to 74 Years | 42 (100.0%) | 0 (0.0%) |
| 75 Years and older | 20 (100.0%) | 0 (0.0%) |
| Total | 171 (87.2%) | 25 (12.8%) |
Health Insurance Coverage by Citizenship Status in Bellville
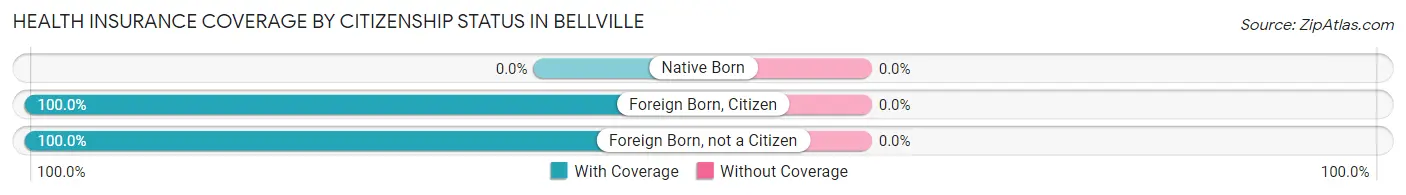
| Citizenship Status | With Coverage | Without Coverage |
| Native Born | 0 (0.0%) | 0 (0.0%) |
| Foreign Born, Citizen | 11 (100.0%) | 0 (0.0%) |
| Foreign Born, not a Citizen | 41 (100.0%) | 0 (0.0%) |
Health Insurance Coverage by Household Income in Bellville
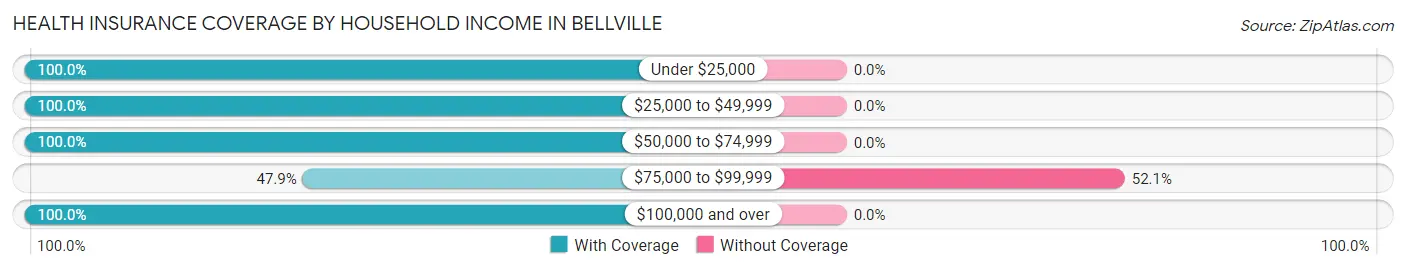
| Household Income | With Coverage | Without Coverage |
| Under $25,000 | 3 (100.0%) | 0 (0.0%) |
| $25,000 to $49,999 | 19 (100.0%) | 0 (0.0%) |
| $50,000 to $74,999 | 14 (100.0%) | 0 (0.0%) |
| $75,000 to $99,999 | 23 (47.9%) | 25 (52.1%) |
| $100,000 and over | 112 (100.0%) | 0 (0.0%) |
Public vs Private Health Insurance Coverage by Age in Bellville
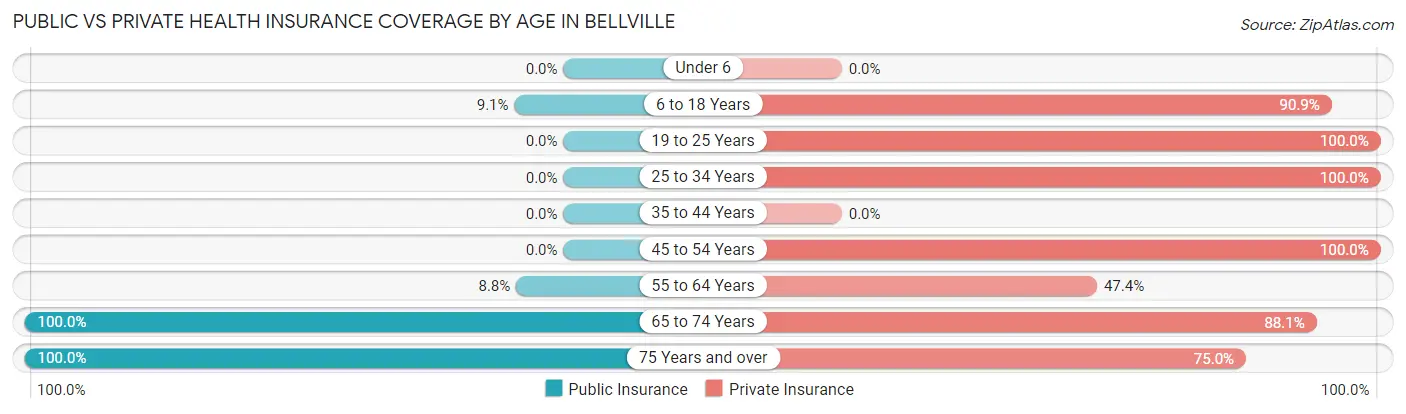
| Age Bracket | Public Insurance | Private Insurance |
| Under 6 | 0 (0.0%) | 0 (0.0%) |
| 6 to 18 Years | 1 (9.1%) | 10 (90.9%) |
| 19 to 25 Years | 0 (0.0%) | 41 (100.0%) |
| 25 to 34 Years | 0 (0.0%) | 1 (100.0%) |
| 35 to 44 Years | 0 (0.0%) | 0 (0.0%) |
| 45 to 54 Years | 0 (0.0%) | 24 (100.0%) |
| 55 to 64 Years | 5 (8.8%) | 27 (47.4%) |
| 65 to 74 Years | 42 (100.0%) | 37 (88.1%) |
| 75 Years and over | 20 (100.0%) | 15 (75.0%) |
| Total | 68 (34.7%) | 155 (79.1%) |
Disability Status by Sex by Age in Bellville
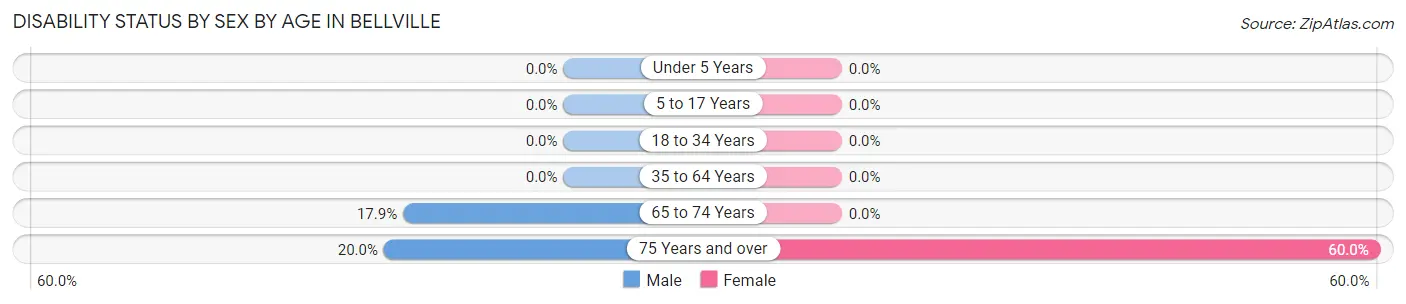
| Age Bracket | Male | Female |
| Under 5 Years | 0 (0.0%) | 0 (0.0%) |
| 5 to 17 Years | 0 (0.0%) | 0 (0.0%) |
| 18 to 34 Years | 0 (0.0%) | 0 (0.0%) |
| 35 to 64 Years | 0 (0.0%) | 0 (0.0%) |
| 65 to 74 Years | 5 (17.9%) | 0 (0.0%) |
| 75 Years and over | 1 (20.0%) | 9 (60.0%) |
Disability Class by Sex by Age in Bellville
Disability Class: Hearing Difficulty
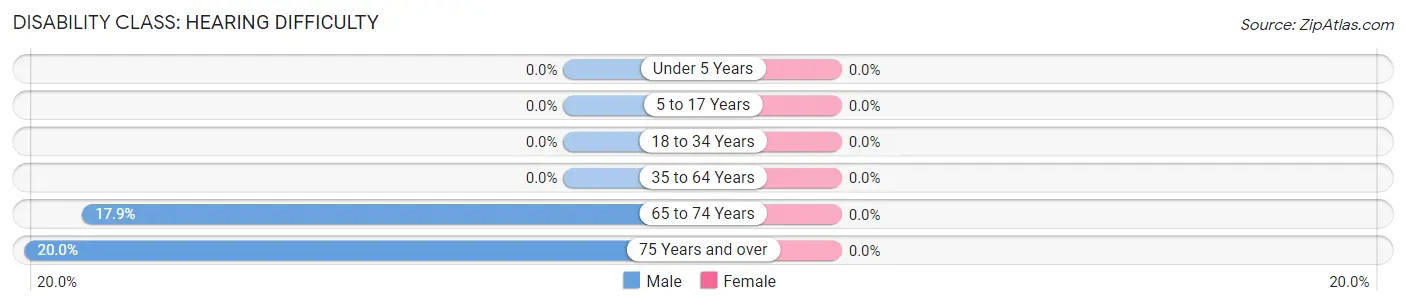
| Age Bracket | Male | Female |
| Under 5 Years | 0 (0.0%) | 0 (0.0%) |
| 5 to 17 Years | 0 (0.0%) | 0 (0.0%) |
| 18 to 34 Years | 0 (0.0%) | 0 (0.0%) |
| 35 to 64 Years | 0 (0.0%) | 0 (0.0%) |
| 65 to 74 Years | 5 (17.9%) | 0 (0.0%) |
| 75 Years and over | 1 (20.0%) | 0 (0.0%) |
Disability Class: Vision Difficulty
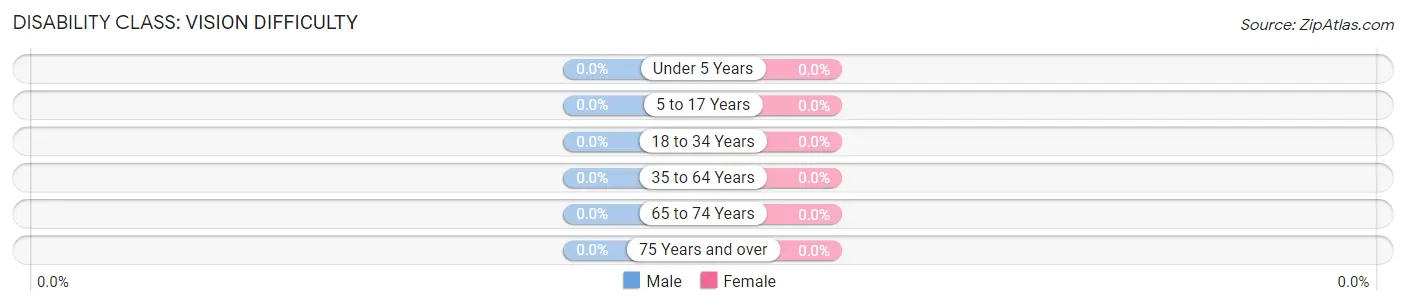
| Age Bracket | Male | Female |
| Under 5 Years | 0 (0.0%) | 0 (0.0%) |
| 5 to 17 Years | 0 (0.0%) | 0 (0.0%) |
| 18 to 34 Years | 0 (0.0%) | 0 (0.0%) |
| 35 to 64 Years | 0 (0.0%) | 0 (0.0%) |
| 65 to 74 Years | 0 (0.0%) | 0 (0.0%) |
| 75 Years and over | 0 (0.0%) | 0 (0.0%) |
Disability Class: Cognitive Difficulty
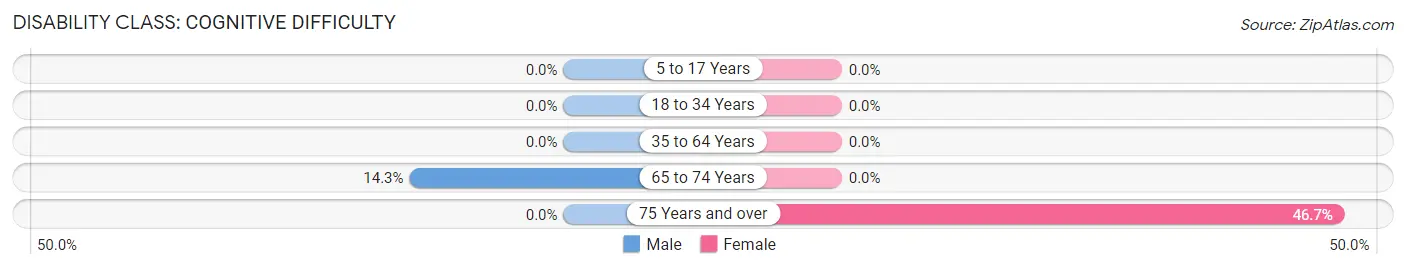
| Age Bracket | Male | Female |
| 5 to 17 Years | 0 (0.0%) | 0 (0.0%) |
| 18 to 34 Years | 0 (0.0%) | 0 (0.0%) |
| 35 to 64 Years | 0 (0.0%) | 0 (0.0%) |
| 65 to 74 Years | 4 (14.3%) | 0 (0.0%) |
| 75 Years and over | 0 (0.0%) | 7 (46.7%) |
Disability Class: Ambulatory Difficulty
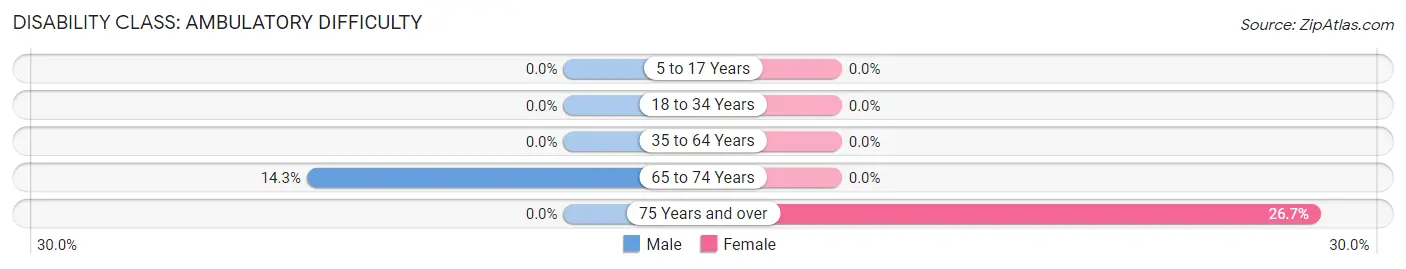
| Age Bracket | Male | Female |
| 5 to 17 Years | 0 (0.0%) | 0 (0.0%) |
| 18 to 34 Years | 0 (0.0%) | 0 (0.0%) |
| 35 to 64 Years | 0 (0.0%) | 0 (0.0%) |
| 65 to 74 Years | 4 (14.3%) | 0 (0.0%) |
| 75 Years and over | 0 (0.0%) | 4 (26.7%) |
Disability Class: Self-Care Difficulty
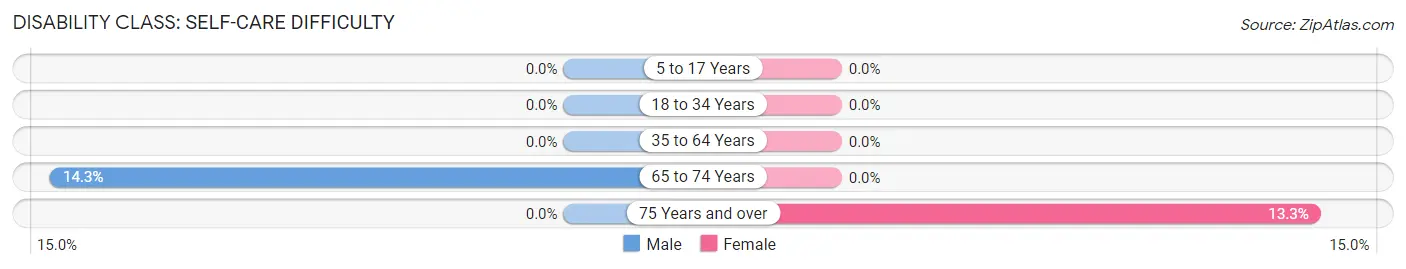
| Age Bracket | Male | Female |
| 5 to 17 Years | 0 (0.0%) | 0 (0.0%) |
| 18 to 34 Years | 0 (0.0%) | 0 (0.0%) |
| 35 to 64 Years | 0 (0.0%) | 0 (0.0%) |
| 65 to 74 Years | 4 (14.3%) | 0 (0.0%) |
| 75 Years and over | 0 (0.0%) | 2 (13.3%) |
Technology Access in Bellville
Computing Device Access in Bellville
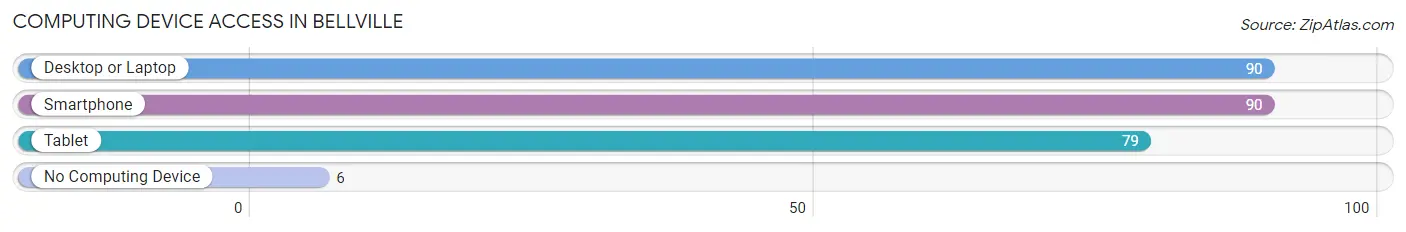
| Device Type | # Households | % Households |
| Desktop or Laptop | 90 | 90.9% |
| Smartphone | 90 | 90.9% |
| Tablet | 79 | 79.8% |
| No Computing Device | 6 | 6.1% |
| Total | 99 | 100.0% |
Internet Access in Bellville
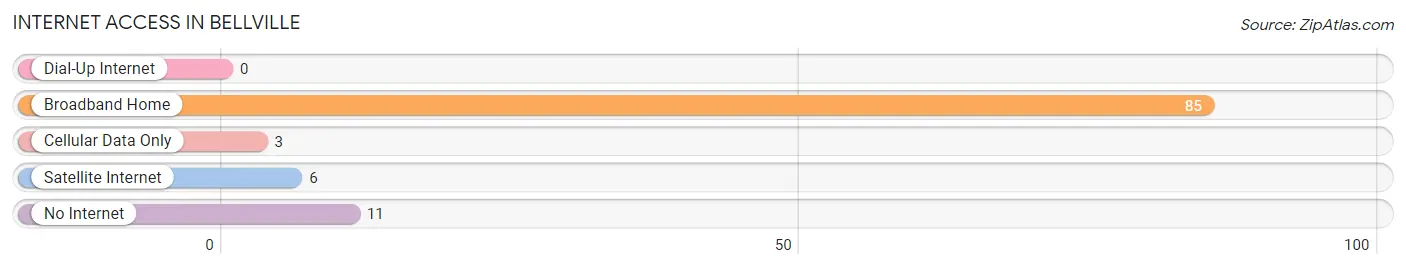
| Internet Type | # Households | % Households |
| Dial-Up Internet | 0 | 0.0% |
| Broadband Home | 85 | 85.9% |
| Cellular Data Only | 3 | 3.0% |
| Satellite Internet | 6 | 6.1% |
| No Internet | 11 | 11.1% |
| Total | 99 | 100.0% |
Bellville Summary
Bellville, Georgia is a small town located in Wilkes County, Georgia. It is situated in the foothills of the Appalachian Mountains and is part of the Central Savannah River Area. The town was founded in 1820 and is the county seat of Wilkes County. The population of Bellville was estimated to be 1,845 in 2019.
History
Bellville was founded in 1820 by a group of settlers from North Carolina. The town was named after the Bell family, who were among the first settlers. The town was originally known as Bellsville, but the name was changed to Bellville in 1821.
The town was an important stop on the stagecoach route between Augusta and Athens. It was also a major trading center for the surrounding area. In 1825, the town was incorporated and a courthouse was built.
In the late 19th century, Bellville was a major center for the production of cotton and tobacco. The town was also home to several mills, including a cotton mill, a woolen mill, and a grist mill.
In the early 20th century, Bellville was a popular tourist destination. The town was home to several resorts, including the Bellville Hotel and the Bellville Inn. The town also had a movie theater and a golf course.
Geography
Bellville is located in Wilkes County, Georgia. It is situated in the foothills of the Appalachian Mountains and is part of the Central Savannah River Area. The town is located at an elevation of 845 feet above sea level.
The town is located near the Ogeechee River, which is a major tributary of the Savannah River. The town is also located near the Oconee National Forest, which is a popular destination for outdoor recreation.
Economy
The economy of Bellville is largely based on agriculture and tourism. The town is home to several farms, which produce a variety of crops, including cotton, tobacco, corn, and soybeans. The town is also home to several wineries, which produce a variety of wines.
The town is also home to several businesses, including restaurants, retail stores, and a movie theater. The town is also home to several manufacturing companies, which produce a variety of products, including furniture, clothing, and automotive parts.
Demographics
The population of Bellville was estimated to be 1,845 in 2019. The town has a median age of 39.7 years, with a gender ratio of 49.3% male and 50.7% female. The town has a population of African Americans, making up 28.3% of the population. The town also has a population of Hispanics, making up 4.3% of the population.
Conclusion
Bellville, Georgia is a small town located in Wilkes County, Georgia. It is situated in the foothills of the Appalachian Mountains and is part of the Central Savannah River Area. The town was founded in 1820 and is the county seat of Wilkes County. The population of Bellville was estimated to be 1,845 in 2019. The economy of Bellville is largely based on agriculture and tourism. The town is home to several farms, businesses, and manufacturing companies. The town has a population of African Americans and Hispanics, making up 28.3% and 4.3% of the population, respectively.
Common Questions
What is Per Capita Income in Bellville?
Per Capita income in Bellville is $73,364.
What is the Median Family Income in Bellville?
Median Family Income in Bellville is $198,512.
What is the Median Household income in Bellville?
Median Household Income in Bellville is $94,350.
What is Income or Wage Gap in Bellville?
Income or Wage Gap in Bellville is 49.0%.
Women in Bellville earn 51.0 cents for every dollar earned by a man.
What is Inequality or Gini Index in Bellville?
Inequality or Gini Index in Bellville is 0.40.
What is the Total Population of Bellville?
Total Population of Bellville is 196.
What is the Total Male Population of Bellville?
Total Male Population of Bellville is 78.
What is the Total Female Population of Bellville?
Total Female Population of Bellville is 118.
What is the Ratio of Males per 100 Females in Bellville?
There are 66.10 Males per 100 Females in Bellville.
What is the Ratio of Females per 100 Males in Bellville?
There are 151.28 Females per 100 Males in Bellville.
What is the Median Population Age in Bellville?
Median Population Age in Bellville is 55.8 Years.
What is the Average Family Size in Bellville
Average Family Size in Bellville is 2.6 People.
What is the Average Household Size in Bellville
Average Household Size in Bellville is 2.0 People.
How Large is the Labor Force in Bellville?
There are 102 People in the Labor Forcein in Bellville.
What is the Percentage of People in the Labor Force in Bellville?
52.3% of People are in the Labor Force in Bellville.