Americus, GA Map & Demographics
Americus Map
Americus Overview
$20,626
PER CAPITA INCOME
$56,059
AVG FAMILY INCOME
$36,498
AVG HOUSEHOLD INCOME
15.4%
WAGE / INCOME GAP [ % ]
84.6¢/ $1
WAGE / INCOME GAP [ $ ]
$10,553
FAMILY INCOME DEFICIT
0.46
INEQUALITY / GINI INDEX
16,020
TOTAL POPULATION
7,211
MALE POPULATION
8,809
FEMALE POPULATION
81.86
MALES / 100 FEMALES
122.16
FEMALES / 100 MALES
29.4
MEDIAN AGE
3.6
AVG FAMILY SIZE
2.5
AVG HOUSEHOLD SIZE
7,443
LABOR FORCE [ PEOPLE ]
60.5%
PERCENT IN LABOR FORCE
6.8%
UNEMPLOYMENT RATE
Americus Area Codes
Income in Americus
Income Overview in Americus
Per Capita Income in Americus is $20,626, while median incomes of families and households are $56,059 and $36,498 respectively.
| Characteristic | Number | Measure |
| Per Capita Income | 16,020 | $20,626 |
| Median Family Income | 3,014 | $56,059 |
| Mean Family Income | 3,014 | $64,949 |
| Median Household Income | 5,880 | $36,498 |
| Mean Household Income | 5,880 | $50,486 |
| Income Deficit | 3,014 | $10,553 |
| Wage / Income Gap (%) | 16,020 | 15.44% |
| Wage / Income Gap ($) | 16,020 | 84.56¢ per $1 |
| Gini / Inequality Index | 16,020 | 0.46 |
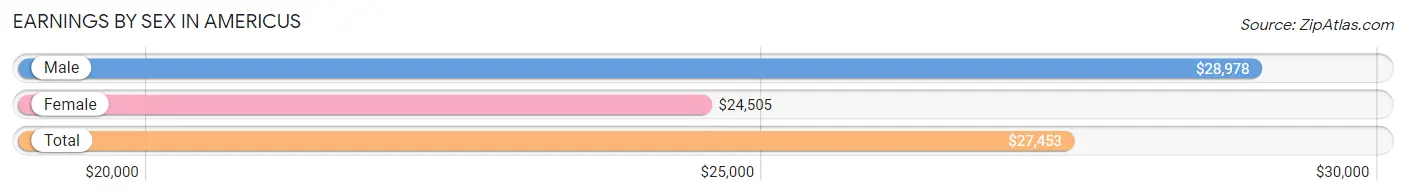
Earnings by Sex in Americus
Average Earnings in Americus are $27,453, $28,978 for men and $24,505 for women, a difference of 15.4%.
| Sex | Number | Average Earnings |
| Male | 3,726 (48.8%) | $28,978 |
| Female | 3,910 (51.2%) | $24,505 |
| Total | 7,636 (100.0%) | $27,453 |
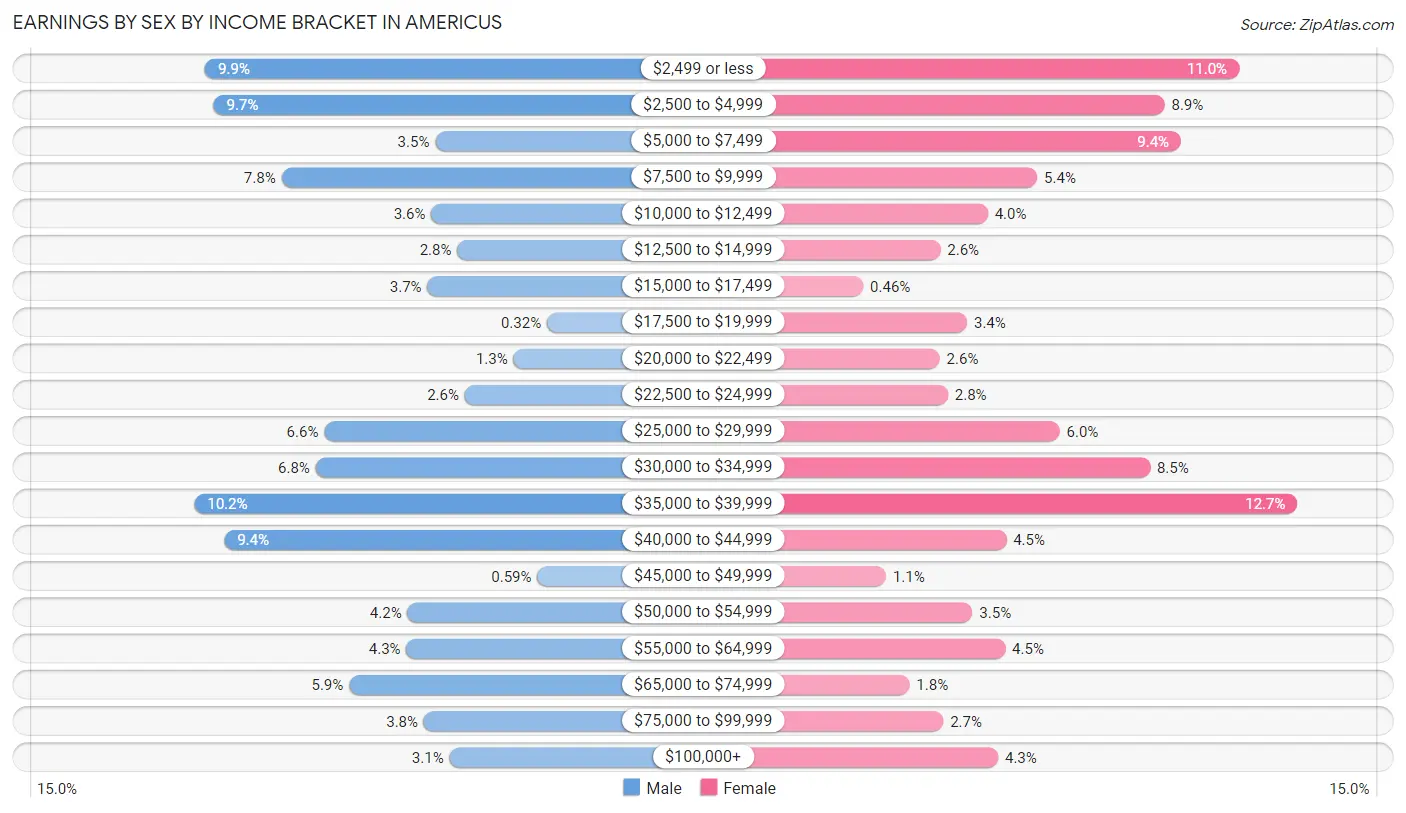
Earnings by Sex by Income Bracket in Americus
The most common earnings brackets in Americus are $35,000 to $39,999 for men (381 | 10.2%) and $35,000 to $39,999 for women (495 | 12.7%).
| Income | Male | Female |
| $2,499 or less | 370 (9.9%) | 431 (11.0%) |
| $2,500 to $4,999 | 361 (9.7%) | 349 (8.9%) |
| $5,000 to $7,499 | 129 (3.5%) | 367 (9.4%) |
| $7,500 to $9,999 | 290 (7.8%) | 209 (5.3%) |
| $10,000 to $12,499 | 133 (3.6%) | 155 (4.0%) |
| $12,500 to $14,999 | 106 (2.8%) | 103 (2.6%) |
| $15,000 to $17,499 | 137 (3.7%) | 18 (0.5%) |
| $17,500 to $19,999 | 12 (0.3%) | 132 (3.4%) |
| $20,000 to $22,499 | 47 (1.3%) | 102 (2.6%) |
| $22,500 to $24,999 | 98 (2.6%) | 111 (2.8%) |
| $25,000 to $29,999 | 245 (6.6%) | 234 (6.0%) |
| $30,000 to $34,999 | 254 (6.8%) | 333 (8.5%) |
| $35,000 to $39,999 | 381 (10.2%) | 495 (12.7%) |
| $40,000 to $44,999 | 350 (9.4%) | 175 (4.5%) |
| $45,000 to $49,999 | 22 (0.6%) | 43 (1.1%) |
| $50,000 to $54,999 | 158 (4.2%) | 138 (3.5%) |
| $55,000 to $64,999 | 159 (4.3%) | 174 (4.4%) |
| $65,000 to $74,999 | 219 (5.9%) | 69 (1.8%) |
| $75,000 to $99,999 | 141 (3.8%) | 106 (2.7%) |
| $100,000+ | 114 (3.1%) | 166 (4.3%) |
| Total | 3,726 (100.0%) | 3,910 (100.0%) |
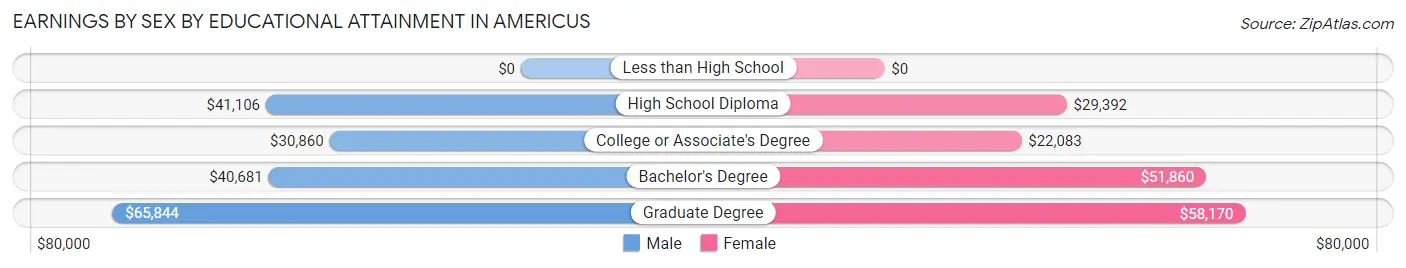
Earnings by Sex by Educational Attainment in Americus
Average earnings in Americus are $36,585 for men and $31,957 for women, a difference of 12.7%. Men with an educational attainment of graduate degree enjoy the highest average annual earnings of $65,844, while those with college or associate's degree education earn the least with $30,860. Women with an educational attainment of graduate degree earn the most with the average annual earnings of $58,170, while those with college or associate's degree education have the smallest earnings of $22,083.
| Educational Attainment | Male Income | Female Income |
| Less than High School | - | - |
| High School Diploma | $41,106 | $29,392 |
| College or Associate's Degree | $30,860 | $22,083 |
| Bachelor's Degree | $40,681 | $51,860 |
| Graduate Degree | $65,844 | $58,170 |
| Total | $36,585 | $31,957 |
Family Income in Americus
Family Income Brackets in Americus
According to the Americus family income data, there are 654 families falling into the $50,000 to $74,999 income range, which is the most common income bracket and makes up 21.7% of all families. Conversely, the $10,000 to $14,999 income bracket is the least frequent group with only 48 families (1.6%) belonging to this category.
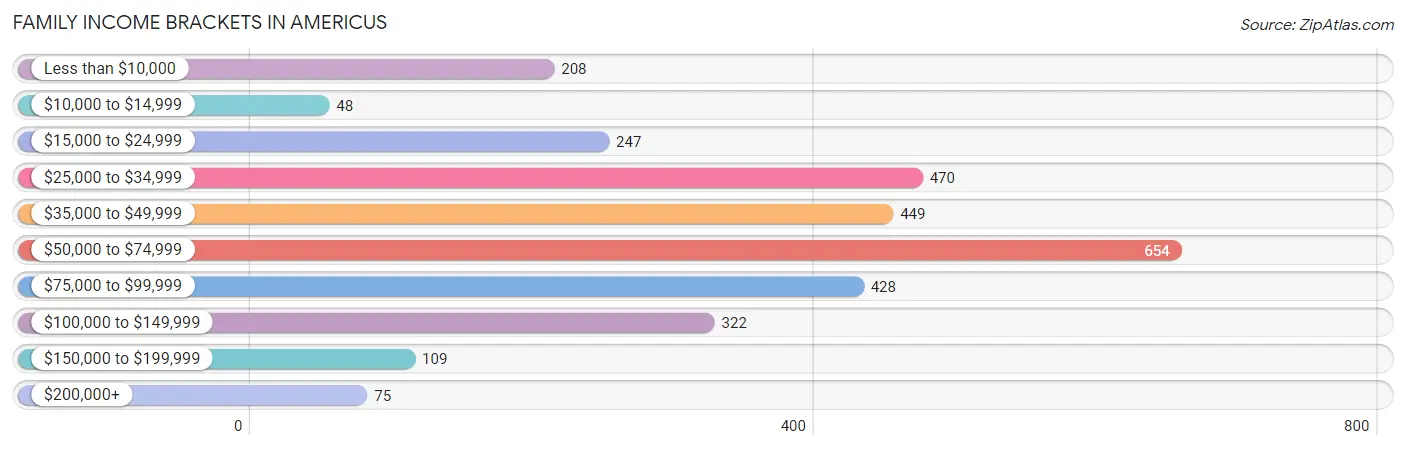
| Income Bracket | # Families | % Families |
| Less than $10,000 | 208 | 6.9% |
| $10,000 to $14,999 | 48 | 1.6% |
| $15,000 to $24,999 | 247 | 8.2% |
| $25,000 to $34,999 | 470 | 15.6% |
| $35,000 to $49,999 | 449 | 14.9% |
| $50,000 to $74,999 | 654 | 21.7% |
| $75,000 to $99,999 | 428 | 14.2% |
| $100,000 to $149,999 | 322 | 10.7% |
| $150,000 to $199,999 | 109 | 3.6% |
| $200,000+ | 75 | 2.5% |
Family Income by Famaliy Size in Americus
7+ person families (93 | 3.1%) account for the highest median family income in Americus with $118,616 per family, while 2-person families (1,534 | 50.9%) have the highest median income of $27,760 per family member.
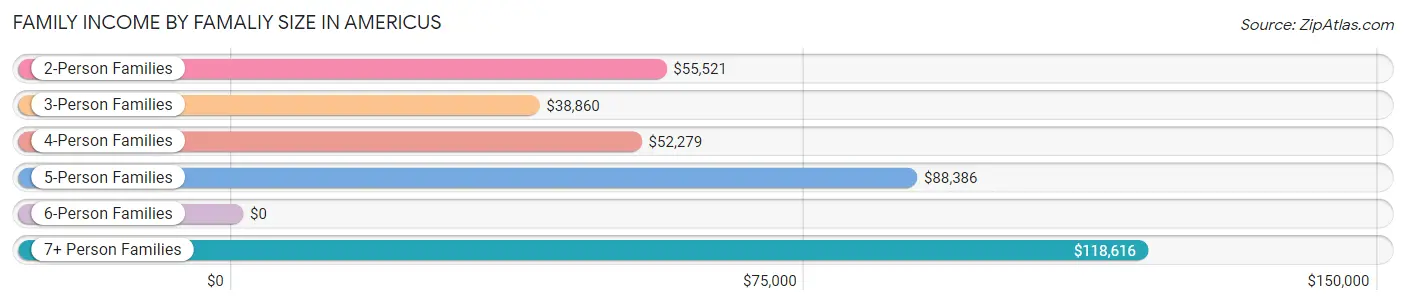
| Income Bracket | # Families | Median Income |
| 2-Person Families | 1,534 (50.9%) | $55,521 |
| 3-Person Families | 804 (26.7%) | $38,860 |
| 4-Person Families | 329 (10.9%) | $52,279 |
| 5-Person Families | 203 (6.7%) | $88,386 |
| 6-Person Families | 51 (1.7%) | $0 |
| 7+ Person Families | 93 (3.1%) | $118,616 |
| Total | 3,014 (100.0%) | $56,059 |
Family Income by Number of Earners in Americus
The median family income in Americus is $56,059, with families comprising 2 earners (917) having the highest median family income of $83,695, while families with no earners (614) have the lowest median family income of $33,605, accounting for 30.4% and 20.4% of families, respectively.
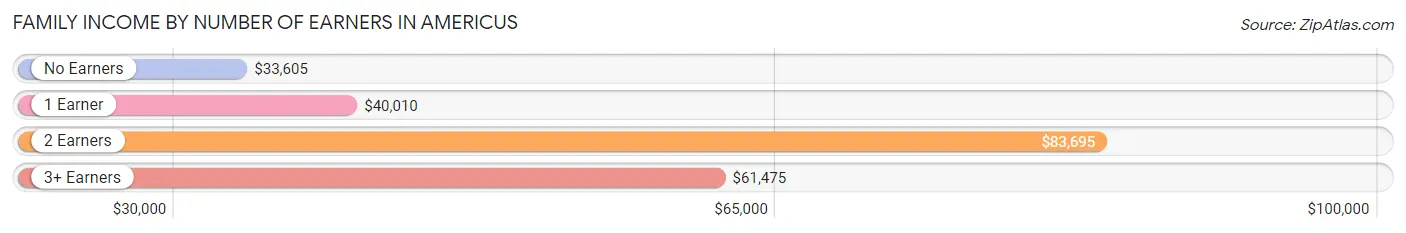
| Number of Earners | # Families | Median Income |
| No Earners | 614 (20.4%) | $33,605 |
| 1 Earner | 1,239 (41.1%) | $40,010 |
| 2 Earners | 917 (30.4%) | $83,695 |
| 3+ Earners | 244 (8.1%) | $61,475 |
| Total | 3,014 (100.0%) | $56,059 |
Household Income in Americus
Household Income Brackets in Americus
With 941 households falling in the category, the $50,000 to $74,999 income range is the most frequent in Americus, accounting for 16.0% of all households. In contrast, only 76 households (1.3%) fall into the $200,000+ income bracket, making it the least populous group.
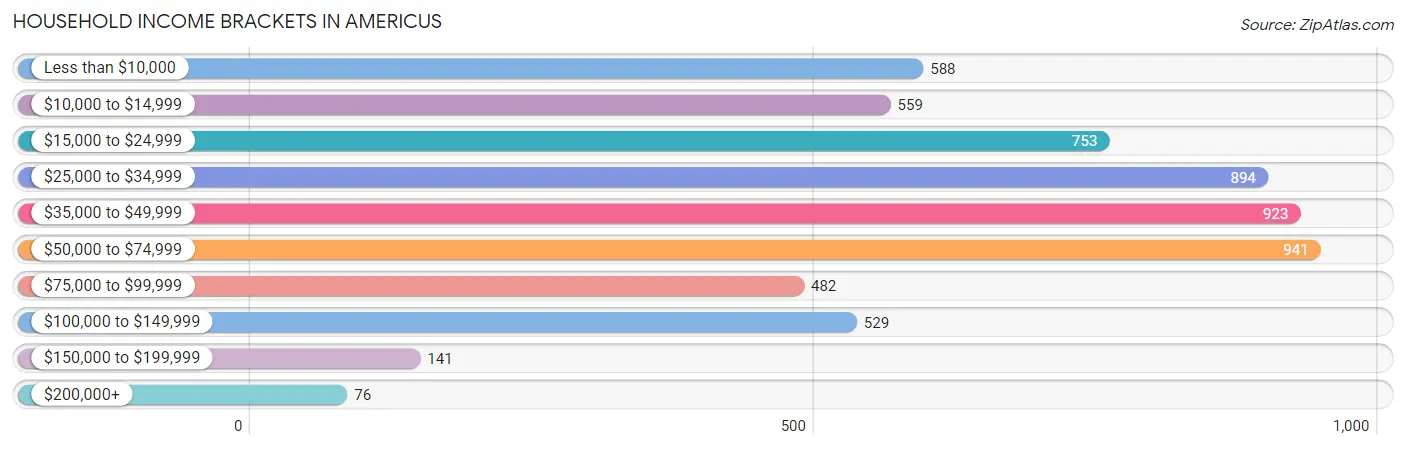
| Income Bracket | # Households | % Households |
| Less than $10,000 | 588 | 10.0% |
| $10,000 to $14,999 | 559 | 9.5% |
| $15,000 to $24,999 | 753 | 12.8% |
| $25,000 to $34,999 | 894 | 15.2% |
| $35,000 to $49,999 | 923 | 15.7% |
| $50,000 to $74,999 | 941 | 16.0% |
| $75,000 to $99,999 | 482 | 8.2% |
| $100,000 to $149,999 | 529 | 9.0% |
| $150,000 to $199,999 | 141 | 2.4% |
| $200,000+ | 76 | 1.3% |
Household Income by Householder Age in Americus
The median household income in Americus is $36,498, with the highest median household income of $40,472 found in the 25 to 44 years age bracket for the primary householder. A total of 2,058 households (35.0%) fall into this category. Meanwhile, the 15 to 24 years age bracket for the primary householder has the lowest median household income of $14,496, with 429 households (7.3%) in this group.
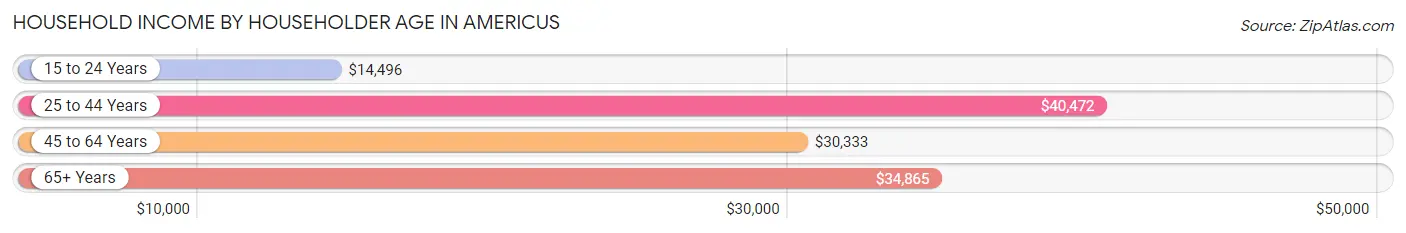
| Income Bracket | # Households | Median Income |
| 15 to 24 Years | 429 (7.3%) | $14,496 |
| 25 to 44 Years | 2,058 (35.0%) | $40,472 |
| 45 to 64 Years | 1,938 (33.0%) | $30,333 |
| 65+ Years | 1,455 (24.7%) | $34,865 |
| Total | 5,880 (100.0%) | $36,498 |
Poverty in Americus
Income Below Poverty by Sex and Age in Americus
With 24.9% poverty level for males and 29.0% for females among the residents of Americus, 5 year old males and 16 and 17 year old females are the most vulnerable to poverty, with 179 males (76.2%) and 17 females (100.0%) in their respective age groups living below the poverty level.
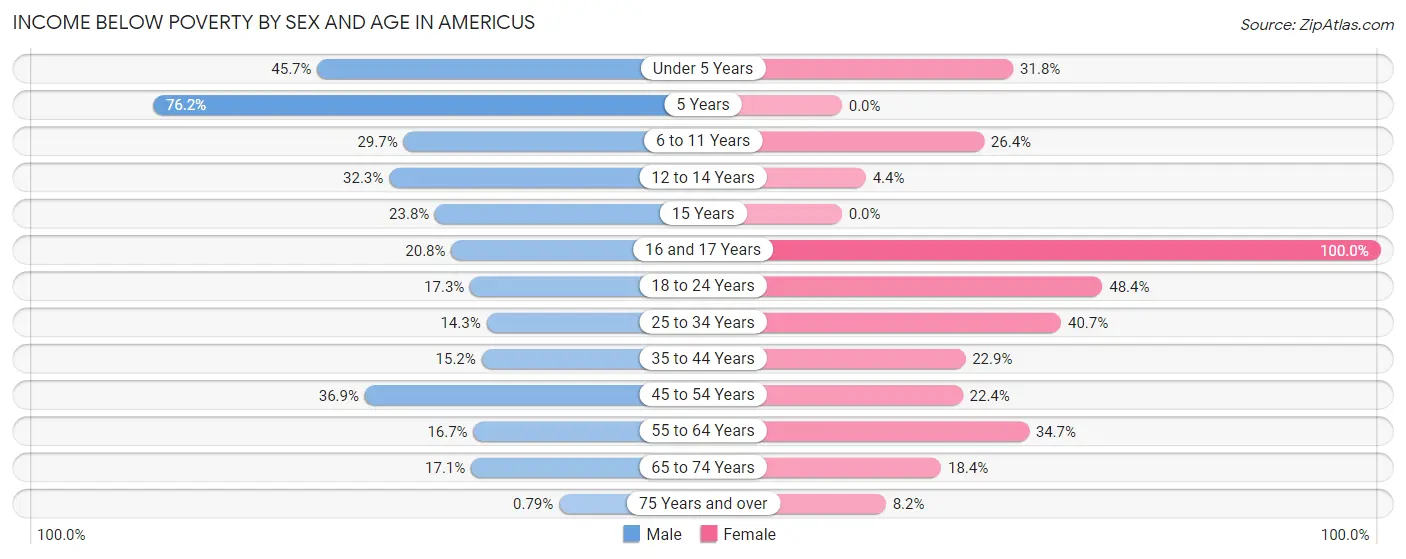
| Age Bracket | Male | Female |
| Under 5 Years | 247 (45.7%) | 202 (31.8%) |
| 5 Years | 179 (76.2%) | 0 (0.0%) |
| 6 to 11 Years | 197 (29.7%) | 177 (26.4%) |
| 12 to 14 Years | 54 (32.3%) | 17 (4.4%) |
| 15 Years | 49 (23.8%) | 0 (0.0%) |
| 16 and 17 Years | 37 (20.8%) | 17 (100.0%) |
| 18 to 24 Years | 119 (17.3%) | 660 (48.3%) |
| 25 to 34 Years | 102 (14.3%) | 538 (40.7%) |
| 35 to 44 Years | 128 (15.2%) | 170 (22.9%) |
| 45 to 54 Years | 360 (36.8%) | 176 (22.4%) |
| 55 to 64 Years | 108 (16.7%) | 244 (34.7%) |
| 65 to 74 Years | 69 (17.1%) | 155 (18.4%) |
| 75 Years and over | 3 (0.8%) | 52 (8.2%) |
| Total | 1,652 (24.9%) | 2,408 (29.0%) |
Income Above Poverty by Sex and Age in Americus
According to the poverty statistics in Americus, males aged 75 years and over and females aged 15 years are the age groups that are most secure financially, with 99.2% of males and 100.0% of females in these age groups living above the poverty line.
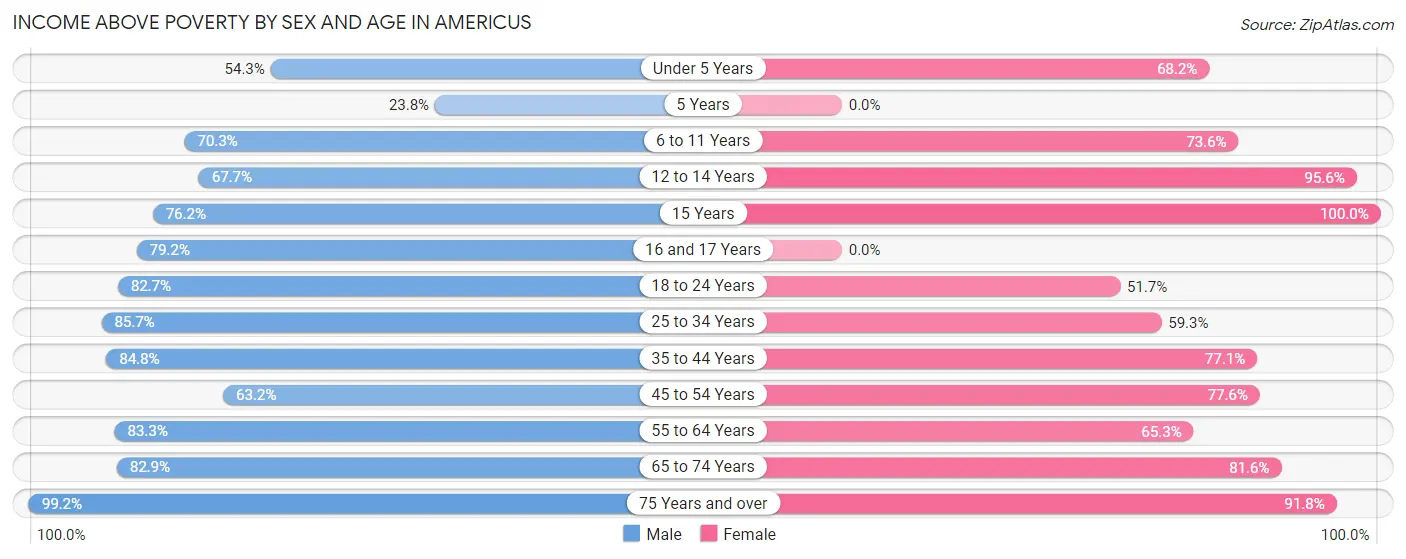
| Age Bracket | Male | Female |
| Under 5 Years | 294 (54.3%) | 433 (68.2%) |
| 5 Years | 56 (23.8%) | 0 (0.0%) |
| 6 to 11 Years | 467 (70.3%) | 494 (73.6%) |
| 12 to 14 Years | 113 (67.7%) | 366 (95.6%) |
| 15 Years | 157 (76.2%) | 214 (100.0%) |
| 16 and 17 Years | 141 (79.2%) | 0 (0.0%) |
| 18 to 24 Years | 569 (82.7%) | 705 (51.6%) |
| 25 to 34 Years | 613 (85.7%) | 784 (59.3%) |
| 35 to 44 Years | 716 (84.8%) | 572 (77.1%) |
| 45 to 54 Years | 617 (63.1%) | 609 (77.6%) |
| 55 to 64 Years | 539 (83.3%) | 459 (65.3%) |
| 65 to 74 Years | 334 (82.9%) | 686 (81.6%) |
| 75 Years and over | 375 (99.2%) | 585 (91.8%) |
| Total | 4,991 (75.1%) | 5,907 (71.0%) |
Income Below Poverty Among Married-Couple Families in Americus
The poverty statistics for married-couple families in Americus show that 4.7% or 71 of the total 1,516 families live below the poverty line. Families with 1 or 2 children have the highest poverty rate of 5.8%, comprising of 25 families. On the other hand, families with 3 or 4 children have the lowest poverty rate of 0.0%, which includes 0 families.
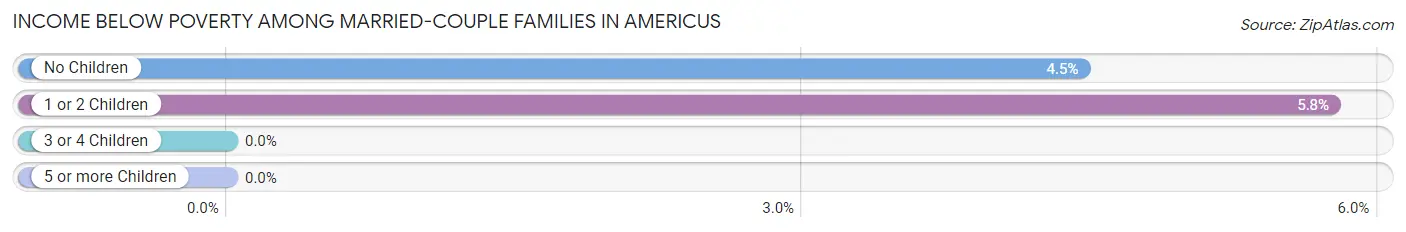
| Children | Above Poverty | Below Poverty |
| No Children | 987 (95.6%) | 46 (4.4%) |
| 1 or 2 Children | 409 (94.2%) | 25 (5.8%) |
| 3 or 4 Children | 42 (100.0%) | 0 (0.0%) |
| 5 or more Children | 7 (100.0%) | 0 (0.0%) |
| Total | 1,445 (95.3%) | 71 (4.7%) |
Income Below Poverty Among Single-Parent Households in Americus
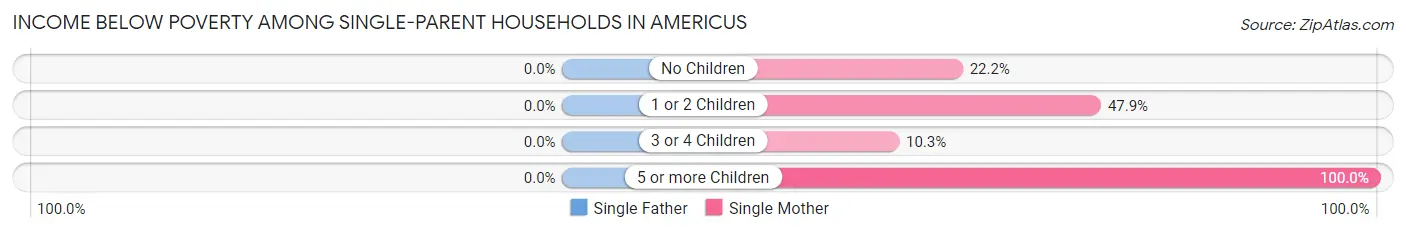
| Children | Single Father | Single Mother |
| No Children | 0 (0.0%) | 94 (22.2%) |
| 1 or 2 Children | 0 (0.0%) | 322 (47.9%) |
| 3 or 4 Children | 0 (0.0%) | 16 (10.3%) |
| 5 or more Children | 0 (0.0%) | 51 (100.0%) |
| Total | 0 (0.0%) | 483 (37.1%) |
Income Below Poverty Among Married-Couple vs Single-Parent Households in Americus
The poverty data for Americus shows that 71 of the married-couple family households (4.7%) and 483 of the single-parent households (32.2%) are living below the poverty level. Within the married-couple family households, those with 1 or 2 children have the highest poverty rate, with 25 households (5.8%) falling below the poverty line. Among the single-parent households, those with 5 or more children have the highest poverty rate, with 51 household (100.0%) living below poverty.
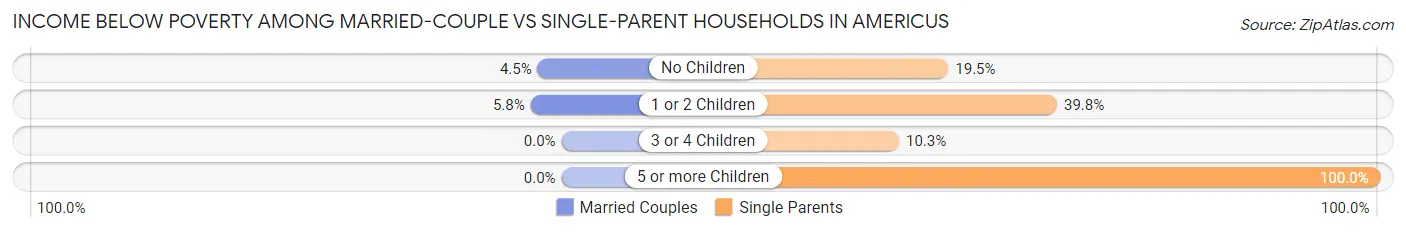
| Children | Married-Couple Families | Single-Parent Households |
| No Children | 46 (4.4%) | 94 (19.5%) |
| 1 or 2 Children | 25 (5.8%) | 322 (39.8%) |
| 3 or 4 Children | 0 (0.0%) | 16 (10.3%) |
| 5 or more Children | 0 (0.0%) | 51 (100.0%) |
| Total | 71 (4.7%) | 483 (32.2%) |
Race in Americus
The most populous races in Americus are Black / African American (9,644 | 60.2%), White / Caucasian (5,325 | 33.2%), and Two or more Races (795 | 5.0%).
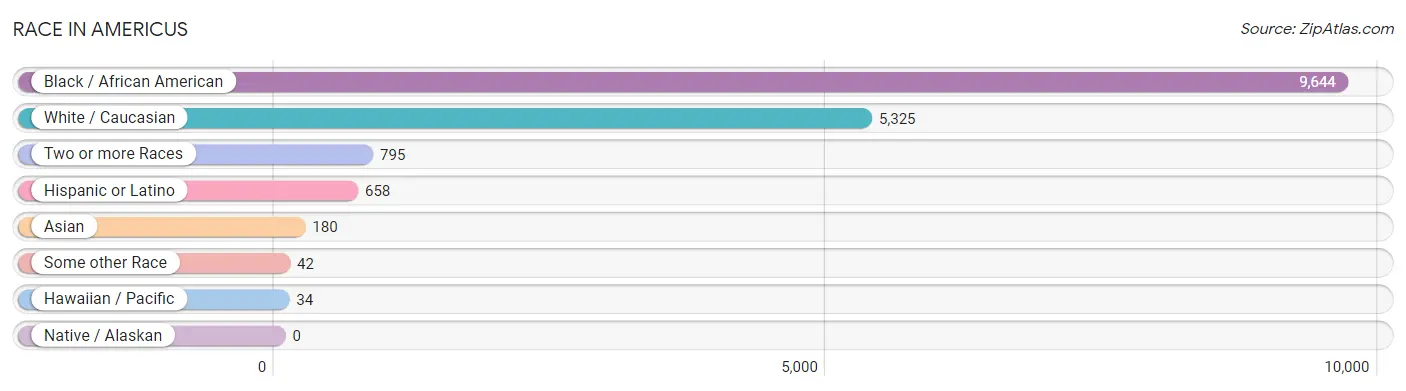
| Race | # Population | % Population |
| Asian | 180 | 1.1% |
| Black / African American | 9,644 | 60.2% |
| Hawaiian / Pacific | 34 | 0.2% |
| Hispanic or Latino | 658 | 4.1% |
| Native / Alaskan | 0 | 0.0% |
| White / Caucasian | 5,325 | 33.2% |
| Two or more Races | 795 | 5.0% |
| Some other Race | 42 | 0.3% |
| Total | 16,020 | 100.0% |
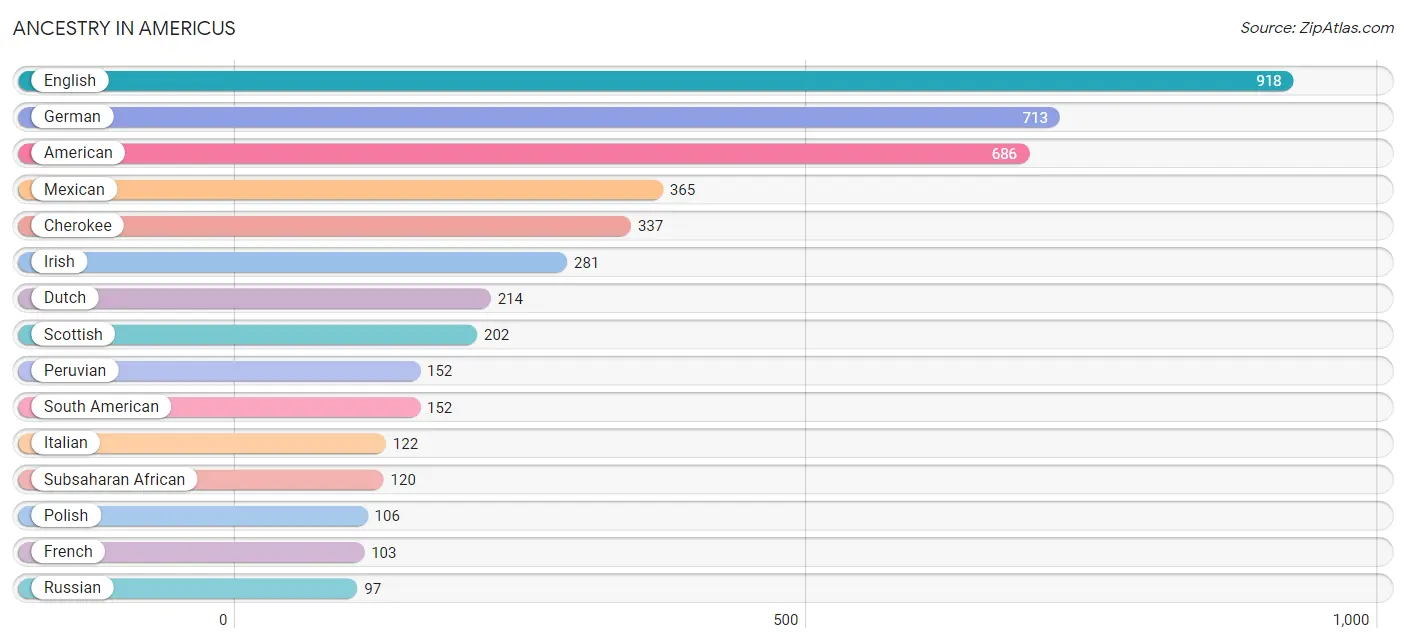
Ancestry in Americus
The most populous ancestries reported in Americus are English (918 | 5.7%), German (713 | 4.4%), American (686 | 4.3%), Mexican (365 | 2.3%), and Cherokee (337 | 2.1%), together accounting for 18.8% of all Americus residents.
| Ancestry | # Population | % Population |
| African | 16 | 0.1% |
| American | 686 | 4.3% |
| Arab | 48 | 0.3% |
| Austrian | 19 | 0.1% |
| Bhutanese | 86 | 0.5% |
| British | 40 | 0.3% |
| Burmese | 29 | 0.2% |
| Central American | 9 | 0.1% |
| Cherokee | 337 | 2.1% |
| Cuban | 75 | 0.5% |
| Czech | 7 | 0.0% |
| Dominican | 10 | 0.1% |
| Dutch | 214 | 1.3% |
| Eastern European | 8 | 0.1% |
| English | 918 | 5.7% |
| European | 61 | 0.4% |
| French | 103 | 0.6% |
| French Canadian | 36 | 0.2% |
| German | 713 | 4.4% |
| Guatemalan | 9 | 0.1% |
| Hungarian | 55 | 0.3% |
| Indian (Asian) | 27 | 0.2% |
| Irish | 281 | 1.8% |
| Italian | 122 | 0.8% |
| Jamaican | 17 | 0.1% |
| Korean | 62 | 0.4% |
| Latvian | 14 | 0.1% |
| Lebanese | 48 | 0.3% |
| Lithuanian | 11 | 0.1% |
| Malaysian | 3 | 0.0% |
| Mexican | 365 | 2.3% |
| Native Hawaiian | 34 | 0.2% |
| Nigerian | 76 | 0.5% |
| Northern European | 5 | 0.0% |
| Norwegian | 13 | 0.1% |
| Peruvian | 152 | 0.9% |
| Polish | 106 | 0.7% |
| Portuguese | 8 | 0.1% |
| Russian | 97 | 0.6% |
| Scandinavian | 32 | 0.2% |
| Scotch-Irish | 26 | 0.2% |
| Scottish | 202 | 1.3% |
| South American | 152 | 0.9% |
| Spaniard | 40 | 0.3% |
| Subsaharan African | 120 | 0.7% |
| Swedish | 7 | 0.0% |
| Thai | 9 | 0.1% |
| Trinidadian and Tobagonian | 6 | 0.0% |
| Welsh | 70 | 0.4% |
| West Indian | 3 | 0.0% | View All 50 Rows |
Immigrants in Americus
The most numerous immigrant groups reported in Americus came from Asia (161 | 1.0%), Eastern Asia (126 | 0.8%), Europe (105 | 0.7%), Western Europe (91 | 0.6%), and Japan (86 | 0.5%), together accounting for 3.6% of all Americus residents.
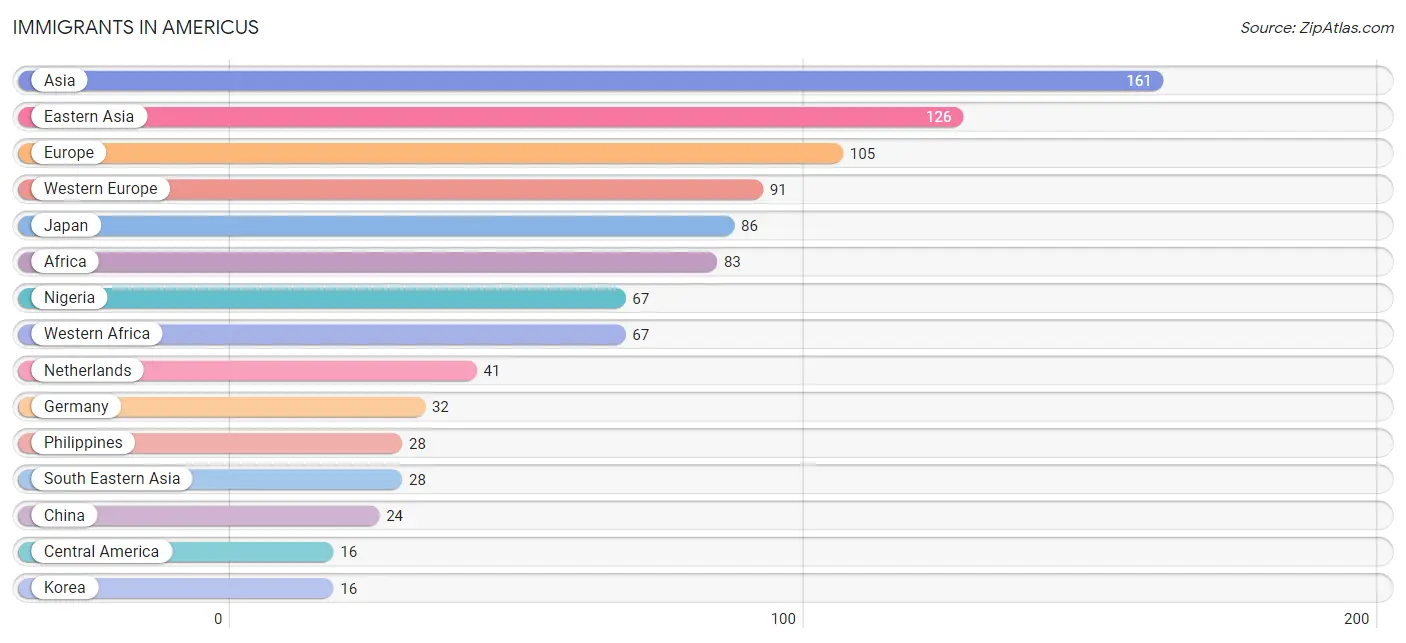
| Immigration Origin | # Population | % Population |
| Africa | 83 | 0.5% |
| Asia | 161 | 1.0% |
| Austria | 15 | 0.1% |
| Canada | 4 | 0.0% |
| Central America | 16 | 0.1% |
| China | 24 | 0.2% |
| Eastern Asia | 126 | 0.8% |
| Eastern Europe | 14 | 0.1% |
| Europe | 105 | 0.7% |
| France | 3 | 0.0% |
| Germany | 32 | 0.2% |
| Guatemala | 9 | 0.1% |
| India | 3 | 0.0% |
| Japan | 86 | 0.5% |
| Korea | 16 | 0.1% |
| Latin America | 16 | 0.1% |
| Latvia | 14 | 0.1% |
| Mexico | 7 | 0.0% |
| Nepal | 4 | 0.0% |
| Netherlands | 41 | 0.3% |
| Nigeria | 67 | 0.4% |
| Philippines | 28 | 0.2% |
| South Central Asia | 7 | 0.0% |
| South Eastern Asia | 28 | 0.2% |
| Western Africa | 67 | 0.4% |
| Western Europe | 91 | 0.6% | View All 26 Rows |
Sex and Age in Americus
Sex and Age in Americus
The most populous age groups in Americus are 15 to 19 Years (794 | 11.0%) for men and 20 to 24 Years (1,112 | 12.6%) for women.
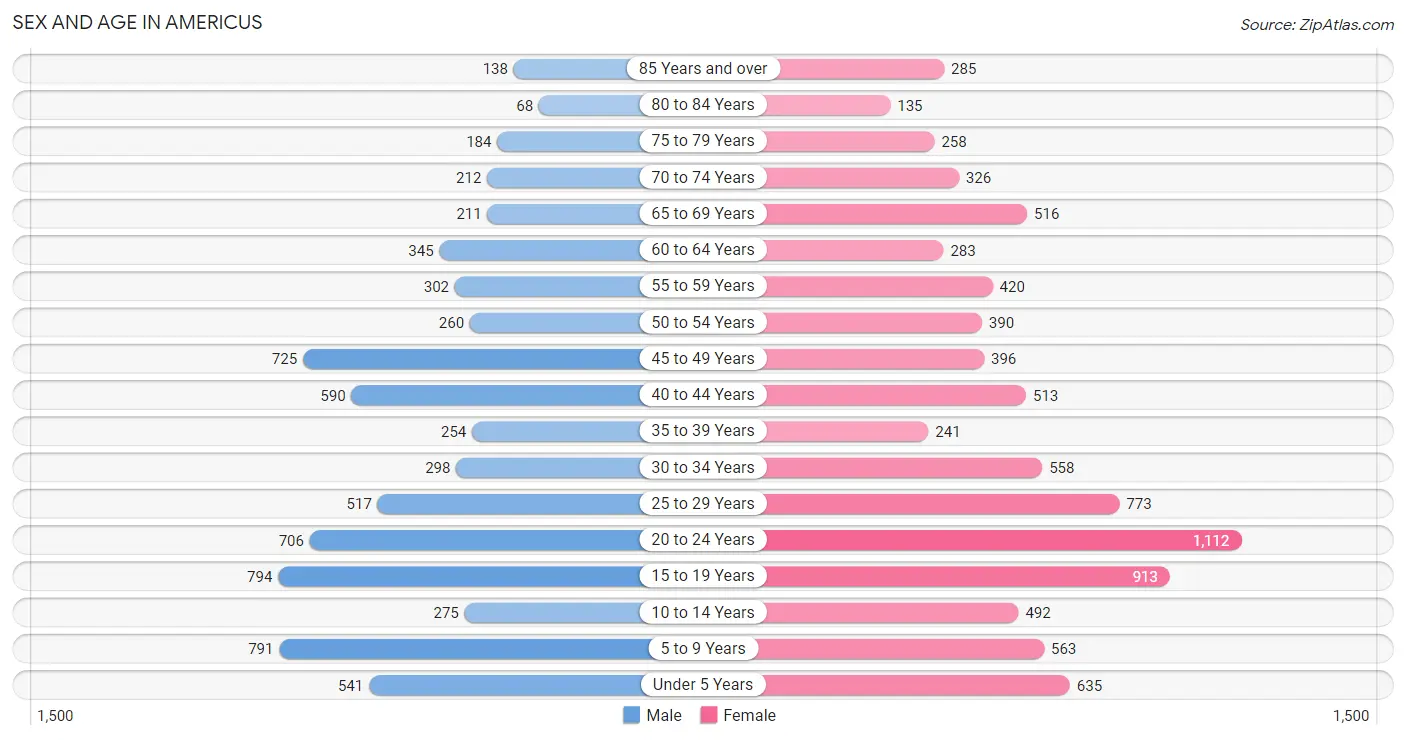
| Age Bracket | Male | Female |
| Under 5 Years | 541 (7.5%) | 635 (7.2%) |
| 5 to 9 Years | 791 (11.0%) | 563 (6.4%) |
| 10 to 14 Years | 275 (3.8%) | 492 (5.6%) |
| 15 to 19 Years | 794 (11.0%) | 913 (10.4%) |
| 20 to 24 Years | 706 (9.8%) | 1,112 (12.6%) |
| 25 to 29 Years | 517 (7.2%) | 773 (8.8%) |
| 30 to 34 Years | 298 (4.1%) | 558 (6.3%) |
| 35 to 39 Years | 254 (3.5%) | 241 (2.7%) |
| 40 to 44 Years | 590 (8.2%) | 513 (5.8%) |
| 45 to 49 Years | 725 (10.1%) | 396 (4.5%) |
| 50 to 54 Years | 260 (3.6%) | 390 (4.4%) |
| 55 to 59 Years | 302 (4.2%) | 420 (4.8%) |
| 60 to 64 Years | 345 (4.8%) | 283 (3.2%) |
| 65 to 69 Years | 211 (2.9%) | 516 (5.9%) |
| 70 to 74 Years | 212 (2.9%) | 326 (3.7%) |
| 75 to 79 Years | 184 (2.5%) | 258 (2.9%) |
| 80 to 84 Years | 68 (0.9%) | 135 (1.5%) |
| 85 Years and over | 138 (1.9%) | 285 (3.2%) |
| Total | 7,211 (100.0%) | 8,809 (100.0%) |
Families and Households in Americus
Median Family Size in Americus
The median family size in Americus is 3.59 persons per family, with single female/mother families (1,302 | 43.2%) accounting for the largest median family size of 4.2 persons per family. On the other hand, single male/father families (196 | 6.5%) represent the smallest median family size with 2.03 persons per family.
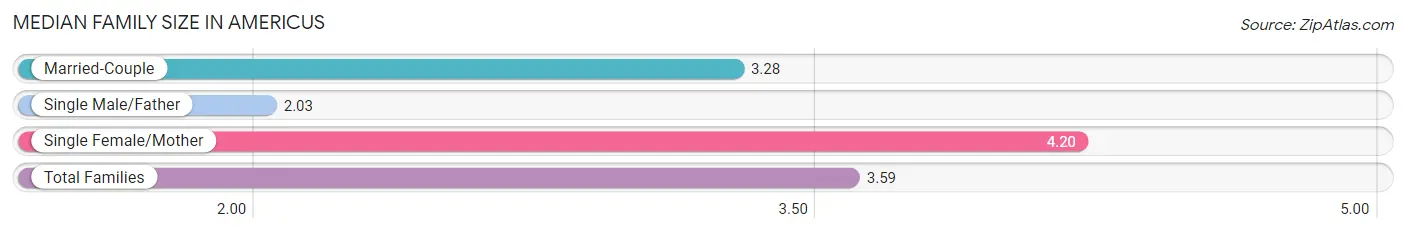
| Family Type | # Families | Family Size |
| Married-Couple | 1,516 (50.3%) | 3.28 |
| Single Male/Father | 196 (6.5%) | 2.03 |
| Single Female/Mother | 1,302 (43.2%) | 4.20 |
| Total Families | 3,014 (100.0%) | 3.59 |
Median Household Size in Americus
The median household size in Americus is 2.53 persons per household, with single female/mother households (1,302 | 22.1%) accounting for the largest median household size of 4.27 persons per household. non-family households (2,866 | 48.7%) represent the smallest median household size with 1.36 persons per household.
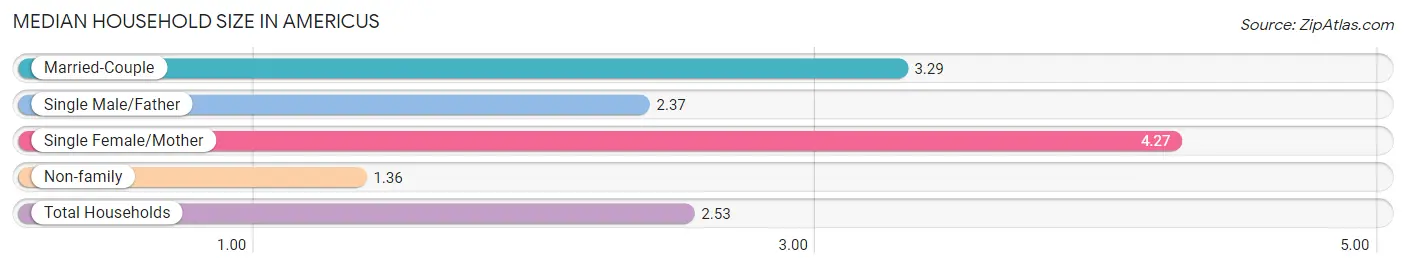
| Household Type | # Households | Household Size |
| Married-Couple | 1,516 (25.8%) | 3.29 |
| Single Male/Father | 196 (3.3%) | 2.37 |
| Single Female/Mother | 1,302 (22.1%) | 4.27 |
| Non-family | 2,866 (48.7%) | 1.36 |
| Total Households | 5,880 (100.0%) | 2.53 |
Household Size by Marriage Status in Americus
Out of a total of 5,880 households in Americus, 3,014 (51.3%) are family households, while 2,866 (48.7%) are nonfamily households. The most numerous type of family households are 2-person households, comprising 1,381, and the most common type of nonfamily households are 1-person households, comprising 2,337.
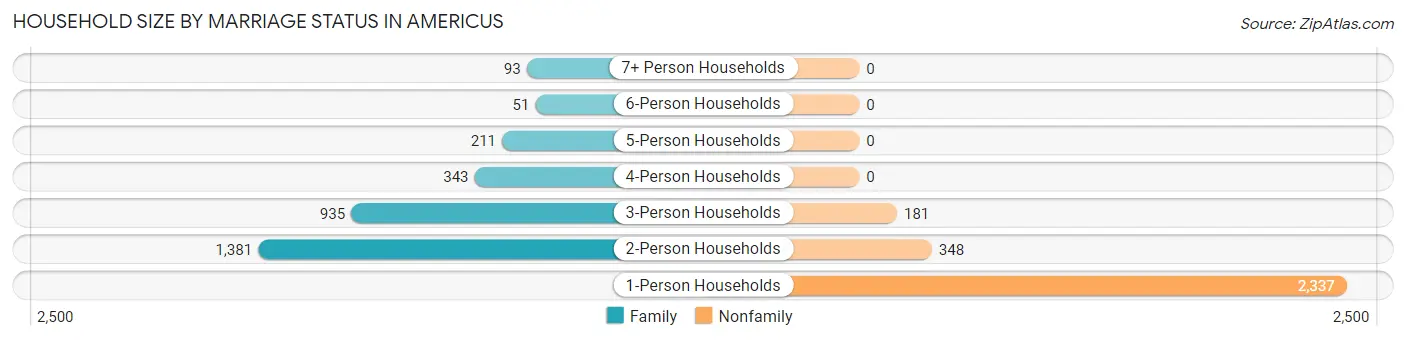
| Household Size | Family Households | Nonfamily Households |
| 1-Person Households | - | 2,337 (39.7%) |
| 2-Person Households | 1,381 (23.5%) | 348 (5.9%) |
| 3-Person Households | 935 (15.9%) | 181 (3.1%) |
| 4-Person Households | 343 (5.8%) | 0 (0.0%) |
| 5-Person Households | 211 (3.6%) | 0 (0.0%) |
| 6-Person Households | 51 (0.9%) | 0 (0.0%) |
| 7+ Person Households | 93 (1.6%) | 0 (0.0%) |
| Total | 3,014 (51.3%) | 2,866 (48.7%) |
Female Fertility in Americus
Fertility by Age in Americus
Average fertility rate in Americus is 49.0 births per 1,000 women. Women in the age bracket of 20 to 34 years have the highest fertility rate with 90.0 births per 1,000 women. Women in the age bracket of 20 to 34 years acount for 100.0% of all women with births.
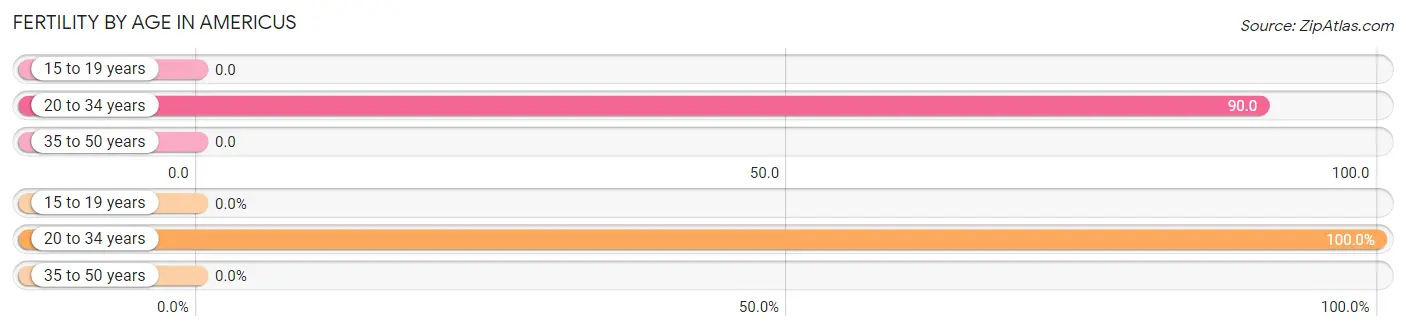
| Age Bracket | Women with Births | Births / 1,000 Women |
| 15 to 19 years | 0 (0.0%) | 0.0 |
| 20 to 34 years | 220 (100.0%) | 90.0 |
| 35 to 50 years | 0 (0.0%) | 0.0 |
| Total | 220 (100.0%) | 49.0 |
Fertility by Age by Marriage Status in Americus
11.8% of women with births (220) in Americus are married. The highest percentage of unmarried women with births falls into 20 to 34 years age bracket with 88.2% of them unmarried at the time of birth, while the lowest percentage of unmarried women with births belong to 20 to 34 years age bracket with 88.2% of them unmarried.
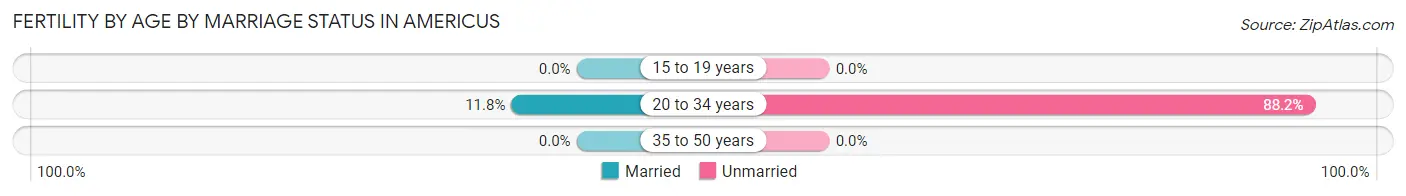
| Age Bracket | Married | Unmarried |
| 15 to 19 years | 0 (0.0%) | 0 (0.0%) |
| 20 to 34 years | 26 (11.8%) | 194 (88.2%) |
| 35 to 50 years | 0 (0.0%) | 0 (0.0%) |
| Total | 26 (11.8%) | 194 (88.2%) |
Fertility by Education in Americus
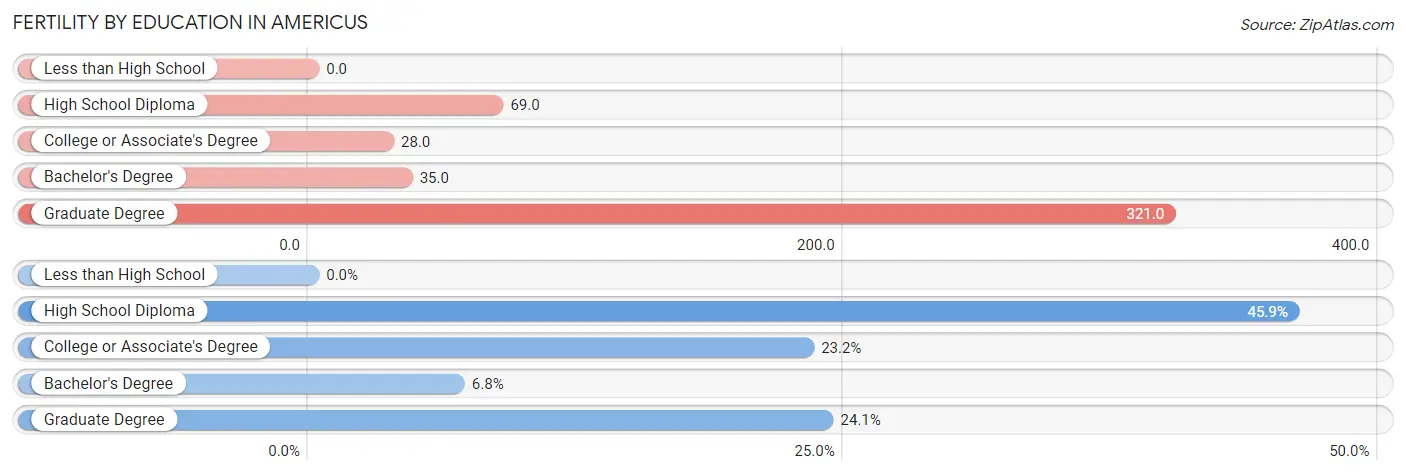
| Educational Attainment | Women with Births | Births / 1,000 Women |
| Less than High School | 0 (0.0%) | 0.0 |
| High School Diploma | 101 (45.9%) | 69.0 |
| College or Associate's Degree | 51 (23.2%) | 28.0 |
| Bachelor's Degree | 15 (6.8%) | 35.0 |
| Graduate Degree | 53 (24.1%) | 321.0 |
| Total | 220 (100.0%) | 49.0 |
Fertility by Education by Marriage Status in Americus
88.2% of women with births in Americus are unmarried. Women with the educational attainment of graduate degree are most likely to be married with 41.5% of them married at childbirth, while women with the educational attainment of high school diploma are least likely to be married with 100.0% of them unmarried at childbirth.
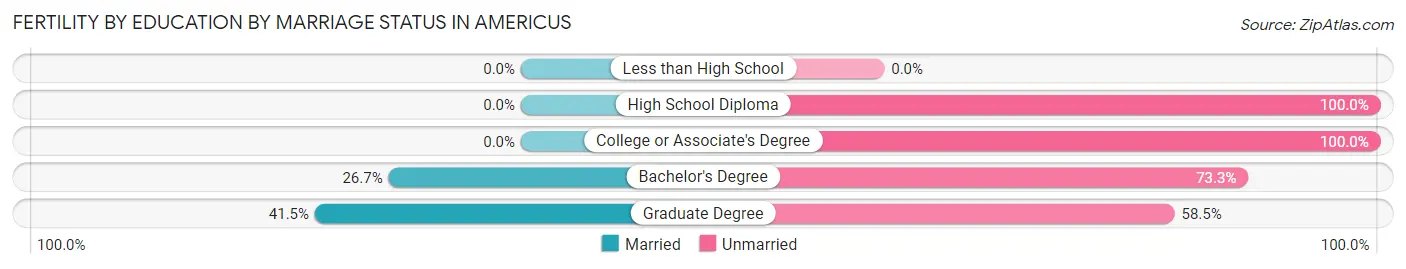
| Educational Attainment | Married | Unmarried |
| Less than High School | 0 (0.0%) | 0 (0.0%) |
| High School Diploma | 0 (0.0%) | 101 (100.0%) |
| College or Associate's Degree | 0 (0.0%) | 51 (100.0%) |
| Bachelor's Degree | 4 (26.7%) | 11 (73.3%) |
| Graduate Degree | 22 (41.5%) | 31 (58.5%) |
| Total | 26 (11.8%) | 194 (88.2%) |
Employment Characteristics in Americus
Employment by Class of Employer in Americus
Among the 6,689 employed individuals in Americus, private company employees (4,660 | 69.7%), state government employees (795 | 11.9%), and not-for-profit organizations (388 | 5.8%) make up the most common classes of employment.
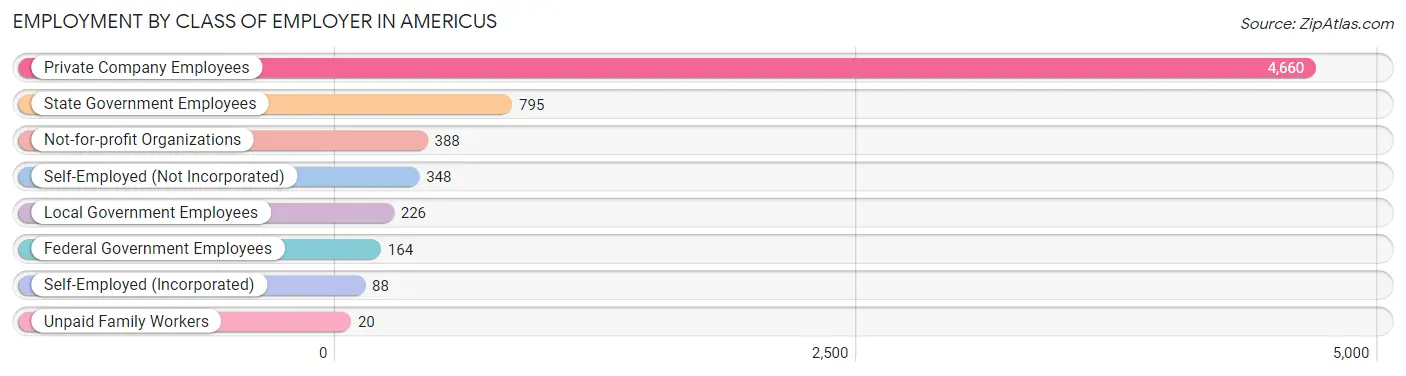
| Employer Class | # Employees | % Employees |
| Private Company Employees | 4,660 | 69.7% |
| Self-Employed (Incorporated) | 88 | 1.3% |
| Self-Employed (Not Incorporated) | 348 | 5.2% |
| Not-for-profit Organizations | 388 | 5.8% |
| Local Government Employees | 226 | 3.4% |
| State Government Employees | 795 | 11.9% |
| Federal Government Employees | 164 | 2.5% |
| Unpaid Family Workers | 20 | 0.3% |
| Total | 6,689 | 100.0% |
Employment Status by Age in Americus
According to the labor force statistics for Americus, out of the total population over 16 years of age (12,302), 60.5% or 7,443 individuals are in the labor force, with 6.8% or 506 of them unemployed. The age group with the highest labor force participation rate is 30 to 34 years, with 95.3% or 816 individuals in the labor force. Within the labor force, the 16 to 19 years age range has the highest percentage of unemployed individuals, with 18.0% or 134 of them being unemployed.
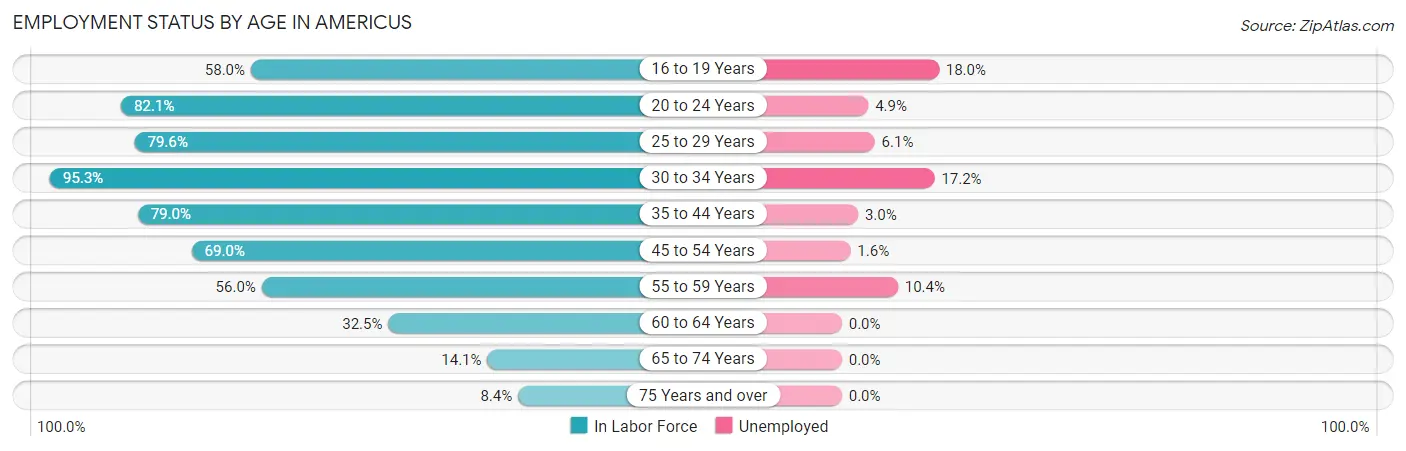
| Age Bracket | In Labor Force | Unemployed |
| 16 to 19 Years | 746 (58.0%) | 134 (18.0%) |
| 20 to 24 Years | 1,493 (82.1%) | 73 (4.9%) |
| 25 to 29 Years | 1,027 (79.6%) | 63 (6.1%) |
| 30 to 34 Years | 816 (95.3%) | 140 (17.2%) |
| 35 to 44 Years | 1,262 (79.0%) | 38 (3.0%) |
| 45 to 54 Years | 1,222 (69.0%) | 20 (1.6%) |
| 55 to 59 Years | 404 (56.0%) | 42 (10.4%) |
| 60 to 64 Years | 204 (32.5%) | 0 (0.0%) |
| 65 to 74 Years | 178 (14.1%) | 0 (0.0%) |
| 75 Years and over | 90 (8.4%) | 0 (0.0%) |
| Total | 7,443 (60.5%) | 506 (6.8%) |
Employment Status by Educational Attainment in Americus
According to labor force statistics for Americus, 71.9% of individuals (4,936) out of the total population between 25 and 64 years of age (6,865) are in the labor force, with 6.1% or 301 of them being unemployed. The group with the highest labor force participation rate are those with the educational attainment of bachelor's degree or higher, with 86.3% or 1,327 individuals in the labor force. Within the labor force, individuals with high school diploma education have the highest percentage of unemployment, with 12.8% or 234 of them being unemployed.
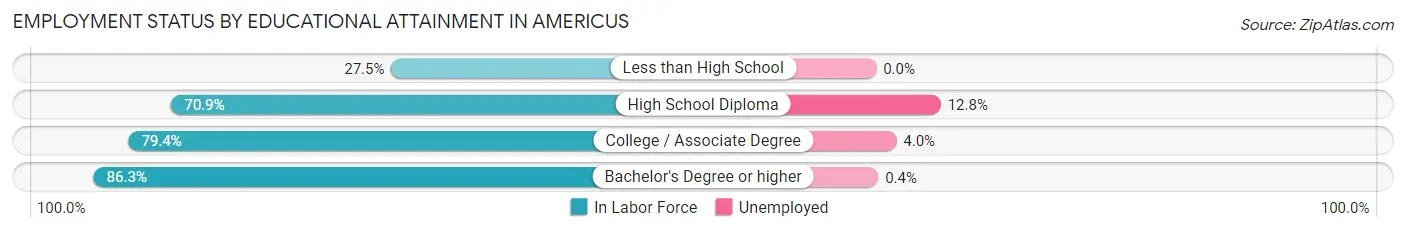
| Educational Attainment | In Labor Force | Unemployed |
| Less than High School | 214 (27.5%) | 0 (0.0%) |
| High School Diploma | 1,829 (70.9%) | 330 (12.8%) |
| College / Associate Degree | 1,563 (79.4%) | 79 (4.0%) |
| Bachelor's Degree or higher | 1,327 (86.3%) | 6 (0.4%) |
| Total | 4,936 (71.9%) | 419 (6.1%) |
Employment Occupations by Sex in Americus
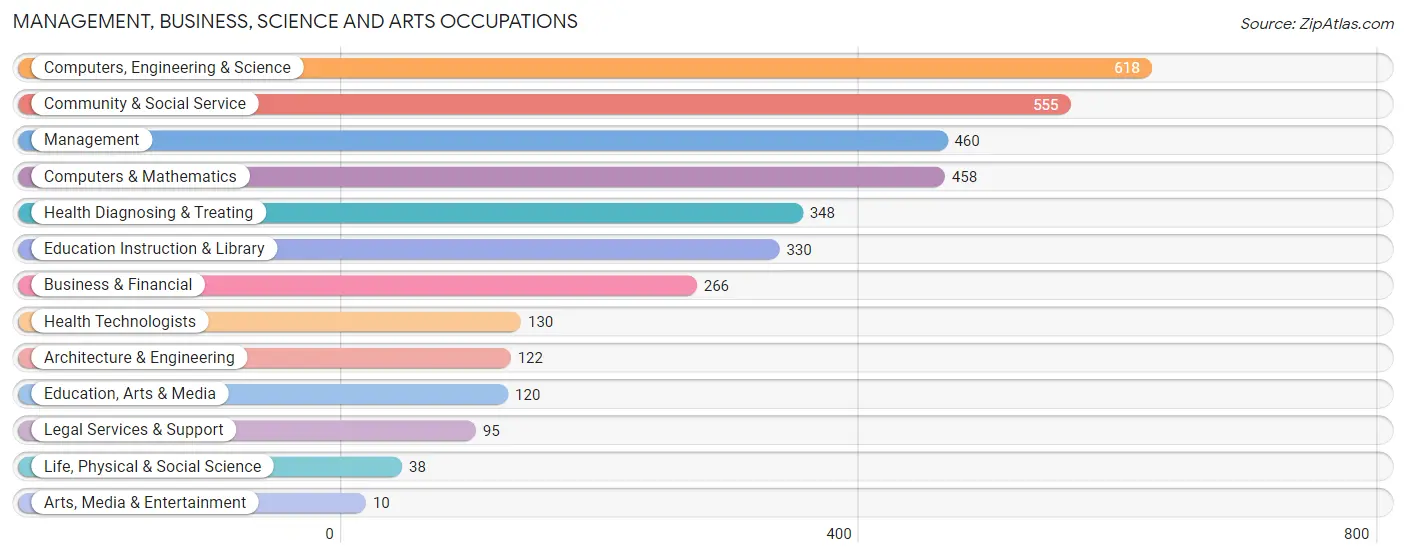
Management, Business, Science and Arts Occupations
The most common Management, Business, Science and Arts occupations in Americus are Computers, Engineering & Science (618 | 8.9%), Community & Social Service (555 | 8.0%), Management (460 | 6.6%), Computers & Mathematics (458 | 6.6%), and Health Diagnosing & Treating (348 | 5.0%).
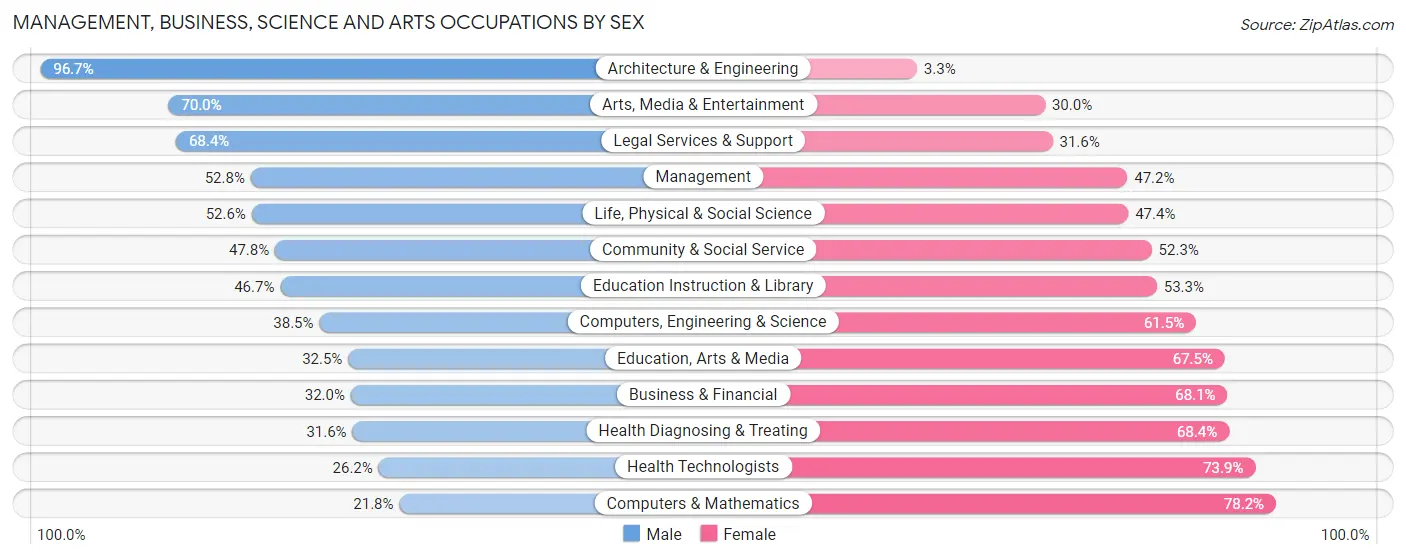
Management, Business, Science and Arts Occupations by Sex
Within the Management, Business, Science and Arts occupations in Americus, the most male-oriented occupations are Architecture & Engineering (96.7%), Arts, Media & Entertainment (70.0%), and Legal Services & Support (68.4%), while the most female-oriented occupations are Computers & Mathematics (78.2%), Health Technologists (73.9%), and Health Diagnosing & Treating (68.4%).
| Occupation | Male | Female |
| Management | 243 (52.8%) | 217 (47.2%) |
| Business & Financial | 85 (32.0%) | 181 (68.0%) |
| Computers, Engineering & Science | 238 (38.5%) | 380 (61.5%) |
| Computers & Mathematics | 100 (21.8%) | 358 (78.2%) |
| Architecture & Engineering | 118 (96.7%) | 4 (3.3%) |
| Life, Physical & Social Science | 20 (52.6%) | 18 (47.4%) |
| Community & Social Service | 265 (47.7%) | 290 (52.2%) |
| Education, Arts & Media | 39 (32.5%) | 81 (67.5%) |
| Legal Services & Support | 65 (68.4%) | 30 (31.6%) |
| Education Instruction & Library | 154 (46.7%) | 176 (53.3%) |
| Arts, Media & Entertainment | 7 (70.0%) | 3 (30.0%) |
| Health Diagnosing & Treating | 110 (31.6%) | 238 (68.4%) |
| Health Technologists | 34 (26.2%) | 96 (73.9%) |
| Total (Category) | 941 (41.9%) | 1,306 (58.1%) |
| Total (Overall) | 3,397 (49.1%) | 3,527 (50.9%) |
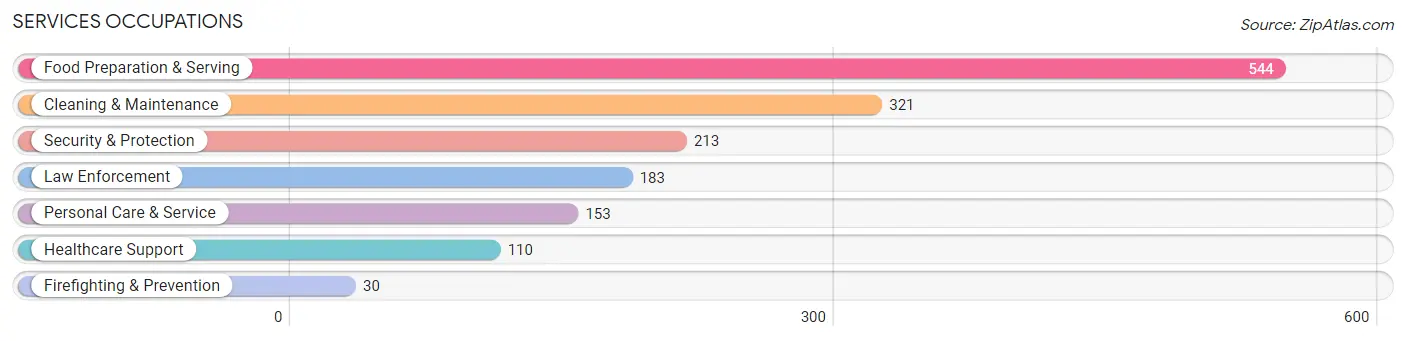
Services Occupations
The most common Services occupations in Americus are Food Preparation & Serving (544 | 7.9%), Cleaning & Maintenance (321 | 4.6%), Security & Protection (213 | 3.1%), Law Enforcement (183 | 2.6%), and Personal Care & Service (153 | 2.2%).
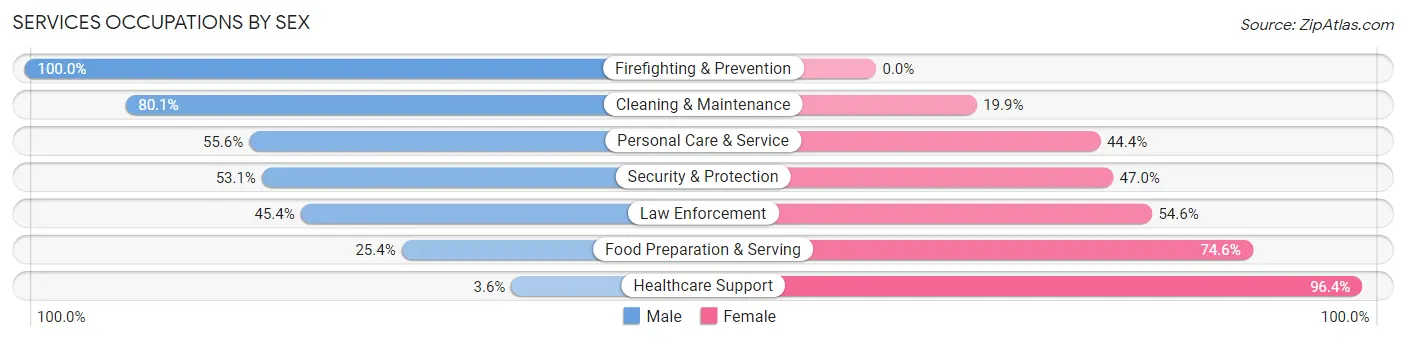
Services Occupations by Sex
Within the Services occupations in Americus, the most male-oriented occupations are Firefighting & Prevention (100.0%), Cleaning & Maintenance (80.1%), and Personal Care & Service (55.6%), while the most female-oriented occupations are Healthcare Support (96.4%), Food Preparation & Serving (74.6%), and Law Enforcement (54.6%).
| Occupation | Male | Female |
| Healthcare Support | 4 (3.6%) | 106 (96.4%) |
| Security & Protection | 113 (53.0%) | 100 (46.9%) |
| Firefighting & Prevention | 30 (100.0%) | 0 (0.0%) |
| Law Enforcement | 83 (45.4%) | 100 (54.6%) |
| Food Preparation & Serving | 138 (25.4%) | 406 (74.6%) |
| Cleaning & Maintenance | 257 (80.1%) | 64 (19.9%) |
| Personal Care & Service | 85 (55.6%) | 68 (44.4%) |
| Total (Category) | 597 (44.5%) | 744 (55.5%) |
| Total (Overall) | 3,397 (49.1%) | 3,527 (50.9%) |
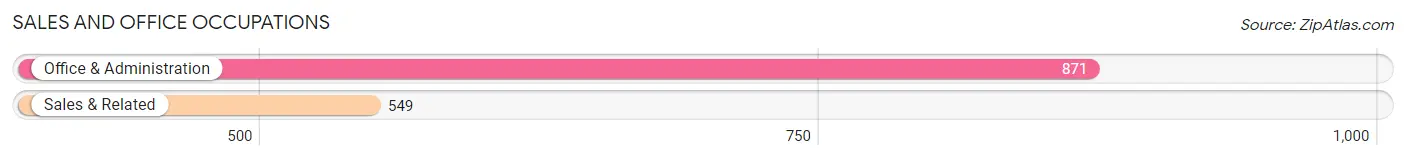
Sales and Office Occupations
The most common Sales and Office occupations in Americus are Office & Administration (871 | 12.6%), and Sales & Related (549 | 7.9%).
Sales and Office Occupations by Sex
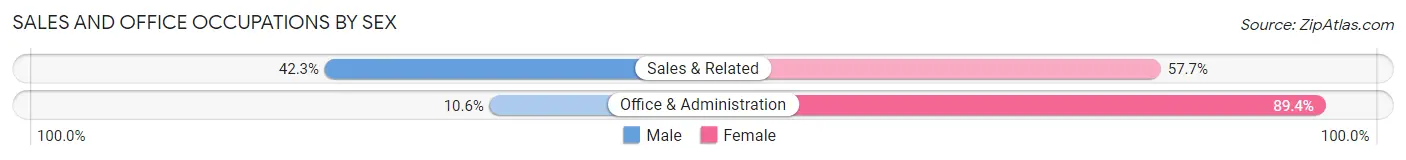
| Occupation | Male | Female |
| Sales & Related | 232 (42.3%) | 317 (57.7%) |
| Office & Administration | 92 (10.6%) | 779 (89.4%) |
| Total (Category) | 324 (22.8%) | 1,096 (77.2%) |
| Total (Overall) | 3,397 (49.1%) | 3,527 (50.9%) |
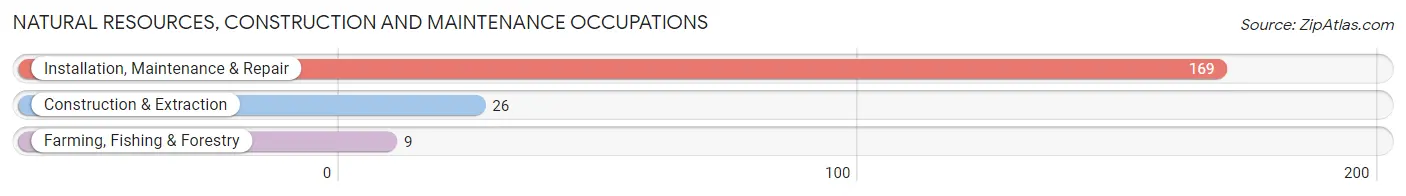
Natural Resources, Construction and Maintenance Occupations
The most common Natural Resources, Construction and Maintenance occupations in Americus are Installation, Maintenance & Repair (169 | 2.4%), Construction & Extraction (26 | 0.4%), and Farming, Fishing & Forestry (9 | 0.1%).
Natural Resources, Construction and Maintenance Occupations by Sex
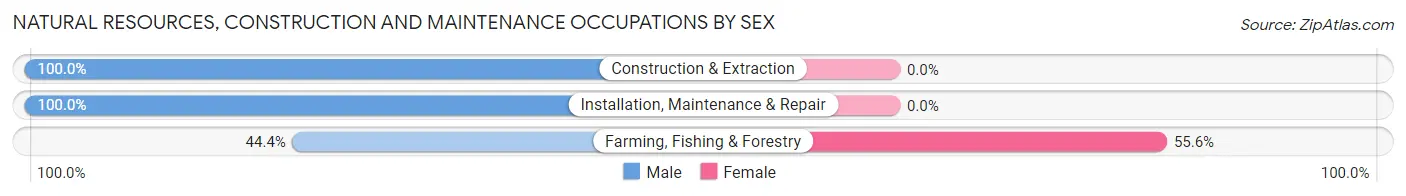
| Occupation | Male | Female |
| Farming, Fishing & Forestry | 4 (44.4%) | 5 (55.6%) |
| Construction & Extraction | 26 (100.0%) | 0 (0.0%) |
| Installation, Maintenance & Repair | 169 (100.0%) | 0 (0.0%) |
| Total (Category) | 199 (97.6%) | 5 (2.5%) |
| Total (Overall) | 3,397 (49.1%) | 3,527 (50.9%) |
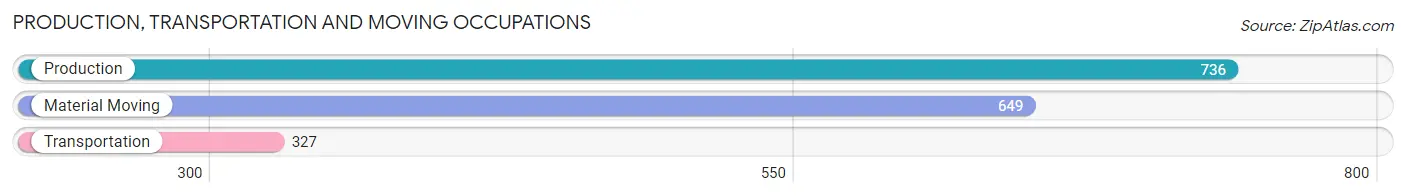
Production, Transportation and Moving Occupations
The most common Production, Transportation and Moving occupations in Americus are Production (736 | 10.6%), Material Moving (649 | 9.4%), and Transportation (327 | 4.7%).
Production, Transportation and Moving Occupations by Sex
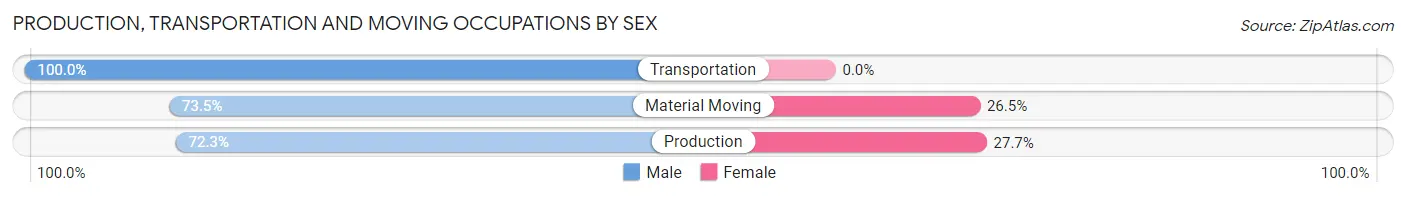
| Occupation | Male | Female |
| Production | 532 (72.3%) | 204 (27.7%) |
| Transportation | 327 (100.0%) | 0 (0.0%) |
| Material Moving | 477 (73.5%) | 172 (26.5%) |
| Total (Category) | 1,336 (78.0%) | 376 (22.0%) |
| Total (Overall) | 3,397 (49.1%) | 3,527 (50.9%) |
Employment Industries by Sex in Americus
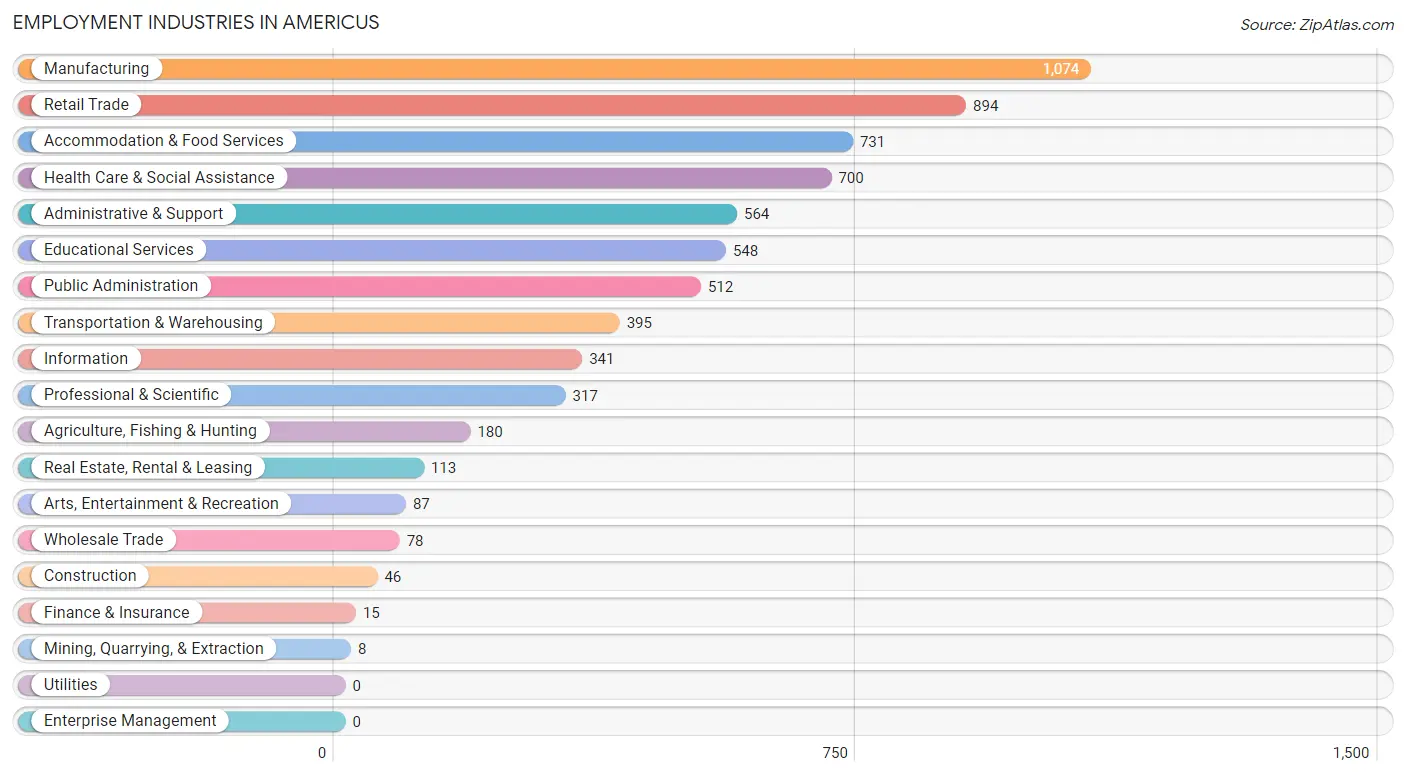
Employment Industries in Americus
The major employment industries in Americus include Manufacturing (1,074 | 15.5%), Retail Trade (894 | 12.9%), Accommodation & Food Services (731 | 10.6%), Health Care & Social Assistance (700 | 10.1%), and Administrative & Support (564 | 8.2%).
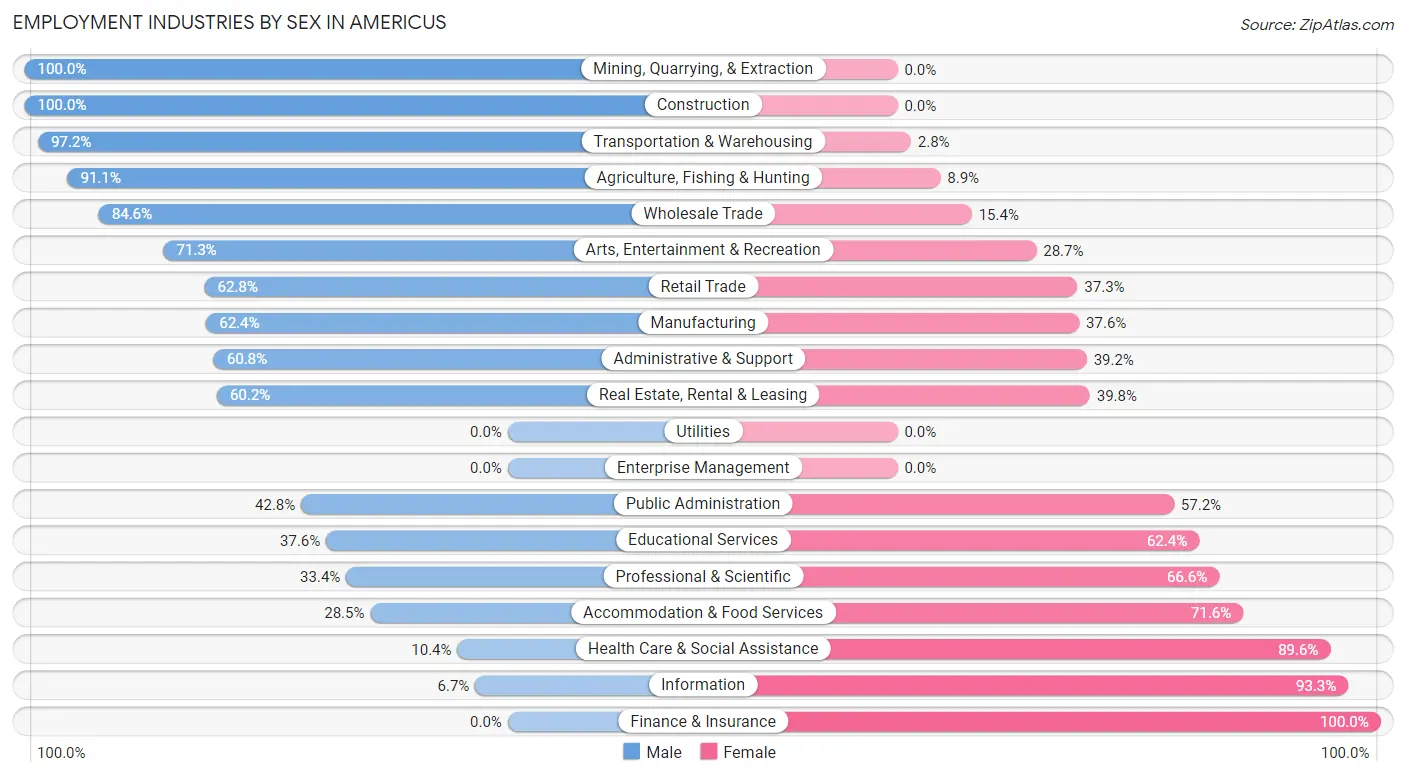
Employment Industries by Sex in Americus
The Americus industries that see more men than women are Mining, Quarrying, & Extraction (100.0%), Construction (100.0%), and Transportation & Warehousing (97.2%), whereas the industries that tend to have a higher number of women are Finance & Insurance (100.0%), Information (93.3%), and Health Care & Social Assistance (89.6%).
| Industry | Male | Female |
| Agriculture, Fishing & Hunting | 164 (91.1%) | 16 (8.9%) |
| Mining, Quarrying, & Extraction | 8 (100.0%) | 0 (0.0%) |
| Construction | 46 (100.0%) | 0 (0.0%) |
| Manufacturing | 670 (62.4%) | 404 (37.6%) |
| Wholesale Trade | 66 (84.6%) | 12 (15.4%) |
| Retail Trade | 561 (62.7%) | 333 (37.2%) |
| Transportation & Warehousing | 384 (97.2%) | 11 (2.8%) |
| Utilities | 0 (0.0%) | 0 (0.0%) |
| Information | 23 (6.7%) | 318 (93.3%) |
| Finance & Insurance | 0 (0.0%) | 15 (100.0%) |
| Real Estate, Rental & Leasing | 68 (60.2%) | 45 (39.8%) |
| Professional & Scientific | 106 (33.4%) | 211 (66.6%) |
| Enterprise Management | 0 (0.0%) | 0 (0.0%) |
| Administrative & Support | 343 (60.8%) | 221 (39.2%) |
| Educational Services | 206 (37.6%) | 342 (62.4%) |
| Health Care & Social Assistance | 73 (10.4%) | 627 (89.6%) |
| Arts, Entertainment & Recreation | 62 (71.3%) | 25 (28.7%) |
| Accommodation & Food Services | 208 (28.4%) | 523 (71.6%) |
| Public Administration | 219 (42.8%) | 293 (57.2%) |
| Total | 3,397 (49.1%) | 3,527 (50.9%) |
Education in Americus
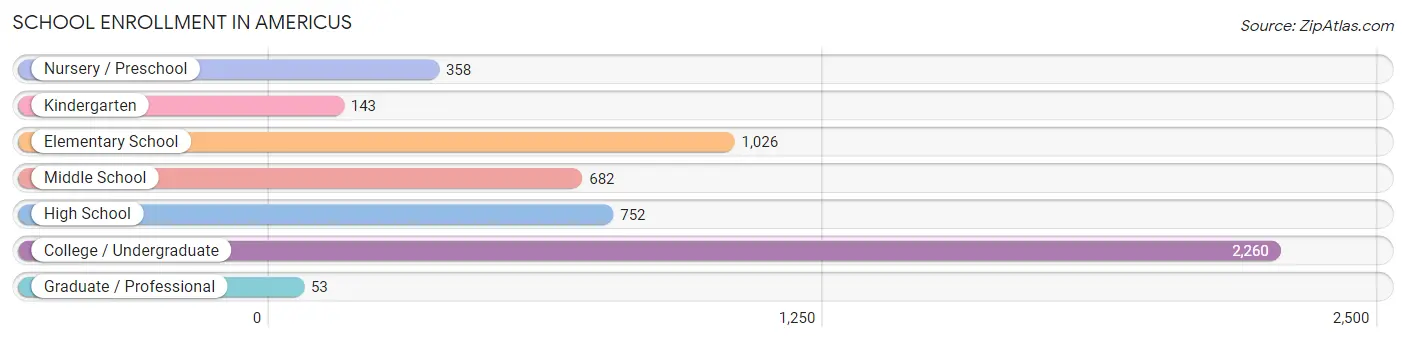
School Enrollment in Americus
The most common levels of schooling among the 5,274 students in Americus are college / undergraduate (2,260 | 42.8%), elementary school (1,026 | 19.5%), and high school (752 | 14.3%).
| School Level | # Students | % Students |
| Nursery / Preschool | 358 | 6.8% |
| Kindergarten | 143 | 2.7% |
| Elementary School | 1,026 | 19.5% |
| Middle School | 682 | 12.9% |
| High School | 752 | 14.3% |
| College / Undergraduate | 2,260 | 42.8% |
| Graduate / Professional | 53 | 1.0% |
| Total | 5,274 | 100.0% |
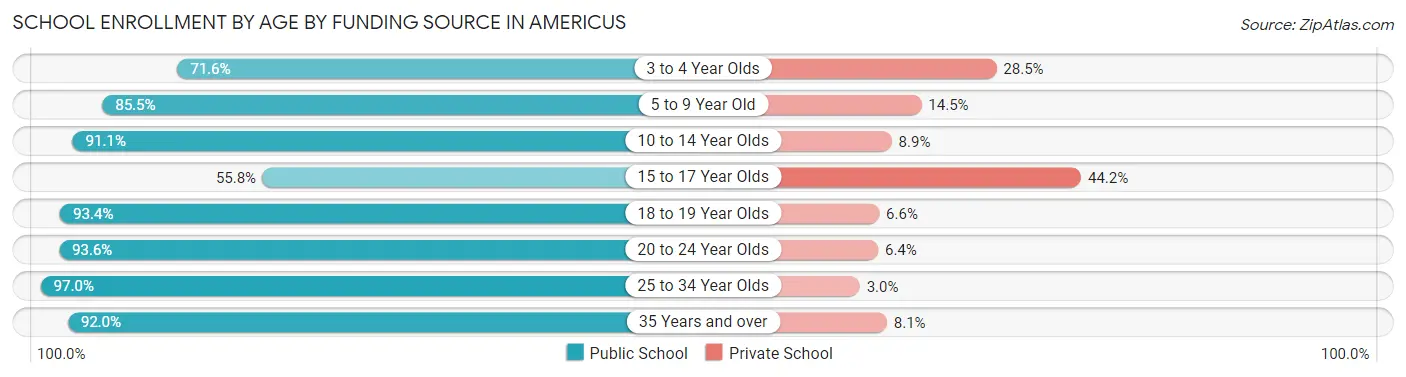
School Enrollment by Age by Funding Source in Americus
Out of a total of 5,274 students who are enrolled in schools in Americus, 723 (13.7%) attend a private institution, while the remaining 4,551 (86.3%) are enrolled in public schools. The age group of 15 to 17 year olds has the highest likelihood of being enrolled in private schools, with 252 (44.2% in the age bracket) enrolled. Conversely, the age group of 25 to 34 year olds has the lowest likelihood of being enrolled in a private school, with 227 (97.0% in the age bracket) attending a public institution.
| Age Bracket | Public School | Private School |
| 3 to 4 Year Olds | 171 (71.6%) | 68 (28.4%) |
| 5 to 9 Year Old | 1,104 (85.5%) | 187 (14.5%) |
| 10 to 14 Year Olds | 662 (91.1%) | 65 (8.9%) |
| 15 to 17 Year Olds | 318 (55.8%) | 252 (44.2%) |
| 18 to 19 Year Olds | 834 (93.4%) | 59 (6.6%) |
| 20 to 24 Year Olds | 1,096 (93.6%) | 75 (6.4%) |
| 25 to 34 Year Olds | 227 (97.0%) | 7 (3.0%) |
| 35 Years and over | 137 (91.9%) | 12 (8.1%) |
| Total | 4,551 (86.3%) | 723 (13.7%) |
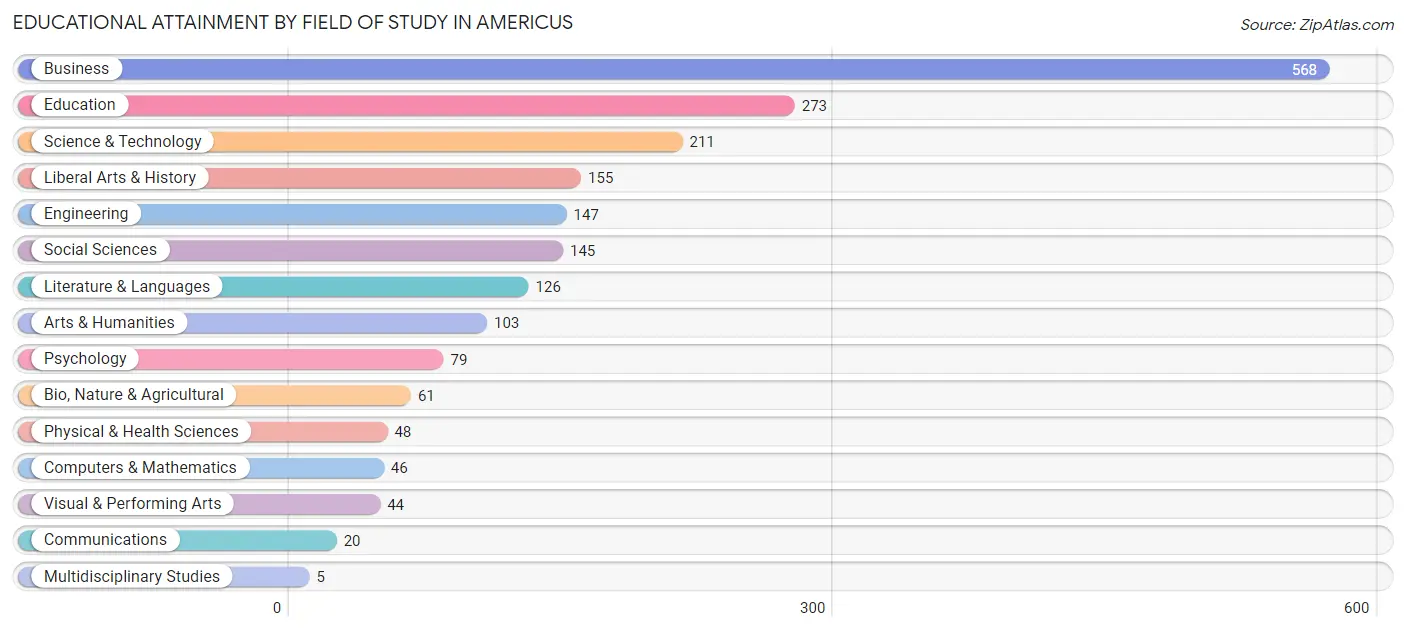
Educational Attainment by Field of Study in Americus
Business (568 | 28.0%), education (273 | 13.4%), science & technology (211 | 10.4%), liberal arts & history (155 | 7.6%), and engineering (147 | 7.2%) are the most common fields of study among 2,031 individuals in Americus who have obtained a bachelor's degree or higher.
| Field of Study | # Graduates | % Graduates |
| Computers & Mathematics | 46 | 2.3% |
| Bio, Nature & Agricultural | 61 | 3.0% |
| Physical & Health Sciences | 48 | 2.4% |
| Psychology | 79 | 3.9% |
| Social Sciences | 145 | 7.1% |
| Engineering | 147 | 7.2% |
| Multidisciplinary Studies | 5 | 0.3% |
| Science & Technology | 211 | 10.4% |
| Business | 568 | 28.0% |
| Education | 273 | 13.4% |
| Literature & Languages | 126 | 6.2% |
| Liberal Arts & History | 155 | 7.6% |
| Visual & Performing Arts | 44 | 2.2% |
| Communications | 20 | 1.0% |
| Arts & Humanities | 103 | 5.1% |
| Total | 2,031 | 100.0% |
Transportation & Commute in Americus
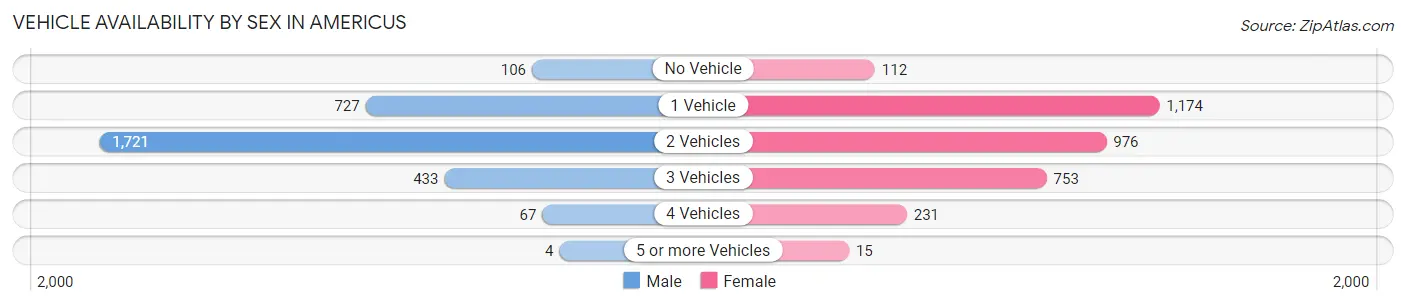
Vehicle Availability by Sex in Americus
The most prevalent vehicle ownership categories in Americus are males with 2 vehicles (1,721, accounting for 56.3%) and females with 2 vehicles (976, making up 52.8%).
| Vehicles Available | Male | Female |
| No Vehicle | 106 (3.5%) | 112 (3.4%) |
| 1 Vehicle | 727 (23.8%) | 1,174 (36.0%) |
| 2 Vehicles | 1,721 (56.3%) | 976 (29.9%) |
| 3 Vehicles | 433 (14.2%) | 753 (23.1%) |
| 4 Vehicles | 67 (2.2%) | 231 (7.1%) |
| 5 or more Vehicles | 4 (0.1%) | 15 (0.5%) |
| Total | 3,058 (100.0%) | 3,261 (100.0%) |
Commute Time in Americus
The most frequently occuring commute durations in Americus are 5 to 9 minutes (1,560 commuters, 26.2%), 10 to 14 minutes (1,456 commuters, 24.5%), and 15 to 19 minutes (684 commuters, 11.5%).

| Commute Time | # Commuters | % Commuters |
| Less than 5 Minutes | 414 | 7.0% |
| 5 to 9 Minutes | 1,560 | 26.2% |
| 10 to 14 Minutes | 1,456 | 24.5% |
| 15 to 19 Minutes | 684 | 11.5% |
| 20 to 24 Minutes | 512 | 8.6% |
| 25 to 29 Minutes | 90 | 1.5% |
| 30 to 34 Minutes | 451 | 7.6% |
| 35 to 39 Minutes | 128 | 2.1% |
| 40 to 44 Minutes | 64 | 1.1% |
| 45 to 59 Minutes | 431 | 7.2% |
| 60 to 89 Minutes | 97 | 1.6% |
| 90 or more Minutes | 65 | 1.1% |
Commute Time by Sex in Americus
The most common commute times in Americus are 10 to 14 minutes (771 commuters, 25.0%) for males and 5 to 9 minutes (790 commuters, 27.6%) for females.
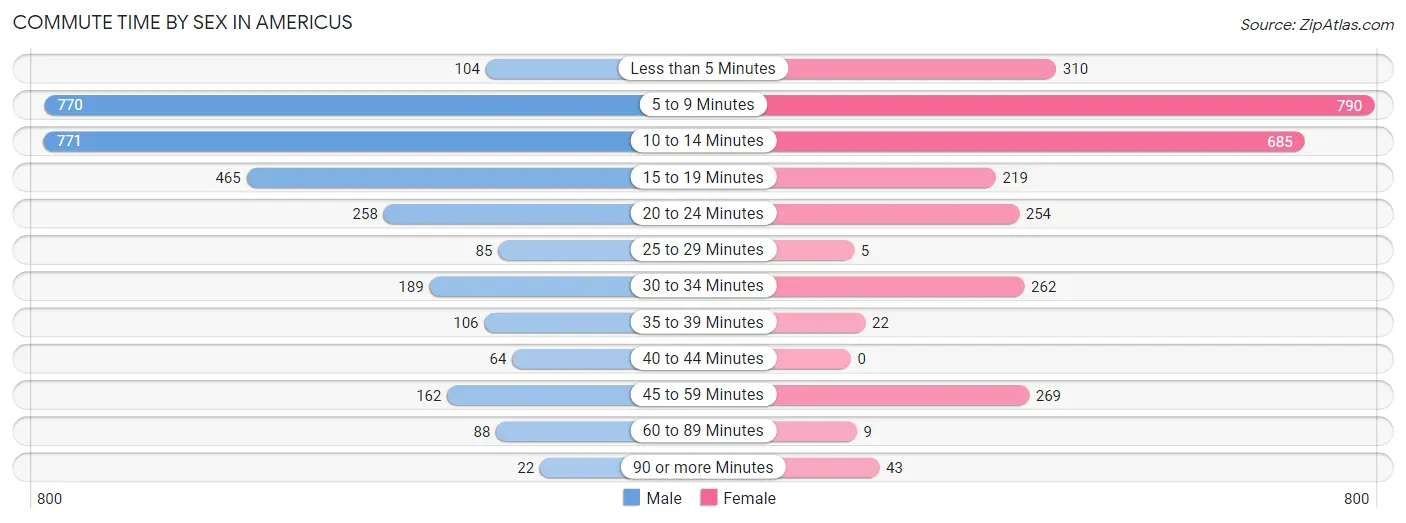
| Commute Time | Male | Female |
| Less than 5 Minutes | 104 (3.4%) | 310 (10.8%) |
| 5 to 9 Minutes | 770 (25.0%) | 790 (27.6%) |
| 10 to 14 Minutes | 771 (25.0%) | 685 (23.9%) |
| 15 to 19 Minutes | 465 (15.1%) | 219 (7.6%) |
| 20 to 24 Minutes | 258 (8.4%) | 254 (8.9%) |
| 25 to 29 Minutes | 85 (2.8%) | 5 (0.2%) |
| 30 to 34 Minutes | 189 (6.1%) | 262 (9.1%) |
| 35 to 39 Minutes | 106 (3.4%) | 22 (0.8%) |
| 40 to 44 Minutes | 64 (2.1%) | 0 (0.0%) |
| 45 to 59 Minutes | 162 (5.2%) | 269 (9.4%) |
| 60 to 89 Minutes | 88 (2.9%) | 9 (0.3%) |
| 90 or more Minutes | 22 (0.7%) | 43 (1.5%) |
Time of Departure to Work by Sex in Americus
The most frequent times of departure to work in Americus are 7:30 AM to 7:59 AM (675, 21.9%) for males and 12:00 PM to 3:59 PM (474, 16.5%) for females.
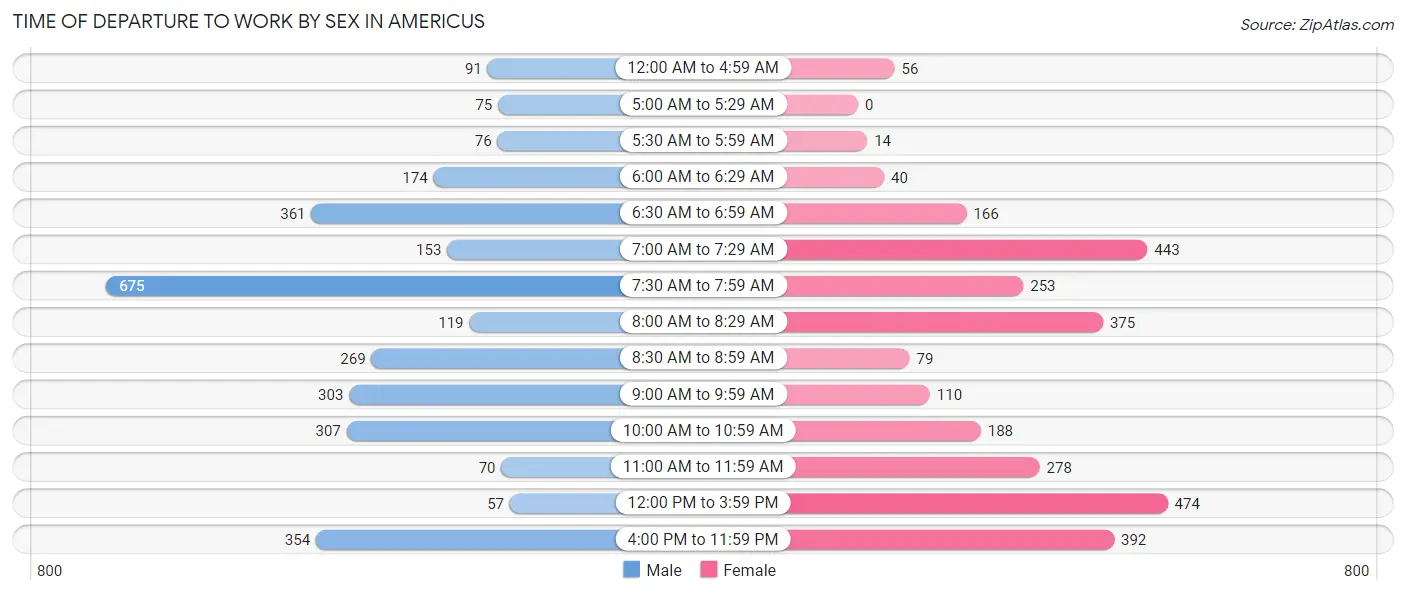
| Time of Departure | Male | Female |
| 12:00 AM to 4:59 AM | 91 (2.9%) | 56 (1.9%) |
| 5:00 AM to 5:29 AM | 75 (2.4%) | 0 (0.0%) |
| 5:30 AM to 5:59 AM | 76 (2.5%) | 14 (0.5%) |
| 6:00 AM to 6:29 AM | 174 (5.6%) | 40 (1.4%) |
| 6:30 AM to 6:59 AM | 361 (11.7%) | 166 (5.8%) |
| 7:00 AM to 7:29 AM | 153 (5.0%) | 443 (15.4%) |
| 7:30 AM to 7:59 AM | 675 (21.9%) | 253 (8.8%) |
| 8:00 AM to 8:29 AM | 119 (3.9%) | 375 (13.1%) |
| 8:30 AM to 8:59 AM | 269 (8.7%) | 79 (2.8%) |
| 9:00 AM to 9:59 AM | 303 (9.8%) | 110 (3.8%) |
| 10:00 AM to 10:59 AM | 307 (10.0%) | 188 (6.6%) |
| 11:00 AM to 11:59 AM | 70 (2.3%) | 278 (9.7%) |
| 12:00 PM to 3:59 PM | 57 (1.8%) | 474 (16.5%) |
| 4:00 PM to 11:59 PM | 354 (11.5%) | 392 (13.7%) |
| Total | 3,084 (100.0%) | 2,868 (100.0%) |
Housing Occupancy in Americus
Occupancy by Ownership in Americus
Of the total 5,880 dwellings in Americus, owner-occupied units account for 2,100 (35.7%), while renter-occupied units make up 3,780 (64.3%).
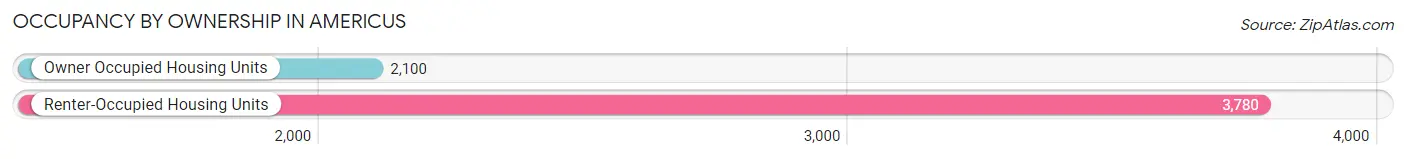
| Occupancy | # Housing Units | % Housing Units |
| Owner Occupied Housing Units | 2,100 | 35.7% |
| Renter-Occupied Housing Units | 3,780 | 64.3% |
| Total Occupied Housing Units | 5,880 | 100.0% |
Occupancy by Household Size in Americus
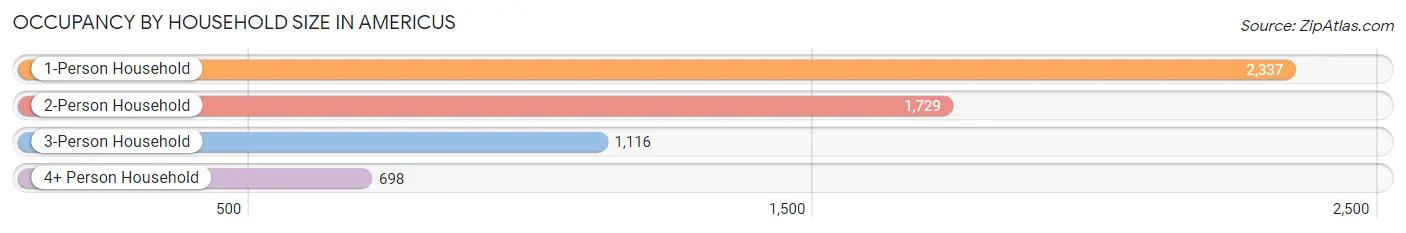
| Household Size | # Housing Units | % Housing Units |
| 1-Person Household | 2,337 | 39.7% |
| 2-Person Household | 1,729 | 29.4% |
| 3-Person Household | 1,116 | 19.0% |
| 4+ Person Household | 698 | 11.9% |
| Total Housing Units | 5,880 | 100.0% |
Occupancy by Ownership by Household Size in Americus
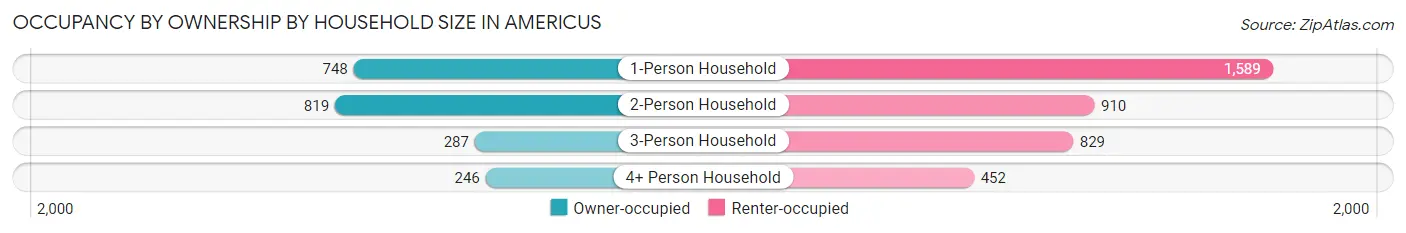
| Household Size | Owner-occupied | Renter-occupied |
| 1-Person Household | 748 (32.0%) | 1,589 (68.0%) |
| 2-Person Household | 819 (47.4%) | 910 (52.6%) |
| 3-Person Household | 287 (25.7%) | 829 (74.3%) |
| 4+ Person Household | 246 (35.2%) | 452 (64.8%) |
| Total Housing Units | 2,100 (35.7%) | 3,780 (64.3%) |
Occupancy by Educational Attainment in Americus
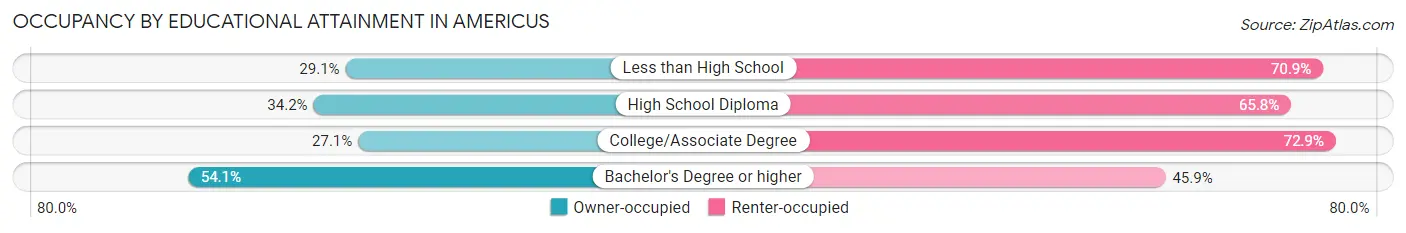
| Household Size | Owner-occupied | Renter-occupied |
| Less than High School | 214 (29.1%) | 521 (70.9%) |
| High School Diploma | 693 (34.2%) | 1,334 (65.8%) |
| College/Associate Degree | 496 (27.1%) | 1,334 (72.9%) |
| Bachelor's Degree or higher | 697 (54.1%) | 591 (45.9%) |
Occupancy by Age of Householder in Americus
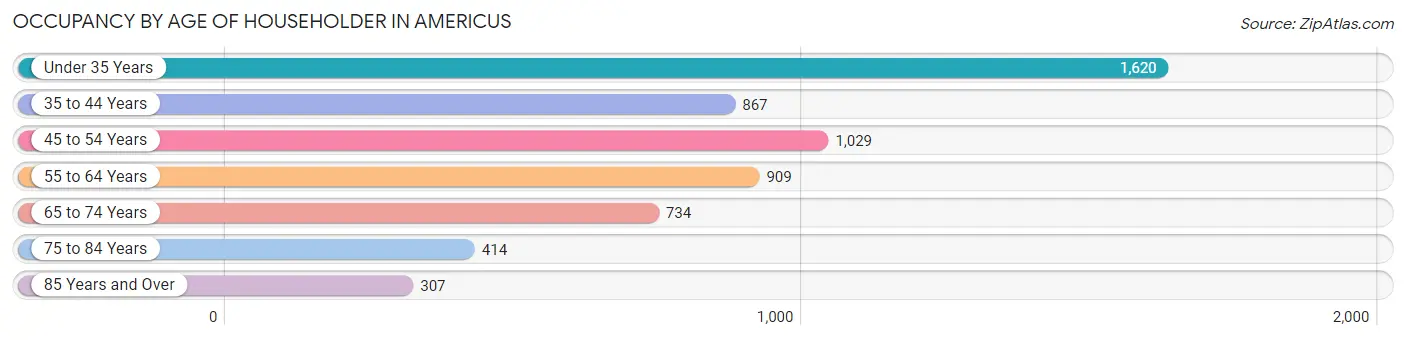
| Age Bracket | # Households | % Households |
| Under 35 Years | 1,620 | 27.6% |
| 35 to 44 Years | 867 | 14.7% |
| 45 to 54 Years | 1,029 | 17.5% |
| 55 to 64 Years | 909 | 15.5% |
| 65 to 74 Years | 734 | 12.5% |
| 75 to 84 Years | 414 | 7.0% |
| 85 Years and Over | 307 | 5.2% |
| Total | 5,880 | 100.0% |
Housing Finances in Americus
Median Income by Occupancy in Americus
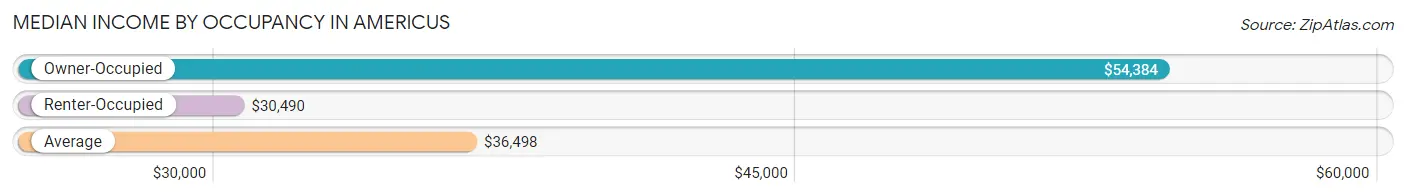
| Occupancy Type | # Households | Median Income |
| Owner-Occupied | 2,100 (35.7%) | $54,384 |
| Renter-Occupied | 3,780 (64.3%) | $30,490 |
| Average | 5,880 (100.0%) | $36,498 |
Occupancy by Householder Income Bracket in Americus
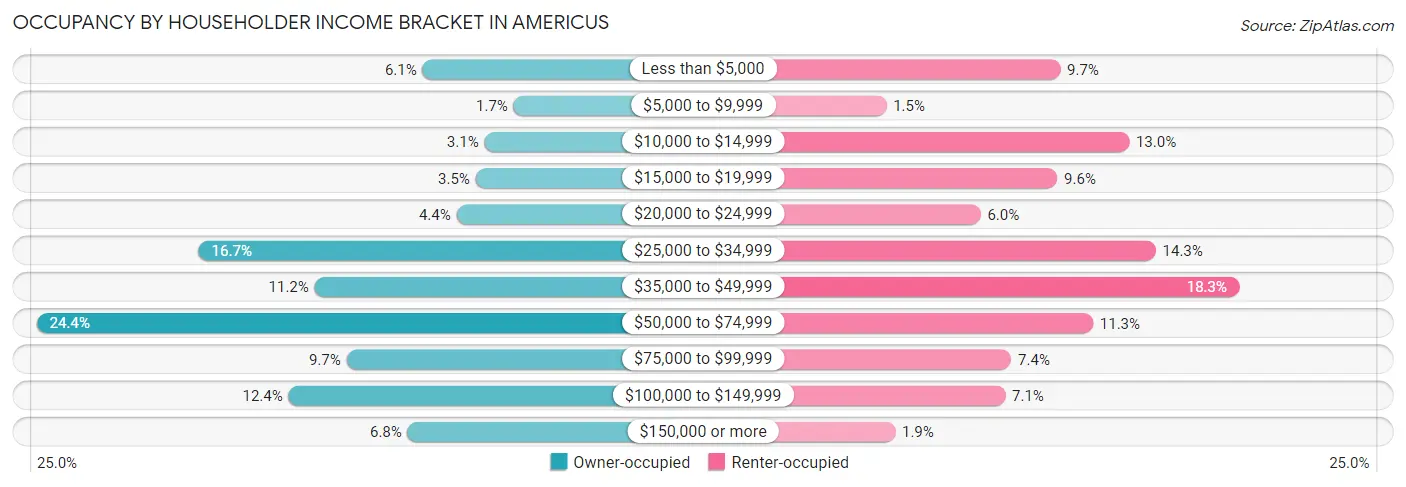
| Income Bracket | Owner-occupied | Renter-occupied |
| Less than $5,000 | 127 (6.0%) | 368 (9.7%) |
| $5,000 to $9,999 | 36 (1.7%) | 55 (1.5%) |
| $10,000 to $14,999 | 65 (3.1%) | 492 (13.0%) |
| $15,000 to $19,999 | 74 (3.5%) | 363 (9.6%) |
| $20,000 to $24,999 | 93 (4.4%) | 225 (5.9%) |
| $25,000 to $34,999 | 351 (16.7%) | 540 (14.3%) |
| $35,000 to $49,999 | 235 (11.2%) | 690 (18.2%) |
| $50,000 to $74,999 | 513 (24.4%) | 427 (11.3%) |
| $75,000 to $99,999 | 203 (9.7%) | 280 (7.4%) |
| $100,000 to $149,999 | 261 (12.4%) | 269 (7.1%) |
| $150,000 or more | 142 (6.8%) | 71 (1.9%) |
| Total | 2,100 (100.0%) | 3,780 (100.0%) |
Monthly Housing Cost Tiers in Americus
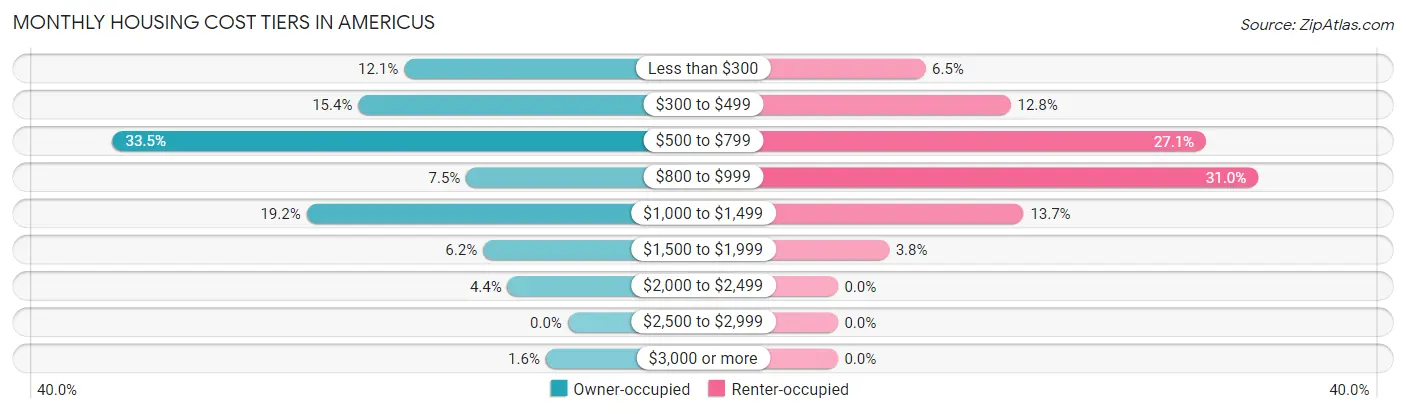
| Monthly Cost | Owner-occupied | Renter-occupied |
| Less than $300 | 253 (12.0%) | 244 (6.5%) |
| $300 to $499 | 324 (15.4%) | 482 (12.8%) |
| $500 to $799 | 704 (33.5%) | 1,026 (27.1%) |
| $800 to $999 | 157 (7.5%) | 1,171 (31.0%) |
| $1,000 to $1,499 | 404 (19.2%) | 518 (13.7%) |
| $1,500 to $1,999 | 131 (6.2%) | 143 (3.8%) |
| $2,000 to $2,499 | 93 (4.4%) | 0 (0.0%) |
| $2,500 to $2,999 | 0 (0.0%) | 0 (0.0%) |
| $3,000 or more | 34 (1.6%) | 0 (0.0%) |
| Total | 2,100 (100.0%) | 3,780 (100.0%) |
Physical Housing Characteristics in Americus
Housing Structures in Americus
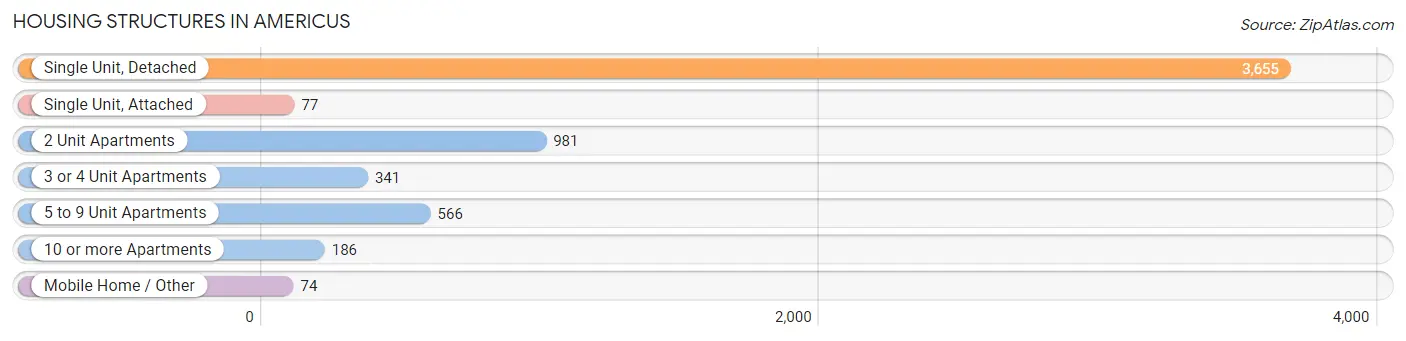
| Structure Type | # Housing Units | % Housing Units |
| Single Unit, Detached | 3,655 | 62.2% |
| Single Unit, Attached | 77 | 1.3% |
| 2 Unit Apartments | 981 | 16.7% |
| 3 or 4 Unit Apartments | 341 | 5.8% |
| 5 to 9 Unit Apartments | 566 | 9.6% |
| 10 or more Apartments | 186 | 3.2% |
| Mobile Home / Other | 74 | 1.3% |
| Total | 5,880 | 100.0% |
Housing Structures by Occupancy in Americus
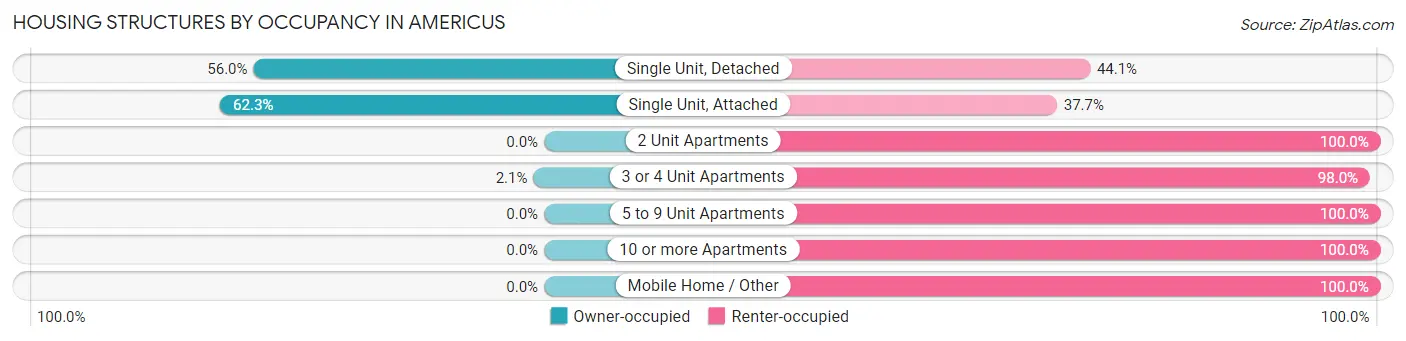
| Structure Type | Owner-occupied | Renter-occupied |
| Single Unit, Detached | 2,045 (55.9%) | 1,610 (44.1%) |
| Single Unit, Attached | 48 (62.3%) | 29 (37.7%) |
| 2 Unit Apartments | 0 (0.0%) | 981 (100.0%) |
| 3 or 4 Unit Apartments | 7 (2.1%) | 334 (98.0%) |
| 5 to 9 Unit Apartments | 0 (0.0%) | 566 (100.0%) |
| 10 or more Apartments | 0 (0.0%) | 186 (100.0%) |
| Mobile Home / Other | 0 (0.0%) | 74 (100.0%) |
| Total | 2,100 (35.7%) | 3,780 (64.3%) |
Housing Structures by Number of Rooms in Americus
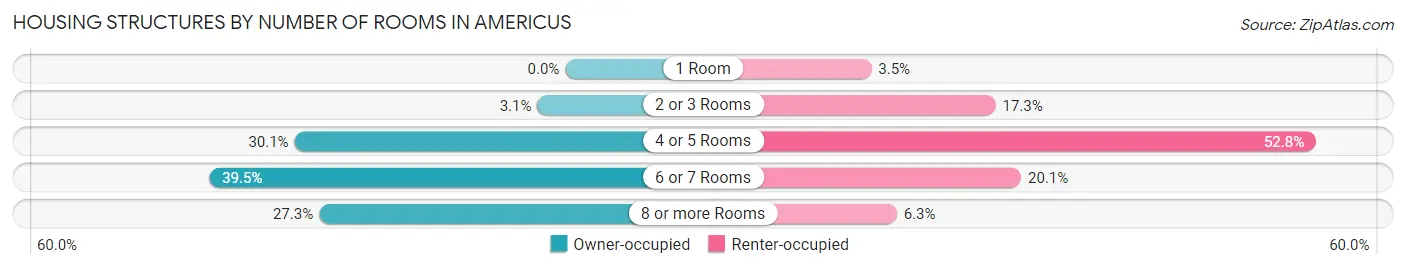
| Number of Rooms | Owner-occupied | Renter-occupied |
| 1 Room | 0 (0.0%) | 132 (3.5%) |
| 2 or 3 Rooms | 65 (3.1%) | 653 (17.3%) |
| 4 or 5 Rooms | 631 (30.0%) | 1,997 (52.8%) |
| 6 or 7 Rooms | 830 (39.5%) | 760 (20.1%) |
| 8 or more Rooms | 574 (27.3%) | 238 (6.3%) |
| Total | 2,100 (100.0%) | 3,780 (100.0%) |
Housing Structure by Heating Type in Americus
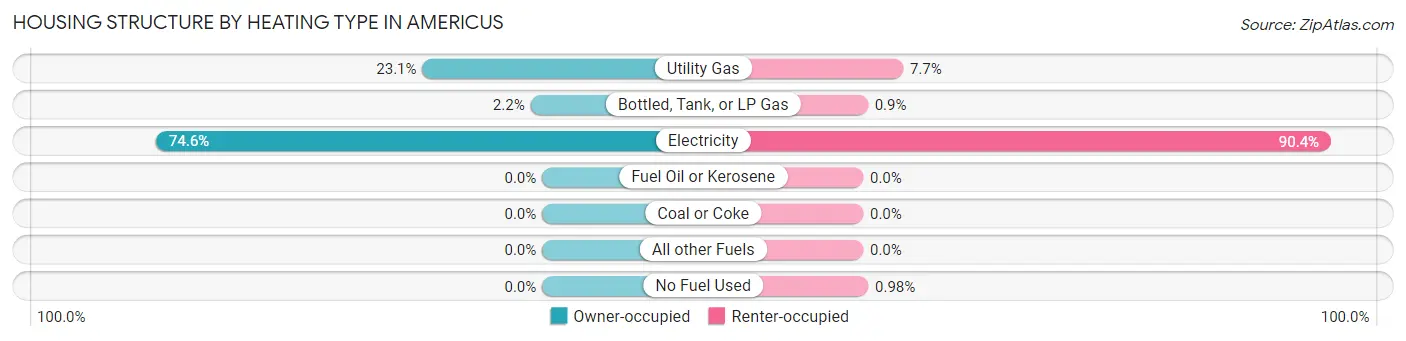
| Heating Type | Owner-occupied | Renter-occupied |
| Utility Gas | 486 (23.1%) | 292 (7.7%) |
| Bottled, Tank, or LP Gas | 47 (2.2%) | 34 (0.9%) |
| Electricity | 1,567 (74.6%) | 3,417 (90.4%) |
| Fuel Oil or Kerosene | 0 (0.0%) | 0 (0.0%) |
| Coal or Coke | 0 (0.0%) | 0 (0.0%) |
| All other Fuels | 0 (0.0%) | 0 (0.0%) |
| No Fuel Used | 0 (0.0%) | 37 (1.0%) |
| Total | 2,100 (100.0%) | 3,780 (100.0%) |
Household Vehicle Usage in Americus
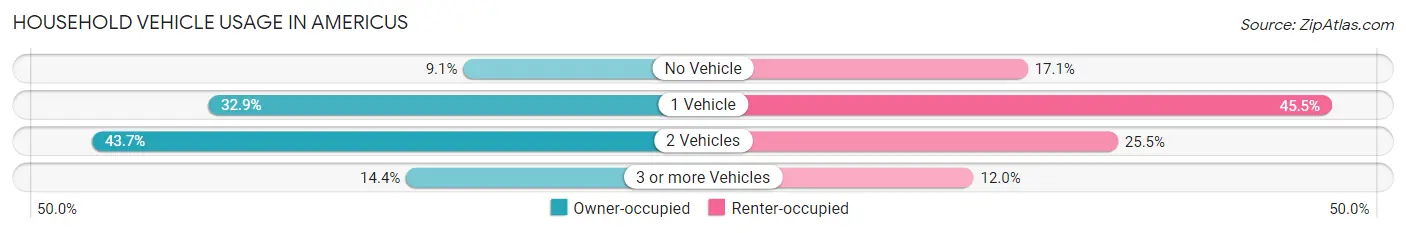
| Vehicles per Household | Owner-occupied | Renter-occupied |
| No Vehicle | 190 (9.0%) | 645 (17.1%) |
| 1 Vehicle | 690 (32.9%) | 1,718 (45.5%) |
| 2 Vehicles | 918 (43.7%) | 963 (25.5%) |
| 3 or more Vehicles | 302 (14.4%) | 454 (12.0%) |
| Total | 2,100 (100.0%) | 3,780 (100.0%) |
Real Estate & Mortgages in Americus
Real Estate and Mortgage Overview in Americus
| Characteristic | Without Mortgage | With Mortgage |
| Housing Units | 1,074 | 1,026 |
| Median Property Value | $122,200 | $116,500 |
| Median Household Income | $36,008 | $127 |
| Monthly Housing Costs | $482 | $34 |
| Real Estate Taxes | $1,342 | $33 |
Property Value by Mortgage Status in Americus
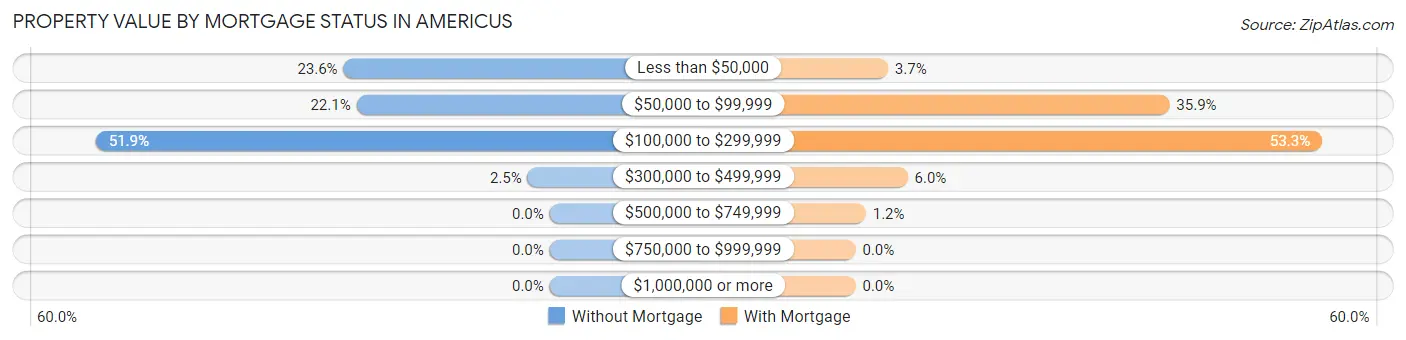
| Property Value | Without Mortgage | With Mortgage |
| Less than $50,000 | 253 (23.6%) | 38 (3.7%) |
| $50,000 to $99,999 | 237 (22.1%) | 368 (35.9%) |
| $100,000 to $299,999 | 557 (51.9%) | 547 (53.3%) |
| $300,000 to $499,999 | 27 (2.5%) | 61 (5.9%) |
| $500,000 to $749,999 | 0 (0.0%) | 12 (1.2%) |
| $750,000 to $999,999 | 0 (0.0%) | 0 (0.0%) |
| $1,000,000 or more | 0 (0.0%) | 0 (0.0%) |
| Total | 1,074 (100.0%) | 1,026 (100.0%) |
Household Income by Mortgage Status in Americus
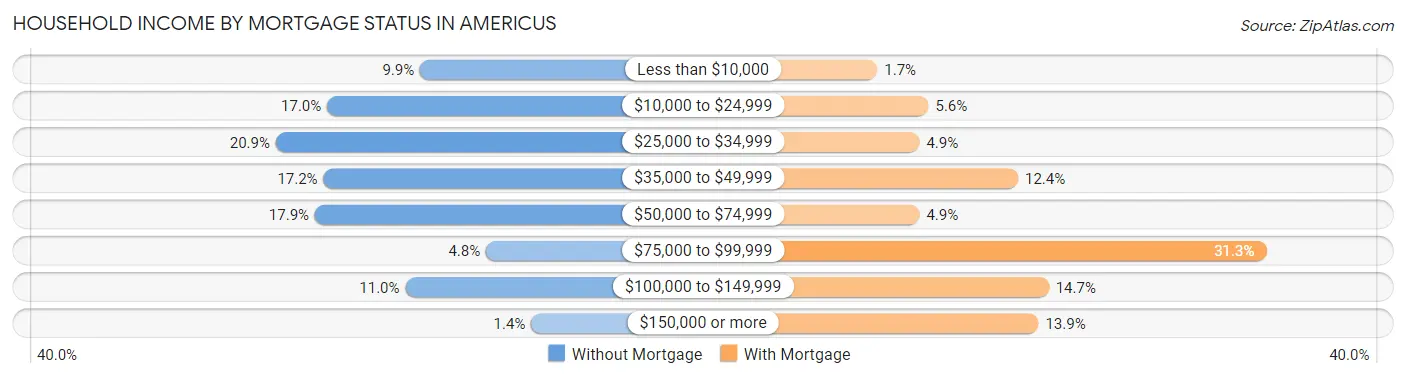
| Household Income | Without Mortgage | With Mortgage |
| Less than $10,000 | 106 (9.9%) | 17 (1.7%) |
| $10,000 to $24,999 | 182 (17.0%) | 57 (5.6%) |
| $25,000 to $34,999 | 224 (20.9%) | 50 (4.9%) |
| $35,000 to $49,999 | 185 (17.2%) | 127 (12.4%) |
| $50,000 to $74,999 | 192 (17.9%) | 50 (4.9%) |
| $75,000 to $99,999 | 52 (4.8%) | 321 (31.3%) |
| $100,000 to $149,999 | 118 (11.0%) | 151 (14.7%) |
| $150,000 or more | 15 (1.4%) | 143 (13.9%) |
| Total | 1,074 (100.0%) | 1,026 (100.0%) |
Property Value to Household Income Ratio in Americus
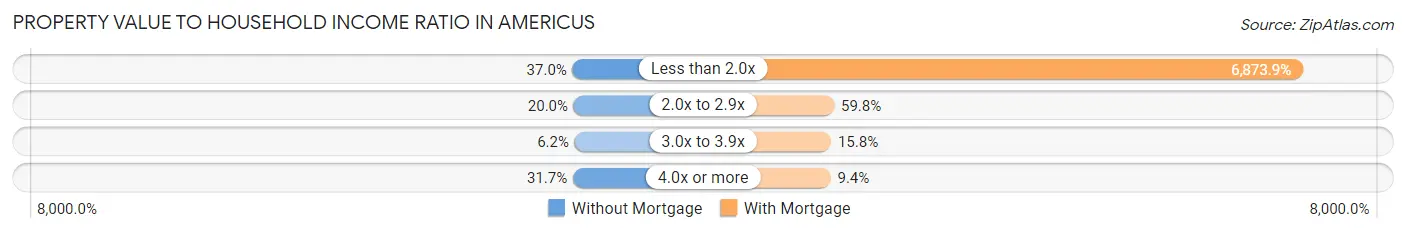
| Value-to-Income Ratio | Without Mortgage | With Mortgage |
| Less than 2.0x | 397 (37.0%) | 70,526 (6,873.9%) |
| 2.0x to 2.9x | 215 (20.0%) | 613 (59.8%) |
| 3.0x to 3.9x | 66 (6.1%) | 162 (15.8%) |
| 4.0x or more | 340 (31.7%) | 96 (9.4%) |
| Total | 1,074 (100.0%) | 1,026 (100.0%) |
Real Estate Taxes by Mortgage Status in Americus
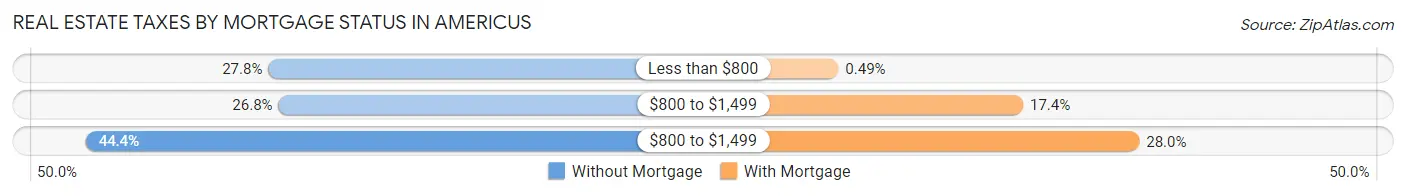
| Property Taxes | Without Mortgage | With Mortgage |
| Less than $800 | 298 (27.8%) | 5 (0.5%) |
| $800 to $1,499 | 288 (26.8%) | 178 (17.3%) |
| $800 to $1,499 | 477 (44.4%) | 287 (28.0%) |
| Total | 1,074 (100.0%) | 1,026 (100.0%) |
Health & Disability in Americus
Health Insurance Coverage by Age in Americus
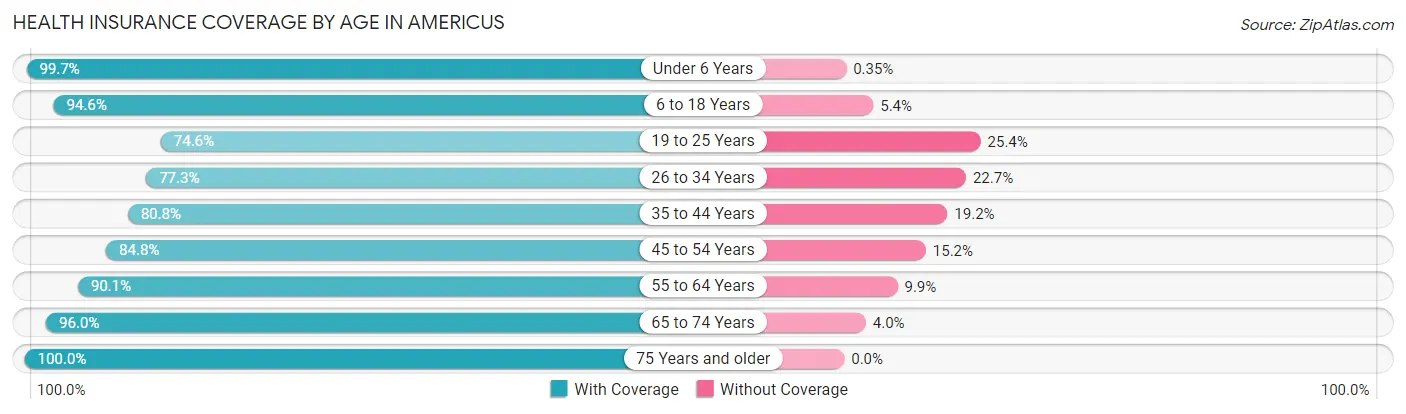
| Age Bracket | With Coverage | Without Coverage |
| Under 6 Years | 1,406 (99.7%) | 5 (0.4%) |
| 6 to 18 Years | 2,587 (94.6%) | 148 (5.4%) |
| 19 to 25 Years | 2,253 (74.6%) | 768 (25.4%) |
| 26 to 34 Years | 1,380 (77.3%) | 405 (22.7%) |
| 35 to 44 Years | 1,281 (80.8%) | 305 (19.2%) |
| 45 to 54 Years | 1,494 (84.8%) | 268 (15.2%) |
| 55 to 64 Years | 1,216 (90.1%) | 134 (9.9%) |
| 65 to 74 Years | 1,194 (96.0%) | 50 (4.0%) |
| 75 Years and older | 1,015 (100.0%) | 0 (0.0%) |
| Total | 13,826 (86.9%) | 2,083 (13.1%) |
Health Insurance Coverage by Citizenship Status in Americus
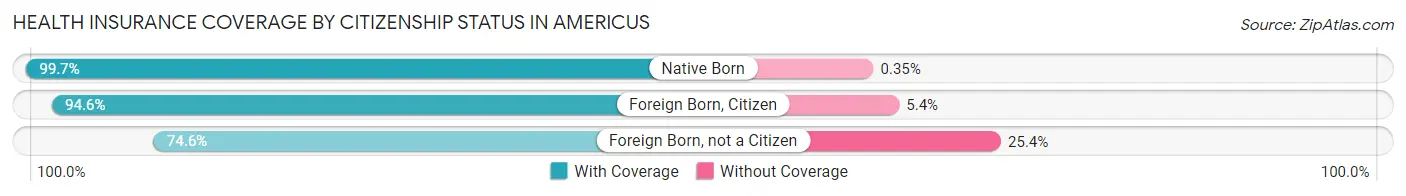
| Citizenship Status | With Coverage | Without Coverage |
| Native Born | 1,406 (99.7%) | 5 (0.4%) |
| Foreign Born, Citizen | 2,587 (94.6%) | 148 (5.4%) |
| Foreign Born, not a Citizen | 2,253 (74.6%) | 768 (25.4%) |
Health Insurance Coverage by Household Income in Americus
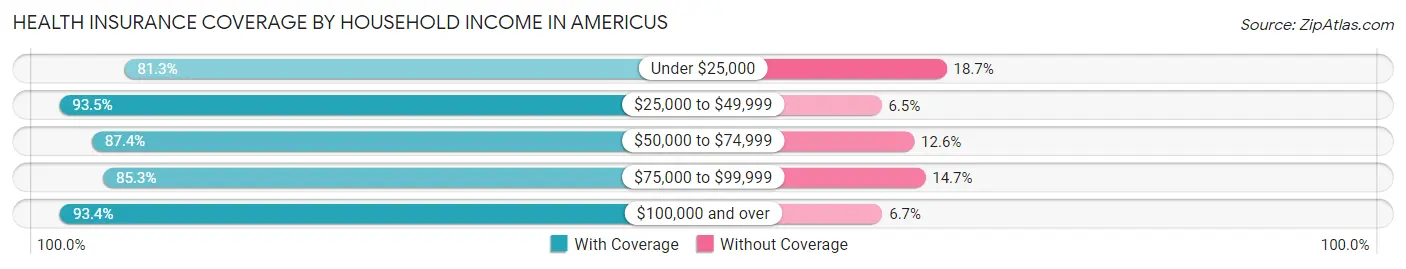
| Household Income | With Coverage | Without Coverage |
| Under $25,000 | 3,054 (81.3%) | 702 (18.7%) |
| $25,000 to $49,999 | 4,013 (93.5%) | 279 (6.5%) |
| $50,000 to $74,999 | 2,355 (87.4%) | 340 (12.6%) |
| $75,000 to $99,999 | 1,345 (85.3%) | 232 (14.7%) |
| $100,000 and over | 2,401 (93.3%) | 171 (6.7%) |
Public vs Private Health Insurance Coverage by Age in Americus
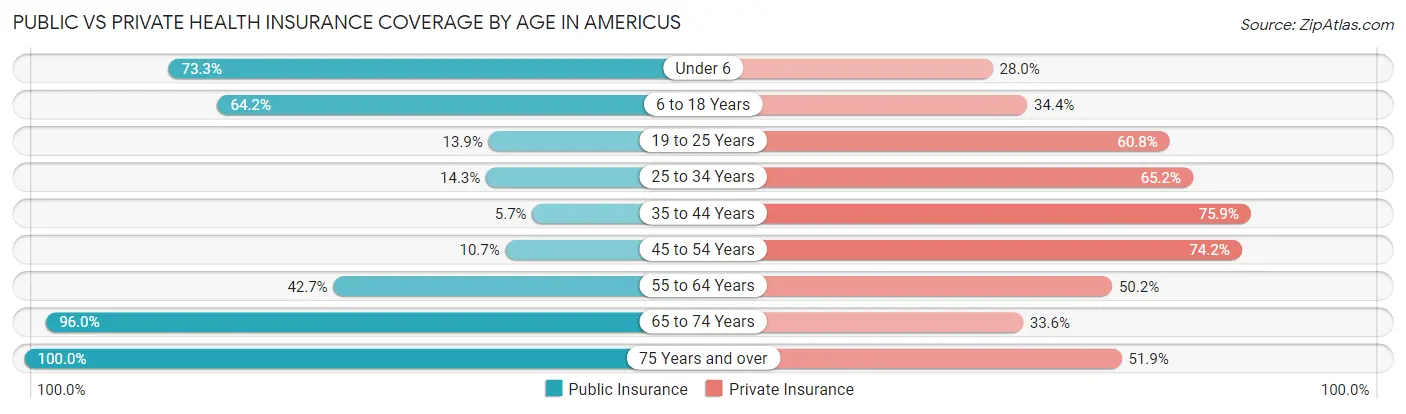
| Age Bracket | Public Insurance | Private Insurance |
| Under 6 | 1,034 (73.3%) | 395 (28.0%) |
| 6 to 18 Years | 1,755 (64.2%) | 941 (34.4%) |
| 19 to 25 Years | 419 (13.9%) | 1,838 (60.8%) |
| 25 to 34 Years | 256 (14.3%) | 1,163 (65.1%) |
| 35 to 44 Years | 91 (5.7%) | 1,204 (75.9%) |
| 45 to 54 Years | 189 (10.7%) | 1,307 (74.2%) |
| 55 to 64 Years | 576 (42.7%) | 677 (50.1%) |
| 65 to 74 Years | 1,194 (96.0%) | 418 (33.6%) |
| 75 Years and over | 1,015 (100.0%) | 527 (51.9%) |
| Total | 6,529 (41.0%) | 8,470 (53.2%) |
Disability Status by Sex by Age in Americus
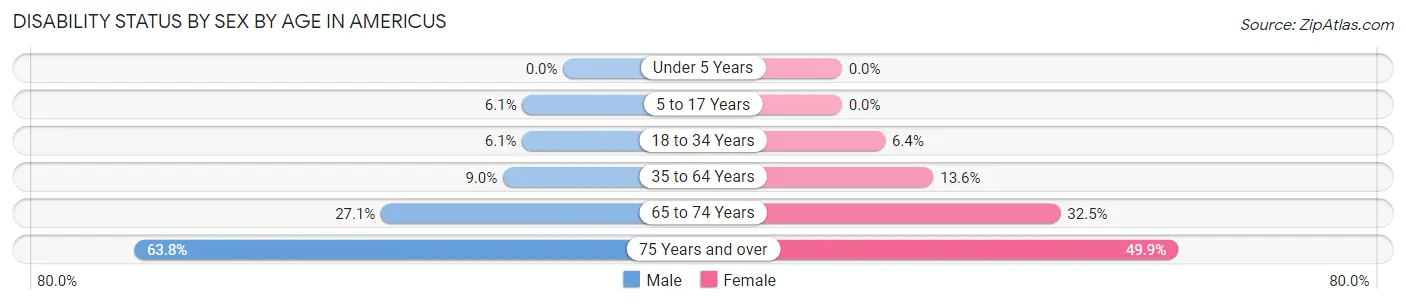
| Age Bracket | Male | Female |
| Under 5 Years | 0 (0.0%) | 0 (0.0%) |
| 5 to 17 Years | 88 (6.1%) | 0 (0.0%) |
| 18 to 34 Years | 117 (6.1%) | 200 (6.4%) |
| 35 to 64 Years | 221 (8.9%) | 303 (13.6%) |
| 65 to 74 Years | 109 (27.1%) | 273 (32.5%) |
| 75 Years and over | 241 (63.8%) | 318 (49.9%) |
Disability Class by Sex by Age in Americus
Disability Class: Hearing Difficulty
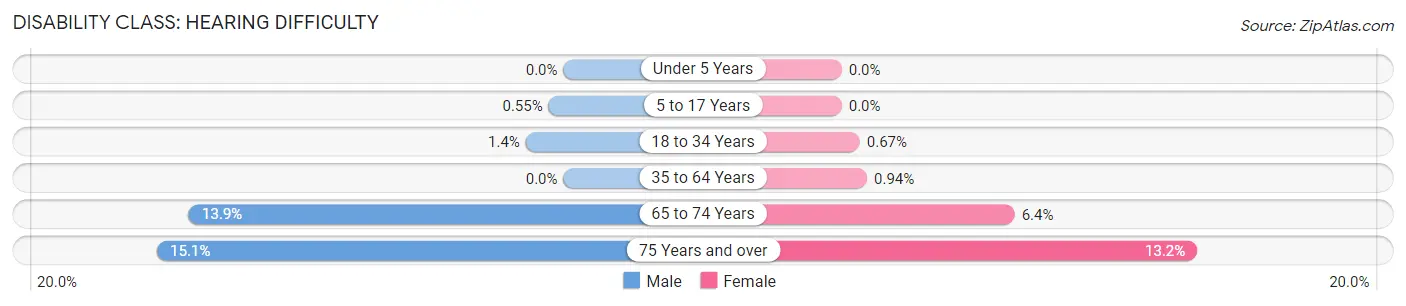
| Age Bracket | Male | Female |
| Under 5 Years | 0 (0.0%) | 0 (0.0%) |
| 5 to 17 Years | 8 (0.5%) | 0 (0.0%) |
| 18 to 34 Years | 27 (1.4%) | 21 (0.7%) |
| 35 to 64 Years | 0 (0.0%) | 21 (0.9%) |
| 65 to 74 Years | 56 (13.9%) | 54 (6.4%) |
| 75 Years and over | 57 (15.1%) | 84 (13.2%) |
Disability Class: Vision Difficulty
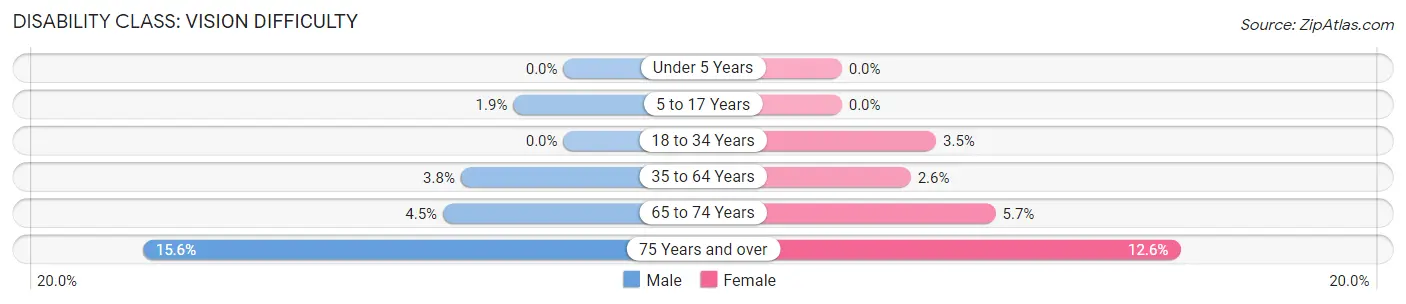
| Age Bracket | Male | Female |
| Under 5 Years | 0 (0.0%) | 0 (0.0%) |
| 5 to 17 Years | 27 (1.9%) | 0 (0.0%) |
| 18 to 34 Years | 0 (0.0%) | 109 (3.5%) |
| 35 to 64 Years | 94 (3.8%) | 57 (2.6%) |
| 65 to 74 Years | 18 (4.5%) | 48 (5.7%) |
| 75 Years and over | 59 (15.6%) | 80 (12.6%) |
Disability Class: Cognitive Difficulty
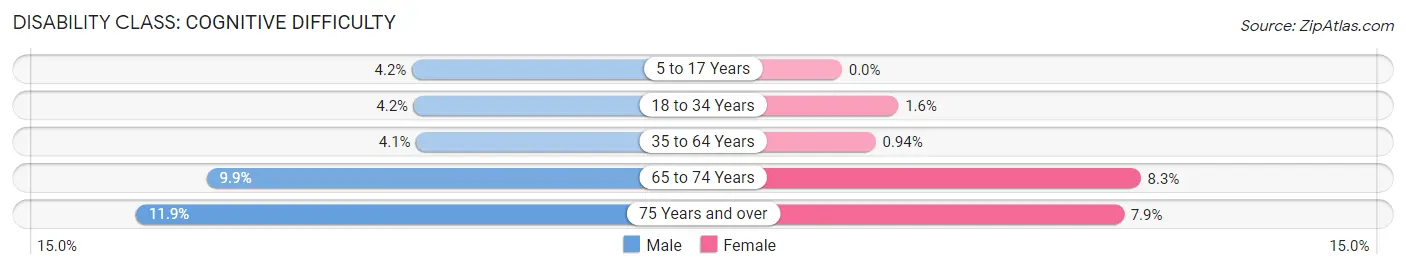
| Age Bracket | Male | Female |
| 5 to 17 Years | 61 (4.2%) | 0 (0.0%) |
| 18 to 34 Years | 80 (4.2%) | 49 (1.6%) |
| 35 to 64 Years | 101 (4.1%) | 21 (0.9%) |
| 65 to 74 Years | 40 (9.9%) | 70 (8.3%) |
| 75 Years and over | 45 (11.9%) | 50 (7.9%) |
Disability Class: Ambulatory Difficulty
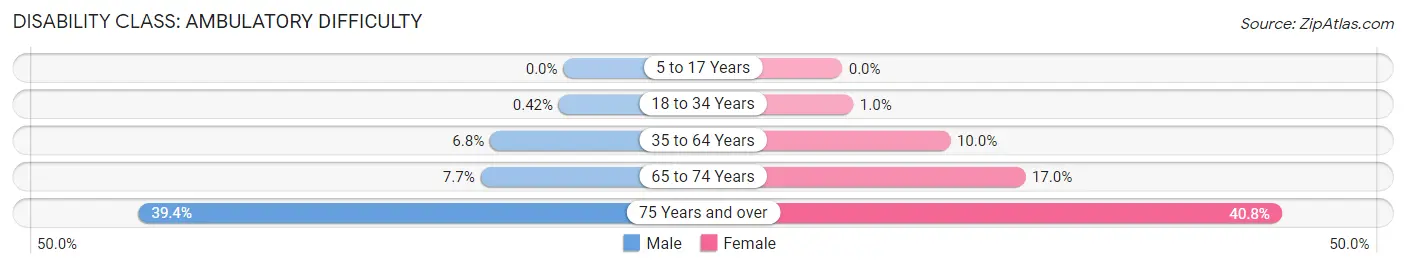
| Age Bracket | Male | Female |
| 5 to 17 Years | 0 (0.0%) | 0 (0.0%) |
| 18 to 34 Years | 8 (0.4%) | 32 (1.0%) |
| 35 to 64 Years | 168 (6.8%) | 224 (10.0%) |
| 65 to 74 Years | 31 (7.7%) | 143 (17.0%) |
| 75 Years and over | 149 (39.4%) | 260 (40.8%) |
Disability Class: Self-Care Difficulty
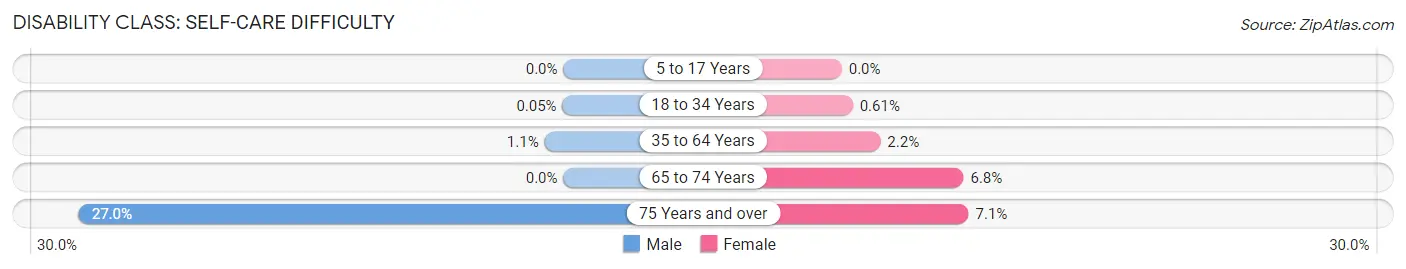
| Age Bracket | Male | Female |
| 5 to 17 Years | 0 (0.0%) | 0 (0.0%) |
| 18 to 34 Years | 1 (0.1%) | 19 (0.6%) |
| 35 to 64 Years | 26 (1.1%) | 48 (2.1%) |
| 65 to 74 Years | 0 (0.0%) | 57 (6.8%) |
| 75 Years and over | 102 (27.0%) | 45 (7.1%) |
Technology Access in Americus
Computing Device Access in Americus
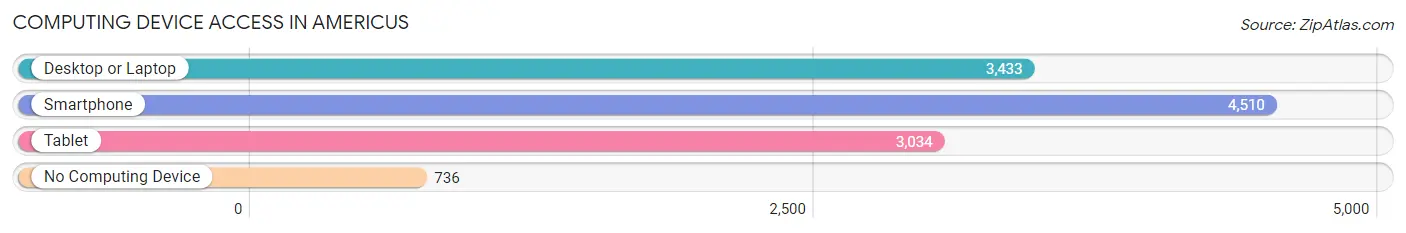
| Device Type | # Households | % Households |
| Desktop or Laptop | 3,433 | 58.4% |
| Smartphone | 4,510 | 76.7% |
| Tablet | 3,034 | 51.6% |
| No Computing Device | 736 | 12.5% |
| Total | 5,880 | 100.0% |
Internet Access in Americus
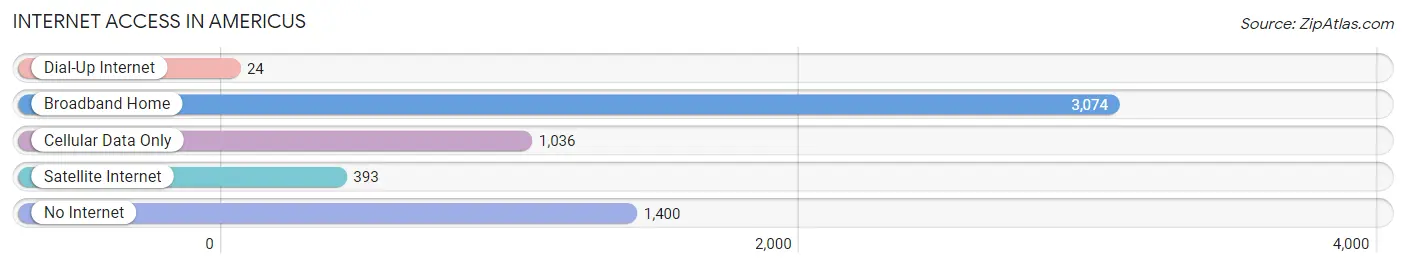
| Internet Type | # Households | % Households |
| Dial-Up Internet | 24 | 0.4% |
| Broadband Home | 3,074 | 52.3% |
| Cellular Data Only | 1,036 | 17.6% |
| Satellite Internet | 393 | 6.7% |
| No Internet | 1,400 | 23.8% |
| Total | 5,880 | 100.0% |
Americus Summary
Americus, Georgia is a city located in Sumter County, Georgia, United States. It is the county seat of Sumter County and the principal city of the Americus Micropolitan Statistical Area. The population of Americus was 17,041 as of the 2010 census.
History
Americus was founded in 1832 by General John Americus Smith, a native of South Carolina. He named the town after himself and it quickly became a thriving center of commerce and industry. The town was incorporated in 1854 and was the site of the first cotton mill in Georgia. During the Civil War, Americus was the site of the Battle of Americus, which was fought between Union and Confederate forces in 1864.
Geography
Americus is located at 32°4'25" North, 84°13'17" West (32.073611, -84.221389). The city is situated at the intersection of U.S. Route 280 and Georgia State Route 49. It is approximately 90 miles south of Atlanta and 50 miles north of Albany.
The city has a total area of 16.2 square miles, of which 16.1 square miles is land and 0.1 square miles is water. The city is located in the Flint River watershed and is surrounded by rolling hills and farmland.
Economy
Americus is a major center of commerce and industry in the region. The city is home to several large employers, including the Georgia Southwestern State University, the Sumter County School System, the Sumter County Hospital, and the Georgia Department of Corrections. The city is also home to several manufacturing companies, including the Americus Textile Company, the Americus Glass Company, and the Americus Furniture Company.
Demographics
As of the 2010 census, there were 17,041 people, 6,717 households, and 4,072 families residing in the city. The population density was 1,053.7 people per square mile. The racial makeup of the city was 54.2% White, 40.3% African American, 0.3% Native American, 1.7% Asian, 0.1% Pacific Islander, 1.7% from other races, and 1.9% from two or more races. Hispanic or Latino of any race were 4.2% of the population.
The median income for a household in the city was $30,912, and the median income for a family was $41,945. Males had a median income of $30,912 versus $25,912 for females. The per capita income for the city was $17,845. About 17.2% of families and 22.2% of the population were below the poverty line, including 33.2% of those under age 18 and 16.2% of those age 65 or over.
Common Questions
What is Per Capita Income in Americus?
Per Capita income in Americus is $20,626.
What is the Median Family Income in Americus?
Median Family Income in Americus is $56,059.
What is the Median Household income in Americus?
Median Household Income in Americus is $36,498.
What is Income or Wage Gap in Americus?
Income or Wage Gap in Americus is 15.4%.
Women in Americus earn 84.6 cents for every dollar earned by a man.
What is Family Income Deficit in Americus?
Family Income Deficit in Americus is $10,553.
Families that are below poverty line in Americus earn $10,553 less on average than the poverty threshold level.
What is Inequality or Gini Index in Americus?
Inequality or Gini Index in Americus is 0.46.
What is the Total Population of Americus?
Total Population of Americus is 16,020.
What is the Total Male Population of Americus?
Total Male Population of Americus is 7,211.
What is the Total Female Population of Americus?
Total Female Population of Americus is 8,809.
What is the Ratio of Males per 100 Females in Americus?
There are 81.86 Males per 100 Females in Americus.
What is the Ratio of Females per 100 Males in Americus?
There are 122.16 Females per 100 Males in Americus.
What is the Median Population Age in Americus?
Median Population Age in Americus is 29.4 Years.
What is the Average Family Size in Americus
Average Family Size in Americus is 3.6 People.
What is the Average Household Size in Americus
Average Household Size in Americus is 2.5 People.
How Large is the Labor Force in Americus?
There are 7,443 People in the Labor Forcein in Americus.
What is the Percentage of People in the Labor Force in Americus?
60.5% of People are in the Labor Force in Americus.
What is the Unemployment Rate in Americus?
Unemployment Rate in Americus is 6.8%.