Zip Codes with the Highest Percentage of Population Employed in Computer & Mathematics in Orlando, FL

RELATED REPORTS & OPTIONS

Computer & Mathematics
Population
Families and Households
Female Fertility
Female Fertility (Unmarried)
Race (Community Size)
Race (Percentage)
Ancestry (Community Size)
AfricanAlbanianAmericanApacheArabArgentineanArmenianAustralianAustrianBahamianBangladeshiBarbadianBasqueBelgianBelizeanBermudanBhutaneseBlackfeetBolivianBrazilianBritishBritish West IndianBulgarianBurmeseCajunCanadianCape VerdeanCelticCentral AmericanCentral American IndianCherokeeChickasawChileanChippewaChoctawColombianComancheCosta RicanCreekCroatianCubanCypriotCzechCzechoslovakianDanishDelawareDominicanDutchEastern EuropeanEcuadorianEgyptianEnglishEthiopianEuropeanFijianFilipinoFinnishFrenchFrench American IndianFrench CanadianGermanGhanaianGreekGuamanian / ChamorroGuatemalanGuyaneseHaitianHonduranHungarianIcelanderIndian (Asian)IndonesianIranianIraqiIrishIroquoisIsraeliItalianJamaicanJapaneseJordanianKenyanKoreanLaotianLatvianLebaneseLiberianLithuanianLuxembourgerMacedonianMalaysianMalteseMexicanMexican American IndianMongolianMoroccanNative HawaiianNavajoNew ZealanderNicaraguanNigerianNorthern EuropeanNorwegianOkinawanOsagePakistaniPalestinianPanamanianParaguayanPennsylvania GermanPeruvianPolishPortuguesePotawatomiPuebloPuerto RicanRomanianRussianSalvadoranSamoanScandinavianScotch-IrishScottishSeminoleSerbianSiouxSlavicSlovakSloveneSouth AfricanSouth AmericanSouth American IndianSpaniardSpanishSpanish AmericanSri LankanSubsaharan AfricanSwedishSwissSyrianThaiTrinidadian and TobagonianTurkishU.S. Virgin IslanderUkrainianUruguayanVenezuelanVietnameseWelshWest IndianYugoslavianZimbabwean
Ancestry (Percentage)
AfricanAlbanianAmericanApacheArabArgentineanArmenianAustralianAustrianBahamianBangladeshiBarbadianBasqueBelgianBelizeanBermudanBhutaneseBlackfeetBolivianBrazilianBritishBritish West IndianBulgarianBurmeseCajunCanadianCape VerdeanCelticCentral AmericanCentral American IndianCherokeeChickasawChileanChippewaChoctawColombianComancheCosta RicanCreekCroatianCubanCypriotCzechCzechoslovakianDanishDelawareDominicanDutchEastern EuropeanEcuadorianEgyptianEnglishEthiopianEuropeanFijianFilipinoFinnishFrenchFrench American IndianFrench CanadianGermanGhanaianGreekGuamanian / ChamorroGuatemalanGuyaneseHaitianHonduranHungarianIcelanderIndian (Asian)IndonesianIranianIraqiIrishIroquoisIsraeliItalianJamaicanJapaneseJordanianKenyanKoreanLaotianLatvianLebaneseLiberianLithuanianLuxembourgerMacedonianMalaysianMalteseMexicanMexican American IndianMongolianMoroccanNative HawaiianNavajoNew ZealanderNicaraguanNigerianNorthern EuropeanNorwegianOkinawanOsagePakistaniPalestinianPanamanianParaguayanPennsylvania GermanPeruvianPolishPortuguesePotawatomiPuebloPuerto RicanRomanianRussianSalvadoranSamoanScandinavianScotch-IrishScottishSeminoleSerbianSiouxSlavicSlovakSloveneSouth AfricanSouth AmericanSouth American IndianSpaniardSpanishSpanish AmericanSri LankanSubsaharan AfricanSwedishSwissSyrianThaiTrinidadian and TobagonianTurkishU.S. Virgin IslanderUkrainianUruguayanVenezuelanVietnameseWelshWest IndianYugoslavianZimbabwean
Immigrant Origin (Total)
AfricaAlbaniaArgentinaAsiaAustraliaAustriaAzoresBahamasBangladeshBarbadosBelarusBelgiumBelizeBoliviaBosnia and HerzegovinaBrazilBulgariaBurma / MyanmarCambodiaCameroonCanadaCaribbeanCentral AmericaChileChinaColombiaCosta RicaCroatiaCubaCzechoslovakiaDominicaDominican RepublicEastern AfricaEastern AsiaEastern EuropeEcuadorEgyptEl SalvadorEnglandEritreaEthiopiaEuropeFranceGermanyGhanaGreeceGrenadaGuatemalaGuyanaHaitiHondurasHong KongHungaryIndiaIndonesiaIranIraqIrelandIsraelItalyJamaicaJapanJordanKazakhstanKenyaKoreaKuwaitLaosLatin AmericaLatviaLebanonLiberiaLithuaniaMalaysiaMexicoMiddle AfricaMoldovaMoroccoNepalNetherlandsNicaraguaNigeriaNorthern AfricaNorthern EuropeNorwayOceaniaPakistanPanamaPeruPhilippinesPolandPortugalRomaniaRussiaSaudi ArabiaScotlandSerbiaSingaporeSouth AfricaSouth AmericaSouth Central AsiaSouth Eastern AsiaSouthern EuropeSpainSri LankaSt. Vincent and the GrenadinesSudanSwedenSwitzerlandSyriaTaiwanThailandTrinidad and TobagoTurkeyUkraineUruguayUzbekistanVenezuelaVietnamWest IndiesWestern AfricaWestern AsiaWestern EuropeZimbabwe
Immigrant Origin (Percentage)
AfricaAlbaniaArgentinaAsiaAustraliaAustriaAzoresBahamasBangladeshBarbadosBelarusBelgiumBelizeBoliviaBosnia and HerzegovinaBrazilBulgariaBurma / MyanmarCambodiaCameroonCanadaCaribbeanCentral AmericaChileChinaColombiaCosta RicaCroatiaCubaCzechoslovakiaDominicaDominican RepublicEastern AfricaEastern AsiaEastern EuropeEcuadorEgyptEl SalvadorEnglandEritreaEthiopiaEuropeFranceGermanyGhanaGreeceGrenadaGuatemalaGuyanaHaitiHondurasHong KongHungaryIndiaIndonesiaIranIraqIrelandIsraelItalyJamaicaJapanJordanKazakhstanKenyaKoreaKuwaitLaosLatin AmericaLatviaLebanonLiberiaLithuaniaMalaysiaMexicoMiddle AfricaMoldovaMoroccoNepalNetherlandsNicaraguaNigeriaNorthern AfricaNorthern EuropeNorwayOceaniaPakistanPanamaPeruPhilippinesPolandPortugalRomaniaRussiaSaudi ArabiaScotlandSerbiaSingaporeSouth AfricaSouth AmericaSouth Central AsiaSouth Eastern AsiaSouthern EuropeSpainSri LankaSt. Vincent and the GrenadinesSudanSwedenSwitzerlandSyriaTaiwanThailandTrinidad and TobagoTurkeyUkraineUruguayUzbekistanVenezuelaVietnamWest IndiesWestern AfricaWestern AsiaWestern EuropeZimbabwe
Income
Income (Families)
Income (Households)
Poverty
Poverty (Families)
Unemployment
Employment Occupations
Employment Industries
Employer Class
Commute Time
Commute Means
School Enrollment
Education by Degree Field
Occupancy
Finances
Physical Characteristics
Orlando
States
Florida Cities
Altamonte SpringsApopkaBoca RatonBonita SpringsBoynton BeachBradentonBrandonBrooksvilleCape CoralCasselberryClearwaterClermontCocoaCoral SpringsCrestviewCrystal RiverDade CityDavenportDaytona BeachDeerfield BeachDefuniak SpringsDelandDelray BeachDeltonaDunnellonEdgewaterEnglewoodEustisFort LauderdaleFort MyersFort PierceFort Walton BeachGainesvilleGulf BreezeHialeahHolidayHollywoodHomesteadHomosassaHudsonInvernessJacksonvilleJupiterKissimmeeLake CityLake WalesLake WorthLakelandLand O LakesLargoLeesburgLehigh AcresLive OakLongwoodLutzMariannaMelbourneMerritt IslandMiamiMiami BeachMiltonNaplesNew Port RicheyNew Smyrna BeachNorth Fort MyersNorth PortOcalaOkeechobeeOpa LockaOrange ParkOrlandoOrmond BeachOviedoPalm BayPalm Beach GardensPalm CoastPalm HarborPanama CityPanama City BeachPensacolaPinellas ParkPlant CityPompano BeachPort CharlottePort OrangePort Saint LuciePunta GordaRiverviewSaint AugustineSaint CloudSaint PetersburgSanfordSarasotaSebastianSebringSeminoleSpring HillStuartTallahasseeTampaTarpon SpringsThe VillagesTitusvilleValricoVeniceVero BeachWesley ChapelWest Palm BeachWinter HavenWinter ParkZephyrhills
Compare Zip Codes
Comparison Subject

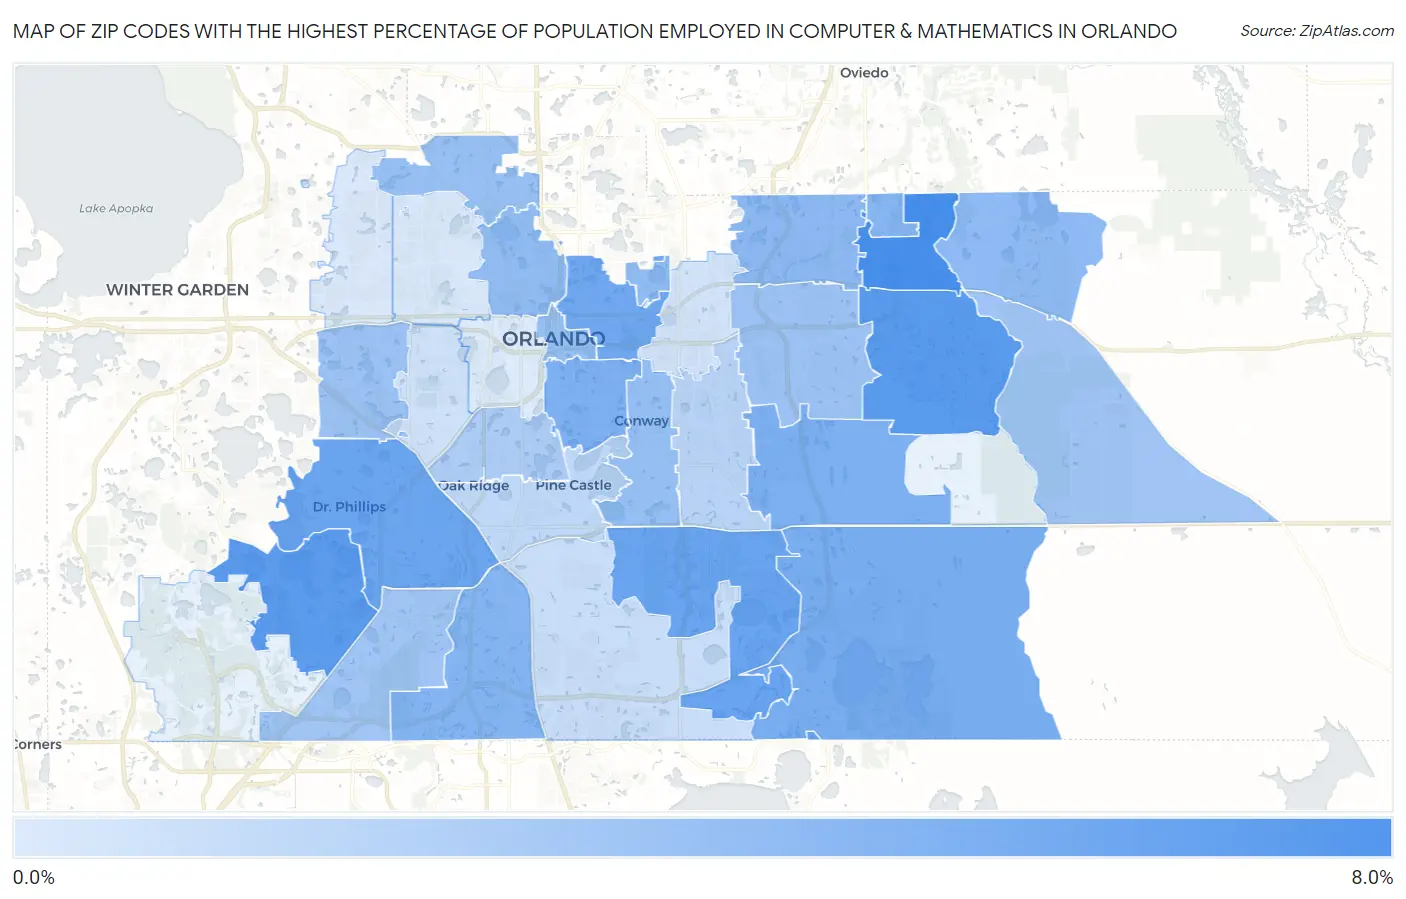
Map of Zip Codes with the Highest Percentage of Population Employed in Computer & Mathematics in Orlando

0.0%
8.0%
Zip Codes with the Highest Percentage of Population Employed in Computer & Mathematics in Orlando Map

Zip Codes with the Highest Percentage of Population Employed in Computer & Mathematics in Orlando, FL

Zip Code % Employed vs State vs National
1.328267.4%2.9%(+4.50)#203.5%(+3.88)#1,427
2.328286.7%2.9%(+3.75)#373.5%(+3.13)#1,829
3.328366.6%2.9%(+3.68)#383.5%(+3.07)#1,867
4.328275.9%2.9%(+3.00)#533.5%(+2.38)#2,405
5.328195.7%2.9%(+2.84)#623.5%(+2.22)#2,541
6.328035.5%2.9%(+2.62)#693.5%(+2.00)#2,750
7.328325.3%2.9%(+2.37)#803.5%(+1.75)#3,036
8.328295.1%2.9%(+2.18)#873.5%(+1.56)#3,248
9.328064.9%2.9%(+2.01)#1003.5%(+1.39)#3,479
10.328374.7%2.9%(+1.77)#1143.5%(+1.15)#3,828
11.328164.5%2.9%(+1.58)#1313.5%(+0.964)#4,095
12.328174.4%2.9%(+1.45)#1443.5%(+0.829)#4,337
13.328204.3%2.9%(+1.35)#1543.5%(+0.727)#4,514
14.328144.1%2.9%(+1.22)#1673.5%(+0.598)#4,769
15.328044.1%2.9%(+1.17)#1743.5%(+0.551)#4,866
16.328013.9%2.9%(+0.989)#2023.5%(+0.370)#5,263
17.328123.9%2.9%(+0.969)#2053.5%(+0.350)#5,301
18.328103.8%2.9%(+0.880)#2193.5%(+0.261)#5,521
19.328353.7%2.9%(+0.813)#2293.5%(+0.194)#5,675
20.328253.7%2.9%(+0.782)#2353.5%(+0.163)#5,761
21.328213.4%2.9%(+0.526)#2673.5%(-0.093)#6,392
22.328333.4%2.9%(+0.523)#2683.5%(-0.096)#6,396
23.328392.9%2.9%(+0.035)#3423.5%(-0.585)#7,967
24.328222.4%2.9%(-0.489)#4323.5%(-1.11)#9,972
25.328092.1%2.9%(-0.816)#4983.5%(-1.43)#11,392
26.328241.8%2.9%(-1.15)#5743.5%(-1.77)#12,963
27.328111.5%2.9%(-1.42)#6343.5%(-2.04)#14,467
28.328071.3%2.9%(-1.61)#6743.5%(-2.22)#15,523
29.328081.0%2.9%(-1.90)#7373.5%(-2.51)#17,311
30.328180.92%2.9%(-1.98)#7533.5%(-2.60)#17,890
31.328050.85%2.9%(-2.06)#7663.5%(-2.68)#18,345

Common Questions

What are the Top 10 Zip Codes with the Highest Percentage of Population Employed in Computer & Mathematics in Orlando, FL?
Top 10 Zip Codes with the Highest Percentage of Population Employed in Computer & Mathematics in Orlando, FL are:
#1
7.4%
#2
6.7%
#3
6.6%
#4
5.9%
#5
5.7%
#6
5.5%
#7
5.3%
#8
5.1%
#9
4.9%
#10
4.7%
What zip code has the Highest Percentage of Population Employed in Computer & Mathematics in Orlando, FL?
32826 has the Highest Percentage of Population Employed in Computer & Mathematics in Orlando, FL with 7.4%.
What is the Percentage of Population Employed in Computer & Mathematics in Orlando, FL?
Percentage of Population Employed in Computer & Mathematics in Orlando is 3.4%.
What is the Percentage of Population Employed in Computer & Mathematics in Florida?
Percentage of Population Employed in Computer & Mathematics in Florida is 2.9%.
What is the Percentage of Population Employed in Computer & Mathematics in the United States?
Percentage of Population Employed in Computer & Mathematics in the United States is 3.5%.