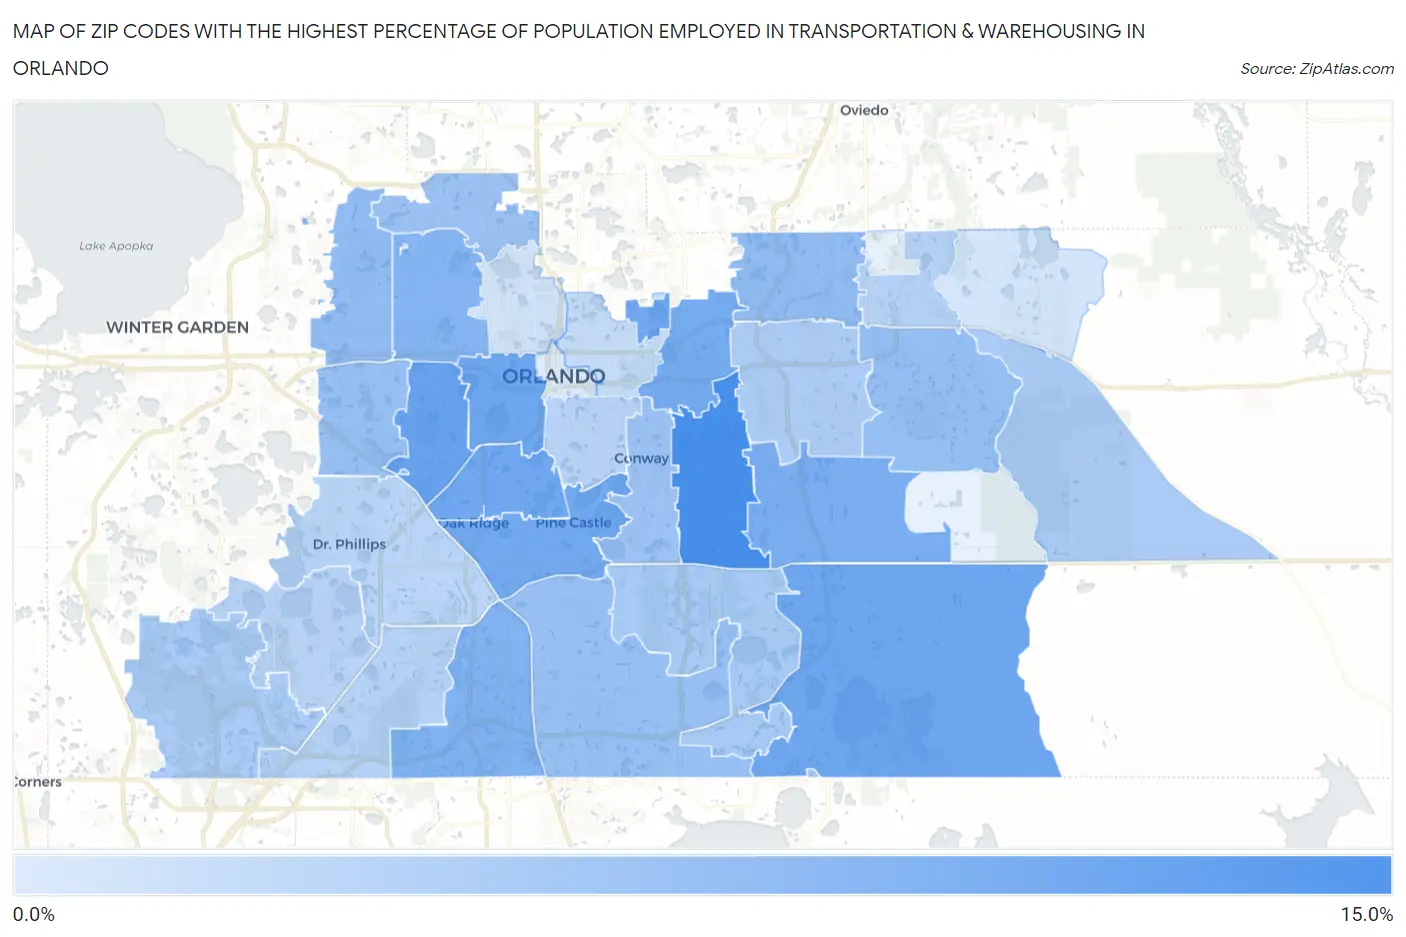
Zip Codes with the Highest Percentage of Population Employed in Transportation & Warehousing in Orlando, FL
RELATED REPORTS & OPTIONS
Transportation & Warehousing
Orlando
Compare Zip Codes
Map of Zip Codes with the Highest Percentage of Population Employed in Transportation & Warehousing in Orlando
1.7%
11.5%
Zip Codes with the Highest Percentage of Population Employed in Transportation & Warehousing in Orlando, FL
| Zip Code | % Employed | vs State | vs National | |
| 1. | 32822 | 11.5% | 5.4%(+6.12)#29 | 4.9%(+6.56)#2,074 |
| 2. | 32811 | 9.3% | 5.4%(+3.96)#69 | 4.9%(+4.40)#3,363 |
| 3. | 32832 | 8.9% | 5.4%(+3.48)#82 | 4.9%(+3.91)#3,864 |
| 4. | 32805 | 8.9% | 5.4%(+3.47)#83 | 4.9%(+3.91)#3,870 |
| 5. | 32839 | 8.8% | 5.4%(+3.40)#87 | 4.9%(+3.83)#3,953 |
| 6. | 32814 | 8.7% | 5.4%(+3.32)#92 | 4.9%(+3.75)#4,039 |
| 7. | 32809 | 8.5% | 5.4%(+3.15)#100 | 4.9%(+3.59)#4,236 |
| 8. | 32807 | 8.4% | 5.4%(+2.97)#109 | 4.9%(+3.40)#4,443 |
| 9. | 32829 | 8.2% | 5.4%(+2.78)#117 | 4.9%(+3.21)#4,688 |
| 10. | 32837 | 7.7% | 5.4%(+2.32)#142 | 4.9%(+2.76)#5,313 |
| 11. | 32808 | 7.3% | 5.4%(+1.89)#164 | 4.9%(+2.32)#6,068 |
| 12. | 32817 | 6.6% | 5.4%(+1.20)#208 | 4.9%(+1.64)#7,407 |
| 13. | 32818 | 6.5% | 5.4%(+1.13)#212 | 4.9%(+1.56)#7,555 |
| 14. | 32828 | 6.3% | 5.4%(+0.946)#225 | 4.9%(+1.38)#7,985 |
| 15. | 32824 | 6.2% | 5.4%(+0.815)#235 | 4.9%(+1.25)#8,291 |
| 16. | 32835 | 6.2% | 5.4%(+0.772)#238 | 4.9%(+1.21)#8,400 |
| 17. | 32810 | 6.0% | 5.4%(+0.574)#259 | 4.9%(+1.01)#8,895 |
| 18. | 32812 | 5.9% | 5.4%(+0.512)#262 | 4.9%(+0.947)#9,047 |
| 19. | 32827 | 5.1% | 5.4%(-0.237)#360 | 4.9%(+0.198)#11,453 |
| 20. | 32830 | 5.0% | 5.4%(-0.381)#382 | 4.9%(+0.054)#11,951 |
| 21. | 32833 | 4.9% | 5.4%(-0.480)#397 | 4.9%(-0.046)#12,276 |
| 22. | 32825 | 4.8% | 5.4%(-0.565)#406 | 4.9%(-0.131)#12,578 |
| 23. | 32821 | 4.2% | 5.4%(-1.14)#472 | 4.9%(-0.708)#14,856 |
| 24. | 32826 | 4.2% | 5.4%(-1.16)#476 | 4.9%(-0.728)#14,944 |
| 25. | 32836 | 4.1% | 5.4%(-1.27)#494 | 4.9%(-0.832)#15,403 |
| 26. | 32806 | 4.0% | 5.4%(-1.34)#509 | 4.9%(-0.907)#15,737 |
| 27. | 32819 | 4.0% | 5.4%(-1.41)#522 | 4.9%(-0.973)#16,024 |
| 28. | 32803 | 3.2% | 5.4%(-2.19)#668 | 4.9%(-1.76)#19,426 |
| 29. | 32804 | 2.5% | 5.4%(-2.92)#765 | 4.9%(-2.49)#22,583 |
| 30. | 32820 | 2.3% | 5.4%(-3.11)#792 | 4.9%(-2.68)#23,307 |
| 31. | 32801 | 1.7% | 5.4%(-3.65)#850 | 4.9%(-3.21)#25,171 |
1
Common Questions
What are the Top 10 Zip Codes with the Highest Percentage of Population Employed in Transportation & Warehousing in Orlando, FL?
Top 10 Zip Codes with the Highest Percentage of Population Employed in Transportation & Warehousing in Orlando, FL are:
What zip code has the Highest Percentage of Population Employed in Transportation & Warehousing in Orlando, FL?
32822 has the Highest Percentage of Population Employed in Transportation & Warehousing in Orlando, FL with 11.5%.
What is the Percentage of Population Employed in Transportation & Warehousing in Orlando, FL?
Percentage of Population Employed in Transportation & Warehousing in Orlando is 7.4%.
What is the Percentage of Population Employed in Transportation & Warehousing in Florida?
Percentage of Population Employed in Transportation & Warehousing in Florida is 5.4%.
What is the Percentage of Population Employed in Transportation & Warehousing in the United States?
Percentage of Population Employed in Transportation & Warehousing in the United States is 4.9%.