Zimbabwean vs Immigrants from Bolivia Divorced or Separated
COMPARE
Zimbabwean
Immigrants from Bolivia
Divorced or Separated
Divorced or Separated Comparison
Zimbabweans
Immigrants from Bolivia
11.6%
DIVORCED OR SEPARATED
99.0/ 100
METRIC RATING
90th/ 347
METRIC RANK
11.3%
DIVORCED OR SEPARATED
100.0/ 100
METRIC RATING
51st/ 347
METRIC RANK
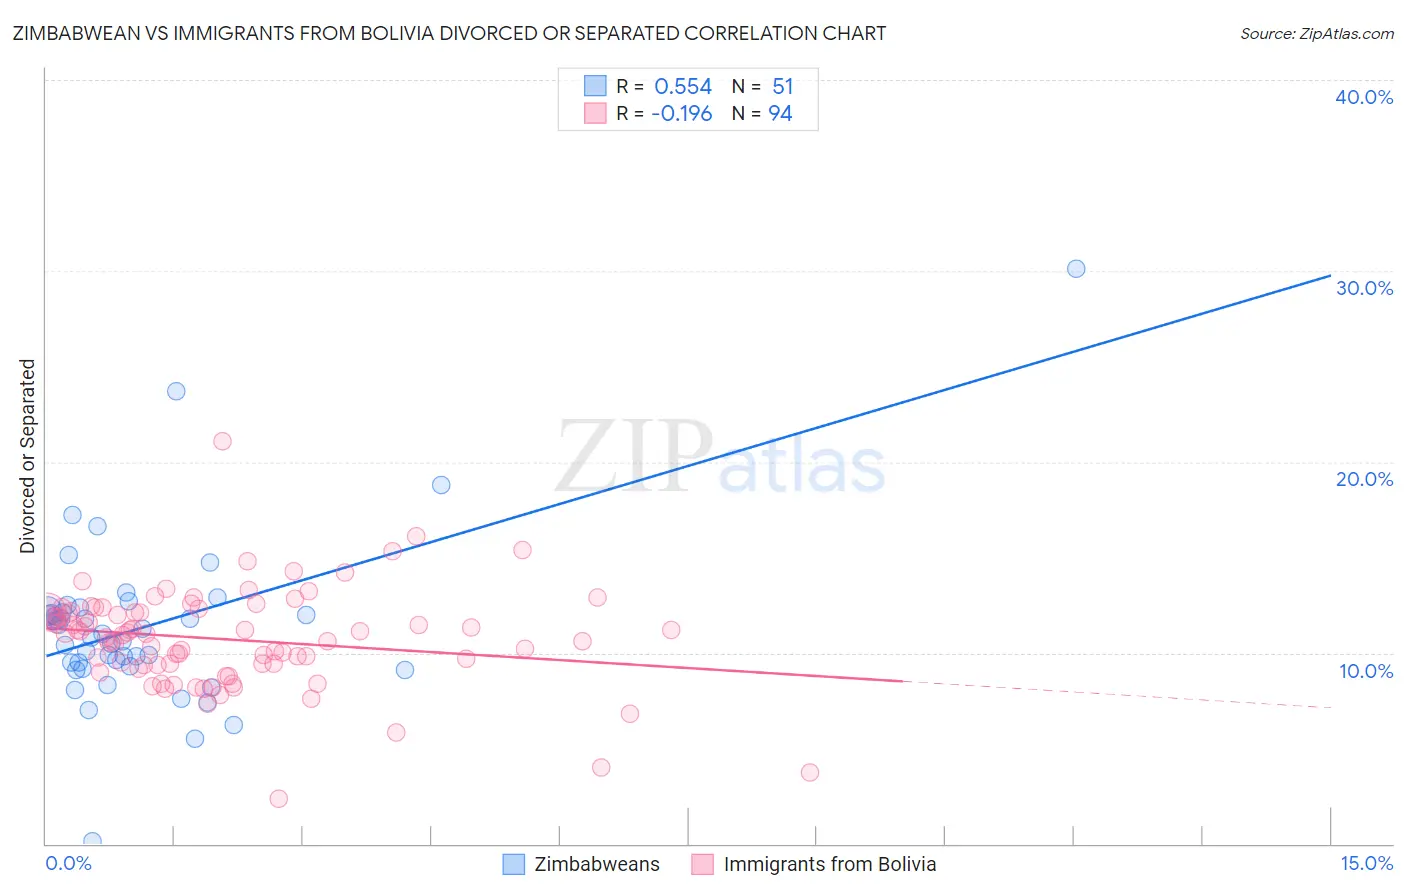
Zimbabwean vs Immigrants from Bolivia Divorced or Separated Correlation Chart
The statistical analysis conducted on geographies consisting of 69,193,915 people shows a substantial positive correlation between the proportion of Zimbabweans and percentage of population currently divorced or separated in the United States with a correlation coefficient (R) of 0.554 and weighted average of 11.6%. Similarly, the statistical analysis conducted on geographies consisting of 158,719,701 people shows a poor negative correlation between the proportion of Immigrants from Bolivia and percentage of population currently divorced or separated in the United States with a correlation coefficient (R) of -0.196 and weighted average of 11.3%, a difference of 2.9%.
Divorced or Separated Correlation Summary
| Measurement | Zimbabwean | Immigrants from Bolivia |
| Minimum | 0.10% | 2.4% |
| Maximum | 30.1% | 21.1% |
| Range | 30.0% | 18.7% |
| Mean | 11.4% | 10.7% |
| Median | 11.0% | 11.0% |
| Interquartile 25% (IQ1) | 9.3% | 9.4% |
| Interquartile 75% (IQ3) | 12.2% | 12.1% |
| Interquartile Range (IQR) | 2.9% | 2.8% |
| Standard Deviation (Sample) | 4.4% | 2.6% |
| Standard Deviation (Population) | 4.4% | 2.6% |
Similar Demographics by Divorced or Separated
Demographics Similar to Zimbabweans by Divorced or Separated
In terms of divorced or separated, the demographic groups most similar to Zimbabweans are Spanish American Indian (11.6%, a difference of 0.040%), Immigrants from Southern Europe (11.6%, a difference of 0.10%), Immigrants from Denmark (11.6%, a difference of 0.10%), Arab (11.6%, a difference of 0.10%), and Immigrants from Fiji (11.6%, a difference of 0.11%).
| Demographics | Rating | Rank | Divorced or Separated |
| Immigrants | Bulgaria | 99.3 /100 | #83 | Exceptional 11.5% |
| Bulgarians | 99.3 /100 | #84 | Exceptional 11.5% |
| Immigrants | Albania | 99.3 /100 | #85 | Exceptional 11.5% |
| Immigrants | Latvia | 99.2 /100 | #86 | Exceptional 11.6% |
| Immigrants | Nepal | 99.2 /100 | #87 | Exceptional 11.6% |
| Immigrants | Europe | 99.2 /100 | #88 | Exceptional 11.6% |
| Immigrants | Southern Europe | 99.1 /100 | #89 | Exceptional 11.6% |
| Zimbabweans | 99.0 /100 | #90 | Exceptional 11.6% |
| Spanish American Indians | 99.0 /100 | #91 | Exceptional 11.6% |
| Immigrants | Denmark | 98.9 /100 | #92 | Exceptional 11.6% |
| Arabs | 98.9 /100 | #93 | Exceptional 11.6% |
| Immigrants | Fiji | 98.9 /100 | #94 | Exceptional 11.6% |
| Immigrants | Serbia | 98.8 /100 | #95 | Exceptional 11.6% |
| Immigrants | Ukraine | 98.7 /100 | #96 | Exceptional 11.6% |
| Latvians | 98.7 /100 | #97 | Exceptional 11.6% |
Demographics Similar to Immigrants from Bolivia by Divorced or Separated
In terms of divorced or separated, the demographic groups most similar to Immigrants from Bolivia are Immigrants from Australia (11.3%, a difference of 0.11%), Bolivian (11.2%, a difference of 0.30%), Immigrants from Lithuania (11.3%, a difference of 0.33%), Immigrants from Saudi Arabia (11.2%, a difference of 0.36%), and Immigrants from Turkey (11.2%, a difference of 0.37%).
| Demographics | Rating | Rank | Divorced or Separated |
| Immigrants | Western Asia | 100.0 /100 | #44 | Exceptional 11.2% |
| Turks | 100.0 /100 | #45 | Exceptional 11.2% |
| Laotians | 100.0 /100 | #46 | Exceptional 11.2% |
| Immigrants | Poland | 100.0 /100 | #47 | Exceptional 11.2% |
| Immigrants | Turkey | 100.0 /100 | #48 | Exceptional 11.2% |
| Immigrants | Saudi Arabia | 100.0 /100 | #49 | Exceptional 11.2% |
| Bolivians | 100.0 /100 | #50 | Exceptional 11.2% |
| Immigrants | Bolivia | 100.0 /100 | #51 | Exceptional 11.3% |
| Immigrants | Australia | 99.9 /100 | #52 | Exceptional 11.3% |
| Immigrants | Lithuania | 99.9 /100 | #53 | Exceptional 11.3% |
| Eastern Europeans | 99.9 /100 | #54 | Exceptional 11.3% |
| Immigrants | Yemen | 99.9 /100 | #55 | Exceptional 11.3% |
| Immigrants | Philippines | 99.9 /100 | #56 | Exceptional 11.3% |
| Immigrants | Vietnam | 99.9 /100 | #57 | Exceptional 11.3% |
| Sri Lankans | 99.9 /100 | #58 | Exceptional 11.3% |