Yup'ik vs Immigrants from Western Europe Currently Married
COMPARE
Yup'ik
Immigrants from Western Europe
Currently Married
Currently Married Comparison
Yup'ik
Immigrants from Western Europe
39.9%
CURRENTLY MARRIED
0.0/ 100
METRIC RATING
333rd/ 347
METRIC RANK
47.6%
CURRENTLY MARRIED
91.1/ 100
METRIC RATING
112th/ 347
METRIC RANK
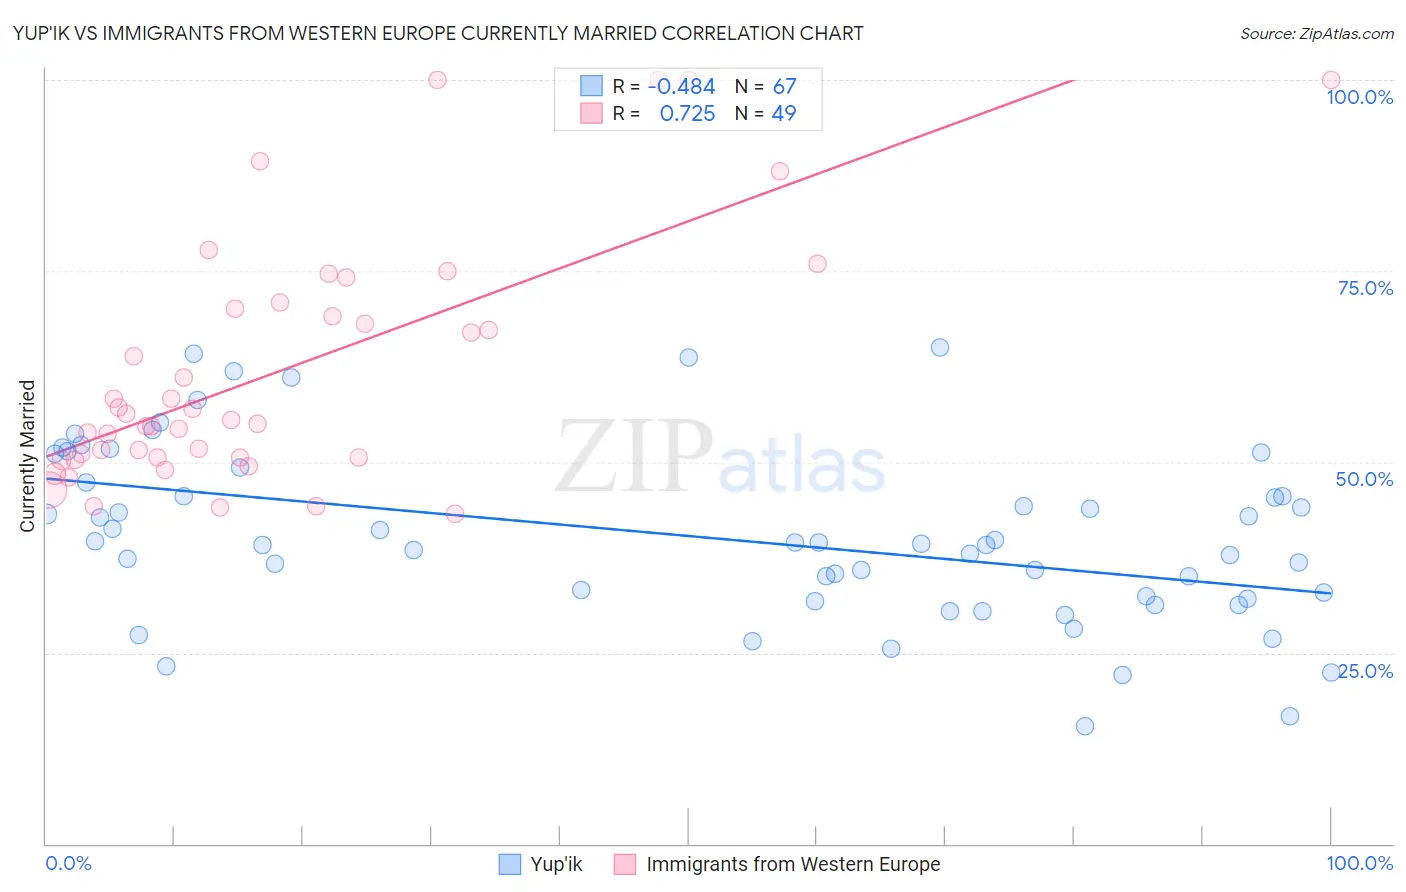
Yup'ik vs Immigrants from Western Europe Currently Married Correlation Chart
The statistical analysis conducted on geographies consisting of 39,963,234 people shows a moderate negative correlation between the proportion of Yup'ik and percentage of population currently married in the United States with a correlation coefficient (R) of -0.484 and weighted average of 39.9%. Similarly, the statistical analysis conducted on geographies consisting of 494,018,358 people shows a strong positive correlation between the proportion of Immigrants from Western Europe and percentage of population currently married in the United States with a correlation coefficient (R) of 0.725 and weighted average of 47.6%, a difference of 19.3%.
Currently Married Correlation Summary
| Measurement | Yup'ik | Immigrants from Western Europe |
| Minimum | 15.4% | 43.2% |
| Maximum | 65.0% | 100.0% |
| Range | 49.6% | 56.8% |
| Mean | 40.2% | 61.9% |
| Median | 39.2% | 55.4% |
| Interquartile 25% (IQ1) | 32.1% | 50.5% |
| Interquartile 75% (IQ3) | 47.3% | 70.5% |
| Interquartile Range (IQR) | 15.2% | 19.9% |
| Standard Deviation (Sample) | 11.4% | 16.0% |
| Standard Deviation (Population) | 11.3% | 15.8% |
Similar Demographics by Currently Married
Demographics Similar to Yup'ik by Currently Married
In terms of currently married, the demographic groups most similar to Yup'ik are Puerto Rican (39.9%, a difference of 0.010%), Lumbee (39.8%, a difference of 0.18%), British West Indian (39.8%, a difference of 0.35%), Immigrants from St. Vincent and the Grenadines (40.1%, a difference of 0.39%), and Black/African American (39.6%, a difference of 0.73%).
| Demographics | Rating | Rank | Currently Married |
| Barbadians | 0.0 /100 | #326 | Tragic 40.6% |
| Senegalese | 0.0 /100 | #327 | Tragic 40.6% |
| Arapaho | 0.0 /100 | #328 | Tragic 40.5% |
| Crow | 0.0 /100 | #329 | Tragic 40.4% |
| Immigrants | Dominica | 0.0 /100 | #330 | Tragic 40.3% |
| Immigrants | Barbados | 0.0 /100 | #331 | Tragic 40.3% |
| Immigrants | St. Vincent and the Grenadines | 0.0 /100 | #332 | Tragic 40.1% |
| Yup'ik | 0.0 /100 | #333 | Tragic 39.9% |
| Puerto Ricans | 0.0 /100 | #334 | Tragic 39.9% |
| Lumbee | 0.0 /100 | #335 | Tragic 39.8% |
| British West Indians | 0.0 /100 | #336 | Tragic 39.8% |
| Blacks/African Americans | 0.0 /100 | #337 | Tragic 39.6% |
| Cape Verdeans | 0.0 /100 | #338 | Tragic 39.6% |
| Dominicans | 0.0 /100 | #339 | Tragic 39.5% |
| Immigrants | Grenada | 0.0 /100 | #340 | Tragic 39.1% |
Demographics Similar to Immigrants from Western Europe by Currently Married
In terms of currently married, the demographic groups most similar to Immigrants from Western Europe are Immigrants from Hungary (47.6%, a difference of 0.010%), Immigrants from Denmark (47.6%, a difference of 0.030%), South African (47.6%, a difference of 0.060%), Immigrants from Indonesia (47.6%, a difference of 0.070%), and Palestinian (47.6%, a difference of 0.070%).
| Demographics | Rating | Rank | Currently Married |
| Immigrants | Singapore | 93.3 /100 | #105 | Exceptional 47.8% |
| Immigrants | Greece | 93.1 /100 | #106 | Exceptional 47.7% |
| Immigrants | Italy | 92.9 /100 | #107 | Exceptional 47.7% |
| Tsimshian | 92.4 /100 | #108 | Exceptional 47.7% |
| Immigrants | Egypt | 92.3 /100 | #109 | Exceptional 47.7% |
| Immigrants | Russia | 92.0 /100 | #110 | Exceptional 47.7% |
| Immigrants | Hungary | 91.2 /100 | #111 | Exceptional 47.6% |
| Immigrants | Western Europe | 91.1 /100 | #112 | Exceptional 47.6% |
| Immigrants | Denmark | 90.9 /100 | #113 | Exceptional 47.6% |
| South Africans | 90.5 /100 | #114 | Exceptional 47.6% |
| Immigrants | Indonesia | 90.5 /100 | #115 | Exceptional 47.6% |
| Palestinians | 90.4 /100 | #116 | Exceptional 47.6% |
| Puget Sound Salish | 90.3 /100 | #117 | Exceptional 47.6% |
| Immigrants | Philippines | 90.2 /100 | #118 | Exceptional 47.6% |
| Australians | 90.2 /100 | #119 | Exceptional 47.6% |