Yup'ik vs Immigrants from Uzbekistan Single Father Households
COMPARE
Yup'ik
Immigrants from Uzbekistan
Single Father Households
Single Father Households Comparison
Yup'ik
Immigrants from Uzbekistan
5.4%
SINGLE FATHER HOUSEHOLDS
0.0/ 100
METRIC RATING
347th/ 347
METRIC RANK
1.8%
SINGLE FATHER HOUSEHOLDS
100.0/ 100
METRIC RATING
4th/ 347
METRIC RANK
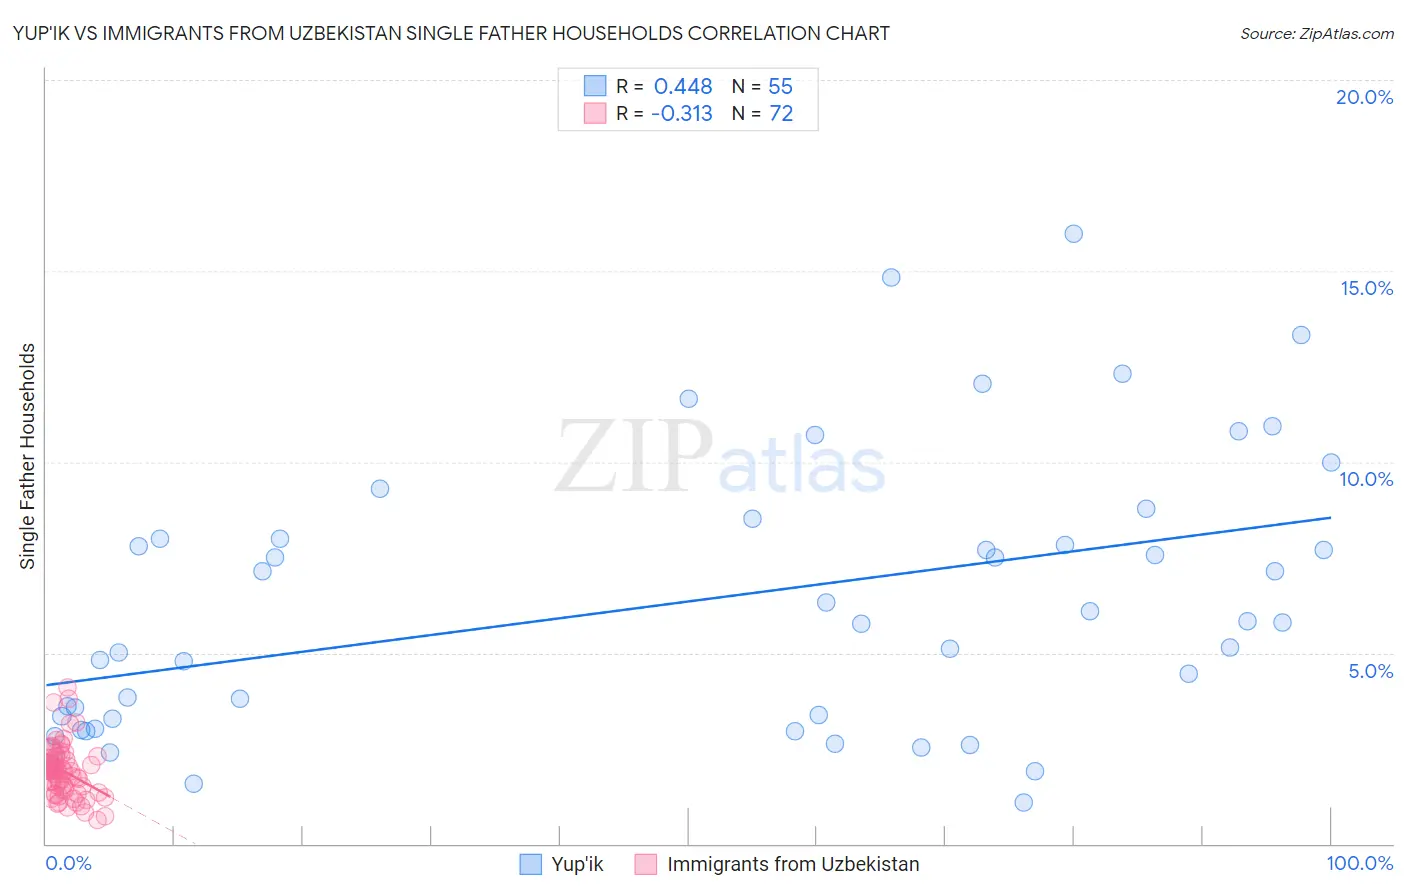
Yup'ik vs Immigrants from Uzbekistan Single Father Households Correlation Chart
The statistical analysis conducted on geographies consisting of 39,844,745 people shows a moderate positive correlation between the proportion of Yup'ik and percentage of single father households in the United States with a correlation coefficient (R) of 0.448 and weighted average of 5.4%. Similarly, the statistical analysis conducted on geographies consisting of 118,416,914 people shows a mild negative correlation between the proportion of Immigrants from Uzbekistan and percentage of single father households in the United States with a correlation coefficient (R) of -0.313 and weighted average of 1.8%, a difference of 196.6%.
Single Father Households Correlation Summary
| Measurement | Yup'ik | Immigrants from Uzbekistan |
| Minimum | 1.1% | 0.62% |
| Maximum | 16.0% | 4.1% |
| Range | 14.9% | 3.5% |
| Mean | 6.3% | 1.9% |
| Median | 5.8% | 1.9% |
| Interquartile 25% (IQ1) | 3.3% | 1.4% |
| Interquartile 75% (IQ3) | 8.0% | 2.2% |
| Interquartile Range (IQR) | 4.7% | 0.82% |
| Standard Deviation (Sample) | 3.6% | 0.68% |
| Standard Deviation (Population) | 3.5% | 0.68% |
Similar Demographics by Single Father Households
Demographics Similar to Yup'ik by Single Father Households
In terms of single father households, the demographic groups most similar to Yup'ik are Inupiat (4.9%, a difference of 10.7%), Menominee (4.2%, a difference of 27.7%), Yakama (4.2%, a difference of 28.6%), Pima (4.2%, a difference of 28.9%), and Tohono O'odham (3.8%, a difference of 40.8%).
| Demographics | Rating | Rank | Single Father Households |
| Natives/Alaskans | 0.0 /100 | #333 | Tragic 3.2% |
| Yuman | 0.0 /100 | #334 | Tragic 3.3% |
| Colville | 0.0 /100 | #335 | Tragic 3.3% |
| Paiute | 0.0 /100 | #336 | Tragic 3.3% |
| Pueblo | 0.0 /100 | #337 | Tragic 3.3% |
| Sioux | 0.0 /100 | #338 | Tragic 3.3% |
| Alaskan Athabascans | 0.0 /100 | #339 | Tragic 3.4% |
| Alaska Natives | 0.0 /100 | #340 | Tragic 3.5% |
| Crow | 0.0 /100 | #341 | Tragic 3.5% |
| Tohono O'odham | 0.0 /100 | #342 | Tragic 3.8% |
| Pima | 0.0 /100 | #343 | Tragic 4.2% |
| Yakama | 0.0 /100 | #344 | Tragic 4.2% |
| Menominee | 0.0 /100 | #345 | Tragic 4.2% |
| Inupiat | 0.0 /100 | #346 | Tragic 4.9% |
| Yup'ik | 0.0 /100 | #347 | Tragic 5.4% |
Demographics Similar to Immigrants from Uzbekistan by Single Father Households
In terms of single father households, the demographic groups most similar to Immigrants from Uzbekistan are Filipino (1.8%, a difference of 0.66%), Immigrants from Hong Kong (1.8%, a difference of 0.94%), Immigrants from Israel (1.8%, a difference of 1.1%), Soviet Union (1.8%, a difference of 1.1%), and Immigrants from Taiwan (1.8%, a difference of 1.3%).
| Demographics | Rating | Rank | Single Father Households |
| Soviet Union | 100.0 /100 | #1 | Exceptional 1.8% |
| Immigrants | Israel | 100.0 /100 | #2 | Exceptional 1.8% |
| Filipinos | 100.0 /100 | #3 | Exceptional 1.8% |
| Immigrants | Uzbekistan | 100.0 /100 | #4 | Exceptional 1.8% |
| Immigrants | Hong Kong | 100.0 /100 | #5 | Exceptional 1.8% |
| Immigrants | Taiwan | 100.0 /100 | #6 | Exceptional 1.8% |
| Cypriots | 100.0 /100 | #7 | Exceptional 1.8% |
| Immigrants | Ireland | 100.0 /100 | #8 | Exceptional 1.8% |
| Immigrants | China | 100.0 /100 | #9 | Exceptional 1.8% |
| Okinawans | 100.0 /100 | #10 | Exceptional 1.9% |
| Immigrants | Belarus | 100.0 /100 | #11 | Exceptional 1.9% |
| Immigrants | Greece | 100.0 /100 | #12 | Exceptional 1.9% |
| Immigrants | Singapore | 100.0 /100 | #13 | Exceptional 1.9% |
| Immigrants | Lithuania | 100.0 /100 | #14 | Exceptional 1.9% |
| Immigrants | Eastern Asia | 100.0 /100 | #15 | Exceptional 1.9% |