Yugoslavian vs Cape Verdean Single Father Households
COMPARE
Yugoslavian
Cape Verdean
Single Father Households
Single Father Households Comparison
Yugoslavians
Cape Verdeans
2.3%
SINGLE FATHER HOUSEHOLDS
43.9/ 100
METRIC RATING
180th/ 347
METRIC RANK
2.9%
SINGLE FATHER HOUSEHOLDS
0.0/ 100
METRIC RATING
318th/ 347
METRIC RANK
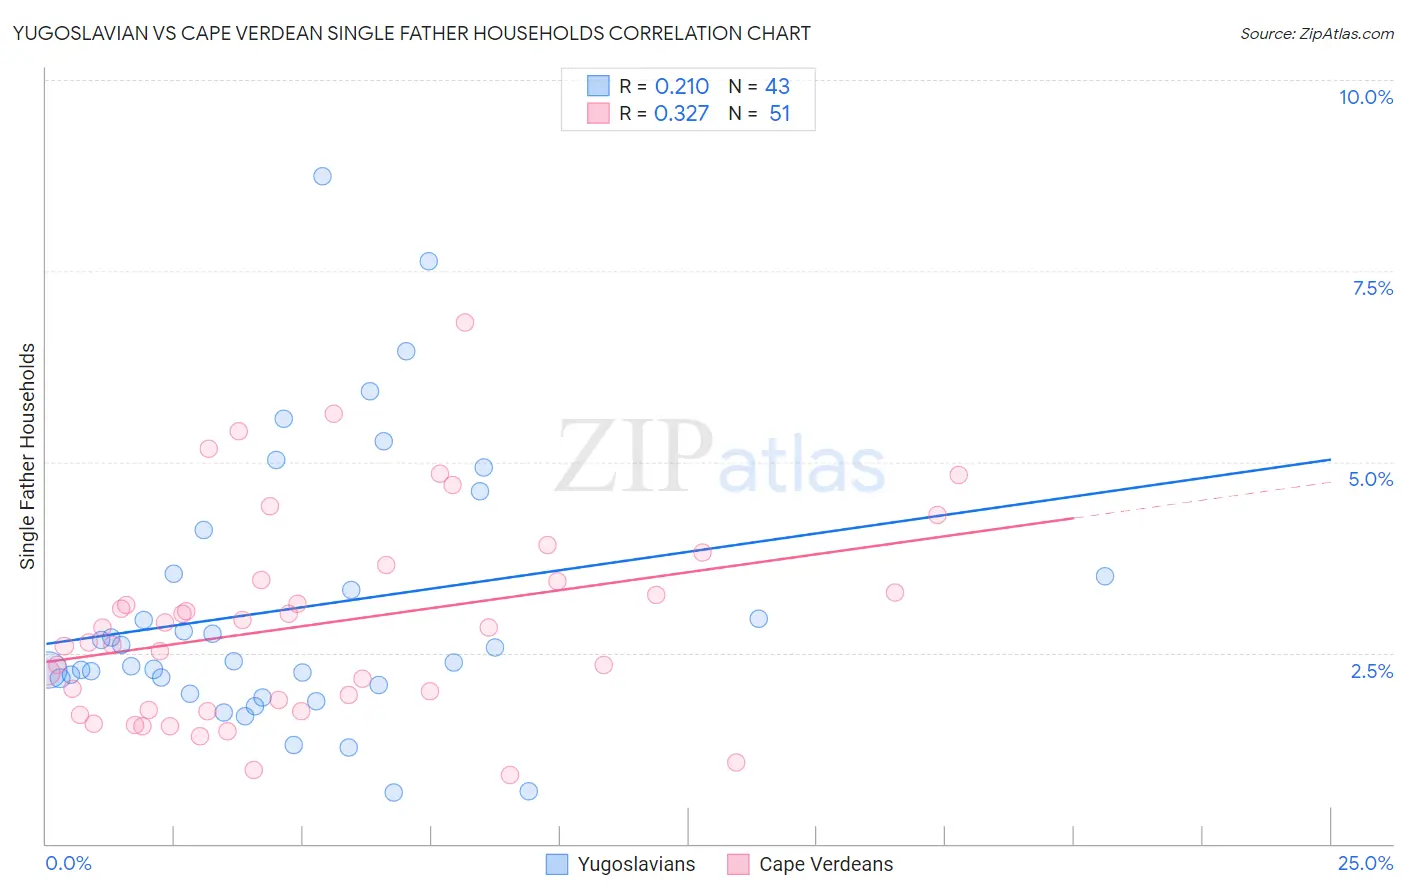
Yugoslavian vs Cape Verdean Single Father Households Correlation Chart
The statistical analysis conducted on geographies consisting of 284,087,326 people shows a weak positive correlation between the proportion of Yugoslavians and percentage of single father households in the United States with a correlation coefficient (R) of 0.210 and weighted average of 2.3%. Similarly, the statistical analysis conducted on geographies consisting of 107,168,631 people shows a mild positive correlation between the proportion of Cape Verdeans and percentage of single father households in the United States with a correlation coefficient (R) of 0.327 and weighted average of 2.9%, a difference of 25.5%.
Single Father Households Correlation Summary
| Measurement | Yugoslavian | Cape Verdean |
| Minimum | 0.67% | 0.90% |
| Maximum | 8.7% | 6.8% |
| Range | 8.1% | 5.9% |
| Mean | 3.1% | 2.9% |
| Median | 2.4% | 2.8% |
| Interquartile 25% (IQ1) | 2.1% | 1.8% |
| Interquartile 75% (IQ3) | 3.5% | 3.5% |
| Interquartile Range (IQR) | 1.5% | 1.7% |
| Standard Deviation (Sample) | 1.8% | 1.3% |
| Standard Deviation (Population) | 1.7% | 1.3% |
Similar Demographics by Single Father Households
Demographics Similar to Yugoslavians by Single Father Households
In terms of single father households, the demographic groups most similar to Yugoslavians are Welsh (2.3%, a difference of 0.010%), Costa Rican (2.3%, a difference of 0.020%), Jamaican (2.3%, a difference of 0.030%), Belgian (2.3%, a difference of 0.040%), and Immigrants from Panama (2.4%, a difference of 0.15%).
| Demographics | Rating | Rank | Single Father Households |
| Celtics | 55.4 /100 | #173 | Average 2.3% |
| Afghans | 50.0 /100 | #174 | Average 2.3% |
| Immigrants | Jamaica | 49.1 /100 | #175 | Average 2.3% |
| Danes | 48.2 /100 | #176 | Average 2.3% |
| Colombians | 48.0 /100 | #177 | Average 2.3% |
| Costa Ricans | 44.1 /100 | #178 | Average 2.3% |
| Welsh | 44.0 /100 | #179 | Average 2.3% |
| Yugoslavians | 43.9 /100 | #180 | Average 2.3% |
| Jamaicans | 43.5 /100 | #181 | Average 2.3% |
| Belgians | 43.3 /100 | #182 | Average 2.3% |
| Immigrants | Panama | 41.8 /100 | #183 | Average 2.4% |
| Sri Lankans | 41.8 /100 | #184 | Average 2.4% |
| Nigerians | 41.0 /100 | #185 | Average 2.4% |
| Immigrants | Bosnia and Herzegovina | 40.4 /100 | #186 | Average 2.4% |
| Immigrants | Colombia | 34.0 /100 | #187 | Fair 2.4% |
Demographics Similar to Cape Verdeans by Single Father Households
In terms of single father households, the demographic groups most similar to Cape Verdeans are Immigrants from El Salvador (2.9%, a difference of 0.010%), Ute (3.0%, a difference of 0.53%), Guatemalan (3.0%, a difference of 0.61%), Cheyenne (2.9%, a difference of 0.87%), and Houma (2.9%, a difference of 0.87%).
| Demographics | Rating | Rank | Single Father Households |
| Spanish American Indians | 0.0 /100 | #311 | Tragic 2.9% |
| Tsimshian | 0.0 /100 | #312 | Tragic 2.9% |
| Arapaho | 0.0 /100 | #313 | Tragic 2.9% |
| Salvadorans | 0.0 /100 | #314 | Tragic 2.9% |
| Cheyenne | 0.0 /100 | #315 | Tragic 2.9% |
| Houma | 0.0 /100 | #316 | Tragic 2.9% |
| Immigrants | El Salvador | 0.0 /100 | #317 | Tragic 2.9% |
| Cape Verdeans | 0.0 /100 | #318 | Tragic 2.9% |
| Ute | 0.0 /100 | #319 | Tragic 3.0% |
| Guatemalans | 0.0 /100 | #320 | Tragic 3.0% |
| Mexicans | 0.0 /100 | #321 | Tragic 3.0% |
| Immigrants | Guatemala | 0.0 /100 | #322 | Tragic 3.0% |
| Immigrants | Central America | 0.0 /100 | #323 | Tragic 3.0% |
| Fijians | 0.0 /100 | #324 | Tragic 3.0% |
| Immigrants | Mexico | 0.0 /100 | #325 | Tragic 3.0% |