Yaqui vs Bolivian Currently Married
COMPARE
Yaqui
Bolivian
Currently Married
Currently Married Comparison
Yaqui
Bolivians
43.4%
CURRENTLY MARRIED
0.1/ 100
METRIC RATING
273rd/ 347
METRIC RANK
48.1%
CURRENTLY MARRIED
96.9/ 100
METRIC RATING
83rd/ 347
METRIC RANK
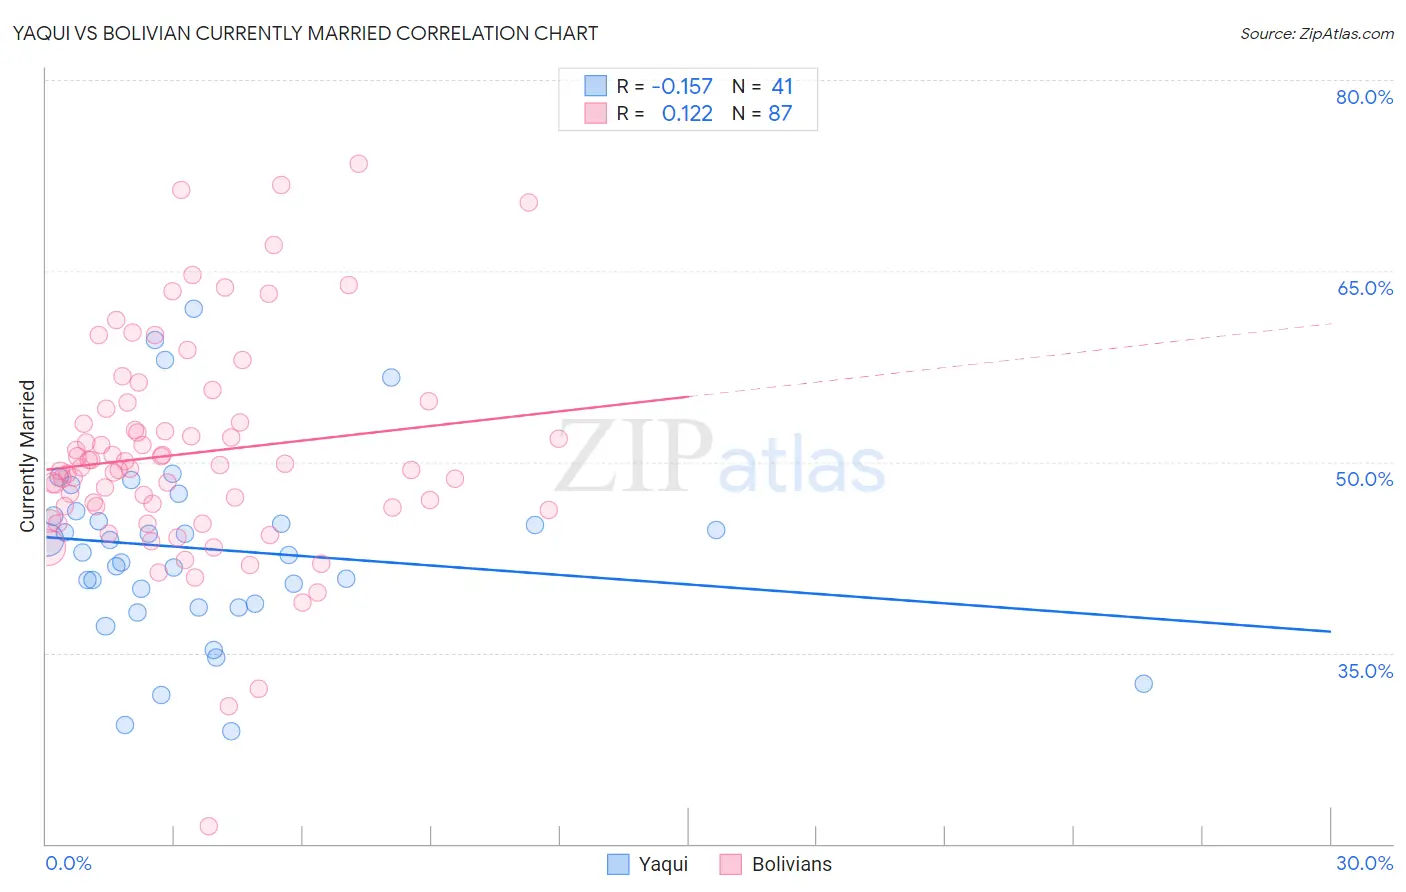
Yaqui vs Bolivian Currently Married Correlation Chart
The statistical analysis conducted on geographies consisting of 107,738,640 people shows a poor negative correlation between the proportion of Yaqui and percentage of population currently married in the United States with a correlation coefficient (R) of -0.157 and weighted average of 43.4%. Similarly, the statistical analysis conducted on geographies consisting of 184,673,558 people shows a poor positive correlation between the proportion of Bolivians and percentage of population currently married in the United States with a correlation coefficient (R) of 0.122 and weighted average of 48.1%, a difference of 10.7%.
Currently Married Correlation Summary
| Measurement | Yaqui | Bolivian |
| Minimum | 28.9% | 21.3% |
| Maximum | 62.0% | 73.4% |
| Range | 33.1% | 52.1% |
| Mean | 43.1% | 50.7% |
| Median | 42.9% | 49.6% |
| Interquartile 25% (IQ1) | 38.7% | 46.4% |
| Interquartile 75% (IQ3) | 45.9% | 54.2% |
| Interquartile Range (IQR) | 7.2% | 7.8% |
| Standard Deviation (Sample) | 7.3% | 8.6% |
| Standard Deviation (Population) | 7.2% | 8.6% |
Similar Demographics by Currently Married
Demographics Similar to Yaqui by Currently Married
In terms of currently married, the demographic groups most similar to Yaqui are Nigerian (43.4%, a difference of 0.020%), Indonesian (43.5%, a difference of 0.040%), Colville (43.4%, a difference of 0.040%), Sierra Leonean (43.4%, a difference of 0.070%), and Immigrants from Nigeria (43.4%, a difference of 0.070%).
| Demographics | Rating | Rank | Currently Married |
| Ecuadorians | 0.1 /100 | #266 | Tragic 43.6% |
| Immigrants | Eritrea | 0.1 /100 | #267 | Tragic 43.6% |
| Spanish American Indians | 0.1 /100 | #268 | Tragic 43.6% |
| Immigrants | Sudan | 0.1 /100 | #269 | Tragic 43.5% |
| Salvadorans | 0.1 /100 | #270 | Tragic 43.5% |
| Bermudans | 0.1 /100 | #271 | Tragic 43.5% |
| Indonesians | 0.1 /100 | #272 | Tragic 43.5% |
| Yaqui | 0.1 /100 | #273 | Tragic 43.4% |
| Nigerians | 0.1 /100 | #274 | Tragic 43.4% |
| Colville | 0.1 /100 | #275 | Tragic 43.4% |
| Sierra Leoneans | 0.1 /100 | #276 | Tragic 43.4% |
| Immigrants | Nigeria | 0.1 /100 | #277 | Tragic 43.4% |
| Central Americans | 0.0 /100 | #278 | Tragic 43.3% |
| Central American Indians | 0.0 /100 | #279 | Tragic 43.3% |
| Apache | 0.0 /100 | #280 | Tragic 43.2% |
Demographics Similar to Bolivians by Currently Married
In terms of currently married, the demographic groups most similar to Bolivians are Immigrants from Israel (48.1%, a difference of 0.0%), Immigrants from Poland (48.1%, a difference of 0.010%), Immigrants from Sri Lanka (48.1%, a difference of 0.010%), Immigrants from Europe (48.1%, a difference of 0.010%), and Immigrants from South Africa (48.1%, a difference of 0.050%).
| Demographics | Rating | Rank | Currently Married |
| Basques | 97.2 /100 | #76 | Exceptional 48.1% |
| Slovenes | 97.1 /100 | #77 | Exceptional 48.1% |
| Immigrants | Belgium | 97.1 /100 | #78 | Exceptional 48.1% |
| Immigrants | South Africa | 97.0 /100 | #79 | Exceptional 48.1% |
| Immigrants | Poland | 96.9 /100 | #80 | Exceptional 48.1% |
| Immigrants | Sri Lanka | 96.9 /100 | #81 | Exceptional 48.1% |
| Immigrants | Europe | 96.9 /100 | #82 | Exceptional 48.1% |
| Bolivians | 96.9 /100 | #83 | Exceptional 48.1% |
| Immigrants | Israel | 96.9 /100 | #84 | Exceptional 48.1% |
| French Canadians | 96.3 /100 | #85 | Exceptional 48.0% |
| Immigrants | Japan | 96.2 /100 | #86 | Exceptional 48.0% |
| Jordanians | 96.2 /100 | #87 | Exceptional 48.0% |
| Immigrants | Eastern Europe | 96.1 /100 | #88 | Exceptional 48.0% |
| Indians (Asian) | 95.8 /100 | #89 | Exceptional 48.0% |
| Americans | 95.7 /100 | #90 | Exceptional 48.0% |