White/Caucasian vs Slavic Average Family Size
COMPARE
White/Caucasian
Slavic
Average Family Size
Average Family Size Comparison
Whites/Caucasians
Slavs
3.14
AVERAGE FAMILY SIZE
0.3/ 100
METRIC RATING
285th/ 347
METRIC RANK
3.13
AVERAGE FAMILY SIZE
0.1/ 100
METRIC RATING
308th/ 347
METRIC RANK
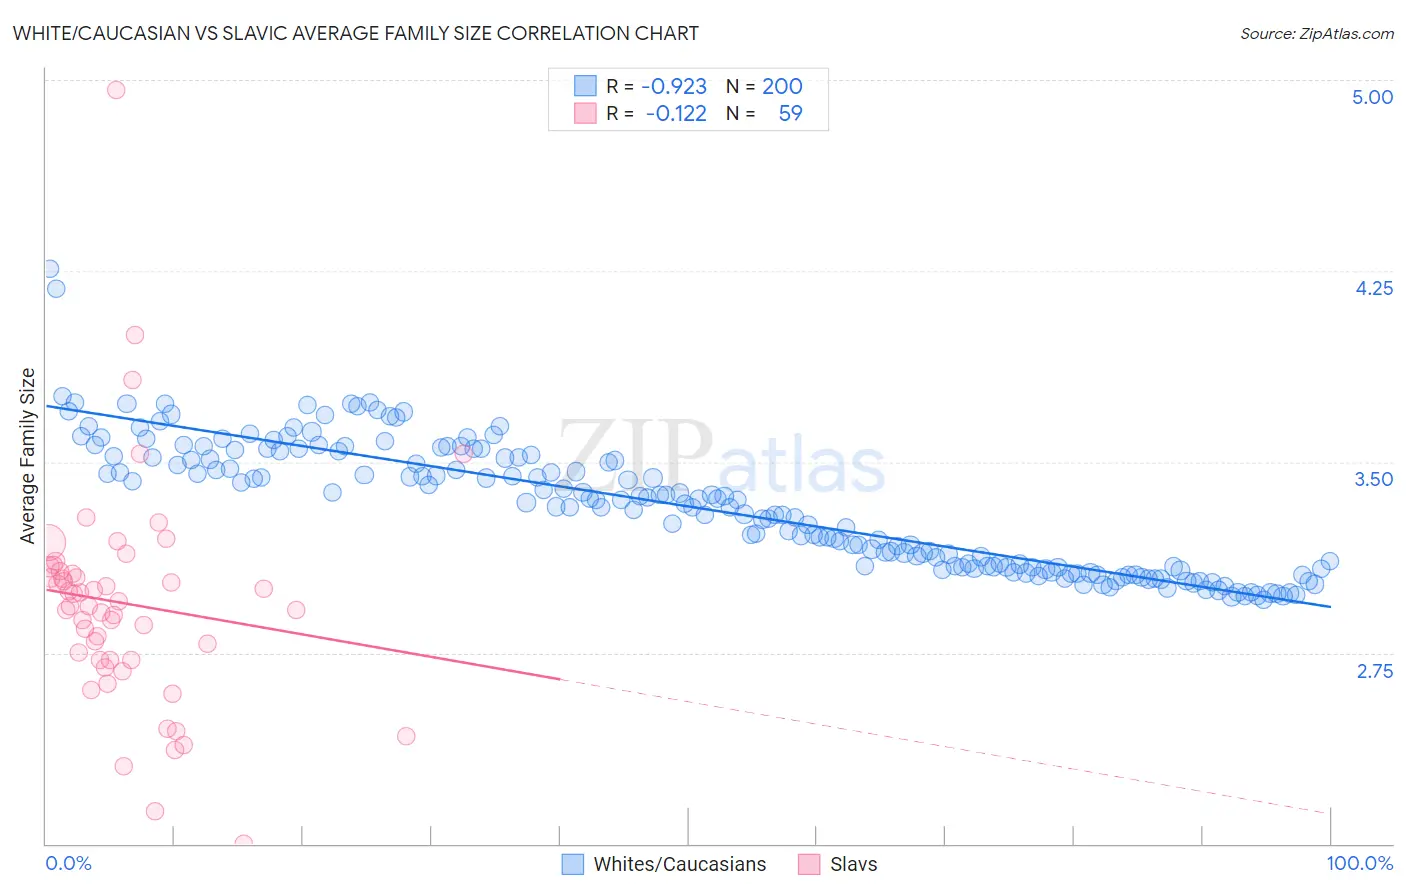
White/Caucasian vs Slavic Average Family Size Correlation Chart
The statistical analysis conducted on geographies consisting of 584,525,704 people shows a near-perfect negative correlation between the proportion of Whites/Caucasians and average family size in the United States with a correlation coefficient (R) of -0.923 and weighted average of 3.14. Similarly, the statistical analysis conducted on geographies consisting of 270,815,552 people shows a poor negative correlation between the proportion of Slavs and average family size in the United States with a correlation coefficient (R) of -0.122 and weighted average of 3.13, a difference of 0.50%.
Average Family Size Correlation Summary
| Measurement | White/Caucasian | Slavic |
| Minimum | 2.96 | 2.00 |
| Maximum | 4.26 | 4.96 |
| Range | 1.30 | 2.96 |
| Mean | 3.32 | 2.94 |
| Median | 3.33 | 2.93 |
| Interquartile 25% (IQ1) | 3.09 | 2.72 |
| Interquartile 75% (IQ3) | 3.52 | 3.07 |
| Interquartile Range (IQR) | 0.43 | 0.35 |
| Standard Deviation (Sample) | 0.25 | 0.44 |
| Standard Deviation (Population) | 0.25 | 0.44 |
Similar Demographics by Average Family Size
Demographics Similar to Whites/Caucasians by Average Family Size
In terms of average family size, the demographic groups most similar to Whites/Caucasians are Immigrants from France (3.15, a difference of 0.050%), Immigrants from Netherlands (3.14, a difference of 0.050%), Greek (3.14, a difference of 0.060%), Immigrants from Czechoslovakia (3.14, a difference of 0.060%), and Immigrants from Norway (3.14, a difference of 0.060%).
| Demographics | Rating | Rank | Average Family Size |
| Okinawans | 0.5 /100 | #278 | Tragic 3.15 |
| Immigrants | Europe | 0.5 /100 | #279 | Tragic 3.15 |
| Immigrants | England | 0.4 /100 | #280 | Tragic 3.15 |
| Immigrants | Denmark | 0.4 /100 | #281 | Tragic 3.15 |
| Yugoslavians | 0.4 /100 | #282 | Tragic 3.15 |
| German Russians | 0.4 /100 | #283 | Tragic 3.15 |
| Immigrants | France | 0.4 /100 | #284 | Tragic 3.15 |
| Whites/Caucasians | 0.3 /100 | #285 | Tragic 3.14 |
| Immigrants | Netherlands | 0.3 /100 | #286 | Tragic 3.14 |
| Greeks | 0.3 /100 | #287 | Tragic 3.14 |
| Immigrants | Czechoslovakia | 0.3 /100 | #288 | Tragic 3.14 |
| Immigrants | Norway | 0.3 /100 | #289 | Tragic 3.14 |
| Cypriots | 0.3 /100 | #290 | Tragic 3.14 |
| Alsatians | 0.2 /100 | #291 | Tragic 3.14 |
| Europeans | 0.2 /100 | #292 | Tragic 3.14 |
Demographics Similar to Slavs by Average Family Size
In terms of average family size, the demographic groups most similar to Slavs are Northern European (3.13, a difference of 0.010%), Czechoslovakian (3.13, a difference of 0.030%), Immigrants from Serbia (3.13, a difference of 0.050%), Immigrants from Ireland (3.13, a difference of 0.060%), and Immigrants from Northern Europe (3.13, a difference of 0.070%).
| Demographics | Rating | Rank | Average Family Size |
| Macedonians | 0.2 /100 | #301 | Tragic 3.13 |
| Immigrants | Latvia | 0.2 /100 | #302 | Tragic 3.13 |
| British | 0.2 /100 | #303 | Tragic 3.13 |
| Immigrants | Switzerland | 0.2 /100 | #304 | Tragic 3.13 |
| Australians | 0.1 /100 | #305 | Tragic 3.13 |
| Immigrants | Ireland | 0.1 /100 | #306 | Tragic 3.13 |
| Immigrants | Serbia | 0.1 /100 | #307 | Tragic 3.13 |
| Slavs | 0.1 /100 | #308 | Tragic 3.13 |
| Northern Europeans | 0.1 /100 | #309 | Tragic 3.13 |
| Czechoslovakians | 0.1 /100 | #310 | Tragic 3.13 |
| Immigrants | Northern Europe | 0.1 /100 | #311 | Tragic 3.13 |
| Immigrants | Australia | 0.1 /100 | #312 | Tragic 3.13 |
| Bulgarians | 0.1 /100 | #313 | Tragic 3.13 |
| Russians | 0.1 /100 | #314 | Tragic 3.12 |
| Immigrants | Scotland | 0.1 /100 | #315 | Tragic 3.12 |