White/Caucasian vs Immigrants from Norway Family Households with Children
COMPARE
White/Caucasian
Immigrants from Norway
Family Households with Children
Family Households with Children Comparison
Whites/Caucasians
Immigrants from Norway
27.4%
FAMILY HOUSEHOLDS WITH CHILDREN
50.0/ 100
METRIC RATING
174th/ 347
METRIC RANK
26.1%
FAMILY HOUSEHOLDS WITH CHILDREN
0.0/ 100
METRIC RATING
315th/ 347
METRIC RANK
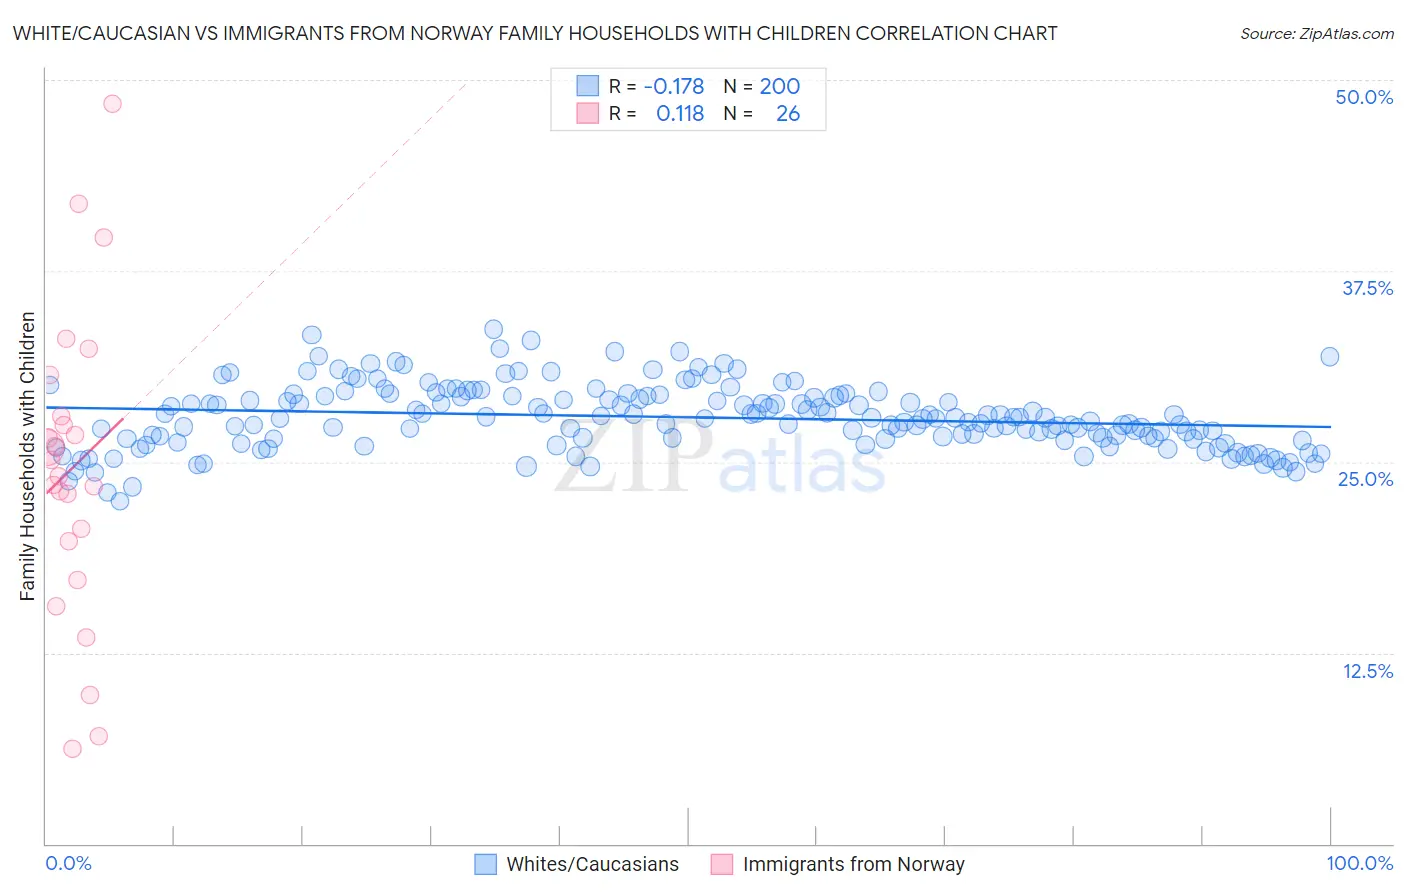
White/Caucasian vs Immigrants from Norway Family Households with Children Correlation Chart
The statistical analysis conducted on geographies consisting of 583,762,337 people shows a poor negative correlation between the proportion of Whites/Caucasians and percentage of family households with children in the United States with a correlation coefficient (R) of -0.178 and weighted average of 27.4%. Similarly, the statistical analysis conducted on geographies consisting of 116,684,213 people shows a poor positive correlation between the proportion of Immigrants from Norway and percentage of family households with children in the United States with a correlation coefficient (R) of 0.118 and weighted average of 26.1%, a difference of 5.1%.
Family Households with Children Correlation Summary
| Measurement | White/Caucasian | Immigrants from Norway |
| Minimum | 22.4% | 6.2% |
| Maximum | 33.7% | 48.4% |
| Range | 11.3% | 42.2% |
| Mean | 27.9% | 24.6% |
| Median | 27.8% | 24.6% |
| Interquartile 25% (IQ1) | 26.5% | 19.8% |
| Interquartile 75% (IQ3) | 29.3% | 28.0% |
| Interquartile Range (IQR) | 2.8% | 8.1% |
| Standard Deviation (Sample) | 2.1% | 9.9% |
| Standard Deviation (Population) | 2.1% | 9.7% |
Similar Demographics by Family Households with Children
Demographics Similar to Whites/Caucasians by Family Households with Children
In terms of family households with children, the demographic groups most similar to Whites/Caucasians are British (27.4%, a difference of 0.0%), Immigrants from China (27.4%, a difference of 0.010%), Ugandan (27.4%, a difference of 0.020%), Spanish American (27.4%, a difference of 0.020%), and Immigrants from Argentina (27.5%, a difference of 0.050%).
| Demographics | Rating | Rank | Family Households with Children |
| Dominicans | 61.1 /100 | #167 | Good 27.5% |
| Immigrants | Kuwait | 60.9 /100 | #168 | Good 27.5% |
| Seminole | 56.9 /100 | #169 | Average 27.5% |
| Cherokee | 56.7 /100 | #170 | Average 27.5% |
| Blackfeet | 54.3 /100 | #171 | Average 27.5% |
| Israelis | 53.9 /100 | #172 | Average 27.5% |
| Immigrants | Argentina | 52.2 /100 | #173 | Average 27.5% |
| Whites/Caucasians | 50.0 /100 | #174 | Average 27.4% |
| British | 49.9 /100 | #175 | Average 27.4% |
| Immigrants | China | 49.6 /100 | #176 | Average 27.4% |
| Ugandans | 49.2 /100 | #177 | Average 27.4% |
| Spanish Americans | 48.9 /100 | #178 | Average 27.4% |
| Turks | 46.9 /100 | #179 | Average 27.4% |
| Immigrants | Turkey | 46.9 /100 | #180 | Average 27.4% |
| Aleuts | 46.7 /100 | #181 | Average 27.4% |
Demographics Similar to Immigrants from Norway by Family Households with Children
In terms of family households with children, the demographic groups most similar to Immigrants from Norway are French Canadian (26.1%, a difference of 0.070%), Estonian (26.1%, a difference of 0.080%), Cree (26.2%, a difference of 0.15%), Ottawa (26.1%, a difference of 0.17%), and Iroquois (26.1%, a difference of 0.21%).
| Demographics | Rating | Rank | Family Households with Children |
| Lumbee | 0.0 /100 | #308 | Tragic 26.3% |
| Immigrants | Somalia | 0.0 /100 | #309 | Tragic 26.3% |
| Marshallese | 0.0 /100 | #310 | Tragic 26.2% |
| Colville | 0.0 /100 | #311 | Tragic 26.2% |
| Immigrants | Czechoslovakia | 0.0 /100 | #312 | Tragic 26.2% |
| Cree | 0.0 /100 | #313 | Tragic 26.2% |
| French Canadians | 0.0 /100 | #314 | Tragic 26.1% |
| Immigrants | Norway | 0.0 /100 | #315 | Tragic 26.1% |
| Estonians | 0.0 /100 | #316 | Tragic 26.1% |
| Ottawa | 0.0 /100 | #317 | Tragic 26.1% |
| Iroquois | 0.0 /100 | #318 | Tragic 26.1% |
| Immigrants | France | 0.0 /100 | #319 | Tragic 26.0% |
| Tlingit-Haida | 0.0 /100 | #320 | Tragic 26.0% |
| British West Indians | 0.0 /100 | #321 | Tragic 26.0% |
| Immigrants | Greece | 0.0 /100 | #322 | Tragic 26.0% |