West Indian vs Okinawan Family Households with Children
COMPARE
West Indian
Okinawan
Family Households with Children
Family Households with Children Comparison
West Indians
Okinawans
26.3%
FAMILY HOUSEHOLDS WITH CHILDREN
0.0/ 100
METRIC RATING
307th/ 347
METRIC RANK
27.2%
FAMILY HOUSEHOLDS WITH CHILDREN
13.7/ 100
METRIC RATING
213th/ 347
METRIC RANK
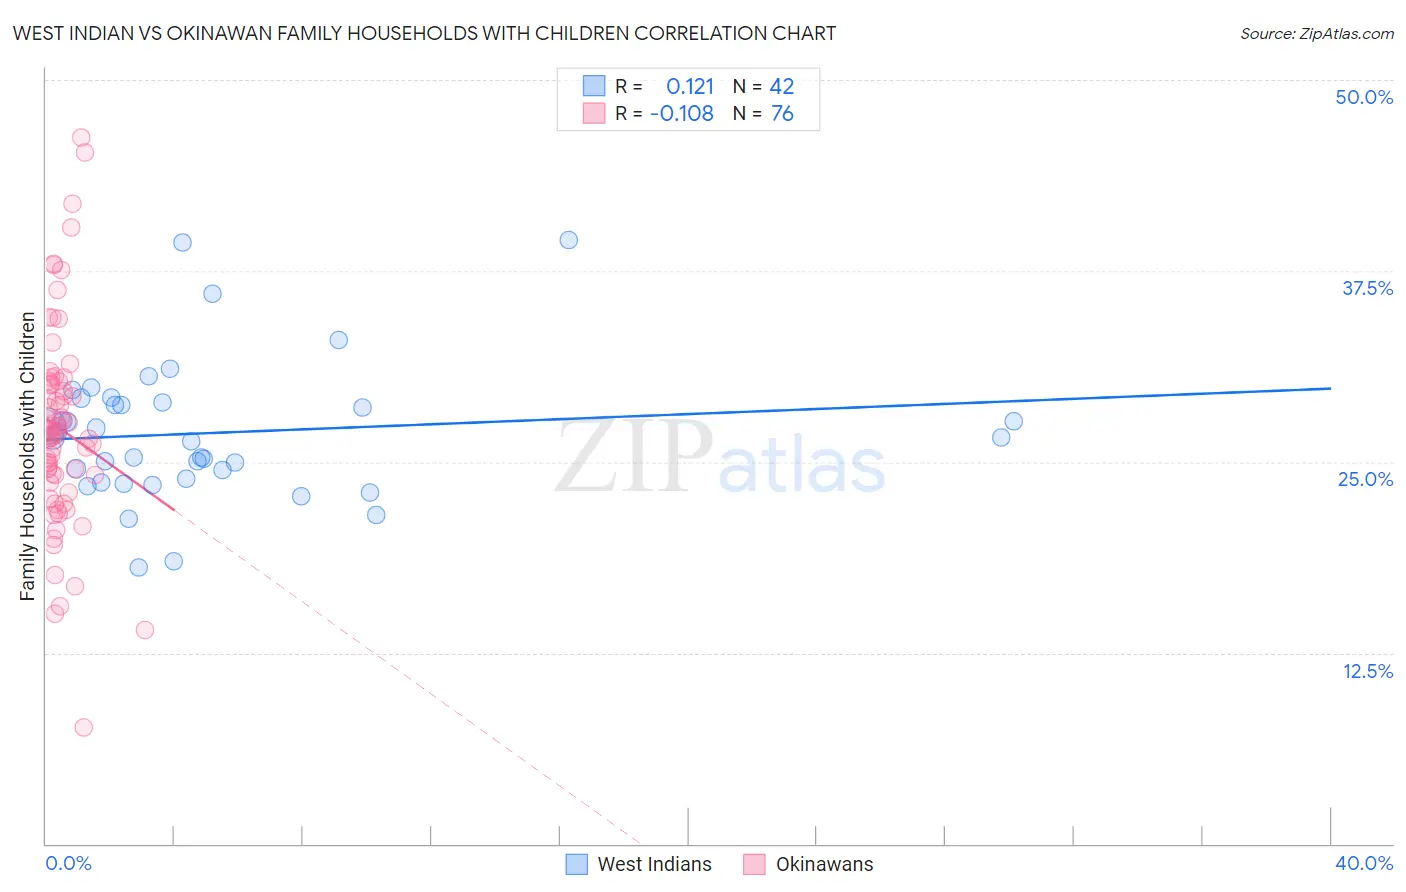
West Indian vs Okinawan Family Households with Children Correlation Chart
The statistical analysis conducted on geographies consisting of 253,803,119 people shows a poor positive correlation between the proportion of West Indians and percentage of family households with children in the United States with a correlation coefficient (R) of 0.121 and weighted average of 26.3%. Similarly, the statistical analysis conducted on geographies consisting of 73,692,255 people shows a poor negative correlation between the proportion of Okinawans and percentage of family households with children in the United States with a correlation coefficient (R) of -0.108 and weighted average of 27.2%, a difference of 3.3%.
Family Households with Children Correlation Summary
| Measurement | West Indian | Okinawan |
| Minimum | 18.0% | 7.6% |
| Maximum | 39.5% | 46.3% |
| Range | 21.5% | 38.7% |
| Mean | 26.9% | 27.2% |
| Median | 26.5% | 26.9% |
| Interquartile 25% (IQ1) | 23.9% | 23.9% |
| Interquartile 75% (IQ3) | 28.9% | 30.2% |
| Interquartile Range (IQR) | 5.0% | 6.3% |
| Standard Deviation (Sample) | 4.5% | 6.7% |
| Standard Deviation (Population) | 4.5% | 6.6% |
Similar Demographics by Family Households with Children
Demographics Similar to West Indians by Family Households with Children
In terms of family households with children, the demographic groups most similar to West Indians are Lumbee (26.3%, a difference of 0.020%), Bermudan (26.3%, a difference of 0.080%), Guyanese (26.3%, a difference of 0.10%), Immigrants from Bahamas (26.3%, a difference of 0.12%), and Immigrants from Somalia (26.3%, a difference of 0.13%).
| Demographics | Rating | Rank | Family Households with Children |
| Paiute | 0.1 /100 | #300 | Tragic 26.4% |
| Immigrants | Trinidad and Tobago | 0.1 /100 | #301 | Tragic 26.4% |
| Serbians | 0.1 /100 | #302 | Tragic 26.4% |
| Immigrants | Guyana | 0.1 /100 | #303 | Tragic 26.3% |
| Immigrants | Bahamas | 0.1 /100 | #304 | Tragic 26.3% |
| Guyanese | 0.1 /100 | #305 | Tragic 26.3% |
| Bermudans | 0.1 /100 | #306 | Tragic 26.3% |
| West Indians | 0.0 /100 | #307 | Tragic 26.3% |
| Lumbee | 0.0 /100 | #308 | Tragic 26.3% |
| Immigrants | Somalia | 0.0 /100 | #309 | Tragic 26.3% |
| Marshallese | 0.0 /100 | #310 | Tragic 26.2% |
| Colville | 0.0 /100 | #311 | Tragic 26.2% |
| Immigrants | Czechoslovakia | 0.0 /100 | #312 | Tragic 26.2% |
| Cree | 0.0 /100 | #313 | Tragic 26.2% |
| French Canadians | 0.0 /100 | #314 | Tragic 26.1% |
Demographics Similar to Okinawans by Family Households with Children
In terms of family households with children, the demographic groups most similar to Okinawans are Immigrants from Dominica (27.2%, a difference of 0.010%), Welsh (27.2%, a difference of 0.020%), Immigrants from Ukraine (27.2%, a difference of 0.030%), African (27.2%, a difference of 0.040%), and Northern European (27.2%, a difference of 0.040%).
| Demographics | Rating | Rank | Family Households with Children |
| Immigrants | Micronesia | 20.2 /100 | #206 | Fair 27.2% |
| Haitians | 19.8 /100 | #207 | Poor 27.2% |
| Immigrants | Poland | 16.4 /100 | #208 | Poor 27.2% |
| Dutch West Indians | 15.8 /100 | #209 | Poor 27.2% |
| Immigrants | Ukraine | 14.4 /100 | #210 | Poor 27.2% |
| Welsh | 14.2 /100 | #211 | Poor 27.2% |
| Immigrants | Dominica | 13.9 /100 | #212 | Poor 27.2% |
| Okinawans | 13.7 /100 | #213 | Poor 27.2% |
| Africans | 13.0 /100 | #214 | Poor 27.2% |
| Northern Europeans | 12.8 /100 | #215 | Poor 27.2% |
| Cubans | 12.2 /100 | #216 | Poor 27.1% |
| U.S. Virgin Islanders | 12.1 /100 | #217 | Poor 27.1% |
| Greeks | 11.4 /100 | #218 | Poor 27.1% |
| Immigrants | Japan | 10.7 /100 | #219 | Poor 27.1% |
| Austrians | 9.9 /100 | #220 | Tragic 27.1% |