Welsh vs Bermudan Single Mother Households
COMPARE
Welsh
Bermudan
Single Mother Households
Single Mother Households Comparison
Welsh
Bermudans
5.9%
SINGLE MOTHER HOUSEHOLDS
92.8/ 100
METRIC RATING
126th/ 347
METRIC RANK
7.3%
SINGLE MOTHER HOUSEHOLDS
0.4/ 100
METRIC RATING
249th/ 347
METRIC RANK
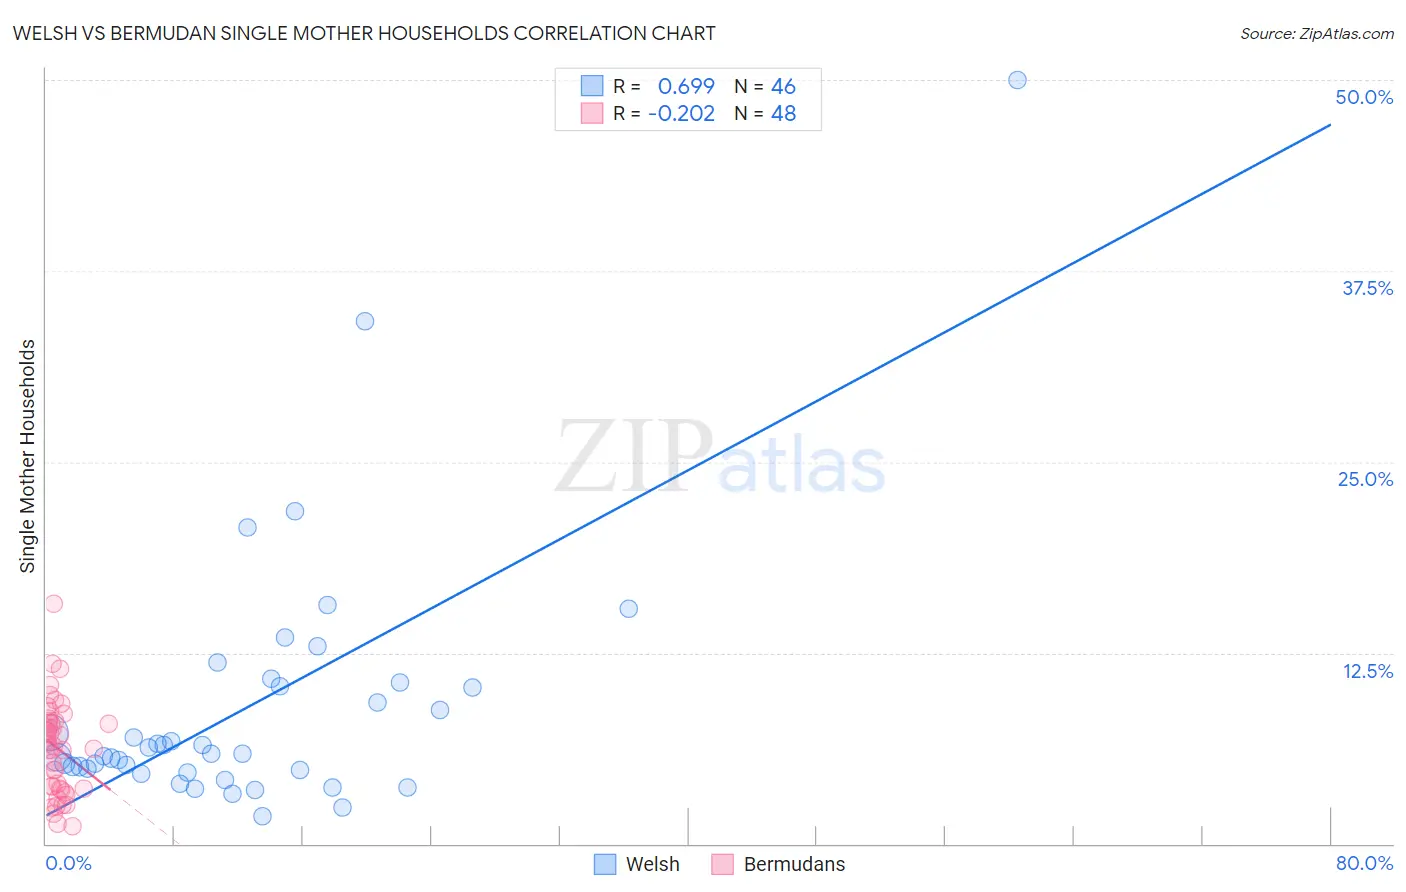
Welsh vs Bermudan Single Mother Households Correlation Chart
The statistical analysis conducted on geographies consisting of 524,967,910 people shows a significant positive correlation between the proportion of Welsh and percentage of single mother households in the United States with a correlation coefficient (R) of 0.699 and weighted average of 5.9%. Similarly, the statistical analysis conducted on geographies consisting of 55,712,440 people shows a weak negative correlation between the proportion of Bermudans and percentage of single mother households in the United States with a correlation coefficient (R) of -0.202 and weighted average of 7.3%, a difference of 24.1%.
Single Mother Households Correlation Summary
| Measurement | Welsh | Bermudan |
| Minimum | 1.8% | 1.2% |
| Maximum | 50.0% | 15.7% |
| Range | 48.2% | 14.5% |
| Mean | 9.0% | 6.3% |
| Median | 5.9% | 6.5% |
| Interquartile 25% (IQ1) | 4.8% | 3.6% |
| Interquartile 75% (IQ3) | 10.3% | 8.0% |
| Interquartile Range (IQR) | 5.5% | 4.5% |
| Standard Deviation (Sample) | 8.6% | 3.0% |
| Standard Deviation (Population) | 8.5% | 3.0% |
Similar Demographics by Single Mother Households
Demographics Similar to Welsh by Single Mother Households
In terms of single mother households, the demographic groups most similar to Welsh are Slavic (5.9%, a difference of 0.020%), Immigrants from Argentina (5.9%, a difference of 0.18%), Lebanese (5.9%, a difference of 0.19%), Immigrants from Uzbekistan (5.9%, a difference of 0.25%), and Czechoslovakian (5.9%, a difference of 0.27%).
| Demographics | Rating | Rank | Single Mother Households |
| South Africans | 94.1 /100 | #119 | Exceptional 5.8% |
| Tongans | 93.7 /100 | #120 | Exceptional 5.8% |
| Argentineans | 93.7 /100 | #121 | Exceptional 5.8% |
| Belgians | 93.5 /100 | #122 | Exceptional 5.8% |
| Immigrants | Uzbekistan | 93.4 /100 | #123 | Exceptional 5.9% |
| Immigrants | Argentina | 93.2 /100 | #124 | Exceptional 5.9% |
| Slavs | 92.9 /100 | #125 | Exceptional 5.9% |
| Welsh | 92.8 /100 | #126 | Exceptional 5.9% |
| Lebanese | 92.4 /100 | #127 | Exceptional 5.9% |
| Czechoslovakians | 92.2 /100 | #128 | Exceptional 5.9% |
| Immigrants | Bolivia | 92.2 /100 | #129 | Exceptional 5.9% |
| Palestinians | 92.1 /100 | #130 | Exceptional 5.9% |
| Immigrants | Spain | 91.2 /100 | #131 | Exceptional 5.9% |
| Albanians | 91.1 /100 | #132 | Exceptional 5.9% |
| Egyptians | 90.7 /100 | #133 | Exceptional 5.9% |
Demographics Similar to Bermudans by Single Mother Households
In terms of single mother households, the demographic groups most similar to Bermudans are Immigrants from Africa (7.3%, a difference of 0.010%), Spanish American Indian (7.3%, a difference of 0.29%), Dutch West Indian (7.3%, a difference of 0.32%), Malaysian (7.3%, a difference of 0.36%), and Alaskan Athabascan (7.3%, a difference of 0.38%).
| Demographics | Rating | Rank | Single Mother Households |
| Fijians | 0.6 /100 | #242 | Tragic 7.2% |
| Ecuadorians | 0.6 /100 | #243 | Tragic 7.2% |
| Cubans | 0.6 /100 | #244 | Tragic 7.2% |
| Immigrants | Cambodia | 0.5 /100 | #245 | Tragic 7.2% |
| Nicaraguans | 0.5 /100 | #246 | Tragic 7.2% |
| Dutch West Indians | 0.4 /100 | #247 | Tragic 7.3% |
| Spanish American Indians | 0.4 /100 | #248 | Tragic 7.3% |
| Bermudans | 0.4 /100 | #249 | Tragic 7.3% |
| Immigrants | Africa | 0.4 /100 | #250 | Tragic 7.3% |
| Malaysians | 0.3 /100 | #251 | Tragic 7.3% |
| Alaskan Athabascans | 0.3 /100 | #252 | Tragic 7.3% |
| Cajuns | 0.3 /100 | #253 | Tragic 7.3% |
| Immigrants | Ecuador | 0.3 /100 | #254 | Tragic 7.3% |
| Mexican American Indians | 0.2 /100 | #255 | Tragic 7.4% |
| Seminole | 0.2 /100 | #256 | Tragic 7.4% |