Vietnamese vs Basque Average Family Size
COMPARE
Vietnamese
Basque
Average Family Size
Average Family Size Comparison
Vietnamese
Basques
3.37
AVERAGE FAMILY SIZE
100.0/ 100
METRIC RATING
47th/ 347
METRIC RANK
3.19
AVERAGE FAMILY SIZE
5.2/ 100
METRIC RATING
231st/ 347
METRIC RANK
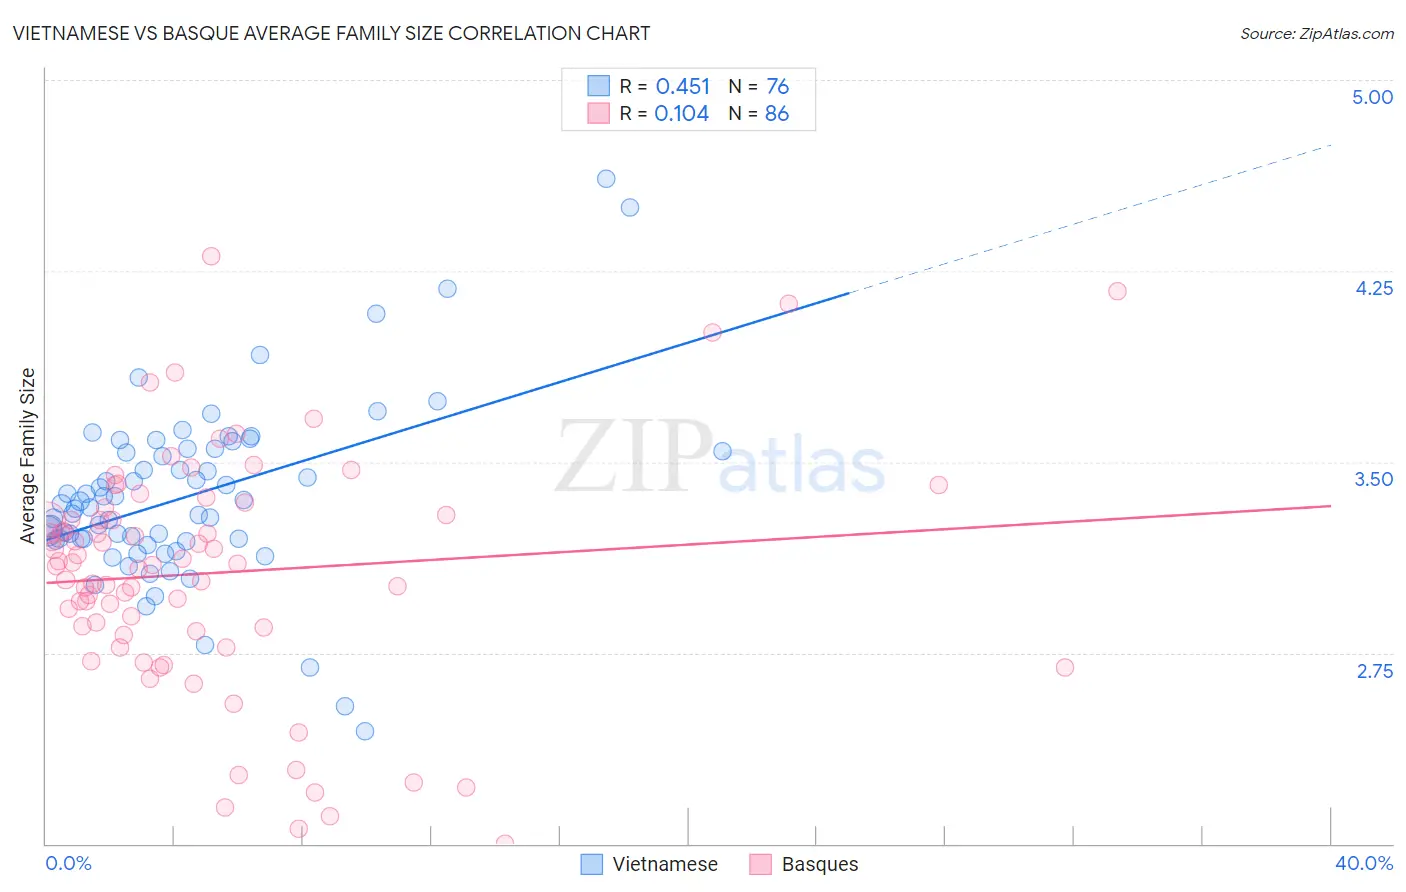
Vietnamese vs Basque Average Family Size Correlation Chart
The statistical analysis conducted on geographies consisting of 170,658,830 people shows a moderate positive correlation between the proportion of Vietnamese and average family size in the United States with a correlation coefficient (R) of 0.451 and weighted average of 3.37. Similarly, the statistical analysis conducted on geographies consisting of 165,752,068 people shows a poor positive correlation between the proportion of Basques and average family size in the United States with a correlation coefficient (R) of 0.104 and weighted average of 3.19, a difference of 5.8%.
Average Family Size Correlation Summary
| Measurement | Vietnamese | Basque |
| Minimum | 2.44 | 2.00 |
| Maximum | 4.61 | 4.31 |
| Range | 2.17 | 2.31 |
| Mean | 3.36 | 3.06 |
| Median | 3.33 | 3.10 |
| Interquartile 25% (IQ1) | 3.20 | 2.83 |
| Interquartile 75% (IQ3) | 3.54 | 3.29 |
| Interquartile Range (IQR) | 0.35 | 0.46 |
| Standard Deviation (Sample) | 0.35 | 0.47 |
| Standard Deviation (Population) | 0.35 | 0.46 |
Similar Demographics by Average Family Size
Demographics Similar to Vietnamese by Average Family Size
In terms of average family size, the demographic groups most similar to Vietnamese are Immigrants from Nicaragua (3.37, a difference of 0.0%), Haitian (3.37, a difference of 0.040%), Bangladeshi (3.37, a difference of 0.070%), Shoshone (3.37, a difference of 0.10%), and Alaska Native (3.37, a difference of 0.13%).
| Demographics | Rating | Rank | Average Family Size |
| Belizeans | 100.0 /100 | #40 | Exceptional 3.39 |
| Marshallese | 100.0 /100 | #41 | Exceptional 3.38 |
| Immigrants | Vietnam | 100.0 /100 | #42 | Exceptional 3.38 |
| Immigrants | Philippines | 100.0 /100 | #43 | Exceptional 3.37 |
| Alaska Natives | 100.0 /100 | #44 | Exceptional 3.37 |
| Shoshone | 100.0 /100 | #45 | Exceptional 3.37 |
| Haitians | 100.0 /100 | #46 | Exceptional 3.37 |
| Vietnamese | 100.0 /100 | #47 | Exceptional 3.37 |
| Immigrants | Nicaragua | 100.0 /100 | #48 | Exceptional 3.37 |
| Bangladeshis | 100.0 /100 | #49 | Exceptional 3.37 |
| Immigrants | Bangladesh | 100.0 /100 | #50 | Exceptional 3.36 |
| Nicaraguans | 100.0 /100 | #51 | Exceptional 3.36 |
| Fijians | 100.0 /100 | #52 | Exceptional 3.36 |
| Koreans | 100.0 /100 | #53 | Exceptional 3.36 |
| Immigrants | South Eastern Asia | 100.0 /100 | #54 | Exceptional 3.36 |
Demographics Similar to Basques by Average Family Size
In terms of average family size, the demographic groups most similar to Basques are Icelander (3.19, a difference of 0.0%), Immigrants from Italy (3.19, a difference of 0.010%), Cherokee (3.18, a difference of 0.040%), Nonimmigrants (3.19, a difference of 0.050%), and Portuguese (3.19, a difference of 0.070%).
| Demographics | Rating | Rank | Average Family Size |
| Syrians | 6.5 /100 | #224 | Tragic 3.19 |
| Cree | 6.2 /100 | #225 | Tragic 3.19 |
| Chickasaw | 6.0 /100 | #226 | Tragic 3.19 |
| Portuguese | 6.0 /100 | #227 | Tragic 3.19 |
| Immigrants | Nonimmigrants | 5.7 /100 | #228 | Tragic 3.19 |
| Immigrants | Italy | 5.3 /100 | #229 | Tragic 3.19 |
| Icelanders | 5.2 /100 | #230 | Tragic 3.19 |
| Basques | 5.2 /100 | #231 | Tragic 3.19 |
| Cherokee | 4.7 /100 | #232 | Tragic 3.18 |
| Brazilians | 4.5 /100 | #233 | Tragic 3.18 |
| Iranians | 4.5 /100 | #234 | Tragic 3.18 |
| Immigrants | Turkey | 4.2 /100 | #235 | Tragic 3.18 |
| Immigrants | Portugal | 4.2 /100 | #236 | Tragic 3.18 |
| Immigrants | Romania | 3.7 /100 | #237 | Tragic 3.18 |
| Romanians | 3.7 /100 | #238 | Tragic 3.18 |