U.S. Virgin Islander vs Swedish Currently Married
COMPARE
U.S. Virgin Islander
Swedish
Currently Married
Currently Married Comparison
U.S. Virgin Islanders
Swedes
40.7%
CURRENTLY MARRIED
0.0/ 100
METRIC RATING
325th/ 347
METRIC RANK
50.0%
CURRENTLY MARRIED
100.0/ 100
METRIC RATING
8th/ 347
METRIC RANK
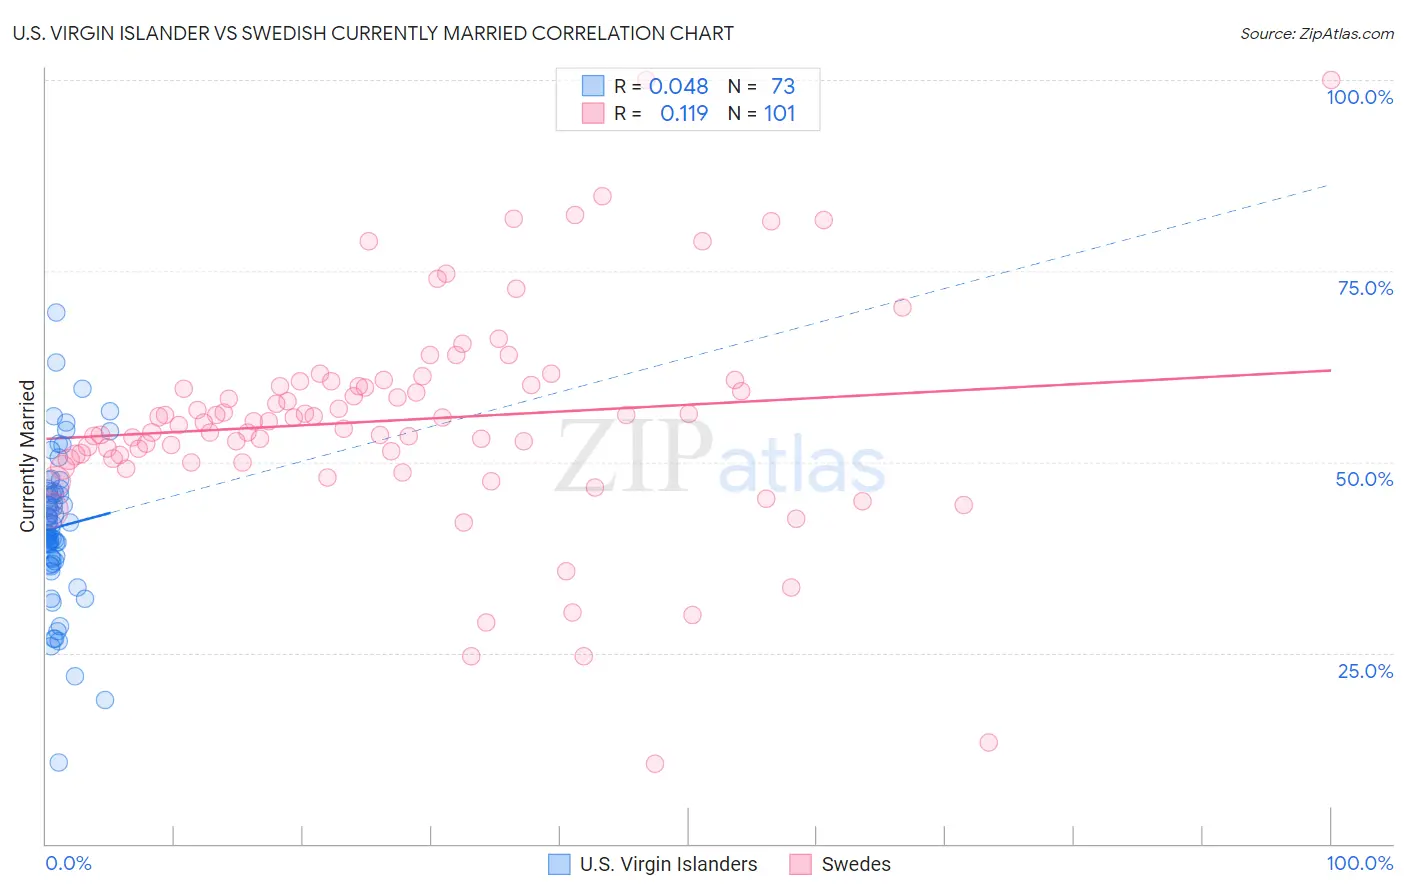
U.S. Virgin Islander vs Swedish Currently Married Correlation Chart
The statistical analysis conducted on geographies consisting of 87,525,763 people shows no correlation between the proportion of U.S. Virgin Islanders and percentage of population currently married in the United States with a correlation coefficient (R) of 0.048 and weighted average of 40.7%. Similarly, the statistical analysis conducted on geographies consisting of 539,138,052 people shows a poor positive correlation between the proportion of Swedes and percentage of population currently married in the United States with a correlation coefficient (R) of 0.119 and weighted average of 50.0%, a difference of 22.8%.
Currently Married Correlation Summary
| Measurement | U.S. Virgin Islander | Swedish |
| Minimum | 10.7% | 10.5% |
| Maximum | 69.6% | 100.0% |
| Range | 58.9% | 89.5% |
| Mean | 41.5% | 55.5% |
| Median | 41.7% | 55.3% |
| Interquartile 25% (IQ1) | 37.2% | 50.4% |
| Interquartile 75% (IQ3) | 46.2% | 60.2% |
| Interquartile Range (IQR) | 9.0% | 9.9% |
| Standard Deviation (Sample) | 9.8% | 14.4% |
| Standard Deviation (Population) | 9.7% | 14.4% |
Similar Demographics by Currently Married
Demographics Similar to U.S. Virgin Islanders by Currently Married
In terms of currently married, the demographic groups most similar to U.S. Virgin Islanders are Immigrants from Senegal (40.7%, a difference of 0.050%), Immigrants from West Indies (40.7%, a difference of 0.060%), Barbadian (40.6%, a difference of 0.14%), Senegalese (40.6%, a difference of 0.31%), and Arapaho (40.5%, a difference of 0.35%).
| Demographics | Rating | Rank | Currently Married |
| Bahamians | 0.0 /100 | #318 | Tragic 41.2% |
| Immigrants | Somalia | 0.0 /100 | #319 | Tragic 41.2% |
| Immigrants | Jamaica | 0.0 /100 | #320 | Tragic 41.1% |
| Immigrants | Congo | 0.0 /100 | #321 | Tragic 41.1% |
| Immigrants | Haiti | 0.0 /100 | #322 | Tragic 41.0% |
| Immigrants | West Indies | 0.0 /100 | #323 | Tragic 40.7% |
| Immigrants | Senegal | 0.0 /100 | #324 | Tragic 40.7% |
| U.S. Virgin Islanders | 0.0 /100 | #325 | Tragic 40.7% |
| Barbadians | 0.0 /100 | #326 | Tragic 40.6% |
| Senegalese | 0.0 /100 | #327 | Tragic 40.6% |
| Arapaho | 0.0 /100 | #328 | Tragic 40.5% |
| Crow | 0.0 /100 | #329 | Tragic 40.4% |
| Immigrants | Dominica | 0.0 /100 | #330 | Tragic 40.3% |
| Immigrants | Barbados | 0.0 /100 | #331 | Tragic 40.3% |
| Immigrants | St. Vincent and the Grenadines | 0.0 /100 | #332 | Tragic 40.1% |
Demographics Similar to Swedes by Currently Married
In terms of currently married, the demographic groups most similar to Swedes are Immigrants from South Central Asia (50.0%, a difference of 0.13%), Czech (49.9%, a difference of 0.19%), Filipino (49.7%, a difference of 0.45%), English (49.7%, a difference of 0.46%), and Swiss (49.7%, a difference of 0.46%).
| Demographics | Rating | Rank | Currently Married |
| Immigrants | India | 100.0 /100 | #1 | Exceptional 51.8% |
| Thais | 100.0 /100 | #2 | Exceptional 50.9% |
| Assyrians/Chaldeans/Syriacs | 100.0 /100 | #3 | Exceptional 50.8% |
| Immigrants | Taiwan | 100.0 /100 | #4 | Exceptional 50.7% |
| Danes | 100.0 /100 | #5 | Exceptional 50.5% |
| Norwegians | 100.0 /100 | #6 | Exceptional 50.2% |
| Immigrants | South Central Asia | 100.0 /100 | #7 | Exceptional 50.0% |
| Swedes | 100.0 /100 | #8 | Exceptional 50.0% |
| Czechs | 99.9 /100 | #9 | Exceptional 49.9% |
| Filipinos | 99.9 /100 | #10 | Exceptional 49.7% |
| English | 99.9 /100 | #11 | Exceptional 49.7% |
| Swiss | 99.9 /100 | #12 | Exceptional 49.7% |
| Dutch | 99.9 /100 | #13 | Exceptional 49.6% |
| Germans | 99.9 /100 | #14 | Exceptional 49.6% |
| Pennsylvania Germans | 99.9 /100 | #15 | Exceptional 49.6% |