Ukrainian vs Immigrants from Trinidad and Tobago Single Father Households
COMPARE
Ukrainian
Immigrants from Trinidad and Tobago
Single Father Households
Single Father Households Comparison
Ukrainians
Immigrants from Trinidad and Tobago
2.1%
SINGLE FATHER HOUSEHOLDS
99.3/ 100
METRIC RATING
94th/ 347
METRIC RANK
2.2%
SINGLE FATHER HOUSEHOLDS
98.2/ 100
METRIC RATING
112th/ 347
METRIC RANK
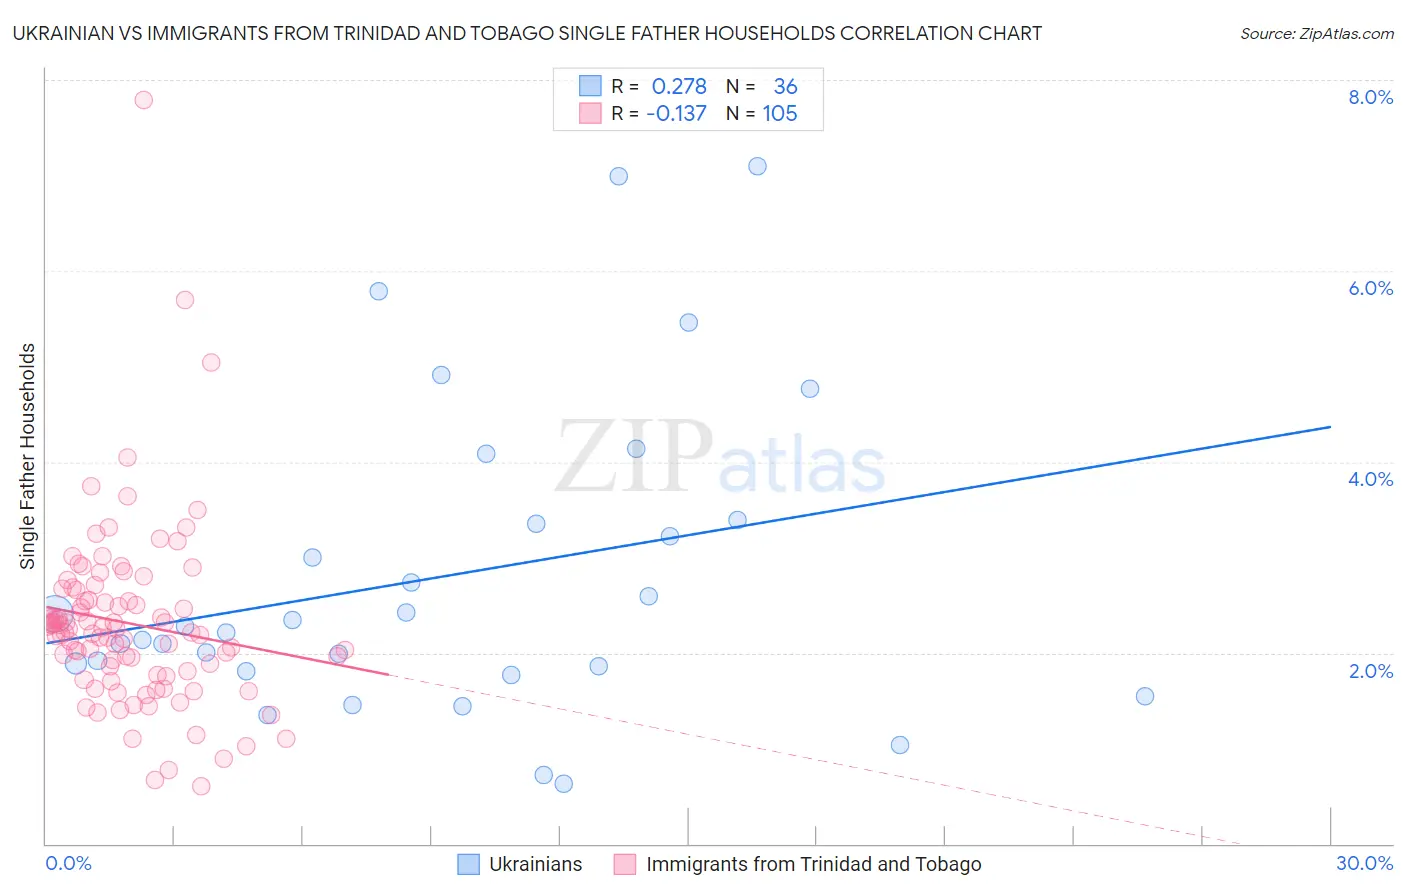
Ukrainian vs Immigrants from Trinidad and Tobago Single Father Households Correlation Chart
The statistical analysis conducted on geographies consisting of 442,446,629 people shows a weak positive correlation between the proportion of Ukrainians and percentage of single father households in the United States with a correlation coefficient (R) of 0.278 and weighted average of 2.1%. Similarly, the statistical analysis conducted on geographies consisting of 222,523,327 people shows a poor negative correlation between the proportion of Immigrants from Trinidad and Tobago and percentage of single father households in the United States with a correlation coefficient (R) of -0.137 and weighted average of 2.2%, a difference of 1.9%.
Single Father Households Correlation Summary
| Measurement | Ukrainian | Immigrants from Trinidad and Tobago |
| Minimum | 0.63% | 0.61% |
| Maximum | 7.1% | 7.8% |
| Range | 6.5% | 7.2% |
| Mean | 2.8% | 2.3% |
| Median | 2.2% | 2.2% |
| Interquartile 25% (IQ1) | 1.8% | 1.8% |
| Interquartile 75% (IQ3) | 3.4% | 2.6% |
| Interquartile Range (IQR) | 1.5% | 0.82% |
| Standard Deviation (Sample) | 1.6% | 0.95% |
| Standard Deviation (Population) | 1.6% | 0.95% |
Demographics Similar to Ukrainians and Immigrants from Trinidad and Tobago by Single Father Households
In terms of single father households, the demographic groups most similar to Ukrainians are Croatian (2.1%, a difference of 0.0%), Bermudan (2.1%, a difference of 0.22%), Arab (2.1%, a difference of 0.37%), Immigrants from Moldova (2.1%, a difference of 0.50%), and Guyanese (2.1%, a difference of 0.62%). Similarly, the demographic groups most similar to Immigrants from Trinidad and Tobago are Iraqi (2.2%, a difference of 0.010%), Immigrants from Canada (2.2%, a difference of 0.040%), Italian (2.2%, a difference of 0.12%), Barbadian (2.2%, a difference of 0.24%), and Immigrants from Netherlands (2.2%, a difference of 0.28%).
| Demographics | Rating | Rank | Single Father Households |
| Croatians | 99.3 /100 | #93 | Exceptional 2.1% |
| Ukrainians | 99.3 /100 | #94 | Exceptional 2.1% |
| Bermudans | 99.2 /100 | #95 | Exceptional 2.1% |
| Arabs | 99.2 /100 | #96 | Exceptional 2.1% |
| Immigrants | Moldova | 99.1 /100 | #97 | Exceptional 2.1% |
| Guyanese | 99.1 /100 | #98 | Exceptional 2.1% |
| South Africans | 99.1 /100 | #99 | Exceptional 2.1% |
| Immigrants | Northern Africa | 99.0 /100 | #100 | Exceptional 2.1% |
| Immigrants | Western Europe | 98.9 /100 | #101 | Exceptional 2.1% |
| Argentineans | 98.9 /100 | #102 | Exceptional 2.1% |
| Lebanese | 98.9 /100 | #103 | Exceptional 2.1% |
| Alsatians | 98.9 /100 | #104 | Exceptional 2.1% |
| Palestinians | 98.6 /100 | #105 | Exceptional 2.2% |
| Immigrants | Southern Europe | 98.6 /100 | #106 | Exceptional 2.2% |
| Slovenes | 98.5 /100 | #107 | Exceptional 2.2% |
| Immigrants | Netherlands | 98.5 /100 | #108 | Exceptional 2.2% |
| Barbadians | 98.4 /100 | #109 | Exceptional 2.2% |
| Italians | 98.3 /100 | #110 | Exceptional 2.2% |
| Immigrants | Canada | 98.3 /100 | #111 | Exceptional 2.2% |
| Immigrants | Trinidad and Tobago | 98.2 /100 | #112 | Exceptional 2.2% |
| Iraqis | 98.2 /100 | #113 | Exceptional 2.2% |