Ugandan vs Venezuelan Births to Unmarried Women
COMPARE
Ugandan
Venezuelan
Births to Unmarried Women
Births to Unmarried Women Comparison
Ugandans
Venezuelans
30.1%
BIRTHS TO UNMARRIED WOMEN
89.2/ 100
METRIC RATING
120th/ 347
METRIC RANK
31.7%
BIRTHS TO UNMARRIED WOMEN
50.0/ 100
METRIC RATING
174th/ 347
METRIC RANK
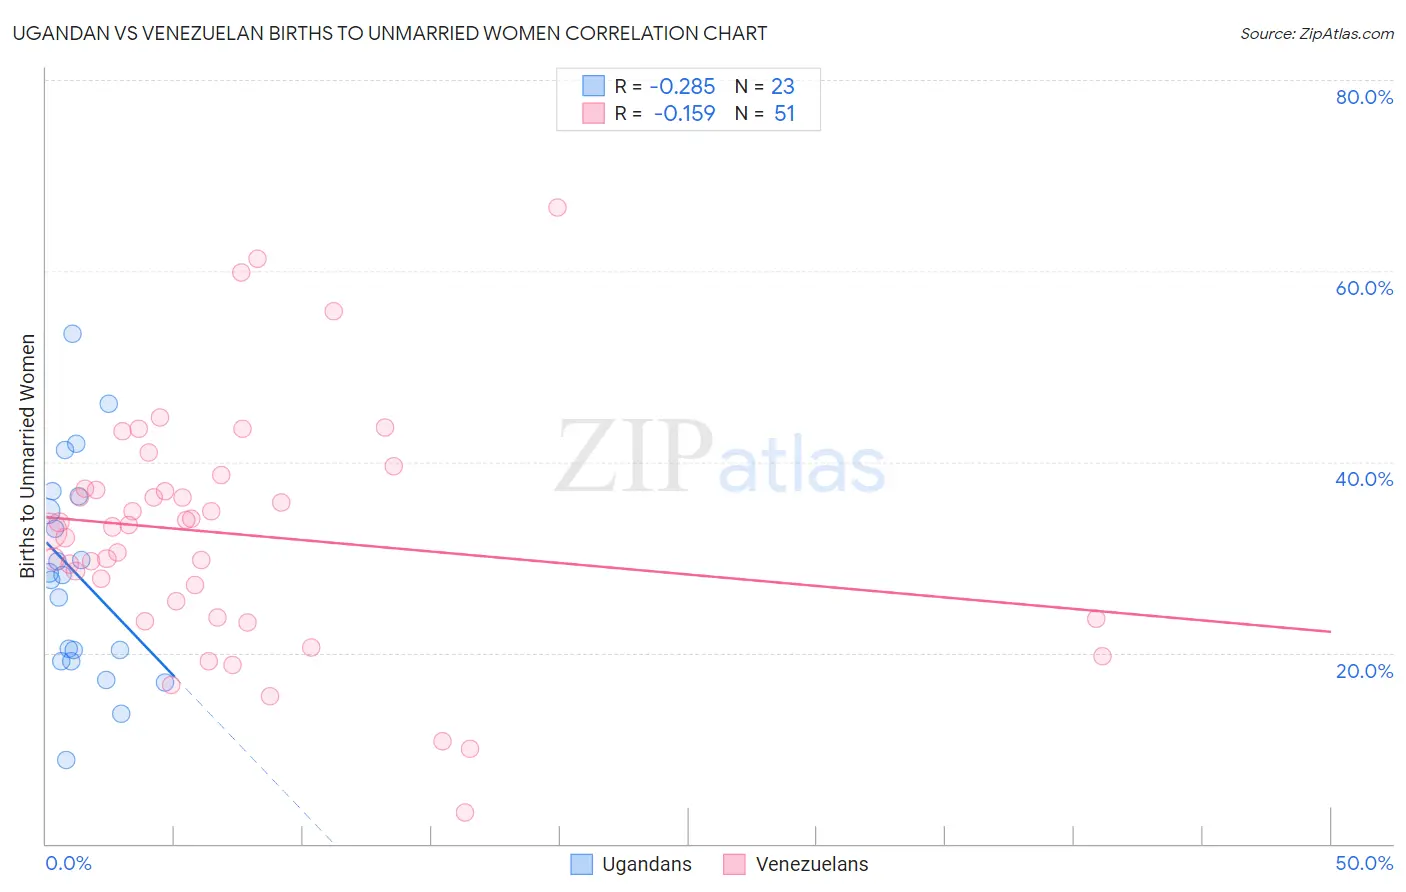
Ugandan vs Venezuelan Births to Unmarried Women Correlation Chart
The statistical analysis conducted on geographies consisting of 92,593,945 people shows a weak negative correlation between the proportion of Ugandans and percentage of births to unmarried women in the United States with a correlation coefficient (R) of -0.285 and weighted average of 30.1%. Similarly, the statistical analysis conducted on geographies consisting of 290,839,200 people shows a poor negative correlation between the proportion of Venezuelans and percentage of births to unmarried women in the United States with a correlation coefficient (R) of -0.159 and weighted average of 31.7%, a difference of 5.2%.
Births to Unmarried Women Correlation Summary
| Measurement | Ugandan | Venezuelan |
| Minimum | 8.7% | 3.3% |
| Maximum | 53.4% | 66.7% |
| Range | 44.7% | 63.4% |
| Mean | 28.2% | 32.5% |
| Median | 28.1% | 33.2% |
| Interquartile 25% (IQ1) | 19.1% | 23.7% |
| Interquartile 75% (IQ3) | 36.4% | 37.2% |
| Interquartile Range (IQR) | 17.3% | 13.4% |
| Standard Deviation (Sample) | 11.1% | 12.5% |
| Standard Deviation (Population) | 10.9% | 12.3% |
Similar Demographics by Births to Unmarried Women
Demographics Similar to Ugandans by Births to Unmarried Women
In terms of births to unmarried women, the demographic groups most similar to Ugandans are Korean (30.1%, a difference of 0.070%), Immigrants from Argentina (30.1%, a difference of 0.12%), Syrian (30.2%, a difference of 0.25%), Croatian (30.2%, a difference of 0.29%), and Argentinean (30.0%, a difference of 0.36%).
| Demographics | Rating | Rank | Births to Unmarried Women |
| Scandinavians | 92.7 /100 | #113 | Exceptional 29.8% |
| Immigrants | Croatia | 92.6 /100 | #114 | Exceptional 29.8% |
| Ethiopians | 91.9 /100 | #115 | Exceptional 29.8% |
| Immigrants | Italy | 91.7 /100 | #116 | Exceptional 29.9% |
| Immigrants | Netherlands | 91.1 /100 | #117 | Exceptional 29.9% |
| Immigrants | Norway | 91.0 /100 | #118 | Exceptional 29.9% |
| Argentineans | 90.5 /100 | #119 | Exceptional 30.0% |
| Ugandans | 89.2 /100 | #120 | Excellent 30.1% |
| Koreans | 88.9 /100 | #121 | Excellent 30.1% |
| Immigrants | Argentina | 88.7 /100 | #122 | Excellent 30.1% |
| Syrians | 88.2 /100 | #123 | Excellent 30.2% |
| Croatians | 88.0 /100 | #124 | Excellent 30.2% |
| Vietnamese | 87.7 /100 | #125 | Excellent 30.2% |
| Europeans | 87.2 /100 | #126 | Excellent 30.2% |
| Chinese | 87.1 /100 | #127 | Excellent 30.2% |
Demographics Similar to Venezuelans by Births to Unmarried Women
In terms of births to unmarried women, the demographic groups most similar to Venezuelans are Immigrants from Yemen (31.7%, a difference of 0.020%), Immigrants from Eritrea (31.7%, a difference of 0.040%), Finnish (31.7%, a difference of 0.050%), Immigrants from Venezuela (31.7%, a difference of 0.080%), and Guamanian/Chamorro (31.6%, a difference of 0.13%).
| Demographics | Rating | Rank | Births to Unmarried Women |
| Dutch | 55.3 /100 | #167 | Average 31.5% |
| Belgians | 52.4 /100 | #168 | Average 31.6% |
| Slavs | 52.0 /100 | #169 | Average 31.6% |
| Guamanians/Chamorros | 51.3 /100 | #170 | Average 31.6% |
| Finns | 50.5 /100 | #171 | Average 31.7% |
| Immigrants | Eritrea | 50.4 /100 | #172 | Average 31.7% |
| Immigrants | Yemen | 50.2 /100 | #173 | Average 31.7% |
| Venezuelans | 50.0 /100 | #174 | Average 31.7% |
| Immigrants | Venezuela | 49.2 /100 | #175 | Average 31.7% |
| Scottish | 48.1 /100 | #176 | Average 31.7% |
| South American Indians | 47.7 /100 | #177 | Average 31.7% |
| English | 47.4 /100 | #178 | Average 31.7% |
| South Americans | 46.9 /100 | #179 | Average 31.8% |
| Moroccans | 45.7 /100 | #180 | Average 31.8% |
| Immigrants | Peru | 45.1 /100 | #181 | Average 31.8% |