Tlingit-Haida vs Soviet Union Family Households with Children
COMPARE
Tlingit-Haida
Soviet Union
Family Households with Children
Family Households with Children Comparison
Tlingit-Haida
Soviet Union
26.0%
FAMILY HOUSEHOLDS WITH CHILDREN
0.0/ 100
METRIC RATING
320th/ 347
METRIC RANK
24.8%
FAMILY HOUSEHOLDS WITH CHILDREN
0.0/ 100
METRIC RATING
347th/ 347
METRIC RANK
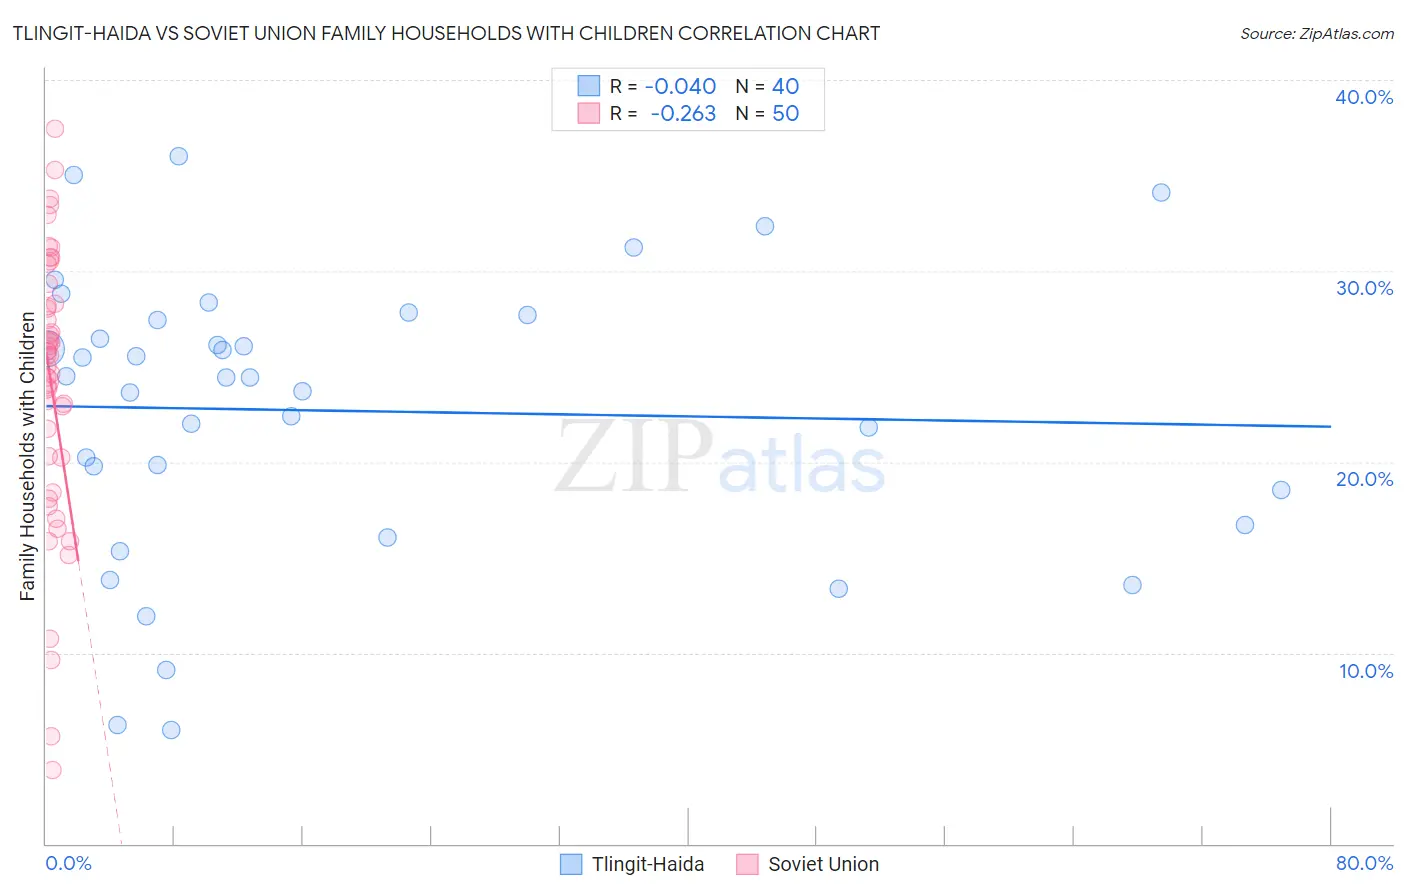
Tlingit-Haida vs Soviet Union Family Households with Children Correlation Chart
The statistical analysis conducted on geographies consisting of 60,854,309 people shows no correlation between the proportion of Tlingit-Haida and percentage of family households with children in the United States with a correlation coefficient (R) of -0.040 and weighted average of 26.0%. Similarly, the statistical analysis conducted on geographies consisting of 43,507,207 people shows a weak negative correlation between the proportion of Soviet Union and percentage of family households with children in the United States with a correlation coefficient (R) of -0.263 and weighted average of 24.8%, a difference of 4.8%.
Family Households with Children Correlation Summary
| Measurement | Tlingit-Haida | Soviet Union |
| Minimum | 6.0% | 3.9% |
| Maximum | 36.0% | 37.4% |
| Range | 30.0% | 33.6% |
| Mean | 22.7% | 24.0% |
| Median | 24.4% | 25.6% |
| Interquartile 25% (IQ1) | 17.6% | 20.2% |
| Interquartile 75% (IQ3) | 27.6% | 28.3% |
| Interquartile Range (IQR) | 10.0% | 8.1% |
| Standard Deviation (Sample) | 7.5% | 7.2% |
| Standard Deviation (Population) | 7.4% | 7.2% |
Similar Demographics by Family Households with Children
Demographics Similar to Tlingit-Haida by Family Households with Children
In terms of family households with children, the demographic groups most similar to Tlingit-Haida are British West Indian (26.0%, a difference of 0.010%), Immigrants from France (26.0%, a difference of 0.020%), Immigrants from Greece (26.0%, a difference of 0.030%), Immigrants from Australia (26.0%, a difference of 0.060%), and Chinese (26.0%, a difference of 0.090%).
| Demographics | Rating | Rank | Family Households with Children |
| Cree | 0.0 /100 | #313 | Tragic 26.2% |
| French Canadians | 0.0 /100 | #314 | Tragic 26.1% |
| Immigrants | Norway | 0.0 /100 | #315 | Tragic 26.1% |
| Estonians | 0.0 /100 | #316 | Tragic 26.1% |
| Ottawa | 0.0 /100 | #317 | Tragic 26.1% |
| Iroquois | 0.0 /100 | #318 | Tragic 26.1% |
| Immigrants | France | 0.0 /100 | #319 | Tragic 26.0% |
| Tlingit-Haida | 0.0 /100 | #320 | Tragic 26.0% |
| British West Indians | 0.0 /100 | #321 | Tragic 26.0% |
| Immigrants | Greece | 0.0 /100 | #322 | Tragic 26.0% |
| Immigrants | Australia | 0.0 /100 | #323 | Tragic 26.0% |
| Chinese | 0.0 /100 | #324 | Tragic 26.0% |
| Barbadians | 0.0 /100 | #325 | Tragic 26.0% |
| Immigrants | Ireland | 0.0 /100 | #326 | Tragic 26.0% |
| Immigrants | Barbados | 0.0 /100 | #327 | Tragic 26.0% |
Demographics Similar to Soviet Union by Family Households with Children
In terms of family households with children, the demographic groups most similar to Soviet Union are Immigrants from Grenada (25.2%, a difference of 1.3%), Carpatho Rusyn (25.2%, a difference of 1.3%), Pueblo (25.2%, a difference of 1.5%), Hopi (25.2%, a difference of 1.6%), and Alsatian (25.3%, a difference of 1.8%).
| Demographics | Rating | Rank | Family Households with Children |
| Immigrants | Switzerland | 0.0 /100 | #333 | Tragic 25.7% |
| Slovaks | 0.0 /100 | #334 | Tragic 25.7% |
| Immigrants | Croatia | 0.0 /100 | #335 | Tragic 25.7% |
| Immigrants | West Indies | 0.0 /100 | #336 | Tragic 25.7% |
| Puerto Ricans | 0.0 /100 | #337 | Tragic 25.6% |
| Arapaho | 0.0 /100 | #338 | Tragic 25.6% |
| Immigrants | St. Vincent and the Grenadines | 0.0 /100 | #339 | Tragic 25.6% |
| Immigrants | Armenia | 0.0 /100 | #340 | Tragic 25.6% |
| Immigrants | Serbia | 0.0 /100 | #341 | Tragic 25.5% |
| Alsatians | 0.0 /100 | #342 | Tragic 25.3% |
| Hopi | 0.0 /100 | #343 | Tragic 25.2% |
| Pueblo | 0.0 /100 | #344 | Tragic 25.2% |
| Immigrants | Grenada | 0.0 /100 | #345 | Tragic 25.2% |
| Carpatho Rusyns | 0.0 /100 | #346 | Tragic 25.2% |
| Soviet Union | 0.0 /100 | #347 | Tragic 24.8% |