Tlingit-Haida vs Cree Single Mother Households
COMPARE
Tlingit-Haida
Cree
Single Mother Households
Single Mother Households Comparison
Tlingit-Haida
Cree
5.7%
SINGLE MOTHER HOUSEHOLDS
96.4/ 100
METRIC RATING
97th/ 347
METRIC RANK
6.7%
SINGLE MOTHER HOUSEHOLDS
11.9/ 100
METRIC RATING
205th/ 347
METRIC RANK
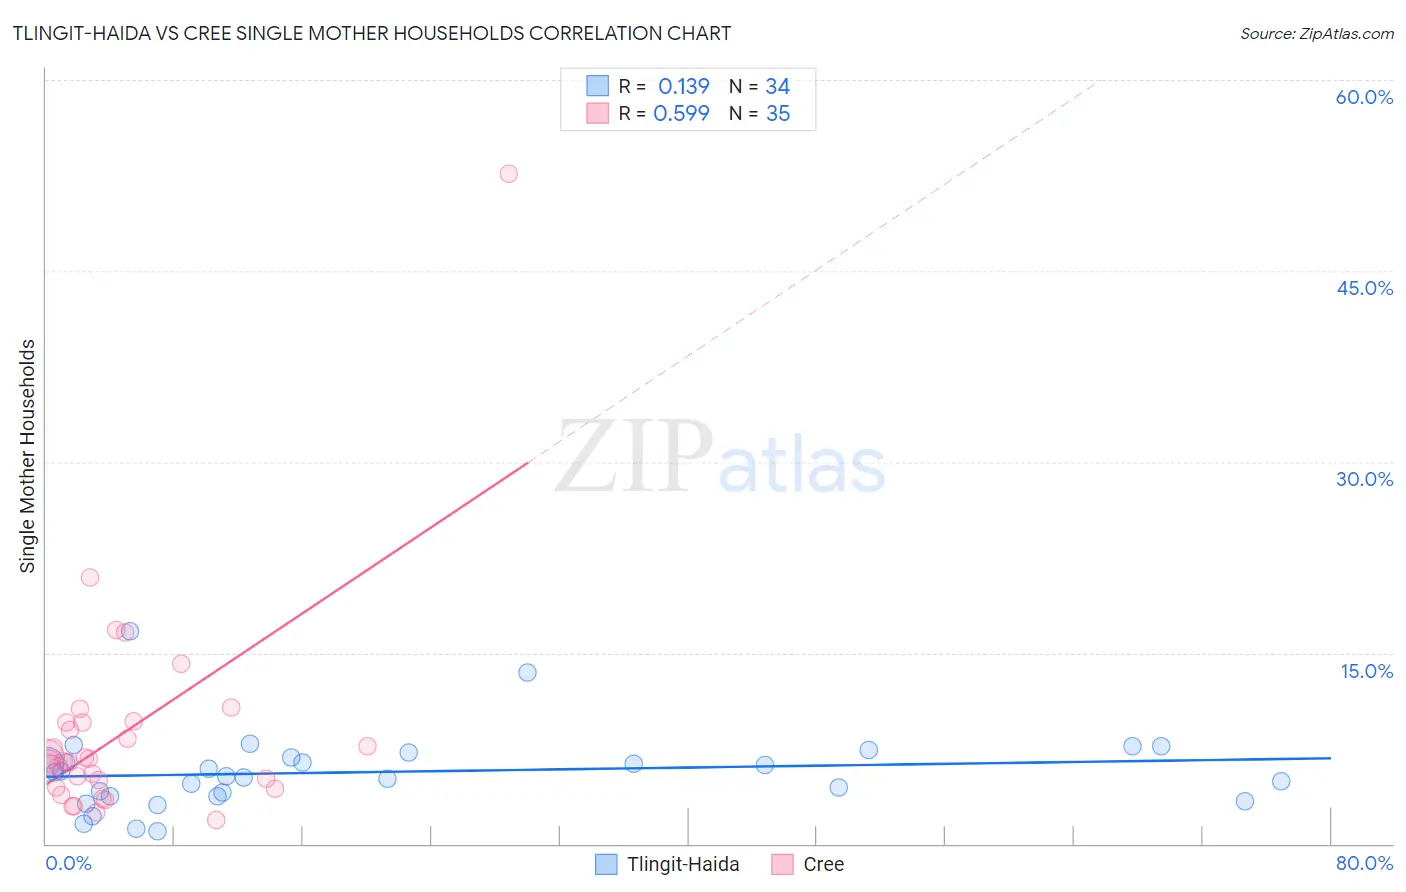
Tlingit-Haida vs Cree Single Mother Households Correlation Chart
The statistical analysis conducted on geographies consisting of 60,822,631 people shows a poor positive correlation between the proportion of Tlingit-Haida and percentage of single mother households in the United States with a correlation coefficient (R) of 0.139 and weighted average of 5.7%. Similarly, the statistical analysis conducted on geographies consisting of 76,173,088 people shows a substantial positive correlation between the proportion of Cree and percentage of single mother households in the United States with a correlation coefficient (R) of 0.599 and weighted average of 6.7%, a difference of 15.9%.
Single Mother Households Correlation Summary
| Measurement | Tlingit-Haida | Cree |
| Minimum | 0.98% | 1.9% |
| Maximum | 16.7% | 52.6% |
| Range | 15.7% | 50.8% |
| Mean | 5.6% | 8.7% |
| Median | 5.4% | 6.6% |
| Interquartile 25% (IQ1) | 3.8% | 4.4% |
| Interquartile 75% (IQ3) | 6.8% | 9.5% |
| Interquartile Range (IQR) | 3.0% | 5.1% |
| Standard Deviation (Sample) | 3.1% | 8.7% |
| Standard Deviation (Population) | 3.0% | 8.6% |
Similar Demographics by Single Mother Households
Demographics Similar to Tlingit-Haida by Single Mother Households
In terms of single mother households, the demographic groups most similar to Tlingit-Haida are Immigrants from South Africa (5.7%, a difference of 0.040%), Austrian (5.7%, a difference of 0.050%), Immigrants from Poland (5.8%, a difference of 0.10%), Scandinavian (5.8%, a difference of 0.11%), and German (5.8%, a difference of 0.14%).
| Demographics | Rating | Rank | Single Mother Households |
| Immigrants | Indonesia | 97.2 /100 | #90 | Exceptional 5.7% |
| Europeans | 97.0 /100 | #91 | Exceptional 5.7% |
| Immigrants | Western Asia | 96.7 /100 | #92 | Exceptional 5.7% |
| Serbians | 96.7 /100 | #93 | Exceptional 5.7% |
| Basques | 96.7 /100 | #94 | Exceptional 5.7% |
| Slovaks | 96.6 /100 | #95 | Exceptional 5.7% |
| Austrians | 96.4 /100 | #96 | Exceptional 5.7% |
| Tlingit-Haida | 96.4 /100 | #97 | Exceptional 5.7% |
| Immigrants | South Africa | 96.3 /100 | #98 | Exceptional 5.7% |
| Immigrants | Poland | 96.3 /100 | #99 | Exceptional 5.8% |
| Scandinavians | 96.2 /100 | #100 | Exceptional 5.8% |
| Germans | 96.2 /100 | #101 | Exceptional 5.8% |
| English | 96.2 /100 | #102 | Exceptional 5.8% |
| Scottish | 96.2 /100 | #103 | Exceptional 5.8% |
| Northern Europeans | 96.2 /100 | #104 | Exceptional 5.8% |
Demographics Similar to Cree by Single Mother Households
In terms of single mother households, the demographic groups most similar to Cree are Immigrants from Fiji (6.7%, a difference of 0.020%), Immigrants from Peru (6.7%, a difference of 0.030%), German Russian (6.7%, a difference of 0.080%), Immigrants from South America (6.7%, a difference of 0.080%), and Guamanian/Chamorro (6.6%, a difference of 0.13%).
| Demographics | Rating | Rank | Single Mother Households |
| Hawaiians | 16.1 /100 | #198 | Poor 6.6% |
| Potawatomi | 15.5 /100 | #199 | Poor 6.6% |
| Immigrants | Ethiopia | 14.7 /100 | #200 | Poor 6.6% |
| Venezuelans | 12.9 /100 | #201 | Poor 6.6% |
| Guamanians/Chamorros | 12.4 /100 | #202 | Poor 6.6% |
| Immigrants | Peru | 12.0 /100 | #203 | Poor 6.7% |
| Immigrants | Fiji | 11.9 /100 | #204 | Poor 6.7% |
| Cree | 11.9 /100 | #205 | Poor 6.7% |
| German Russians | 11.5 /100 | #206 | Poor 6.7% |
| Immigrants | South America | 11.5 /100 | #207 | Poor 6.7% |
| Vietnamese | 11.3 /100 | #208 | Poor 6.7% |
| Immigrants | Colombia | 10.5 /100 | #209 | Poor 6.7% |
| Immigrants | Nonimmigrants | 10.4 /100 | #210 | Poor 6.7% |
| Immigrants | Venezuela | 8.5 /100 | #211 | Tragic 6.7% |
| Immigrants | Eritrea | 8.4 /100 | #212 | Tragic 6.7% |