Swiss vs Immigrants from Cameroon Births to Unmarried Women
COMPARE
Swiss
Immigrants from Cameroon
Births to Unmarried Women
Births to Unmarried Women Comparison
Swiss
Immigrants from Cameroon
30.5%
BIRTHS TO UNMARRIED WOMEN
83.1/ 100
METRIC RATING
140th/ 347
METRIC RANK
34.7%
BIRTHS TO UNMARRIED WOMEN
1.6/ 100
METRIC RATING
236th/ 347
METRIC RANK
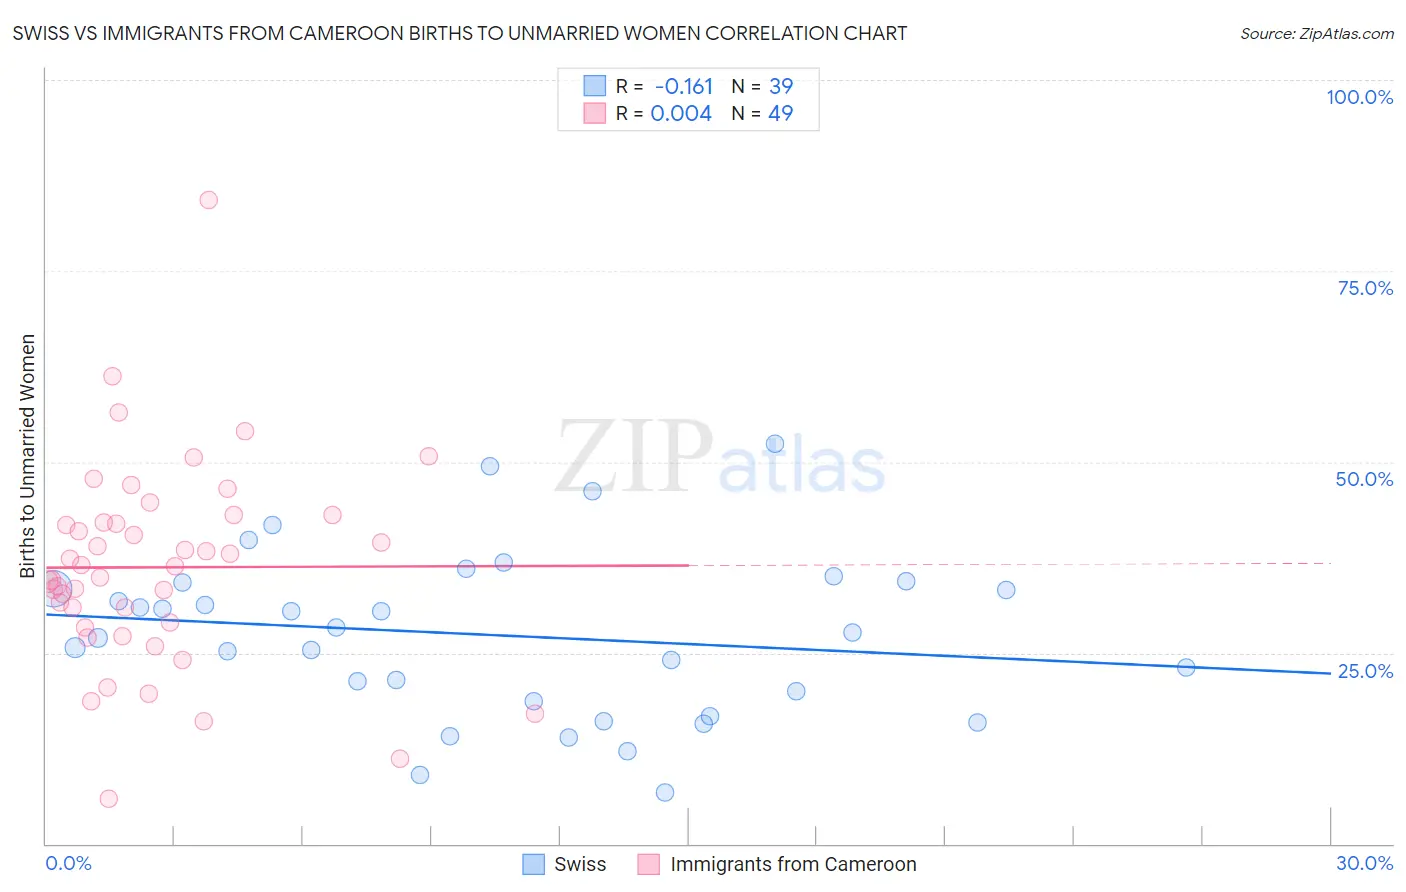
Swiss vs Immigrants from Cameroon Births to Unmarried Women Correlation Chart
The statistical analysis conducted on geographies consisting of 422,325,964 people shows a poor negative correlation between the proportion of Swiss and percentage of births to unmarried women in the United States with a correlation coefficient (R) of -0.161 and weighted average of 30.5%. Similarly, the statistical analysis conducted on geographies consisting of 128,569,403 people shows no correlation between the proportion of Immigrants from Cameroon and percentage of births to unmarried women in the United States with a correlation coefficient (R) of 0.004 and weighted average of 34.7%, a difference of 14.0%.
Births to Unmarried Women Correlation Summary
| Measurement | Swiss | Immigrants from Cameroon |
| Minimum | 6.7% | 5.9% |
| Maximum | 52.4% | 84.3% |
| Range | 45.7% | 78.4% |
| Mean | 27.3% | 36.2% |
| Median | 27.7% | 36.4% |
| Interquartile 25% (IQ1) | 18.6% | 28.6% |
| Interquartile 75% (IQ3) | 34.3% | 42.5% |
| Interquartile Range (IQR) | 15.6% | 13.9% |
| Standard Deviation (Sample) | 10.8% | 13.4% |
| Standard Deviation (Population) | 10.6% | 13.2% |
Similar Demographics by Births to Unmarried Women
Demographics Similar to Swiss by Births to Unmarried Women
In terms of births to unmarried women, the demographic groups most similar to Swiss are Pakistani (30.5%, a difference of 0.020%), South African (30.5%, a difference of 0.080%), Immigrants from Uganda (30.5%, a difference of 0.10%), Immigrants from Canada (30.4%, a difference of 0.11%), and Immigrants from Philippines (30.4%, a difference of 0.14%).
| Demographics | Rating | Rank | Births to Unmarried Women |
| Immigrants | Morocco | 85.2 /100 | #133 | Excellent 30.4% |
| Immigrants | South Eastern Asia | 85.2 /100 | #134 | Excellent 30.4% |
| Brazilians | 84.8 /100 | #135 | Excellent 30.4% |
| Immigrants | Scotland | 84.6 /100 | #136 | Excellent 30.4% |
| Immigrants | Philippines | 83.9 /100 | #137 | Excellent 30.4% |
| Puget Sound Salish | 83.9 /100 | #138 | Excellent 30.4% |
| Immigrants | Canada | 83.7 /100 | #139 | Excellent 30.4% |
| Swiss | 83.1 /100 | #140 | Excellent 30.5% |
| Pakistanis | 83.0 /100 | #141 | Excellent 30.5% |
| South Africans | 82.7 /100 | #142 | Excellent 30.5% |
| Immigrants | Uganda | 82.6 /100 | #143 | Excellent 30.5% |
| Czechs | 82.1 /100 | #144 | Excellent 30.5% |
| Immigrants | North America | 81.5 /100 | #145 | Excellent 30.6% |
| Northern Europeans | 81.4 /100 | #146 | Excellent 30.6% |
| Immigrants | Oceania | 81.2 /100 | #147 | Excellent 30.6% |
Demographics Similar to Immigrants from Cameroon by Births to Unmarried Women
In terms of births to unmarried women, the demographic groups most similar to Immigrants from Cameroon are Marshallese (34.8%, a difference of 0.070%), Immigrants from Cambodia (34.8%, a difference of 0.13%), Sierra Leonean (34.9%, a difference of 0.36%), Immigrants from Middle Africa (34.9%, a difference of 0.61%), and Immigrants from Ghana (34.5%, a difference of 0.63%).
| Demographics | Rating | Rank | Births to Unmarried Women |
| Immigrants | Sierra Leone | 3.1 /100 | #229 | Tragic 34.2% |
| Ghanaians | 3.1 /100 | #230 | Tragic 34.3% |
| Native Hawaiians | 2.9 /100 | #231 | Tragic 34.3% |
| French Canadians | 2.5 /100 | #232 | Tragic 34.4% |
| Bangladeshis | 2.5 /100 | #233 | Tragic 34.4% |
| Immigrants | Zaire | 2.3 /100 | #234 | Tragic 34.5% |
| Immigrants | Ghana | 2.2 /100 | #235 | Tragic 34.5% |
| Immigrants | Cameroon | 1.6 /100 | #236 | Tragic 34.7% |
| Marshallese | 1.6 /100 | #237 | Tragic 34.8% |
| Immigrants | Cambodia | 1.6 /100 | #238 | Tragic 34.8% |
| Sierra Leoneans | 1.4 /100 | #239 | Tragic 34.9% |
| Immigrants | Middle Africa | 1.2 /100 | #240 | Tragic 34.9% |
| Immigrants | Guyana | 1.2 /100 | #241 | Tragic 35.0% |
| Indonesians | 1.2 /100 | #242 | Tragic 35.0% |
| Japanese | 0.9 /100 | #243 | Tragic 35.2% |