Swedish vs Immigrants from Senegal Family Households with Children

COMPARE

Swedish
Race
Ancestry
AfghanAfricanAlaska NativeAlaskan AthabascanAlbanianAleutAlsatianAmericanApacheArabArapahoArgentineanArmenianAssyrian/Chaldean/SyriacAustralianAustrianBahamianBangladeshiBarbadianBasqueBelgianBelizeanBermudanBhutaneseBlackfeetBolivianBrazilianBritishBritish West IndianBulgarianBurmeseCajunCambodianCanadianCape VerdeanCarpatho RusynCelticCentral AmericanCentral American IndianCherokeeCheyenneChickasawChileanChineseChippewaChoctawColombianColvilleComancheCosta RicanCreeCreekCroatianCrowCubanCypriotCzechCzechoslovakianDanishDelawareDominicanDutchDutch West IndianEastern EuropeanEcuadorianEgyptianEnglishEstonianEthiopianEuropeanFijianFilipinoFinnishFrenchFrench American IndianFrench CanadianGermanGerman RussianGhanaianGreekGuamanian/ChamorroGuatemalanGuyaneseHaitianHmongHonduranHopiHoumaHungarianIcelanderIndian (Asian)IndonesianInupiatIranianIraqiIrishIroquoisIsraeliItalianJamaicanJapaneseJordanianKenyanKiowaKoreanLaotianLatvianLebaneseLiberianLithuanianLumbeeLuxembourgerMacedonianMalaysianMalteseMarshalleseMenomineeMexicanMexican American IndianMongolianMoroccanNative HawaiianNavajoNepaleseNew ZealanderNicaraguanNigerianNorthern EuropeanNorwegianOkinawanOsageOttawaPaiutePakistaniPalestinianPanamanianParaguayanPennsylvania GermanPeruvianPimaPolishPortuguesePotawatomiPuebloPuerto RicanPuget Sound SalishRomanianRussianSalvadoranSamoanScandinavianScotch-IrishScottishSeminoleSenegaleseSerbianShoshoneSierra LeoneanSiouxSlavicSlovakSloveneSomaliSouth AfricanSouth AmericanSouth American IndianSoviet UnionSpaniardSpanishSpanish AmericanSpanish American IndianSri LankanSubsaharan AfricanSudaneseSwedishSwissSyrianTaiwaneseThaiTlingit-HaidaTohono O'OdhamTonganTrinidadian and TobagonianTsimshianTurkishU.S. Virgin IslanderUgandanUkrainianUruguayanUteVenezuelanVietnameseWelshWest IndianYakamaYaquiYugoslavianYumanYup'ikZimbabwean
Immigration
NonimmigrantsImmigrantsAfghanistanAfricaAlbaniaArgentinaArmeniaAsiaAustraliaAustriaBahamasBangladeshBarbadosBelarusBelgiumBelizeBoliviaBosnia and HerzegovinaBrazilBulgariaBurma/MyanmarCabo VerdeCambodiaCameroonCanadaCaribbeanCentral AmericaChileChinaColombiaCongoCosta RicaCroatiaCubaCzechoslovakiaDenmarkDominicaDominican RepublicEastern AfricaEastern AsiaEastern EuropeEcuadorEgyptEl SalvadorEnglandEritreaEthiopiaEuropeFijiFranceGermanyGhanaGreeceGrenadaGuatemalaGuyanaHaitiHondurasHong KongHungaryIndiaIndonesiaIranIraqIrelandIsraelItalyJamaicaJapanJordanKazakhstanKenyaKoreaKuwaitLaosLatin AmericaLatviaLebanonLiberiaLithuaniaMalaysiaMexicoMicronesiaMiddle AfricaMoldovaMoroccoNepalNetherlandsNicaraguaNigeriaNorth AmericaNorth MacedoniaNorthern AfricaNorthern EuropeNorwayOceaniaPakistanPanamaPeruPhilippinesPolandPortugalRomaniaRussiaSaudi ArabiaScotlandSerbiaSierra LeoneSingaporeSomaliaSouth AfricaSouth AmericaSouth Central AsiaSouth Eastern AsiaSouthern EuropeSpainSri LankaSt. Vincent and the GrenadinesSudanSwedenSwitzerlandSyriaTaiwanThailandTrinidad and TobagoTurkeyUgandaUkraineUruguayUzbekistanVenezuelaVietnamWest IndiesWestern AfricaWestern AsiaWestern EuropeYemenZaireZimbabweAzores
Immigrants from Senegal
Race
Ancestry
AfghanAfricanAlaska NativeAlaskan AthabascanAlbanianAleutAlsatianAmericanApacheArabArapahoArgentineanArmenianAssyrian/Chaldean/SyriacAustralianAustrianBahamianBangladeshiBarbadianBasqueBelgianBelizeanBermudanBhutaneseBlackfeetBolivianBrazilianBritishBritish West IndianBulgarianBurmeseCajunCambodianCanadianCape VerdeanCarpatho RusynCelticCentral AmericanCentral American IndianCherokeeCheyenneChickasawChileanChineseChippewaChoctawColombianColvilleComancheCosta RicanCreeCreekCroatianCrowCubanCypriotCzechCzechoslovakianDanishDelawareDominicanDutchDutch West IndianEastern EuropeanEcuadorianEgyptianEnglishEstonianEthiopianEuropeanFijianFilipinoFinnishFrenchFrench American IndianFrench CanadianGermanGerman RussianGhanaianGreekGuamanian/ChamorroGuatemalanGuyaneseHaitianHmongHonduranHopiHoumaHungarianIcelanderIndian (Asian)IndonesianInupiatIranianIraqiIrishIroquoisIsraeliItalianJamaicanJapaneseJordanianKenyanKiowaKoreanLaotianLatvianLebaneseLiberianLithuanianLumbeeLuxembourgerMacedonianMalaysianMalteseMarshalleseMenomineeMexicanMexican American IndianMongolianMoroccanNative HawaiianNavajoNepaleseNew ZealanderNicaraguanNigerianNorthern EuropeanNorwegianOkinawanOsageOttawaPaiutePakistaniPalestinianPanamanianParaguayanPennsylvania GermanPeruvianPimaPolishPortuguesePotawatomiPuebloPuerto RicanPuget Sound SalishRomanianRussianSalvadoranSamoanScandinavianScotch-IrishScottishSeminoleSenegaleseSerbianShoshoneSierra LeoneanSiouxSlavicSlovakSloveneSomaliSouth AfricanSouth AmericanSouth American IndianSoviet UnionSpaniardSpanishSpanish AmericanSpanish American IndianSri LankanSubsaharan AfricanSudaneseSwissSyrianTaiwaneseThaiTlingit-HaidaTohono O'OdhamTonganTrinidadian and TobagonianTsimshianTurkishU.S. Virgin IslanderUgandanUkrainianUruguayanUteVenezuelanVietnameseWelshWest IndianYakamaYaquiYugoslavianYumanYup'ikZimbabwean
Immigration
NonimmigrantsImmigrantsAfghanistanAfricaAlbaniaArgentinaArmeniaAsiaAustraliaAustriaBahamasBangladeshBarbadosBelarusBelgiumBelizeBoliviaBosnia and HerzegovinaBrazilBulgariaBurma/MyanmarCabo VerdeCambodiaCameroonCanadaCaribbeanCentral AmericaChileChinaColombiaCongoCosta RicaCroatiaCubaCzechoslovakiaDenmarkDominicaDominican RepublicEastern AfricaEastern AsiaEastern EuropeEcuadorEgyptEl SalvadorEnglandEritreaEthiopiaEuropeFijiFranceGermanyGhanaGreeceGrenadaGuatemalaGuyanaHaitiHondurasHong KongHungaryIndiaIndonesiaIranIraqIrelandIsraelItalyJamaicaJapanJordanKazakhstanKenyaKoreaKuwaitLaosLatin AmericaLatviaLebanonLiberiaLithuaniaMalaysiaMexicoMicronesiaMiddle AfricaMoldovaMoroccoNepalNetherlandsNicaraguaNigeriaNorth AmericaNorth MacedoniaNorthern AfricaNorthern EuropeNorwayOceaniaPakistanPanamaPeruPhilippinesPolandPortugalRomaniaRussiaSaudi ArabiaScotlandSenegalSerbiaSierra LeoneSingaporeSomaliaSouth AfricaSouth AmericaSouth Central AsiaSouth Eastern AsiaSouthern EuropeSpainSri LankaSt. Vincent and the GrenadinesSudanSwedenSwitzerlandSyriaTaiwanThailandTrinidad and TobagoTurkeyUgandaUkraineUruguayUzbekistanVenezuelaVietnamWest IndiesWestern AfricaWestern AsiaWestern EuropeYemenZaireZimbabweAzores
Family Households with Children
Income
Poverty
Unemployment
Labor Participation
Family Structure
Vehicle Availability
Education Level
Disability

Family Households with Children Comparison

Swedes

Immigrants from Senegal

Fair
Tragic
27.4%
FAMILY HOUSEHOLDS WITH CHILDREN
36.9/ 100
METRIC RATING
193rd/ 347
METRIC RANK
26.5%
FAMILY HOUSEHOLDS WITH CHILDREN
0.2/ 100
METRIC RATING
286th/ 347
METRIC RANK

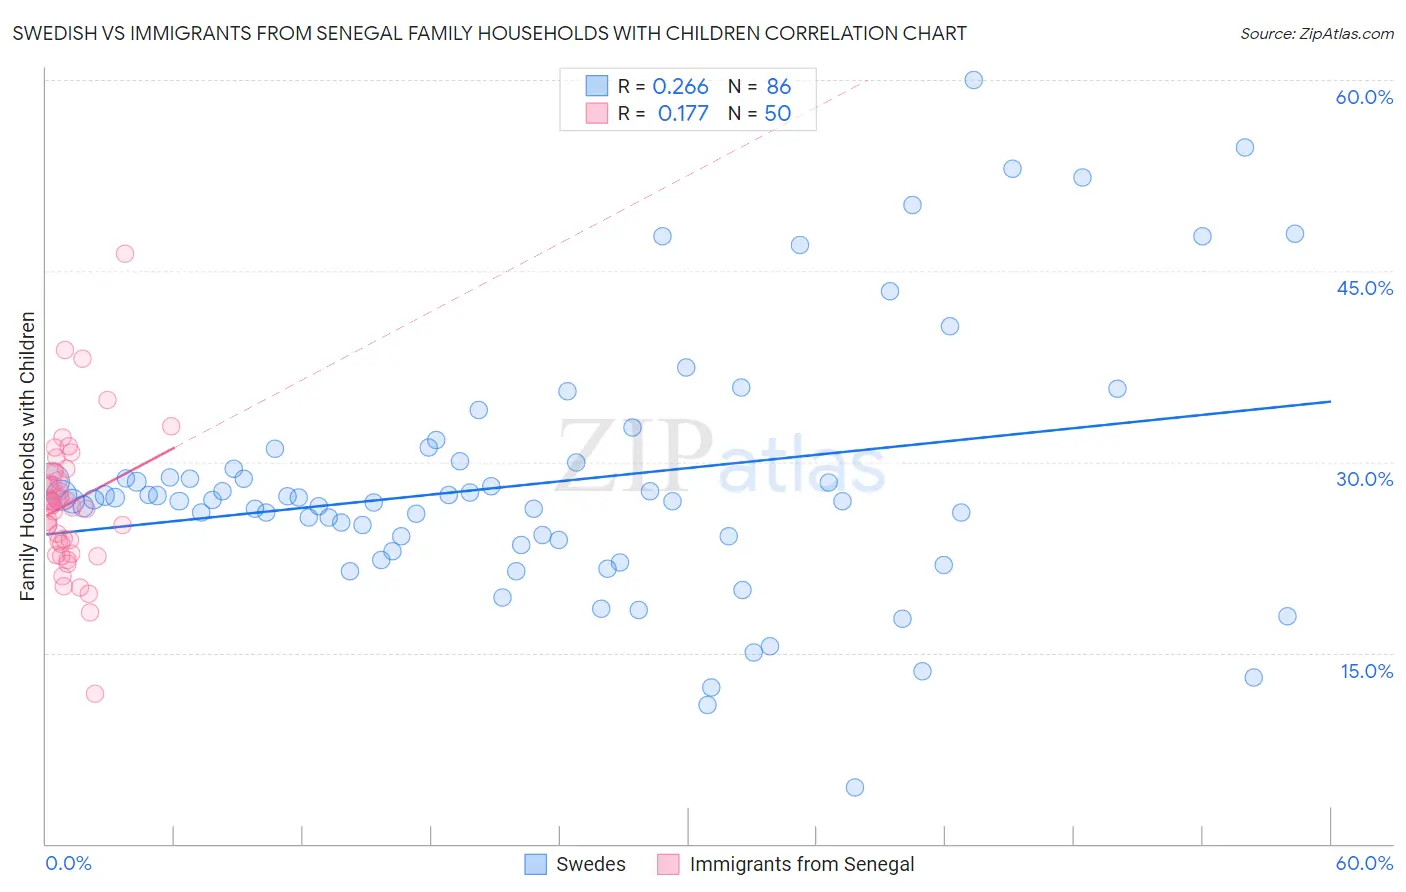
Swedish vs Immigrants from Senegal Family Households with Children Correlation Chart

The statistical analysis conducted on geographies consisting of 538,443,051 people shows a weak positive correlation between the proportion of Swedes and percentage of family households with children in the United States with a correlation coefficient (R) of 0.266 and weighted average of 27.4%. Similarly, the statistical analysis conducted on geographies consisting of 90,108,682 people shows a poor positive correlation between the proportion of Immigrants from Senegal and percentage of family households with children in the United States with a correlation coefficient (R) of 0.177 and weighted average of 26.5%, a difference of 3.2%.
Swedish vs Immigrants from Senegal Family Households with Children

Family Households with Children Correlation Summary

MeasurementSwedishImmigrants from Senegal
Minimum4.4%11.8%
Maximum60.0%46.4%
Range55.6%34.6%
Mean28.4%26.7%
Median27.0%26.8%
Interquartile 25% (IQ1)23.8%23.6%
Interquartile 75% (IQ3)30.0%29.1%
Interquartile Range (IQR)6.2%5.6%
Standard Deviation (Sample)10.0%5.6%
Standard Deviation (Population)10.0%5.5%

Similar Demographics by Family Households with Children

Demographics Similar to Swedes by Family Households with Children

In terms of family households with children, the demographic groups most similar to Swedes are Immigrants from Israel (27.4%, a difference of 0.020%), Immigrants from Uruguay (27.4%, a difference of 0.020%), Sudanese (27.4%, a difference of 0.020%), Pennsylvania German (27.4%, a difference of 0.020%), and Immigrants from Iran (27.4%, a difference of 0.020%).
DemographicsRating | RankFamily Households with Children
Immigrants | Brazil
40.6
/100
|
#186
Average
27.4%
Creek
39.8
/100
|
#187
Fair
27.4%
Dutch
38.8
/100
|
#188
Fair
27.4%
Immigrants | Israel
37.9
/100
|
#189
Fair
27.4%
Immigrants | Uruguay
37.7
/100
|
#190
Fair
27.4%
Sudanese
37.6
/100
|
#191
Fair
27.4%
Pennsylvania Germans
37.5
/100
|
#192
Fair
27.4%
Swedes
36.9
/100
|
#193
Fair
27.4%
Immigrants | Iran
36.1
/100
|
#194
Fair
27.4%
Crow
35.7
/100
|
#195
Fair
27.4%
Cheyenne
35.1
/100
|
#196
Fair
27.4%
Norwegians
35.0
/100
|
#197
Fair
27.4%
Immigrants | Romania
34.4
/100
|
#198
Fair
27.4%
English
32.0
/100
|
#199
Fair
27.3%
Immigrants | Congo
28.7
/100
|
#200
Fair
27.3%

Demographics Similar to Immigrants from Senegal by Family Households with Children

In terms of family households with children, the demographic groups most similar to Immigrants from Senegal are Shoshone (26.5%, a difference of 0.0%), Russian (26.5%, a difference of 0.020%), Cambodian (26.5%, a difference of 0.050%), Immigrants from Sweden (26.5%, a difference of 0.070%), and Immigrants from Canada (26.5%, a difference of 0.080%).
DemographicsRating | RankFamily Households with Children
Finns
0.4
/100
|
#279
Tragic
26.6%
Senegalese
0.4
/100
|
#280
Tragic
26.6%
Lithuanians
0.3
/100
|
#281
Tragic
26.6%
French American Indians
0.3
/100
|
#282
Tragic
26.6%
Immigrants | North America
0.3
/100
|
#283
Tragic
26.6%
Immigrants | Canada
0.3
/100
|
#284
Tragic
26.5%
Cambodians
0.2
/100
|
#285
Tragic
26.5%
Immigrants | Senegal
0.2
/100
|
#286
Tragic
26.5%
Shoshone
0.2
/100
|
#287
Tragic
26.5%
Russians
0.2
/100
|
#288
Tragic
26.5%
Immigrants | Sweden
0.2
/100
|
#289
Tragic
26.5%
Albanians
0.2
/100
|
#290
Tragic
26.5%
Bahamians
0.2
/100
|
#291
Tragic
26.5%
Poles
0.2
/100
|
#292
Tragic
26.5%
Blacks/African Americans
0.1
/100
|
#293
Tragic
26.5%