Sudanese vs Tlingit-Haida Family Households with Children
COMPARE
Sudanese
Tlingit-Haida
Family Households with Children
Family Households with Children Comparison
Sudanese
Tlingit-Haida
27.4%
FAMILY HOUSEHOLDS WITH CHILDREN
37.6/ 100
METRIC RATING
191st/ 347
METRIC RANK
26.0%
FAMILY HOUSEHOLDS WITH CHILDREN
0.0/ 100
METRIC RATING
320th/ 347
METRIC RANK
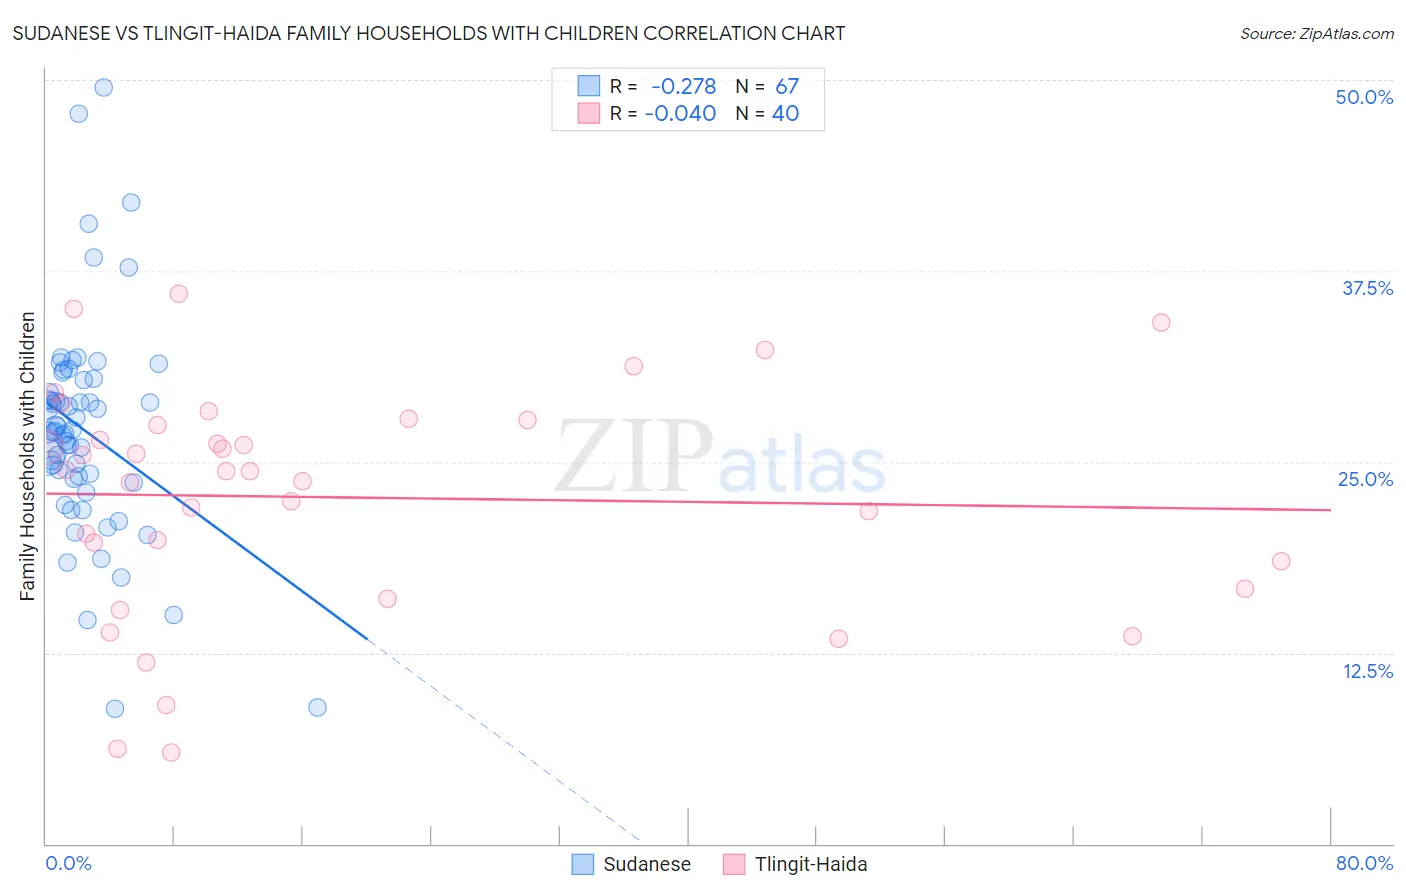
Sudanese vs Tlingit-Haida Family Households with Children Correlation Chart
The statistical analysis conducted on geographies consisting of 110,102,819 people shows a weak negative correlation between the proportion of Sudanese and percentage of family households with children in the United States with a correlation coefficient (R) of -0.278 and weighted average of 27.4%. Similarly, the statistical analysis conducted on geographies consisting of 60,854,309 people shows no correlation between the proportion of Tlingit-Haida and percentage of family households with children in the United States with a correlation coefficient (R) of -0.040 and weighted average of 26.0%, a difference of 5.1%.
Family Households with Children Correlation Summary
| Measurement | Sudanese | Tlingit-Haida |
| Minimum | 8.8% | 6.0% |
| Maximum | 49.5% | 36.0% |
| Range | 40.7% | 30.0% |
| Mean | 27.1% | 22.7% |
| Median | 27.0% | 24.4% |
| Interquartile 25% (IQ1) | 23.9% | 17.6% |
| Interquartile 75% (IQ3) | 30.4% | 27.6% |
| Interquartile Range (IQR) | 6.4% | 10.0% |
| Standard Deviation (Sample) | 7.1% | 7.5% |
| Standard Deviation (Population) | 7.1% | 7.4% |
Similar Demographics by Family Households with Children
Demographics Similar to Sudanese by Family Households with Children
In terms of family households with children, the demographic groups most similar to Sudanese are Immigrants from Uruguay (27.4%, a difference of 0.0%), Pennsylvania German (27.4%, a difference of 0.0%), Immigrants from Israel (27.4%, a difference of 0.010%), Swedish (27.4%, a difference of 0.020%), and Dutch (27.4%, a difference of 0.030%).
| Demographics | Rating | Rank | Family Households with Children |
| Native Hawaiians | 44.6 /100 | #184 | Average 27.4% |
| Delaware | 42.0 /100 | #185 | Average 27.4% |
| Immigrants | Brazil | 40.6 /100 | #186 | Average 27.4% |
| Creek | 39.8 /100 | #187 | Fair 27.4% |
| Dutch | 38.8 /100 | #188 | Fair 27.4% |
| Immigrants | Israel | 37.9 /100 | #189 | Fair 27.4% |
| Immigrants | Uruguay | 37.7 /100 | #190 | Fair 27.4% |
| Sudanese | 37.6 /100 | #191 | Fair 27.4% |
| Pennsylvania Germans | 37.5 /100 | #192 | Fair 27.4% |
| Swedes | 36.9 /100 | #193 | Fair 27.4% |
| Immigrants | Iran | 36.1 /100 | #194 | Fair 27.4% |
| Crow | 35.7 /100 | #195 | Fair 27.4% |
| Cheyenne | 35.1 /100 | #196 | Fair 27.4% |
| Norwegians | 35.0 /100 | #197 | Fair 27.4% |
| Immigrants | Romania | 34.4 /100 | #198 | Fair 27.4% |
Demographics Similar to Tlingit-Haida by Family Households with Children
In terms of family households with children, the demographic groups most similar to Tlingit-Haida are British West Indian (26.0%, a difference of 0.010%), Immigrants from France (26.0%, a difference of 0.020%), Immigrants from Greece (26.0%, a difference of 0.030%), Immigrants from Australia (26.0%, a difference of 0.060%), and Chinese (26.0%, a difference of 0.090%).
| Demographics | Rating | Rank | Family Households with Children |
| Cree | 0.0 /100 | #313 | Tragic 26.2% |
| French Canadians | 0.0 /100 | #314 | Tragic 26.1% |
| Immigrants | Norway | 0.0 /100 | #315 | Tragic 26.1% |
| Estonians | 0.0 /100 | #316 | Tragic 26.1% |
| Ottawa | 0.0 /100 | #317 | Tragic 26.1% |
| Iroquois | 0.0 /100 | #318 | Tragic 26.1% |
| Immigrants | France | 0.0 /100 | #319 | Tragic 26.0% |
| Tlingit-Haida | 0.0 /100 | #320 | Tragic 26.0% |
| British West Indians | 0.0 /100 | #321 | Tragic 26.0% |
| Immigrants | Greece | 0.0 /100 | #322 | Tragic 26.0% |
| Immigrants | Australia | 0.0 /100 | #323 | Tragic 26.0% |
| Chinese | 0.0 /100 | #324 | Tragic 26.0% |
| Barbadians | 0.0 /100 | #325 | Tragic 26.0% |
| Immigrants | Ireland | 0.0 /100 | #326 | Tragic 26.0% |
| Immigrants | Barbados | 0.0 /100 | #327 | Tragic 26.0% |