Sudanese vs Scottish Births to Unmarried Women
COMPARE
Sudanese
Scottish
Births to Unmarried Women
Births to Unmarried Women Comparison
Sudanese
Scottish
32.4%
BIRTHS TO UNMARRIED WOMEN
27.3/ 100
METRIC RATING
194th/ 347
METRIC RANK
31.7%
BIRTHS TO UNMARRIED WOMEN
48.1/ 100
METRIC RATING
176th/ 347
METRIC RANK
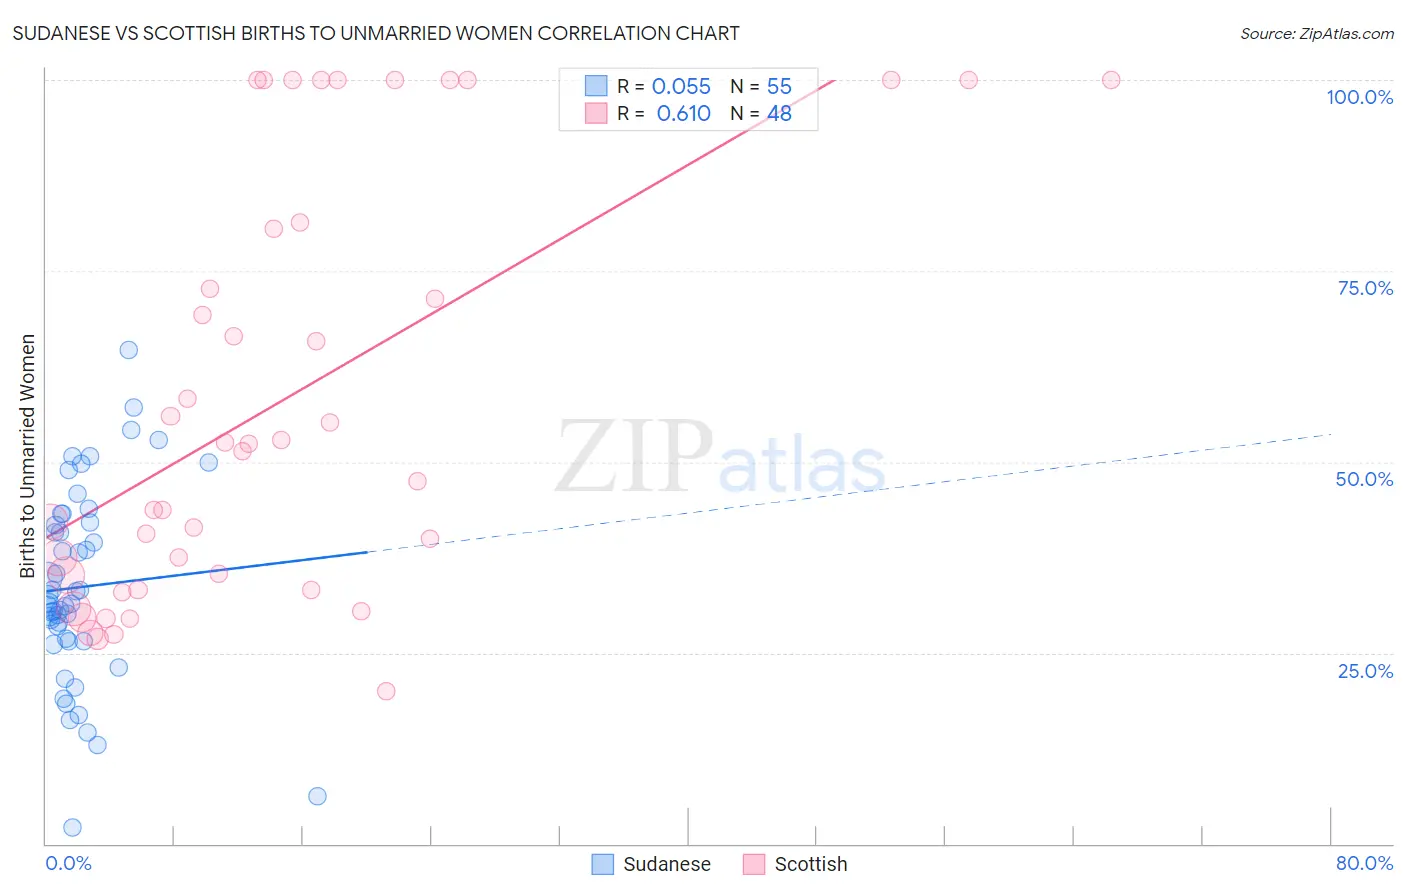
Sudanese vs Scottish Births to Unmarried Women Correlation Chart
The statistical analysis conducted on geographies consisting of 107,881,308 people shows a slight positive correlation between the proportion of Sudanese and percentage of births to unmarried women in the United States with a correlation coefficient (R) of 0.055 and weighted average of 32.4%. Similarly, the statistical analysis conducted on geographies consisting of 501,775,735 people shows a significant positive correlation between the proportion of Scottish and percentage of births to unmarried women in the United States with a correlation coefficient (R) of 0.610 and weighted average of 31.7%, a difference of 2.1%.
Births to Unmarried Women Correlation Summary
| Measurement | Sudanese | Scottish |
| Minimum | 2.2% | 20.0% |
| Maximum | 64.6% | 100.0% |
| Range | 62.4% | 80.0% |
| Mean | 33.6% | 58.0% |
| Median | 31.5% | 51.9% |
| Interquartile 25% (IQ1) | 26.5% | 34.3% |
| Interquartile 75% (IQ3) | 42.0% | 80.9% |
| Interquartile Range (IQR) | 15.5% | 46.7% |
| Standard Deviation (Sample) | 12.8% | 27.2% |
| Standard Deviation (Population) | 12.6% | 26.9% |
Demographics Similar to Sudanese and Scottish by Births to Unmarried Women
In terms of births to unmarried women, the demographic groups most similar to Sudanese are Fijian (32.3%, a difference of 0.42%), Colombian (32.2%, a difference of 0.51%), Irish (32.2%, a difference of 0.57%), Tlingit-Haida (32.2%, a difference of 0.59%), and Samoan (32.6%, a difference of 0.67%). Similarly, the demographic groups most similar to Scottish are South American Indian (31.7%, a difference of 0.040%), English (31.7%, a difference of 0.070%), Immigrants from Venezuela (31.7%, a difference of 0.10%), South American (31.8%, a difference of 0.11%), and Moroccan (31.8%, a difference of 0.22%).
| Demographics | Rating | Rank | Births to Unmarried Women |
| Immigrants | Venezuela | 49.2 /100 | #175 | Average 31.7% |
| Scottish | 48.1 /100 | #176 | Average 31.7% |
| South American Indians | 47.7 /100 | #177 | Average 31.7% |
| English | 47.4 /100 | #178 | Average 31.7% |
| South Americans | 46.9 /100 | #179 | Average 31.8% |
| Moroccans | 45.7 /100 | #180 | Average 31.8% |
| Immigrants | Peru | 45.1 /100 | #181 | Average 31.8% |
| Kenyans | 43.0 /100 | #182 | Average 31.9% |
| Canadians | 41.4 /100 | #183 | Average 31.9% |
| Immigrants | South America | 40.7 /100 | #184 | Average 32.0% |
| Germans | 39.5 /100 | #185 | Fair 32.0% |
| Welsh | 38.2 /100 | #186 | Fair 32.0% |
| Czechoslovakians | 38.0 /100 | #187 | Fair 32.0% |
| Osage | 37.1 /100 | #188 | Fair 32.1% |
| Immigrants | Kenya | 36.9 /100 | #189 | Fair 32.1% |
| Tlingit-Haida | 32.6 /100 | #190 | Fair 32.2% |
| Irish | 32.4 /100 | #191 | Fair 32.2% |
| Colombians | 31.9 /100 | #192 | Fair 32.2% |
| Fijians | 31.1 /100 | #193 | Fair 32.3% |
| Sudanese | 27.3 /100 | #194 | Fair 32.4% |
| Samoans | 21.9 /100 | #195 | Fair 32.6% |