Spanish vs Immigrants from Egypt Currently Married
COMPARE
Spanish
Immigrants from Egypt
Currently Married
Currently Married Comparison
Spanish
Immigrants from Egypt
47.0%
CURRENTLY MARRIED
68.1/ 100
METRIC RATING
156th/ 347
METRIC RANK
47.7%
CURRENTLY MARRIED
92.3/ 100
METRIC RATING
109th/ 347
METRIC RANK
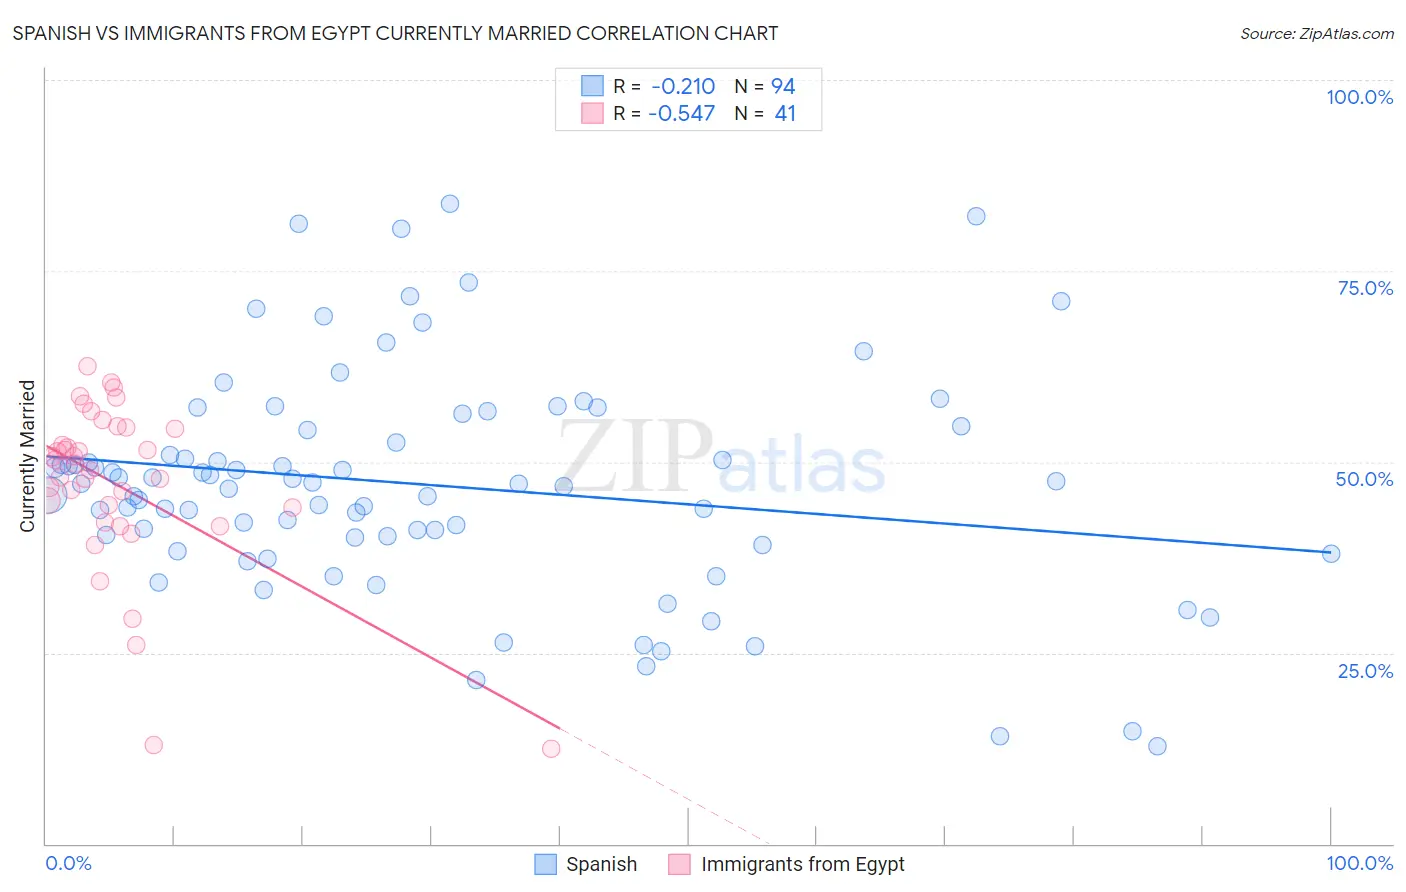
Spanish vs Immigrants from Egypt Currently Married Correlation Chart
The statistical analysis conducted on geographies consisting of 422,154,276 people shows a weak negative correlation between the proportion of Spanish and percentage of population currently married in the United States with a correlation coefficient (R) of -0.210 and weighted average of 47.0%. Similarly, the statistical analysis conducted on geographies consisting of 245,480,617 people shows a substantial negative correlation between the proportion of Immigrants from Egypt and percentage of population currently married in the United States with a correlation coefficient (R) of -0.547 and weighted average of 47.7%, a difference of 1.6%.
Currently Married Correlation Summary
| Measurement | Spanish | Immigrants from Egypt |
| Minimum | 12.8% | 12.5% |
| Maximum | 83.7% | 62.5% |
| Range | 70.9% | 50.0% |
| Mean | 47.0% | 47.1% |
| Median | 47.2% | 49.7% |
| Interquartile 25% (IQ1) | 40.1% | 43.1% |
| Interquartile 75% (IQ3) | 54.2% | 54.5% |
| Interquartile Range (IQR) | 14.1% | 11.4% |
| Standard Deviation (Sample) | 14.5% | 11.1% |
| Standard Deviation (Population) | 14.4% | 11.0% |
Similar Demographics by Currently Married
Demographics Similar to Spanish by Currently Married
In terms of currently married, the demographic groups most similar to Spanish are Immigrants from Switzerland (46.9%, a difference of 0.010%), Immigrants from Venezuela (47.0%, a difference of 0.020%), Albanian (47.0%, a difference of 0.020%), Arab (47.0%, a difference of 0.020%), and Immigrants from Serbia (47.0%, a difference of 0.030%).
| Demographics | Rating | Rank | Currently Married |
| Zimbabweans | 70.1 /100 | #149 | Good 47.0% |
| Immigrants | Turkey | 70.0 /100 | #150 | Good 47.0% |
| Chileans | 69.8 /100 | #151 | Good 47.0% |
| Immigrants | Serbia | 68.8 /100 | #152 | Good 47.0% |
| Immigrants | Venezuela | 68.6 /100 | #153 | Good 47.0% |
| Albanians | 68.6 /100 | #154 | Good 47.0% |
| Arabs | 68.6 /100 | #155 | Good 47.0% |
| Spanish | 68.1 /100 | #156 | Good 47.0% |
| Immigrants | Switzerland | 67.8 /100 | #157 | Good 46.9% |
| Cherokee | 66.8 /100 | #158 | Good 46.9% |
| Iraqis | 66.4 /100 | #159 | Good 46.9% |
| Immigrants | Uzbekistan | 66.0 /100 | #160 | Good 46.9% |
| Immigrants | Southern Europe | 65.9 /100 | #161 | Good 46.9% |
| Immigrants | Nonimmigrants | 65.4 /100 | #162 | Good 46.9% |
| Delaware | 64.7 /100 | #163 | Good 46.9% |
Demographics Similar to Immigrants from Egypt by Currently Married
In terms of currently married, the demographic groups most similar to Immigrants from Egypt are Tsimshian (47.7%, a difference of 0.010%), Immigrants from Russia (47.7%, a difference of 0.040%), Immigrants from Italy (47.7%, a difference of 0.080%), Immigrants from Greece (47.7%, a difference of 0.11%), and Immigrants from Hungary (47.6%, a difference of 0.13%).
| Demographics | Rating | Rank | Currently Married |
| Turks | 93.9 /100 | #102 | Exceptional 47.8% |
| Cypriots | 93.7 /100 | #103 | Exceptional 47.8% |
| Serbians | 93.6 /100 | #104 | Exceptional 47.8% |
| Immigrants | Singapore | 93.3 /100 | #105 | Exceptional 47.8% |
| Immigrants | Greece | 93.1 /100 | #106 | Exceptional 47.7% |
| Immigrants | Italy | 92.9 /100 | #107 | Exceptional 47.7% |
| Tsimshian | 92.4 /100 | #108 | Exceptional 47.7% |
| Immigrants | Egypt | 92.3 /100 | #109 | Exceptional 47.7% |
| Immigrants | Russia | 92.0 /100 | #110 | Exceptional 47.7% |
| Immigrants | Hungary | 91.2 /100 | #111 | Exceptional 47.6% |
| Immigrants | Western Europe | 91.1 /100 | #112 | Exceptional 47.6% |
| Immigrants | Denmark | 90.9 /100 | #113 | Exceptional 47.6% |
| South Africans | 90.5 /100 | #114 | Exceptional 47.6% |
| Immigrants | Indonesia | 90.5 /100 | #115 | Exceptional 47.6% |
| Palestinians | 90.4 /100 | #116 | Exceptional 47.6% |