Spanish American vs Bangladeshi Births to Unmarried Women
COMPARE
Spanish American
Bangladeshi
Births to Unmarried Women
Births to Unmarried Women Comparison
Spanish Americans
Bangladeshis
38.6%
BIRTHS TO UNMARRIED WOMEN
0.0/ 100
METRIC RATING
299th/ 347
METRIC RANK
34.4%
BIRTHS TO UNMARRIED WOMEN
2.5/ 100
METRIC RATING
233rd/ 347
METRIC RANK
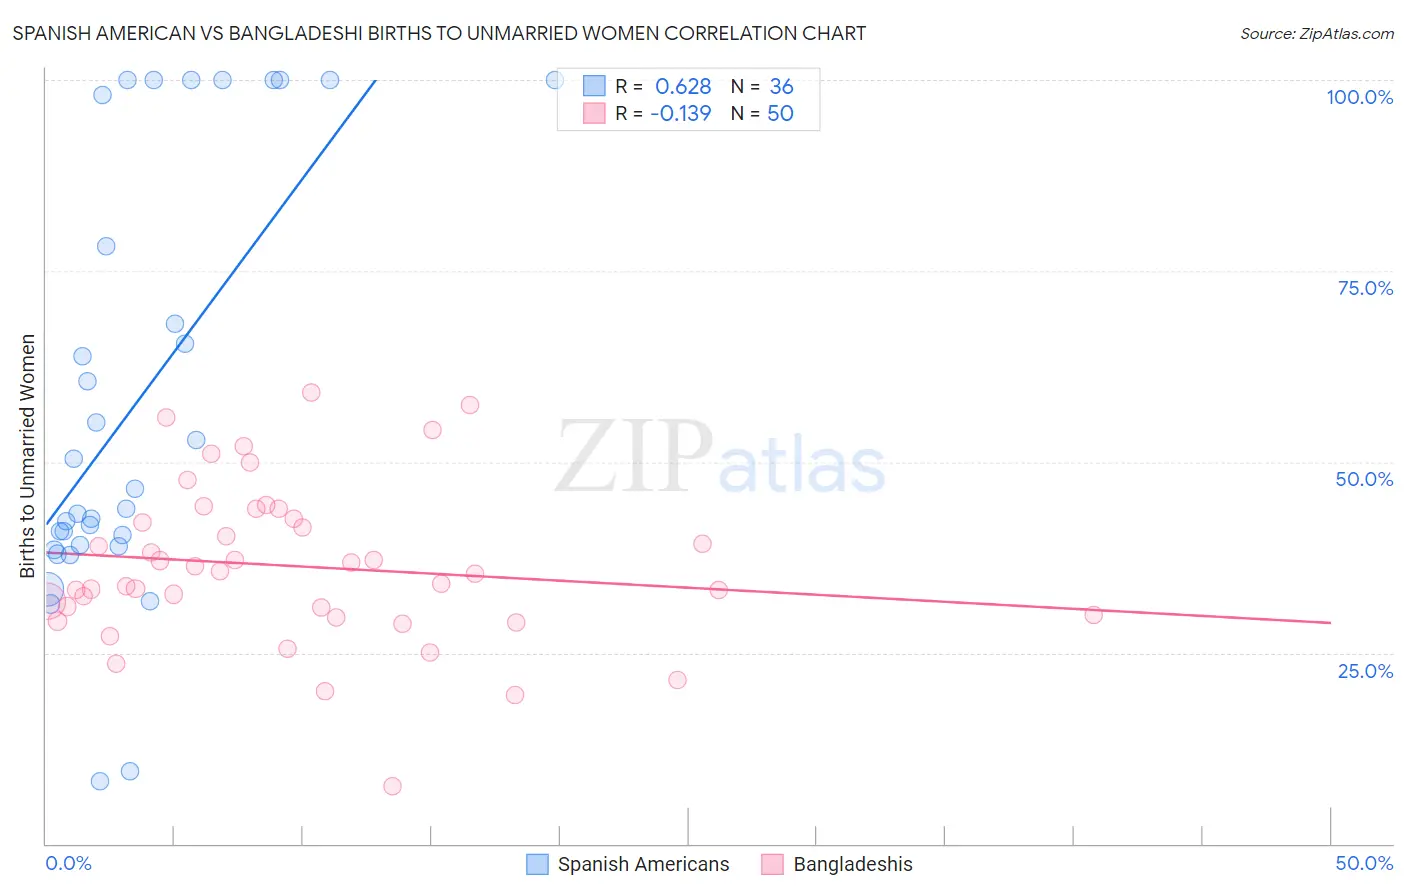
Spanish American vs Bangladeshi Births to Unmarried Women Correlation Chart
The statistical analysis conducted on geographies consisting of 101,589,972 people shows a significant positive correlation between the proportion of Spanish Americans and percentage of births to unmarried women in the United States with a correlation coefficient (R) of 0.628 and weighted average of 38.6%. Similarly, the statistical analysis conducted on geographies consisting of 137,729,923 people shows a poor negative correlation between the proportion of Bangladeshis and percentage of births to unmarried women in the United States with a correlation coefficient (R) of -0.139 and weighted average of 34.4%, a difference of 12.0%.
Births to Unmarried Women Correlation Summary
| Measurement | Spanish American | Bangladeshi |
| Minimum | 8.2% | 7.6% |
| Maximum | 100.0% | 59.1% |
| Range | 91.8% | 51.5% |
| Mean | 57.8% | 36.4% |
| Median | 45.1% | 35.5% |
| Interquartile 25% (IQ1) | 39.1% | 30.0% |
| Interquartile 75% (IQ3) | 88.1% | 42.6% |
| Interquartile Range (IQR) | 49.1% | 12.6% |
| Standard Deviation (Sample) | 28.0% | 10.4% |
| Standard Deviation (Population) | 27.6% | 10.3% |
Similar Demographics by Births to Unmarried Women
Demographics Similar to Spanish Americans by Births to Unmarried Women
In terms of births to unmarried women, the demographic groups most similar to Spanish Americans are Immigrants from West Indies (38.6%, a difference of 0.060%), Haitian (38.6%, a difference of 0.070%), Jamaican (38.5%, a difference of 0.20%), Honduran (38.7%, a difference of 0.31%), and Dutch West Indian (38.4%, a difference of 0.40%).
| Demographics | Rating | Rank | Births to Unmarried Women |
| Blackfeet | 0.0 /100 | #292 | Tragic 37.9% |
| Immigrants | Nicaragua | 0.0 /100 | #293 | Tragic 38.0% |
| British West Indians | 0.0 /100 | #294 | Tragic 38.0% |
| Iroquois | 0.0 /100 | #295 | Tragic 38.2% |
| Alaska Natives | 0.0 /100 | #296 | Tragic 38.3% |
| Dutch West Indians | 0.0 /100 | #297 | Tragic 38.4% |
| Jamaicans | 0.0 /100 | #298 | Tragic 38.5% |
| Spanish Americans | 0.0 /100 | #299 | Tragic 38.6% |
| Immigrants | West Indies | 0.0 /100 | #300 | Tragic 38.6% |
| Haitians | 0.0 /100 | #301 | Tragic 38.6% |
| Hondurans | 0.0 /100 | #302 | Tragic 38.7% |
| Immigrants | Jamaica | 0.0 /100 | #303 | Tragic 38.8% |
| Yaqui | 0.0 /100 | #304 | Tragic 38.8% |
| Immigrants | Haiti | 0.0 /100 | #305 | Tragic 38.9% |
| Central American Indians | 0.0 /100 | #306 | Tragic 39.0% |
Demographics Similar to Bangladeshis by Births to Unmarried Women
In terms of births to unmarried women, the demographic groups most similar to Bangladeshis are French Canadian (34.4%, a difference of 0.020%), Immigrants from Zaire (34.5%, a difference of 0.24%), Native Hawaiian (34.3%, a difference of 0.31%), Immigrants from Ghana (34.5%, a difference of 0.31%), and Ghanaian (34.3%, a difference of 0.46%).
| Demographics | Rating | Rank | Births to Unmarried Women |
| Delaware | 3.3 /100 | #226 | Tragic 34.2% |
| Immigrants | Panama | 3.3 /100 | #227 | Tragic 34.2% |
| Panamanians | 3.3 /100 | #228 | Tragic 34.2% |
| Immigrants | Sierra Leone | 3.1 /100 | #229 | Tragic 34.2% |
| Ghanaians | 3.1 /100 | #230 | Tragic 34.3% |
| Native Hawaiians | 2.9 /100 | #231 | Tragic 34.3% |
| French Canadians | 2.5 /100 | #232 | Tragic 34.4% |
| Bangladeshis | 2.5 /100 | #233 | Tragic 34.4% |
| Immigrants | Zaire | 2.3 /100 | #234 | Tragic 34.5% |
| Immigrants | Ghana | 2.2 /100 | #235 | Tragic 34.5% |
| Immigrants | Cameroon | 1.6 /100 | #236 | Tragic 34.7% |
| Marshallese | 1.6 /100 | #237 | Tragic 34.8% |
| Immigrants | Cambodia | 1.6 /100 | #238 | Tragic 34.8% |
| Sierra Leoneans | 1.4 /100 | #239 | Tragic 34.9% |
| Immigrants | Middle Africa | 1.2 /100 | #240 | Tragic 34.9% |