Spanish American Indian vs Immigrants from West Indies Married-couple Households
COMPARE
Spanish American Indian
Immigrants from West Indies
Married-couple Households
Married-couple Households Comparison
Spanish American Indians
Immigrants from West Indies
46.6%
MARRIED-COUPLE HOUSEHOLDS
59.4/ 100
METRIC RATING
169th/ 347
METRIC RANK
39.0%
MARRIED-COUPLE HOUSEHOLDS
0.0/ 100
METRIC RATING
333rd/ 347
METRIC RANK
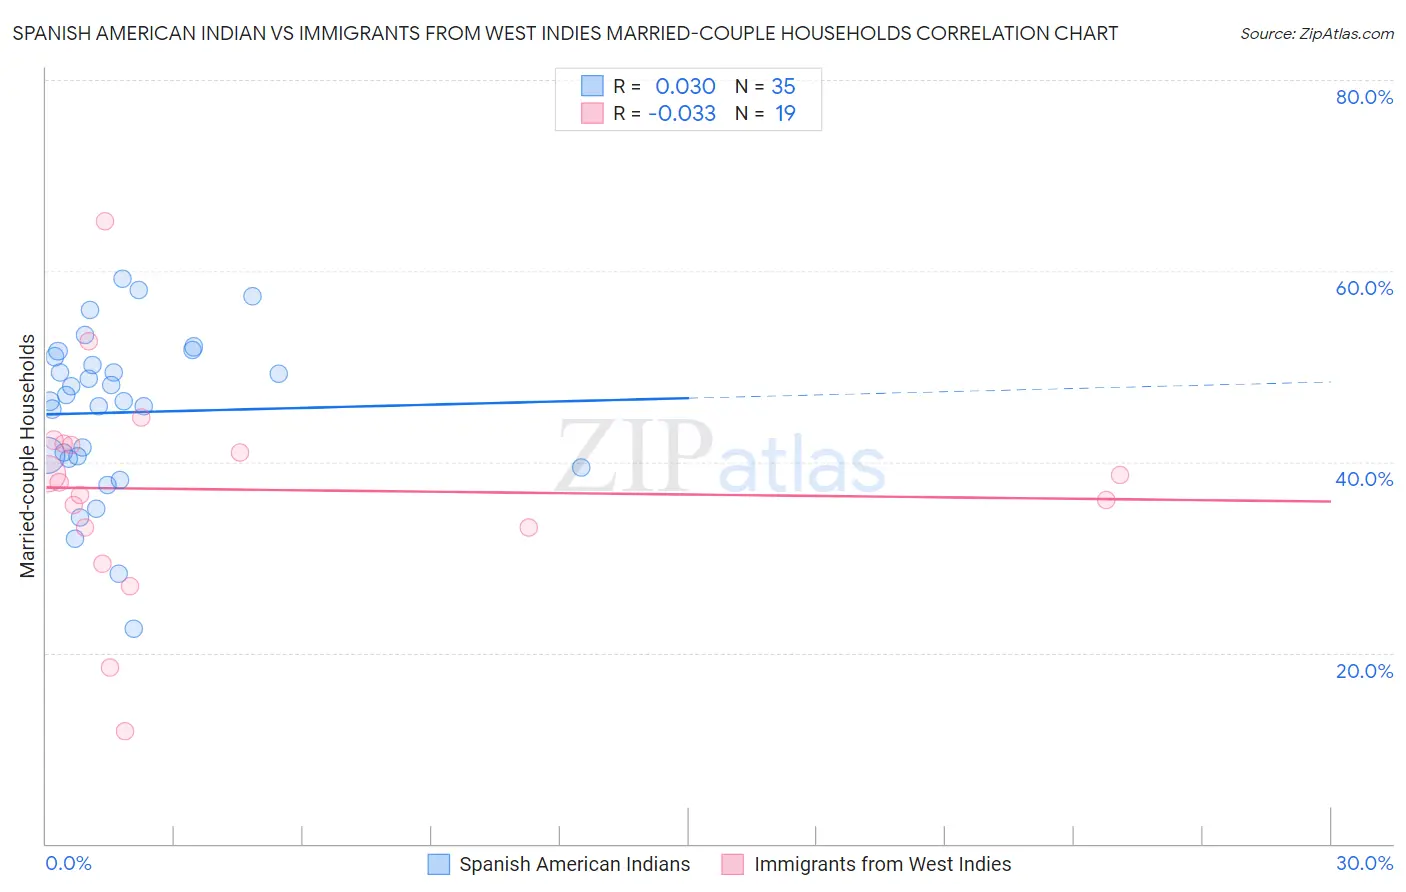
Spanish American Indian vs Immigrants from West Indies Married-couple Households Correlation Chart
The statistical analysis conducted on geographies consisting of 73,145,550 people shows no correlation between the proportion of Spanish American Indians and percentage of married-couple family households in the United States with a correlation coefficient (R) of 0.030 and weighted average of 46.6%. Similarly, the statistical analysis conducted on geographies consisting of 72,454,628 people shows no correlation between the proportion of Immigrants from West Indies and percentage of married-couple family households in the United States with a correlation coefficient (R) of -0.033 and weighted average of 39.0%, a difference of 19.6%.
Married-couple Households Correlation Summary
| Measurement | Spanish American Indian | Immigrants from West Indies |
| Minimum | 22.6% | 11.8% |
| Maximum | 59.2% | 65.1% |
| Range | 36.7% | 53.3% |
| Mean | 45.2% | 37.1% |
| Median | 46.3% | 37.9% |
| Interquartile 25% (IQ1) | 40.3% | 33.1% |
| Interquartile 75% (IQ3) | 51.0% | 41.9% |
| Interquartile Range (IQR) | 10.7% | 8.8% |
| Standard Deviation (Sample) | 8.4% | 11.5% |
| Standard Deviation (Population) | 8.3% | 11.1% |
Similar Demographics by Married-couple Households
Demographics Similar to Spanish American Indians by Married-couple Households
In terms of married-couple households, the demographic groups most similar to Spanish American Indians are South American (46.6%, a difference of 0.050%), Israeli (46.7%, a difference of 0.11%), Immigrants from Chile (46.5%, a difference of 0.14%), Immigrants from Australia (46.5%, a difference of 0.18%), and Immigrants from Croatia (46.7%, a difference of 0.19%).
| Demographics | Rating | Rank | Married-couple Households |
| Colombians | 71.0 /100 | #162 | Good 46.8% |
| Immigrants | Turkey | 70.2 /100 | #163 | Good 46.8% |
| Immigrants | Kazakhstan | 70.0 /100 | #164 | Good 46.8% |
| Immigrants | Southern Europe | 69.9 /100 | #165 | Good 46.8% |
| Cherokee | 65.7 /100 | #166 | Good 46.7% |
| Immigrants | Croatia | 64.2 /100 | #167 | Good 46.7% |
| Israelis | 62.3 /100 | #168 | Good 46.7% |
| Spanish American Indians | 59.4 /100 | #169 | Average 46.6% |
| South Americans | 58.0 /100 | #170 | Average 46.6% |
| Immigrants | Chile | 55.7 /100 | #171 | Average 46.5% |
| Immigrants | Australia | 54.6 /100 | #172 | Average 46.5% |
| Immigrants | Norway | 52.0 /100 | #173 | Average 46.5% |
| Immigrants | Mexico | 50.0 /100 | #174 | Average 46.4% |
| Immigrants | Colombia | 46.1 /100 | #175 | Average 46.4% |
| Cajuns | 45.2 /100 | #176 | Average 46.4% |
Demographics Similar to Immigrants from West Indies by Married-couple Households
In terms of married-couple households, the demographic groups most similar to Immigrants from West Indies are Somali (39.0%, a difference of 0.030%), Immigrants from Congo (39.0%, a difference of 0.12%), Immigrants from Barbados (39.2%, a difference of 0.56%), Immigrants from St. Vincent and the Grenadines (38.7%, a difference of 0.78%), and Immigrants from Dominica (39.4%, a difference of 1.0%).
| Demographics | Rating | Rank | Married-couple Households |
| U.S. Virgin Islanders | 0.0 /100 | #326 | Tragic 39.8% |
| Lumbee | 0.0 /100 | #327 | Tragic 39.6% |
| Barbadians | 0.0 /100 | #328 | Tragic 39.4% |
| Immigrants | Dominica | 0.0 /100 | #329 | Tragic 39.4% |
| Immigrants | Barbados | 0.0 /100 | #330 | Tragic 39.2% |
| Immigrants | Congo | 0.0 /100 | #331 | Tragic 39.0% |
| Somalis | 0.0 /100 | #332 | Tragic 39.0% |
| Immigrants | West Indies | 0.0 /100 | #333 | Tragic 39.0% |
| Immigrants | St. Vincent and the Grenadines | 0.0 /100 | #334 | Tragic 38.7% |
| Senegalese | 0.0 /100 | #335 | Tragic 38.6% |
| Blacks/African Americans | 0.0 /100 | #336 | Tragic 38.5% |
| Immigrants | Somalia | 0.0 /100 | #337 | Tragic 38.4% |
| Immigrants | Senegal | 0.0 /100 | #338 | Tragic 38.4% |
| British West Indians | 0.0 /100 | #339 | Tragic 38.3% |
| Dominicans | 0.0 /100 | #340 | Tragic 38.2% |