Spaniard vs Immigrants from Asia Family Households
COMPARE
Spaniard
Immigrants from Asia
Family Households
Family Households Comparison
Spaniards
Immigrants from Asia
65.1%
FAMILY HOUSEHOLDS
97.8/ 100
METRIC RATING
104th/ 347
METRIC RANK
66.1%
FAMILY HOUSEHOLDS
100.0/ 100
METRIC RATING
58th/ 347
METRIC RANK
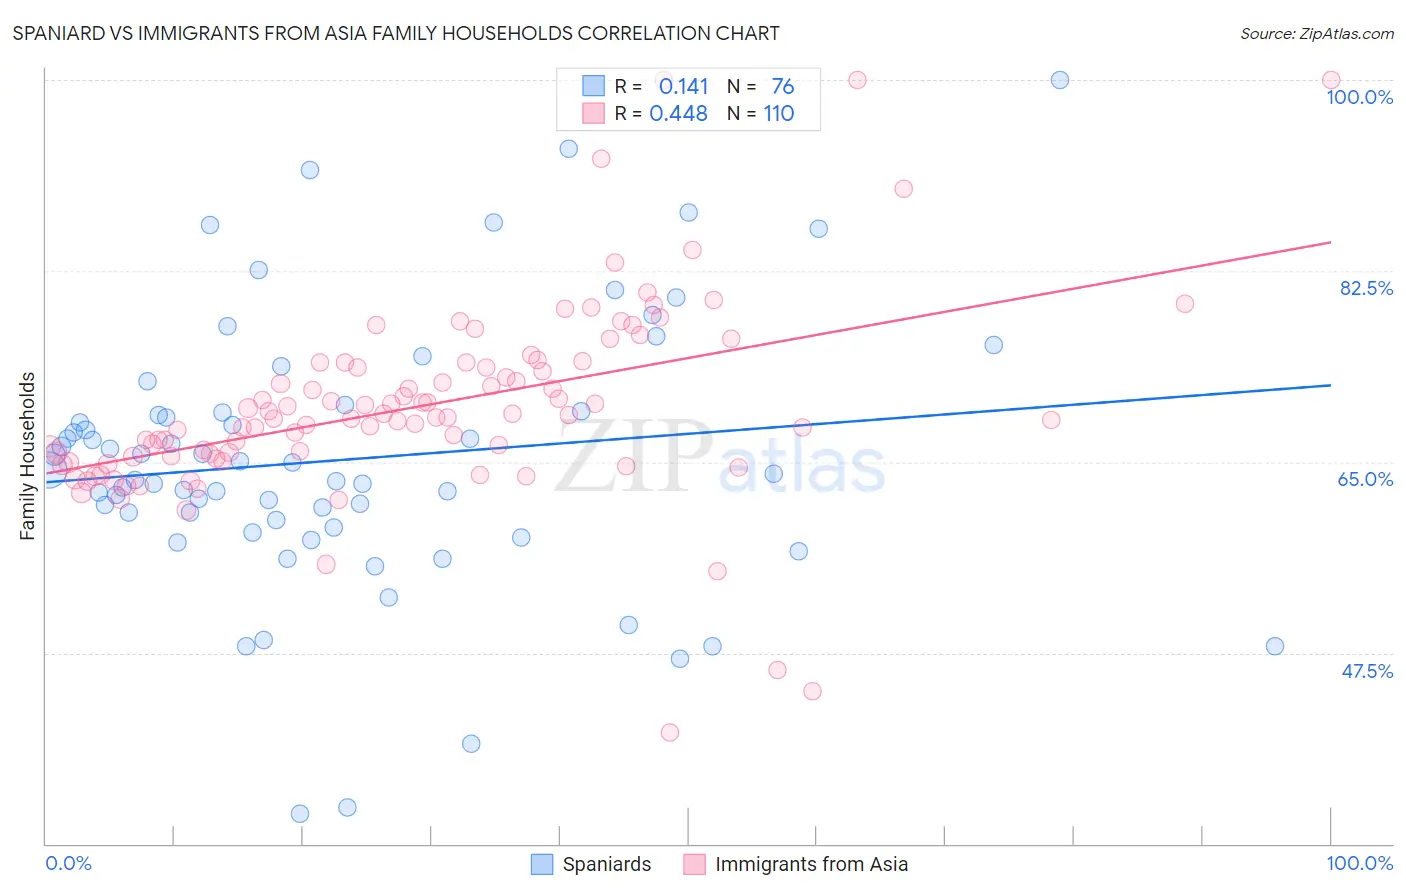
Spaniard vs Immigrants from Asia Family Households Correlation Chart
The statistical analysis conducted on geographies consisting of 443,170,610 people shows a poor positive correlation between the proportion of Spaniards and percentage of family households in the United States with a correlation coefficient (R) of 0.141 and weighted average of 65.1%. Similarly, the statistical analysis conducted on geographies consisting of 548,543,678 people shows a moderate positive correlation between the proportion of Immigrants from Asia and percentage of family households in the United States with a correlation coefficient (R) of 0.448 and weighted average of 66.1%, a difference of 1.4%.
Family Households Correlation Summary
| Measurement | Spaniard | Immigrants from Asia |
| Minimum | 32.8% | 40.2% |
| Maximum | 100.0% | 100.0% |
| Range | 67.2% | 59.8% |
| Mean | 65.2% | 70.1% |
| Median | 64.1% | 69.0% |
| Interquartile 25% (IQ1) | 59.3% | 65.5% |
| Interquartile 75% (IQ3) | 69.6% | 74.1% |
| Interquartile Range (IQR) | 10.3% | 8.6% |
| Standard Deviation (Sample) | 12.5% | 9.1% |
| Standard Deviation (Population) | 12.4% | 9.1% |
Similar Demographics by Family Households
Demographics Similar to Spaniards by Family Households
In terms of family households, the demographic groups most similar to Spaniards are Indian (Asian) (65.1%, a difference of 0.010%), Immigrants from Sri Lanka (65.1%, a difference of 0.020%), Haitian (65.2%, a difference of 0.040%), Chilean (65.2%, a difference of 0.040%), and English (65.1%, a difference of 0.070%).
| Demographics | Rating | Rank | Family Households |
| Guatemalans | 98.6 /100 | #97 | Exceptional 65.2% |
| Immigrants | Syria | 98.4 /100 | #98 | Exceptional 65.2% |
| Central American Indians | 98.3 /100 | #99 | Exceptional 65.2% |
| Haitians | 98.1 /100 | #100 | Exceptional 65.2% |
| Chileans | 98.1 /100 | #101 | Exceptional 65.2% |
| Immigrants | Sri Lanka | 98.0 /100 | #102 | Exceptional 65.1% |
| Indians (Asian) | 97.9 /100 | #103 | Exceptional 65.1% |
| Spaniards | 97.8 /100 | #104 | Exceptional 65.1% |
| English | 97.4 /100 | #105 | Exceptional 65.1% |
| Whites/Caucasians | 97.3 /100 | #106 | Exceptional 65.1% |
| Alaska Natives | 97.3 /100 | #107 | Exceptional 65.1% |
| Palestinians | 97.2 /100 | #108 | Exceptional 65.1% |
| Immigrants | Guatemala | 96.9 /100 | #109 | Exceptional 65.0% |
| Scandinavians | 96.8 /100 | #110 | Exceptional 65.0% |
| Europeans | 96.8 /100 | #111 | Exceptional 65.0% |
Demographics Similar to Immigrants from Asia by Family Households
In terms of family households, the demographic groups most similar to Immigrants from Asia are Immigrants from Korea (66.0%, a difference of 0.020%), South American (66.0%, a difference of 0.030%), Danish (66.0%, a difference of 0.050%), Central American (66.0%, a difference of 0.080%), and Pennsylvania German (66.1%, a difference of 0.11%).
| Demographics | Rating | Rank | Family Households |
| Natives/Alaskans | 100.0 /100 | #51 | Exceptional 66.4% |
| Colombians | 100.0 /100 | #52 | Exceptional 66.3% |
| Afghans | 100.0 /100 | #53 | Exceptional 66.3% |
| Immigrants | Colombia | 100.0 /100 | #54 | Exceptional 66.3% |
| Immigrants | Immigrants | 100.0 /100 | #55 | Exceptional 66.1% |
| Immigrants | Hong Kong | 100.0 /100 | #56 | Exceptional 66.1% |
| Pennsylvania Germans | 100.0 /100 | #57 | Exceptional 66.1% |
| Immigrants | Asia | 100.0 /100 | #58 | Exceptional 66.1% |
| Immigrants | Korea | 100.0 /100 | #59 | Exceptional 66.0% |
| South Americans | 100.0 /100 | #60 | Exceptional 66.0% |
| Danes | 100.0 /100 | #61 | Exceptional 66.0% |
| Central Americans | 100.0 /100 | #62 | Exceptional 66.0% |
| Immigrants | Indonesia | 100.0 /100 | #63 | Exceptional 66.0% |
| Pima | 99.9 /100 | #64 | Exceptional 65.9% |
| Costa Ricans | 99.9 /100 | #65 | Exceptional 65.9% |