Somali vs Slovene Divorced or Separated
COMPARE
Somali
Slovene
Divorced or Separated
Divorced or Separated Comparison
Somalis
Slovenes
12.6%
DIVORCED OR SEPARATED
0.9/ 100
METRIC RATING
253rd/ 347
METRIC RANK
12.3%
DIVORCED OR SEPARATED
13.2/ 100
METRIC RATING
218th/ 347
METRIC RANK
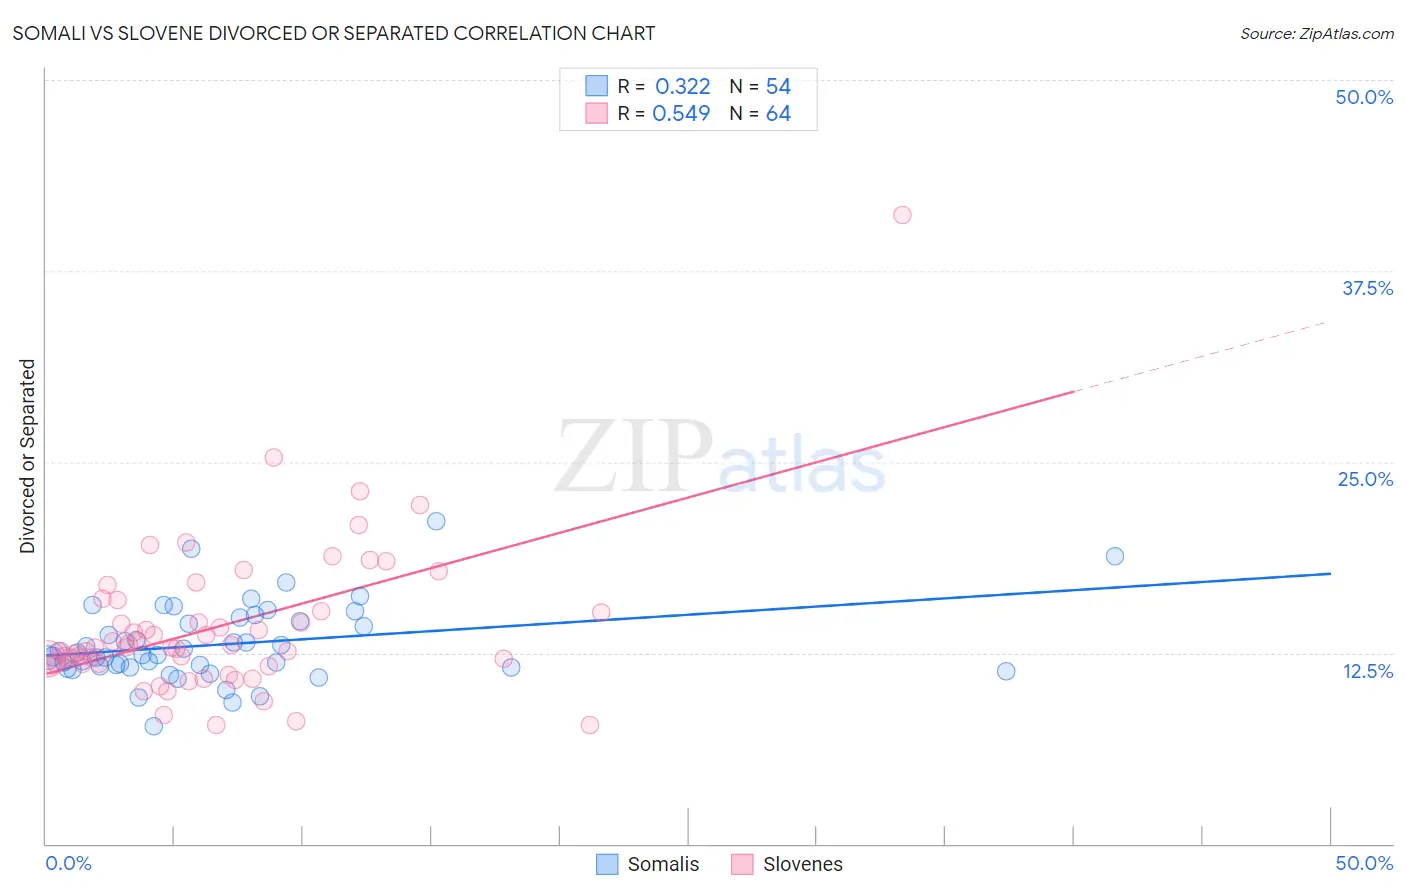
Somali vs Slovene Divorced or Separated Correlation Chart
The statistical analysis conducted on geographies consisting of 99,313,071 people shows a mild positive correlation between the proportion of Somalis and percentage of population currently divorced or separated in the United States with a correlation coefficient (R) of 0.322 and weighted average of 12.6%. Similarly, the statistical analysis conducted on geographies consisting of 261,286,451 people shows a substantial positive correlation between the proportion of Slovenes and percentage of population currently divorced or separated in the United States with a correlation coefficient (R) of 0.549 and weighted average of 12.3%, a difference of 2.4%.
Divorced or Separated Correlation Summary
| Measurement | Somali | Slovene |
| Minimum | 7.7% | 7.7% |
| Maximum | 21.1% | 41.2% |
| Range | 13.4% | 33.5% |
| Mean | 13.0% | 14.2% |
| Median | 12.4% | 12.9% |
| Interquartile 25% (IQ1) | 11.5% | 11.8% |
| Interquartile 75% (IQ3) | 14.6% | 15.6% |
| Interquartile Range (IQR) | 3.1% | 3.8% |
| Standard Deviation (Sample) | 2.5% | 5.0% |
| Standard Deviation (Population) | 2.5% | 5.0% |
Similar Demographics by Divorced or Separated
Demographics Similar to Somalis by Divorced or Separated
In terms of divorced or separated, the demographic groups most similar to Somalis are Liberian (12.6%, a difference of 0.0%), Senegalese (12.6%, a difference of 0.060%), Welsh (12.6%, a difference of 0.16%), Immigrants from Colombia (12.6%, a difference of 0.31%), and Irish (12.5%, a difference of 0.33%).
| Demographics | Rating | Rank | Divorced or Separated |
| Immigrants | West Indies | 1.9 /100 | #246 | Tragic 12.5% |
| Germans | 1.8 /100 | #247 | Tragic 12.5% |
| Nepalese | 1.8 /100 | #248 | Tragic 12.5% |
| Finns | 1.8 /100 | #249 | Tragic 12.5% |
| Irish | 1.3 /100 | #250 | Tragic 12.5% |
| Aleuts | 1.3 /100 | #251 | Tragic 12.5% |
| Liberians | 0.9 /100 | #252 | Tragic 12.6% |
| Somalis | 0.9 /100 | #253 | Tragic 12.6% |
| Senegalese | 0.8 /100 | #254 | Tragic 12.6% |
| Welsh | 0.7 /100 | #255 | Tragic 12.6% |
| Immigrants | Colombia | 0.6 /100 | #256 | Tragic 12.6% |
| Immigrants | Somalia | 0.6 /100 | #257 | Tragic 12.6% |
| Indonesians | 0.6 /100 | #258 | Tragic 12.6% |
| Yuman | 0.6 /100 | #259 | Tragic 12.6% |
| Immigrants | Uruguay | 0.6 /100 | #260 | Tragic 12.6% |
Demographics Similar to Slovenes by Divorced or Separated
In terms of divorced or separated, the demographic groups most similar to Slovenes are Northern European (12.2%, a difference of 0.11%), Czechoslovakian (12.3%, a difference of 0.11%), British (12.3%, a difference of 0.12%), Immigrants from South America (12.2%, a difference of 0.15%), and Guamanian/Chamorro (12.3%, a difference of 0.15%).
| Demographics | Rating | Rank | Divorced or Separated |
| Trinidadians and Tobagonians | 16.6 /100 | #211 | Poor 12.2% |
| Immigrants | Kenya | 16.5 /100 | #212 | Poor 12.2% |
| Immigrants | Eastern Africa | 16.2 /100 | #213 | Poor 12.2% |
| Immigrants | Argentina | 15.5 /100 | #214 | Poor 12.2% |
| Europeans | 15.4 /100 | #215 | Poor 12.2% |
| Immigrants | South America | 15.4 /100 | #216 | Poor 12.2% |
| Northern Europeans | 14.7 /100 | #217 | Poor 12.2% |
| Slovenes | 13.2 /100 | #218 | Poor 12.3% |
| Czechoslovakians | 11.7 /100 | #219 | Poor 12.3% |
| British | 11.6 /100 | #220 | Poor 12.3% |
| Guamanians/Chamorros | 11.3 /100 | #221 | Poor 12.3% |
| Bangladeshis | 10.5 /100 | #222 | Poor 12.3% |
| Scandinavians | 10.4 /100 | #223 | Poor 12.3% |
| Immigrants | Azores | 9.7 /100 | #224 | Tragic 12.3% |
| Belgians | 9.7 /100 | #225 | Tragic 12.3% |