Slovene vs Lebanese Currently Married
COMPARE
Slovene
Lebanese
Currently Married
Currently Married Comparison
Slovenes
Lebanese
48.1%
CURRENTLY MARRIED
97.1/ 100
METRIC RATING
77th/ 347
METRIC RANK
47.9%
CURRENTLY MARRIED
95.1/ 100
METRIC RATING
93rd/ 347
METRIC RANK
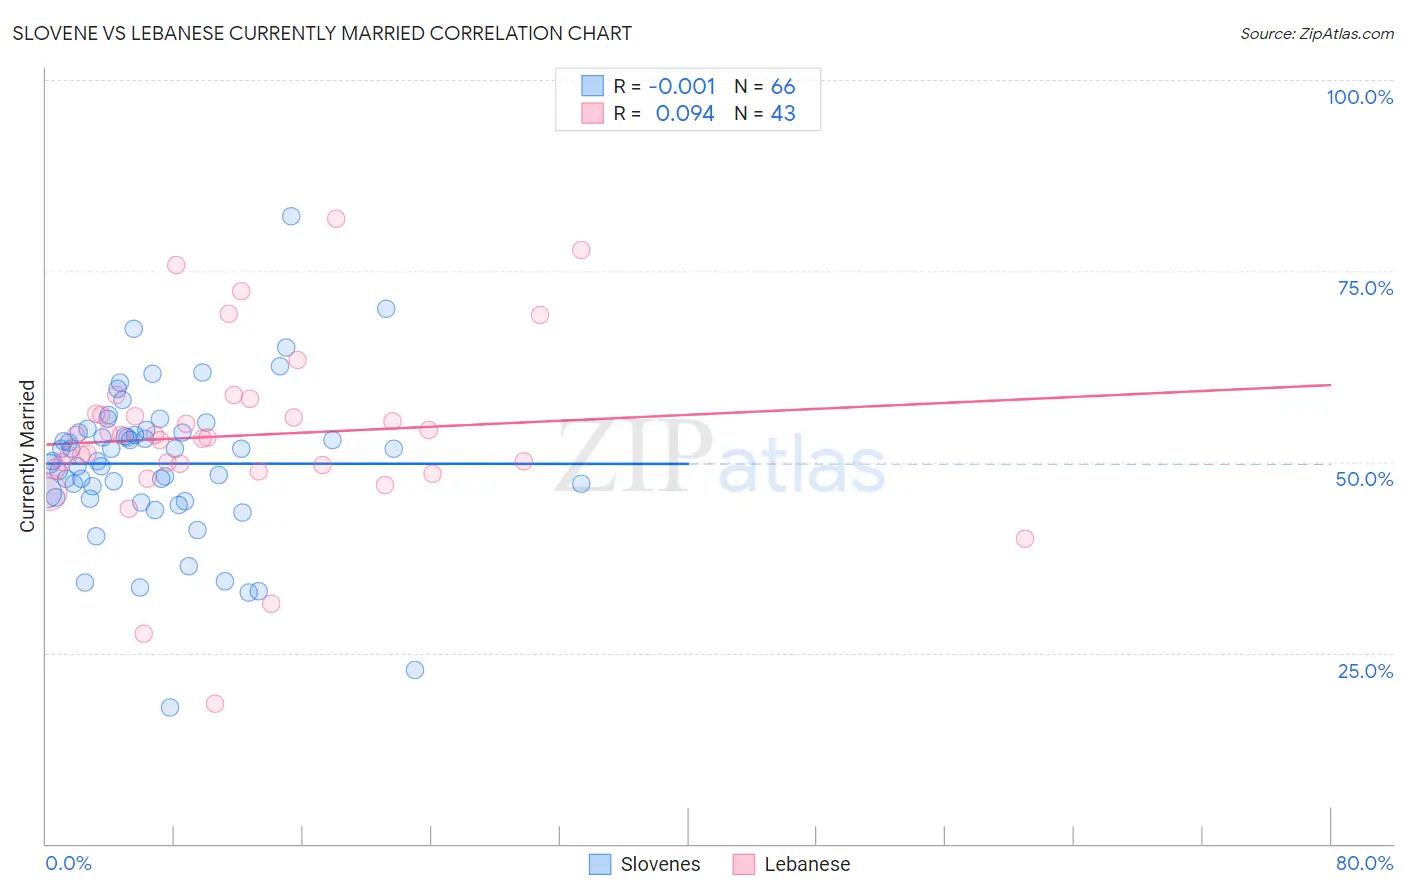
Slovene vs Lebanese Currently Married Correlation Chart
The statistical analysis conducted on geographies consisting of 261,329,458 people shows no correlation between the proportion of Slovenes and percentage of population currently married in the United States with a correlation coefficient (R) of -0.001 and weighted average of 48.1%. Similarly, the statistical analysis conducted on geographies consisting of 401,555,158 people shows a slight positive correlation between the proportion of Lebanese and percentage of population currently married in the United States with a correlation coefficient (R) of 0.094 and weighted average of 47.9%, a difference of 0.48%.
Currently Married Correlation Summary
| Measurement | Slovene | Lebanese |
| Minimum | 17.9% | 18.3% |
| Maximum | 82.2% | 81.9% |
| Range | 64.3% | 63.6% |
| Mean | 49.8% | 53.4% |
| Median | 50.9% | 53.2% |
| Interquartile 25% (IQ1) | 45.4% | 49.1% |
| Interquartile 75% (IQ3) | 53.8% | 56.3% |
| Interquartile Range (IQR) | 8.5% | 7.3% |
| Standard Deviation (Sample) | 10.2% | 11.9% |
| Standard Deviation (Population) | 10.1% | 11.7% |
Demographics Similar to Slovenes and Lebanese by Currently Married
In terms of currently married, the demographic groups most similar to Slovenes are Immigrants from Belgium (48.1%, a difference of 0.010%), Basque (48.1%, a difference of 0.020%), Immigrants from South Africa (48.1%, a difference of 0.020%), Immigrants from Belarus (48.1%, a difference of 0.050%), and Immigrants from Poland (48.1%, a difference of 0.050%). Similarly, the demographic groups most similar to Lebanese are Native Hawaiian (47.9%, a difference of 0.010%), Korean (47.9%, a difference of 0.050%), Immigrants from Bulgaria (47.9%, a difference of 0.050%), Immigrants from Bolivia (47.9%, a difference of 0.090%), and American (48.0%, a difference of 0.12%).
| Demographics | Rating | Rank | Currently Married |
| Immigrants | Belarus | 97.2 /100 | #75 | Exceptional 48.1% |
| Basques | 97.2 /100 | #76 | Exceptional 48.1% |
| Slovenes | 97.1 /100 | #77 | Exceptional 48.1% |
| Immigrants | Belgium | 97.1 /100 | #78 | Exceptional 48.1% |
| Immigrants | South Africa | 97.0 /100 | #79 | Exceptional 48.1% |
| Immigrants | Poland | 96.9 /100 | #80 | Exceptional 48.1% |
| Immigrants | Sri Lanka | 96.9 /100 | #81 | Exceptional 48.1% |
| Immigrants | Europe | 96.9 /100 | #82 | Exceptional 48.1% |
| Bolivians | 96.9 /100 | #83 | Exceptional 48.1% |
| Immigrants | Israel | 96.9 /100 | #84 | Exceptional 48.1% |
| French Canadians | 96.3 /100 | #85 | Exceptional 48.0% |
| Immigrants | Japan | 96.2 /100 | #86 | Exceptional 48.0% |
| Jordanians | 96.2 /100 | #87 | Exceptional 48.0% |
| Immigrants | Eastern Europe | 96.1 /100 | #88 | Exceptional 48.0% |
| Indians (Asian) | 95.8 /100 | #89 | Exceptional 48.0% |
| Americans | 95.7 /100 | #90 | Exceptional 48.0% |
| Immigrants | Bolivia | 95.6 /100 | #91 | Exceptional 47.9% |
| Koreans | 95.4 /100 | #92 | Exceptional 47.9% |
| Lebanese | 95.1 /100 | #93 | Exceptional 47.9% |
| Native Hawaiians | 95.0 /100 | #94 | Exceptional 47.9% |
| Immigrants | Bulgaria | 94.8 /100 | #95 | Exceptional 47.9% |