Sioux vs Afghan Currently Married

COMPARE

Sioux
Race
Ancestry
AfricanAlaska NativeAlaskan AthabascanAlbanianAleutAlsatianAmericanApacheArabArapahoArgentineanArmenianAssyrian/Chaldean/SyriacAustralianAustrianBahamianBangladeshiBarbadianBasqueBelgianBelizeanBermudanBhutaneseBlackfeetBolivianBrazilianBritishBritish West IndianBulgarianBurmeseCajunCambodianCanadianCape VerdeanCarpatho RusynCelticCentral AmericanCentral American IndianCherokeeCheyenneChickasawChileanChineseChippewaChoctawColombianColvilleComancheCosta RicanCreeCreekCroatianCrowCubanCypriotCzechCzechoslovakianDanishDelawareDominicanDutchDutch West IndianEastern EuropeanEcuadorianEgyptianEnglishEstonianEthiopianEuropeanFijianFilipinoFinnishFrenchFrench American IndianFrench CanadianGermanGerman RussianGhanaianGreekGuamanian/ChamorroGuatemalanGuyaneseHaitianHmongHonduranHopiHoumaHungarianIcelanderIndian (Asian)IndonesianInupiatIranianIraqiIrishIroquoisIsraeliItalianJamaicanJapaneseJordanianKenyanKiowaKoreanLaotianLatvianLebaneseLiberianLithuanianLumbeeLuxembourgerMacedonianMalaysianMalteseMarshalleseMenomineeMexicanMexican American IndianMongolianMoroccanNative HawaiianNavajoNepaleseNew ZealanderNicaraguanNigerianNorthern EuropeanNorwegianOkinawanOsageOttawaPaiutePakistaniPalestinianPanamanianParaguayanPennsylvania GermanPeruvianPimaPolishPortuguesePotawatomiPuebloPuerto RicanPuget Sound SalishRomanianRussianSalvadoranSamoanScandinavianScotch-IrishScottishSeminoleSenegaleseSerbianShoshoneSierra LeoneanSiouxSlavicSlovakSloveneSomaliSouth AfricanSouth AmericanSouth American IndianSoviet UnionSpaniardSpanishSpanish AmericanSpanish American IndianSri LankanSubsaharan AfricanSudaneseSwedishSwissSyrianTaiwaneseThaiTlingit-HaidaTohono O'OdhamTonganTrinidadian and TobagonianTsimshianTurkishU.S. Virgin IslanderUgandanUkrainianUruguayanUteVenezuelanVietnameseWelshWest IndianYakamaYaquiYugoslavianYumanYup'ikZimbabwean
Immigration
NonimmigrantsImmigrantsAfghanistanAfricaAlbaniaArgentinaArmeniaAsiaAustraliaAustriaBahamasBangladeshBarbadosBelarusBelgiumBelizeBoliviaBosnia and HerzegovinaBrazilBulgariaBurma/MyanmarCabo VerdeCambodiaCameroonCanadaCaribbeanCentral AmericaChileChinaColombiaCongoCosta RicaCroatiaCubaCzechoslovakiaDenmarkDominicaDominican RepublicEastern AfricaEastern AsiaEastern EuropeEcuadorEgyptEl SalvadorEnglandEritreaEthiopiaEuropeFijiFranceGermanyGhanaGreeceGrenadaGuatemalaGuyanaHaitiHondurasHong KongHungaryIndiaIndonesiaIranIraqIrelandIsraelItalyJamaicaJapanJordanKazakhstanKenyaKoreaKuwaitLaosLatin AmericaLatviaLebanonLiberiaLithuaniaMalaysiaMexicoMicronesiaMiddle AfricaMoldovaMoroccoNepalNetherlandsNicaraguaNigeriaNorth AmericaNorth MacedoniaNorthern AfricaNorthern EuropeNorwayOceaniaPakistanPanamaPeruPhilippinesPolandPortugalRomaniaRussiaSaudi ArabiaScotlandSenegalSerbiaSierra LeoneSingaporeSomaliaSouth AfricaSouth AmericaSouth Central AsiaSouth Eastern AsiaSouthern EuropeSpainSri LankaSt. Vincent and the GrenadinesSudanSwedenSwitzerlandSyriaTaiwanThailandTrinidad and TobagoTurkeyUgandaUkraineUruguayUzbekistanVenezuelaVietnamWest IndiesWestern AfricaWestern AsiaWestern EuropeYemenZaireZimbabweAzores
Afghan
Race
Ancestry
AfghanAfricanAlaska NativeAlaskan AthabascanAlbanianAleutAlsatianAmericanApacheArabArapahoArgentineanArmenianAssyrian/Chaldean/SyriacAustralianAustrianBahamianBangladeshiBarbadianBasqueBelgianBelizeanBermudanBhutaneseBlackfeetBolivianBrazilianBritishBritish West IndianBulgarianBurmeseCajunCambodianCanadianCape VerdeanCarpatho RusynCelticCentral AmericanCentral American IndianCherokeeCheyenneChickasawChileanChineseChippewaChoctawColombianColvilleComancheCosta RicanCreeCreekCroatianCrowCubanCypriotCzechCzechoslovakianDanishDelawareDominicanDutchDutch West IndianEastern EuropeanEcuadorianEgyptianEnglishEstonianEthiopianEuropeanFijianFilipinoFinnishFrenchFrench American IndianFrench CanadianGermanGerman RussianGhanaianGreekGuamanian/ChamorroGuatemalanGuyaneseHaitianHmongHonduranHopiHoumaHungarianIcelanderIndian (Asian)IndonesianInupiatIranianIraqiIrishIroquoisIsraeliItalianJamaicanJapaneseJordanianKenyanKiowaKoreanLaotianLatvianLebaneseLiberianLithuanianLumbeeLuxembourgerMacedonianMalaysianMalteseMarshalleseMenomineeMexicanMexican American IndianMongolianMoroccanNative HawaiianNavajoNepaleseNew ZealanderNicaraguanNigerianNorthern EuropeanNorwegianOkinawanOsageOttawaPaiutePakistaniPalestinianPanamanianParaguayanPennsylvania GermanPeruvianPimaPolishPortuguesePotawatomiPuebloPuerto RicanPuget Sound SalishRomanianRussianSalvadoranSamoanScandinavianScotch-IrishScottishSeminoleSenegaleseSerbianShoshoneSierra LeoneanSlavicSlovakSloveneSomaliSouth AfricanSouth AmericanSouth American IndianSoviet UnionSpaniardSpanishSpanish AmericanSpanish American IndianSri LankanSubsaharan AfricanSudaneseSwedishSwissSyrianTaiwaneseThaiTlingit-HaidaTohono O'OdhamTonganTrinidadian and TobagonianTsimshianTurkishU.S. Virgin IslanderUgandanUkrainianUruguayanUteVenezuelanVietnameseWelshWest IndianYakamaYaquiYugoslavianYumanYup'ikZimbabwean
Immigration
NonimmigrantsImmigrantsAfghanistanAfricaAlbaniaArgentinaArmeniaAsiaAustraliaAustriaBahamasBangladeshBarbadosBelarusBelgiumBelizeBoliviaBosnia and HerzegovinaBrazilBulgariaBurma/MyanmarCabo VerdeCambodiaCameroonCanadaCaribbeanCentral AmericaChileChinaColombiaCongoCosta RicaCroatiaCubaCzechoslovakiaDenmarkDominicaDominican RepublicEastern AfricaEastern AsiaEastern EuropeEcuadorEgyptEl SalvadorEnglandEritreaEthiopiaEuropeFijiFranceGermanyGhanaGreeceGrenadaGuatemalaGuyanaHaitiHondurasHong KongHungaryIndiaIndonesiaIranIraqIrelandIsraelItalyJamaicaJapanJordanKazakhstanKenyaKoreaKuwaitLaosLatin AmericaLatviaLebanonLiberiaLithuaniaMalaysiaMexicoMicronesiaMiddle AfricaMoldovaMoroccoNepalNetherlandsNicaraguaNigeriaNorth AmericaNorth MacedoniaNorthern AfricaNorthern EuropeNorwayOceaniaPakistanPanamaPeruPhilippinesPolandPortugalRomaniaRussiaSaudi ArabiaScotlandSenegalSerbiaSierra LeoneSingaporeSomaliaSouth AfricaSouth AmericaSouth Central AsiaSouth Eastern AsiaSouthern EuropeSpainSri LankaSt. Vincent and the GrenadinesSudanSwedenSwitzerlandSyriaTaiwanThailandTrinidad and TobagoTurkeyUgandaUkraineUruguayUzbekistanVenezuelaVietnamWest IndiesWestern AfricaWestern AsiaWestern EuropeYemenZaireZimbabweAzores
Currently Married
Income
Poverty
Unemployment
Labor Participation
Family Structure
Vehicle Availability
Education Level
Disability

Currently Married Comparison

Sioux

Afghans

Tragic
Excellent
41.9%
CURRENTLY MARRIED
0.0/ 100
METRIC RATING
303rd/ 347
METRIC RANK
47.3%
CURRENTLY MARRIED
81.8/ 100
METRIC RATING
132nd/ 347
METRIC RANK

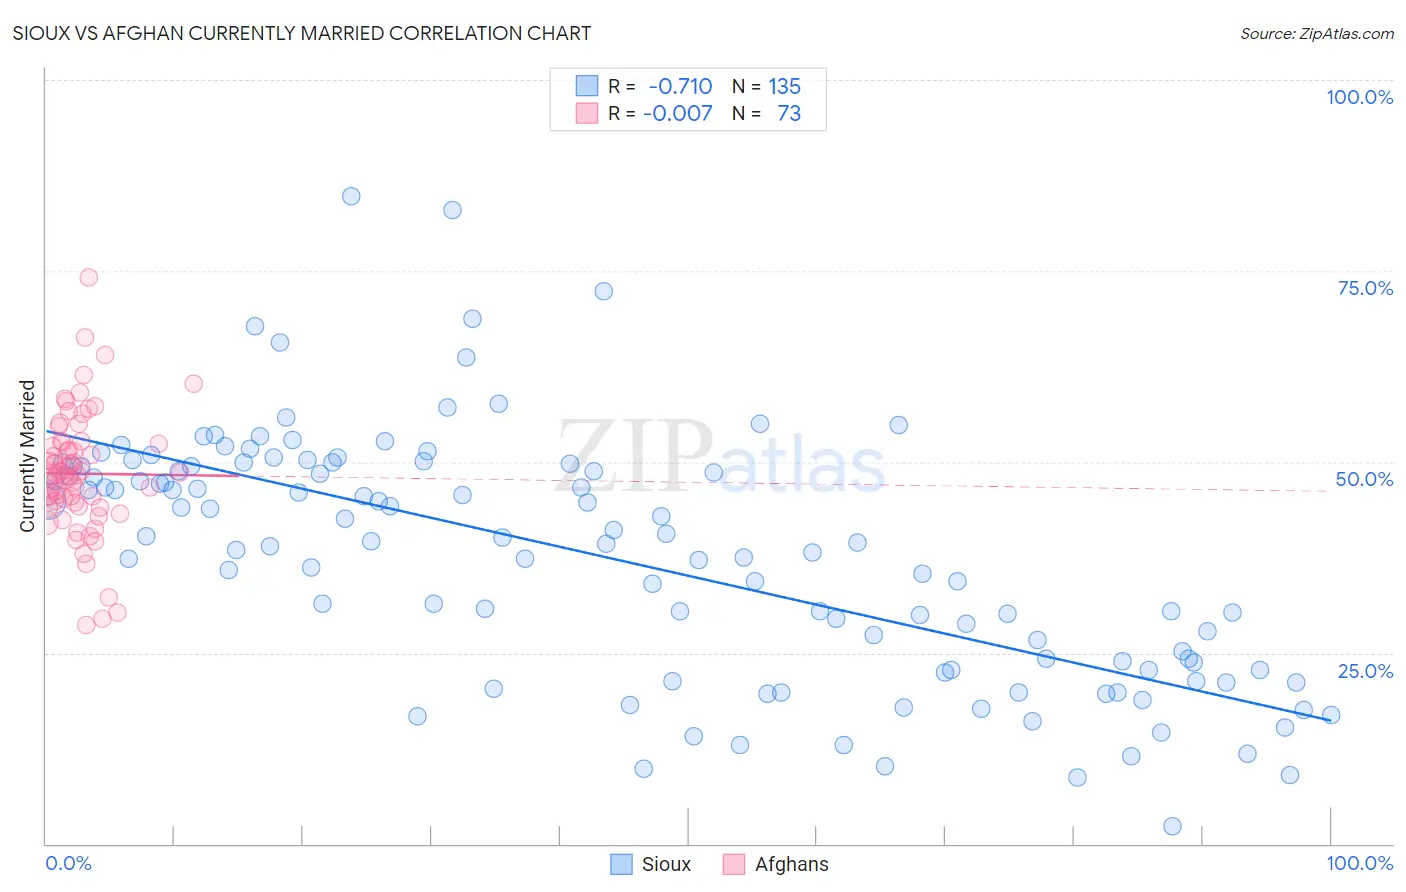
Sioux vs Afghan Currently Married Correlation Chart

The statistical analysis conducted on geographies consisting of 234,188,920 people shows a strong negative correlation between the proportion of Sioux and percentage of population currently married in the United States with a correlation coefficient (R) of -0.710 and weighted average of 41.9%. Similarly, the statistical analysis conducted on geographies consisting of 148,861,336 people shows no correlation between the proportion of Afghans and percentage of population currently married in the United States with a correlation coefficient (R) of -0.007 and weighted average of 47.3%, a difference of 12.7%.
Sioux vs Afghan Currently Married

Currently Married Correlation Summary

MeasurementSiouxAfghan
Minimum2.3%28.6%
Maximum84.8%74.2%
Range82.5%45.6%
Mean37.5%48.5%
Median39.4%48.3%
Interquartile 25% (IQ1)22.8%44.5%
Interquartile 75% (IQ3)49.5%52.5%
Interquartile Range (IQR)26.7%8.0%
Standard Deviation (Sample)16.0%8.0%
Standard Deviation (Population)16.0%7.9%

Similar Demographics by Currently Married

Demographics Similar to Sioux by Currently Married

In terms of currently married, the demographic groups most similar to Sioux are Immigrants from Zaire (42.0%, a difference of 0.010%), Immigrants from Bahamas (41.9%, a difference of 0.11%), Immigrants from Trinidad and Tobago (41.9%, a difference of 0.15%), Immigrants from Guyana (41.9%, a difference of 0.16%), and Immigrants from Yemen (42.1%, a difference of 0.26%).
DemographicsRating | RankCurrently Married
Menominee
0.0
/100
|
#296
Tragic
42.3%
Cheyenne
0.0
/100
|
#297
Tragic
42.2%
Immigrants | Honduras
0.0
/100
|
#298
Tragic
42.2%
Liberians
0.0
/100
|
#299
Tragic
42.2%
Belizeans
0.0
/100
|
#300
Tragic
42.2%
Immigrants | Yemen
0.0
/100
|
#301
Tragic
42.1%
Immigrants | Zaire
0.0
/100
|
#302
Tragic
42.0%
Sioux
0.0
/100
|
#303
Tragic
41.9%
Immigrants | Bahamas
0.0
/100
|
#304
Tragic
41.9%
Immigrants | Trinidad and Tobago
0.0
/100
|
#305
Tragic
41.9%
Immigrants | Guyana
0.0
/100
|
#306
Tragic
41.9%
Africans
0.0
/100
|
#307
Tragic
41.8%
Immigrants | Belize
0.0
/100
|
#308
Tragic
41.8%
Immigrants | Liberia
0.0
/100
|
#309
Tragic
41.8%
Guyanese
0.0
/100
|
#310
Tragic
41.6%

Demographics Similar to Afghans by Currently Married

In terms of currently married, the demographic groups most similar to Afghans are Icelander (47.3%, a difference of 0.040%), Immigrants from Malaysia (47.3%, a difference of 0.040%), Immigrants from Australia (47.3%, a difference of 0.050%), Immigrants from Iraq (47.3%, a difference of 0.060%), and Sri Lankan (47.3%, a difference of 0.090%).
DemographicsRating | RankCurrently Married
Okinawans
85.3
/100
|
#125
Excellent
47.4%
Immigrants | Jordan
84.9
/100
|
#126
Excellent
47.4%
New Zealanders
84.9
/100
|
#127
Excellent
47.4%
Portuguese
84.2
/100
|
#128
Excellent
47.3%
Sri Lankans
83.2
/100
|
#129
Excellent
47.3%
Immigrants | Iraq
82.8
/100
|
#130
Excellent
47.3%
Icelanders
82.4
/100
|
#131
Excellent
47.3%
Afghans
81.8
/100
|
#132
Excellent
47.3%
Immigrants | Malaysia
81.1
/100
|
#133
Excellent
47.3%
Immigrants | Australia
81.1
/100
|
#134
Excellent
47.3%
Immigrants | Norway
79.7
/100
|
#135
Good
47.2%
Immigrants | Vietnam
78.2
/100
|
#136
Good
47.2%
Paraguayans
77.8
/100
|
#137
Good
47.2%
Pakistanis
77.5
/100
|
#138
Good
47.2%
Yugoslavians
77.4
/100
|
#139
Good
47.2%