Serbian vs Bhutanese Currently Married
COMPARE
Serbian
Bhutanese
Currently Married
Currently Married Comparison
Serbians
Bhutanese
47.8%
CURRENTLY MARRIED
93.6/ 100
METRIC RATING
104th/ 347
METRIC RANK
48.6%
CURRENTLY MARRIED
99.1/ 100
METRIC RATING
49th/ 347
METRIC RANK
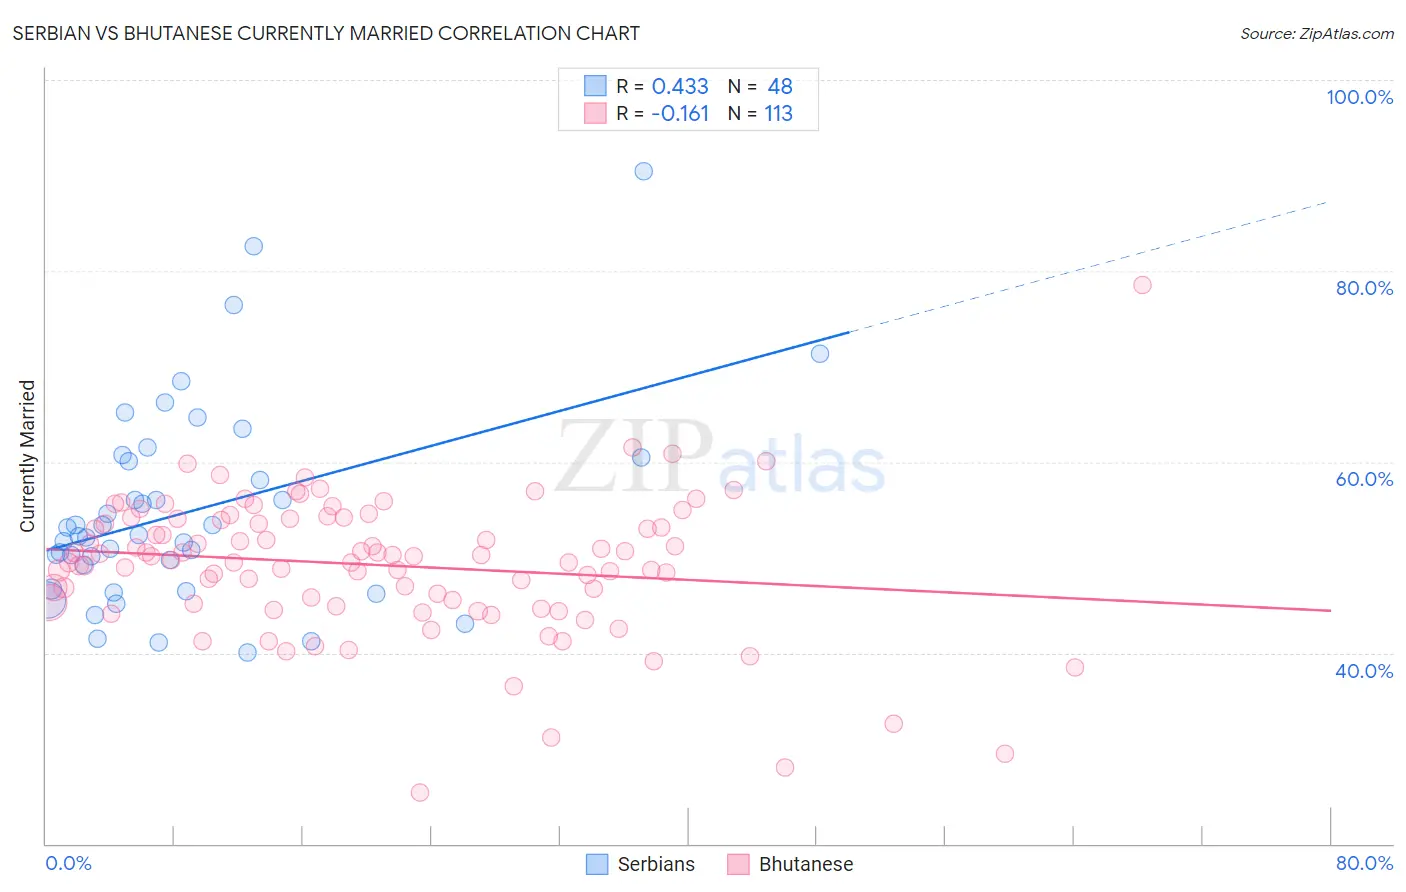
Serbian vs Bhutanese Currently Married Correlation Chart
The statistical analysis conducted on geographies consisting of 267,625,038 people shows a moderate positive correlation between the proportion of Serbians and percentage of population currently married in the United States with a correlation coefficient (R) of 0.433 and weighted average of 47.8%. Similarly, the statistical analysis conducted on geographies consisting of 455,493,629 people shows a poor negative correlation between the proportion of Bhutanese and percentage of population currently married in the United States with a correlation coefficient (R) of -0.161 and weighted average of 48.6%, a difference of 1.8%.
Currently Married Correlation Summary
| Measurement | Serbian | Bhutanese |
| Minimum | 40.0% | 25.4% |
| Maximum | 90.4% | 78.5% |
| Range | 50.4% | 53.1% |
| Mean | 54.8% | 49.2% |
| Median | 52.3% | 50.1% |
| Interquartile 25% (IQ1) | 47.9% | 45.2% |
| Interquartile 75% (IQ3) | 60.3% | 54.0% |
| Interquartile Range (IQR) | 12.3% | 8.9% |
| Standard Deviation (Sample) | 10.6% | 7.3% |
| Standard Deviation (Population) | 10.4% | 7.3% |
Similar Demographics by Currently Married
Demographics Similar to Serbians by Currently Married
In terms of currently married, the demographic groups most similar to Serbians are Cypriot (47.8%, a difference of 0.020%), Turkish (47.8%, a difference of 0.050%), Immigrants from Singapore (47.8%, a difference of 0.050%), Immigrants from Germany (47.8%, a difference of 0.070%), and Celtic (47.8%, a difference of 0.080%).
| Demographics | Rating | Rank | Currently Married |
| Immigrants | Ukraine | 94.8 /100 | #97 | Exceptional 47.9% |
| Immigrants | China | 94.7 /100 | #98 | Exceptional 47.9% |
| Immigrants | Sweden | 94.3 /100 | #99 | Exceptional 47.8% |
| Celtics | 94.2 /100 | #100 | Exceptional 47.8% |
| Immigrants | Germany | 94.1 /100 | #101 | Exceptional 47.8% |
| Turks | 93.9 /100 | #102 | Exceptional 47.8% |
| Cypriots | 93.7 /100 | #103 | Exceptional 47.8% |
| Serbians | 93.6 /100 | #104 | Exceptional 47.8% |
| Immigrants | Singapore | 93.3 /100 | #105 | Exceptional 47.8% |
| Immigrants | Greece | 93.1 /100 | #106 | Exceptional 47.7% |
| Immigrants | Italy | 92.9 /100 | #107 | Exceptional 47.7% |
| Tsimshian | 92.4 /100 | #108 | Exceptional 47.7% |
| Immigrants | Egypt | 92.3 /100 | #109 | Exceptional 47.7% |
| Immigrants | Russia | 92.0 /100 | #110 | Exceptional 47.7% |
| Immigrants | Hungary | 91.2 /100 | #111 | Exceptional 47.6% |
Demographics Similar to Bhutanese by Currently Married
In terms of currently married, the demographic groups most similar to Bhutanese are Iranian (48.6%, a difference of 0.060%), White/Caucasian (48.6%, a difference of 0.070%), Austrian (48.7%, a difference of 0.13%), Northern European (48.7%, a difference of 0.14%), and Immigrants from Iran (48.7%, a difference of 0.15%).
| Demographics | Rating | Rank | Currently Married |
| Finns | 99.3 /100 | #42 | Exceptional 48.8% |
| Scotch-Irish | 99.3 /100 | #43 | Exceptional 48.7% |
| Immigrants | North America | 99.3 /100 | #44 | Exceptional 48.7% |
| Belgians | 99.3 /100 | #45 | Exceptional 48.7% |
| Immigrants | Iran | 99.2 /100 | #46 | Exceptional 48.7% |
| Northern Europeans | 99.2 /100 | #47 | Exceptional 48.7% |
| Austrians | 99.2 /100 | #48 | Exceptional 48.7% |
| Bhutanese | 99.1 /100 | #49 | Exceptional 48.6% |
| Iranians | 99.0 /100 | #50 | Exceptional 48.6% |
| Whites/Caucasians | 99.0 /100 | #51 | Exceptional 48.6% |
| Russians | 98.9 /100 | #52 | Exceptional 48.6% |
| Immigrants | Austria | 98.8 /100 | #53 | Exceptional 48.5% |
| Immigrants | Moldova | 98.7 /100 | #54 | Exceptional 48.5% |
| Immigrants | North Macedonia | 98.7 /100 | #55 | Exceptional 48.5% |
| Latvians | 98.7 /100 | #56 | Exceptional 48.5% |