Scottish vs Immigrants from Costa Rica Family Households with Children
COMPARE
Scottish
Immigrants from Costa Rica
Family Households with Children
Family Households with Children Comparison
Scottish
Immigrants from Costa Rica
27.0%
FAMILY HOUSEHOLDS WITH CHILDREN
6.5/ 100
METRIC RATING
228th/ 347
METRIC RANK
28.3%
FAMILY HOUSEHOLDS WITH CHILDREN
99.6/ 100
METRIC RATING
89th/ 347
METRIC RANK
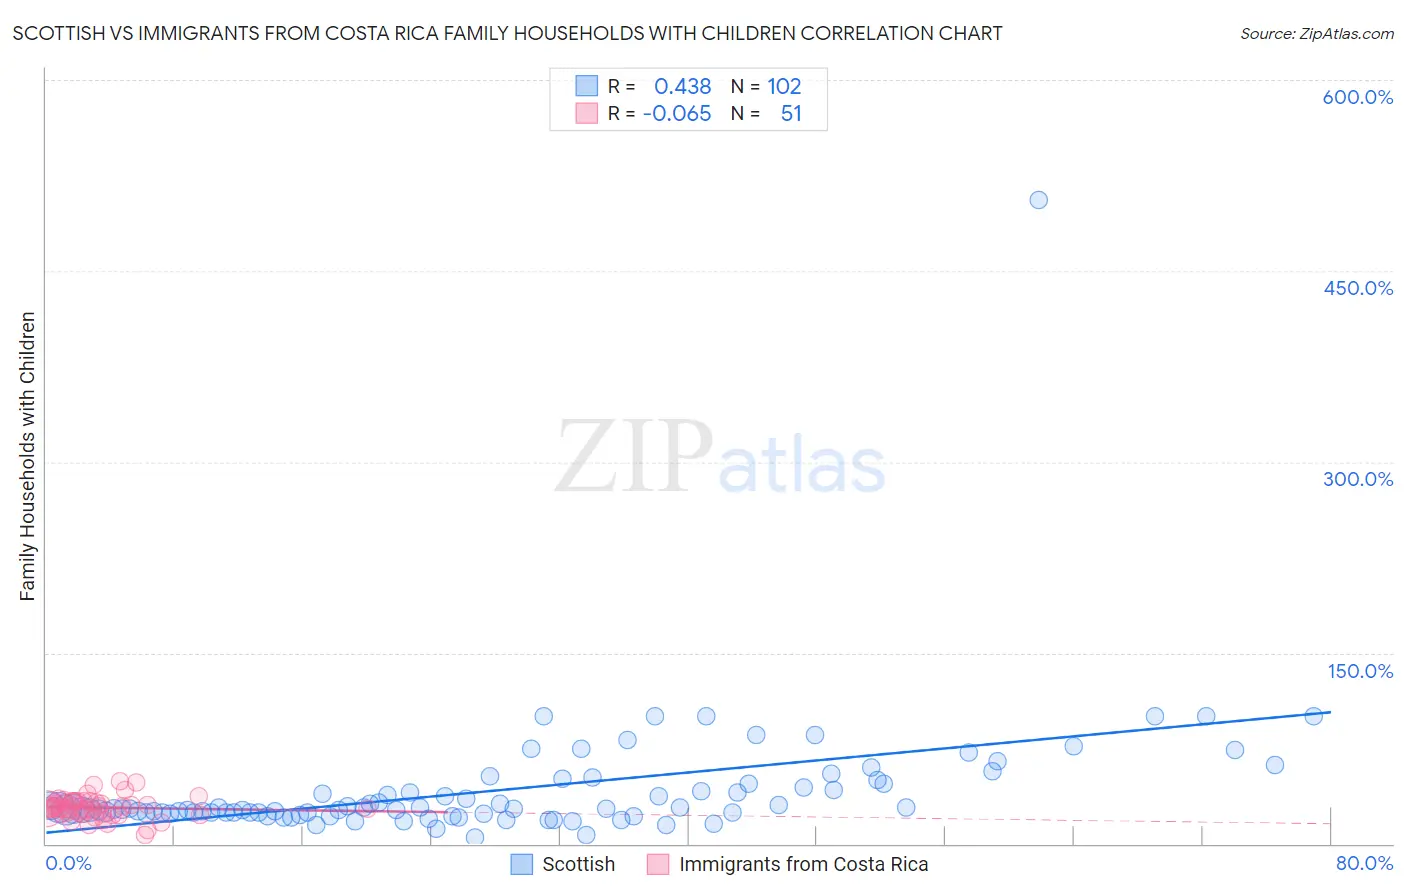
Scottish vs Immigrants from Costa Rica Family Households with Children Correlation Chart
The statistical analysis conducted on geographies consisting of 566,154,348 people shows a moderate positive correlation between the proportion of Scottish and percentage of family households with children in the United States with a correlation coefficient (R) of 0.438 and weighted average of 27.0%. Similarly, the statistical analysis conducted on geographies consisting of 204,199,597 people shows a slight negative correlation between the proportion of Immigrants from Costa Rica and percentage of family households with children in the United States with a correlation coefficient (R) of -0.065 and weighted average of 28.3%, a difference of 4.5%.
Family Households with Children Correlation Summary
| Measurement | Scottish | Immigrants from Costa Rica |
| Minimum | 5.1% | 7.1% |
| Maximum | 505.5% | 49.2% |
| Range | 500.4% | 42.0% |
| Mean | 42.0% | 28.5% |
| Median | 27.3% | 27.7% |
| Interquartile 25% (IQ1) | 24.2% | 23.7% |
| Interquartile 75% (IQ3) | 47.1% | 33.4% |
| Interquartile Range (IQR) | 22.9% | 9.7% |
| Standard Deviation (Sample) | 51.9% | 8.3% |
| Standard Deviation (Population) | 51.6% | 8.2% |
Similar Demographics by Family Households with Children
Demographics Similar to Scottish by Family Households with Children
In terms of family households with children, the demographic groups most similar to Scottish are Czechoslovakian (27.0%, a difference of 0.0%), Tsimshian (27.0%, a difference of 0.0%), Immigrants from Caribbean (27.0%, a difference of 0.030%), Canadian (27.1%, a difference of 0.080%), and Bulgarian (27.0%, a difference of 0.080%).
| Demographics | Rating | Rank | Family Households with Children |
| New Zealanders | 9.6 /100 | #221 | Tragic 27.1% |
| Paraguayans | 9.4 /100 | #222 | Tragic 27.1% |
| Pima | 9.2 /100 | #223 | Tragic 27.1% |
| Germans | 8.7 /100 | #224 | Tragic 27.1% |
| Canadians | 7.5 /100 | #225 | Tragic 27.1% |
| Czechoslovakians | 6.6 /100 | #226 | Tragic 27.0% |
| Tsimshian | 6.6 /100 | #227 | Tragic 27.0% |
| Scottish | 6.5 /100 | #228 | Tragic 27.0% |
| Immigrants | Caribbean | 6.3 /100 | #229 | Tragic 27.0% |
| Bulgarians | 5.8 /100 | #230 | Tragic 27.0% |
| Luxembourgers | 5.5 /100 | #231 | Tragic 27.0% |
| Yugoslavians | 5.1 /100 | #232 | Tragic 27.0% |
| Immigrants | Italy | 5.0 /100 | #233 | Tragic 27.0% |
| Immigrants | Germany | 4.4 /100 | #234 | Tragic 27.0% |
| Immigrants | Morocco | 4.2 /100 | #235 | Tragic 27.0% |
Demographics Similar to Immigrants from Costa Rica by Family Households with Children
In terms of family households with children, the demographic groups most similar to Immigrants from Costa Rica are Liberian (28.3%, a difference of 0.010%), Colombian (28.3%, a difference of 0.020%), Immigrants from Western Africa (28.3%, a difference of 0.080%), Immigrants from Thailand (28.2%, a difference of 0.10%), and Immigrants from Liberia (28.2%, a difference of 0.16%).
| Demographics | Rating | Rank | Family Households with Children |
| Kenyans | 99.8 /100 | #82 | Exceptional 28.4% |
| Nicaraguans | 99.8 /100 | #83 | Exceptional 28.4% |
| Costa Ricans | 99.8 /100 | #84 | Exceptional 28.4% |
| Immigrants | Syria | 99.8 /100 | #85 | Exceptional 28.4% |
| Immigrants | Western Africa | 99.6 /100 | #86 | Exceptional 28.3% |
| Colombians | 99.6 /100 | #87 | Exceptional 28.3% |
| Liberians | 99.6 /100 | #88 | Exceptional 28.3% |
| Immigrants | Costa Rica | 99.6 /100 | #89 | Exceptional 28.3% |
| Immigrants | Thailand | 99.5 /100 | #90 | Exceptional 28.2% |
| Immigrants | Liberia | 99.4 /100 | #91 | Exceptional 28.2% |
| Chickasaw | 99.4 /100 | #92 | Exceptional 28.2% |
| Panamanians | 99.3 /100 | #93 | Exceptional 28.2% |
| Immigrants | Colombia | 99.2 /100 | #94 | Exceptional 28.2% |
| Immigrants | Nicaragua | 99.1 /100 | #95 | Exceptional 28.2% |
| Ute | 99.1 /100 | #96 | Exceptional 28.2% |