Scotch-Irish vs Navajo Births to Unmarried Women
COMPARE
Scotch-Irish
Navajo
Births to Unmarried Women
Births to Unmarried Women Comparison
Scotch-Irish
Navajo
33.3%
BIRTHS TO UNMARRIED WOMEN
10.7/ 100
METRIC RATING
210th/ 347
METRIC RANK
51.5%
BIRTHS TO UNMARRIED WOMEN
0.0/ 100
METRIC RATING
344th/ 347
METRIC RANK
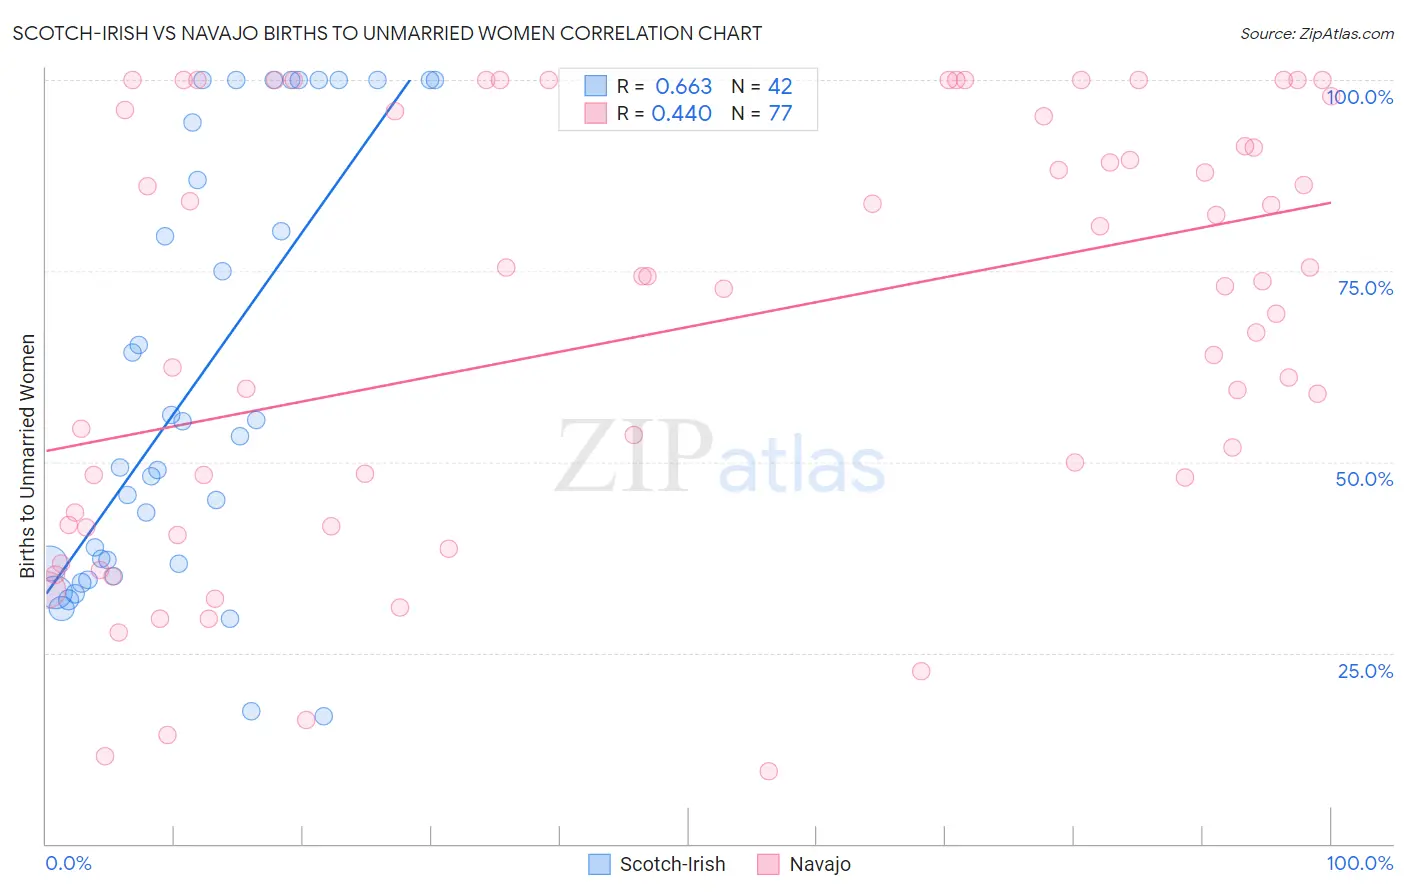
Scotch-Irish vs Navajo Births to Unmarried Women Correlation Chart
The statistical analysis conducted on geographies consisting of 488,755,262 people shows a significant positive correlation between the proportion of Scotch-Irish and percentage of births to unmarried women in the United States with a correlation coefficient (R) of 0.663 and weighted average of 33.3%. Similarly, the statistical analysis conducted on geographies consisting of 217,645,361 people shows a moderate positive correlation between the proportion of Navajo and percentage of births to unmarried women in the United States with a correlation coefficient (R) of 0.440 and weighted average of 51.5%, a difference of 54.8%.
Births to Unmarried Women Correlation Summary
| Measurement | Scotch-Irish | Navajo |
| Minimum | 16.7% | 9.5% |
| Maximum | 100.0% | 100.0% |
| Range | 83.3% | 90.5% |
| Mean | 60.2% | 67.3% |
| Median | 51.3% | 72.9% |
| Interquartile 25% (IQ1) | 36.6% | 41.6% |
| Interquartile 75% (IQ3) | 94.4% | 95.6% |
| Interquartile Range (IQR) | 57.8% | 54.0% |
| Standard Deviation (Sample) | 28.1% | 27.7% |
| Standard Deviation (Population) | 27.8% | 27.6% |
Similar Demographics by Births to Unmarried Women
Demographics Similar to Scotch-Irish by Births to Unmarried Women
In terms of births to unmarried women, the demographic groups most similar to Scotch-Irish are White/Caucasian (33.3%, a difference of 0.0%), Ecuadorian (33.3%, a difference of 0.050%), Celtic (33.3%, a difference of 0.12%), Hawaiian (33.2%, a difference of 0.14%), and Immigrants from Sudan (33.2%, a difference of 0.17%).
| Demographics | Rating | Rank | Births to Unmarried Women |
| Ute | 14.4 /100 | #203 | Poor 33.0% |
| Immigrants | Africa | 14.3 /100 | #204 | Poor 33.0% |
| German Russians | 13.1 /100 | #205 | Poor 33.1% |
| Uruguayans | 12.8 /100 | #206 | Poor 33.1% |
| Immigrants | Sudan | 11.5 /100 | #207 | Poor 33.2% |
| Hawaiians | 11.3 /100 | #208 | Poor 33.2% |
| Whites/Caucasians | 10.7 /100 | #209 | Poor 33.3% |
| Scotch-Irish | 10.7 /100 | #210 | Poor 33.3% |
| Ecuadorians | 10.5 /100 | #211 | Poor 33.3% |
| Celtics | 10.2 /100 | #212 | Poor 33.3% |
| Immigrants | Costa Rica | 9.5 /100 | #213 | Tragic 33.4% |
| Slovaks | 9.3 /100 | #214 | Tragic 33.4% |
| French | 8.7 /100 | #215 | Tragic 33.4% |
| Nepalese | 7.8 /100 | #216 | Tragic 33.5% |
| Spaniards | 7.0 /100 | #217 | Tragic 33.6% |
Demographics Similar to Navajo by Births to Unmarried Women
In terms of births to unmarried women, the demographic groups most similar to Navajo are Pima (51.5%, a difference of 0.040%), Menominee (51.1%, a difference of 0.74%), Inupiat (52.1%, a difference of 1.2%), Hopi (50.8%, a difference of 1.3%), and Tohono O'odham (49.8%, a difference of 3.3%).
| Demographics | Rating | Rank | Births to Unmarried Women |
| Blacks/African Americans | 0.0 /100 | #333 | Tragic 44.3% |
| Yuman | 0.0 /100 | #334 | Tragic 44.4% |
| Colville | 0.0 /100 | #335 | Tragic 45.3% |
| Puerto Ricans | 0.0 /100 | #336 | Tragic 45.7% |
| Houma | 0.0 /100 | #337 | Tragic 46.6% |
| Arapaho | 0.0 /100 | #338 | Tragic 47.1% |
| Lumbee | 0.0 /100 | #339 | Tragic 48.2% |
| Tohono O'odham | 0.0 /100 | #340 | Tragic 49.8% |
| Hopi | 0.0 /100 | #341 | Tragic 50.8% |
| Menominee | 0.0 /100 | #342 | Tragic 51.1% |
| Pima | 0.0 /100 | #343 | Tragic 51.5% |
| Navajo | 0.0 /100 | #344 | Tragic 51.5% |
| Inupiat | 0.0 /100 | #345 | Tragic 52.1% |
| Pueblo | 0.0 /100 | #346 | Tragic 53.7% |
| Yup'ik | 0.0 /100 | #347 | Tragic 56.4% |