Scotch-Irish vs Blackfeet Divorced or Separated
COMPARE
Scotch-Irish
Blackfeet
Divorced or Separated
Divorced or Separated Comparison
Scotch-Irish
Blackfeet
12.9%
DIVORCED OR SEPARATED
0.0/ 100
METRIC RATING
292nd/ 347
METRIC RANK
13.3%
DIVORCED OR SEPARATED
0.0/ 100
METRIC RATING
312th/ 347
METRIC RANK
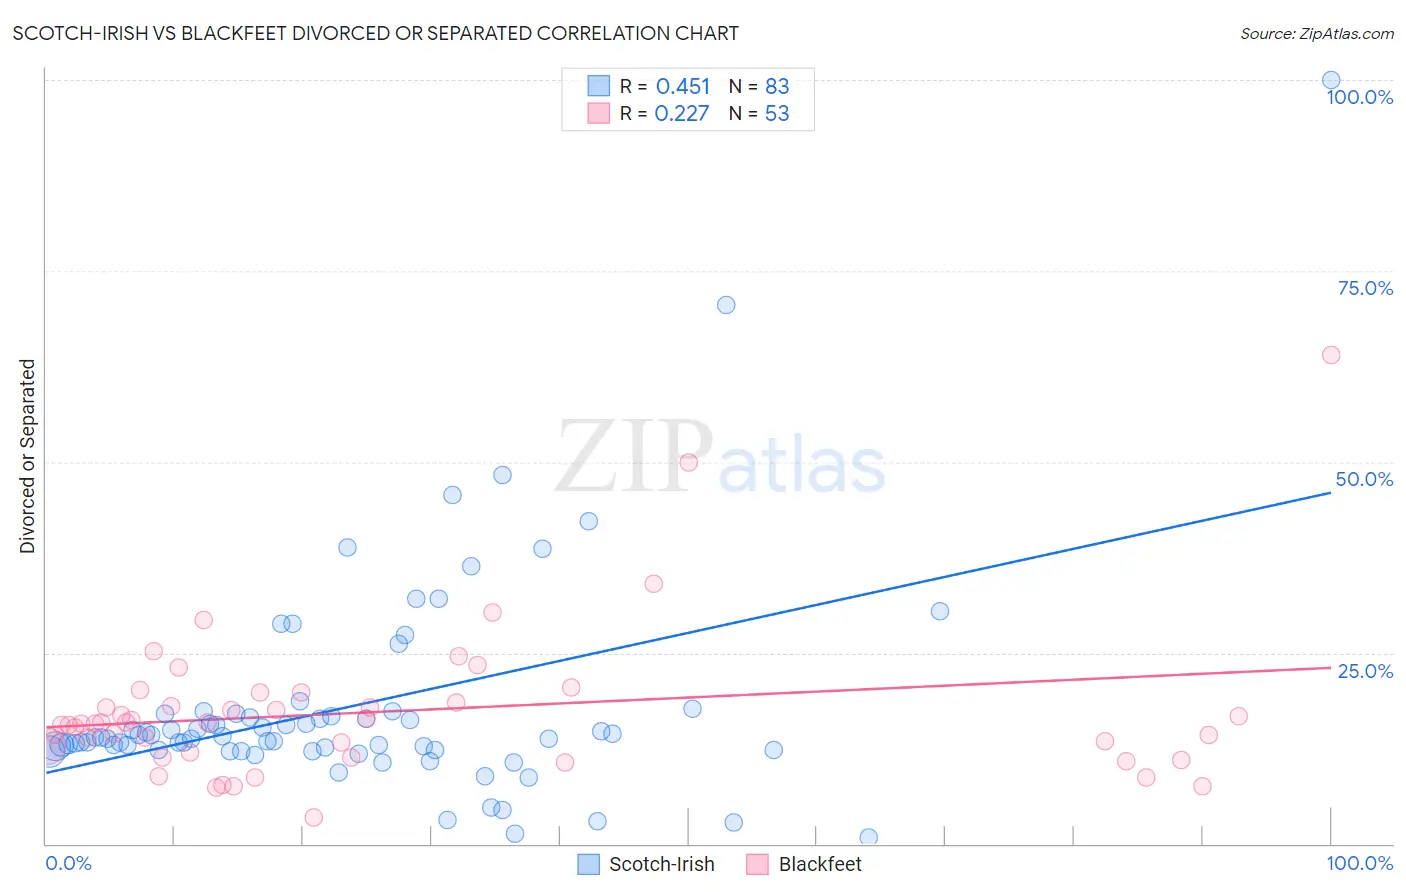
Scotch-Irish vs Blackfeet Divorced or Separated Correlation Chart
The statistical analysis conducted on geographies consisting of 548,485,641 people shows a moderate positive correlation between the proportion of Scotch-Irish and percentage of population currently divorced or separated in the United States with a correlation coefficient (R) of 0.451 and weighted average of 12.9%. Similarly, the statistical analysis conducted on geographies consisting of 309,547,647 people shows a weak positive correlation between the proportion of Blackfeet and percentage of population currently divorced or separated in the United States with a correlation coefficient (R) of 0.227 and weighted average of 13.3%, a difference of 2.9%.
Divorced or Separated Correlation Summary
| Measurement | Scotch-Irish | Blackfeet |
| Minimum | 0.80% | 3.4% |
| Maximum | 100.0% | 64.0% |
| Range | 99.2% | 60.6% |
| Mean | 17.9% | 17.3% |
| Median | 13.9% | 15.7% |
| Interquartile 25% (IQ1) | 12.3% | 11.6% |
| Interquartile 75% (IQ3) | 17.0% | 19.1% |
| Interquartile Range (IQR) | 4.7% | 7.6% |
| Standard Deviation (Sample) | 14.3% | 10.0% |
| Standard Deviation (Population) | 14.2% | 9.9% |
Demographics Similar to Scotch-Irish and Blackfeet by Divorced or Separated
In terms of divorced or separated, the demographic groups most similar to Scotch-Irish are Jamaican (12.9%, a difference of 0.21%), Apache (12.9%, a difference of 0.24%), Celtic (13.0%, a difference of 0.37%), Nicaraguan (13.0%, a difference of 0.78%), and Native/Alaskan (13.0%, a difference of 0.84%). Similarly, the demographic groups most similar to Blackfeet are Sioux (13.2%, a difference of 0.35%), African (13.2%, a difference of 0.37%), American (13.2%, a difference of 0.39%), Ottawa (13.2%, a difference of 0.40%), and French American Indian (13.2%, a difference of 0.49%).
| Demographics | Rating | Rank | Divorced or Separated |
| Scotch-Irish | 0.0 /100 | #292 | Tragic 12.9% |
| Jamaicans | 0.0 /100 | #293 | Tragic 12.9% |
| Apache | 0.0 /100 | #294 | Tragic 12.9% |
| Celtics | 0.0 /100 | #295 | Tragic 13.0% |
| Nicaraguans | 0.0 /100 | #296 | Tragic 13.0% |
| Natives/Alaskans | 0.0 /100 | #297 | Tragic 13.0% |
| Venezuelans | 0.0 /100 | #298 | Tragic 13.0% |
| Immigrants | Jamaica | 0.0 /100 | #299 | Tragic 13.0% |
| Immigrants | Cabo Verde | 0.0 /100 | #300 | Tragic 13.1% |
| Alaskan Athabascans | 0.0 /100 | #301 | Tragic 13.1% |
| Immigrants | Venezuela | 0.0 /100 | #302 | Tragic 13.1% |
| Cape Verdeans | 0.0 /100 | #303 | Tragic 13.1% |
| Hopi | 0.0 /100 | #304 | Tragic 13.2% |
| Chippewa | 0.0 /100 | #305 | Tragic 13.2% |
| Tlingit-Haida | 0.0 /100 | #306 | Tragic 13.2% |
| French American Indians | 0.0 /100 | #307 | Tragic 13.2% |
| Ottawa | 0.0 /100 | #308 | Tragic 13.2% |
| Americans | 0.0 /100 | #309 | Tragic 13.2% |
| Africans | 0.0 /100 | #310 | Tragic 13.2% |
| Sioux | 0.0 /100 | #311 | Tragic 13.2% |
| Blackfeet | 0.0 /100 | #312 | Tragic 13.3% |